
Exploring the Inhibition of Quercetin on Acetylcholinesterase by Multispectroscopic and In Silico Approaches and Evaluation of Its Neuroprotective Effects on PC12 Cells


Abstract
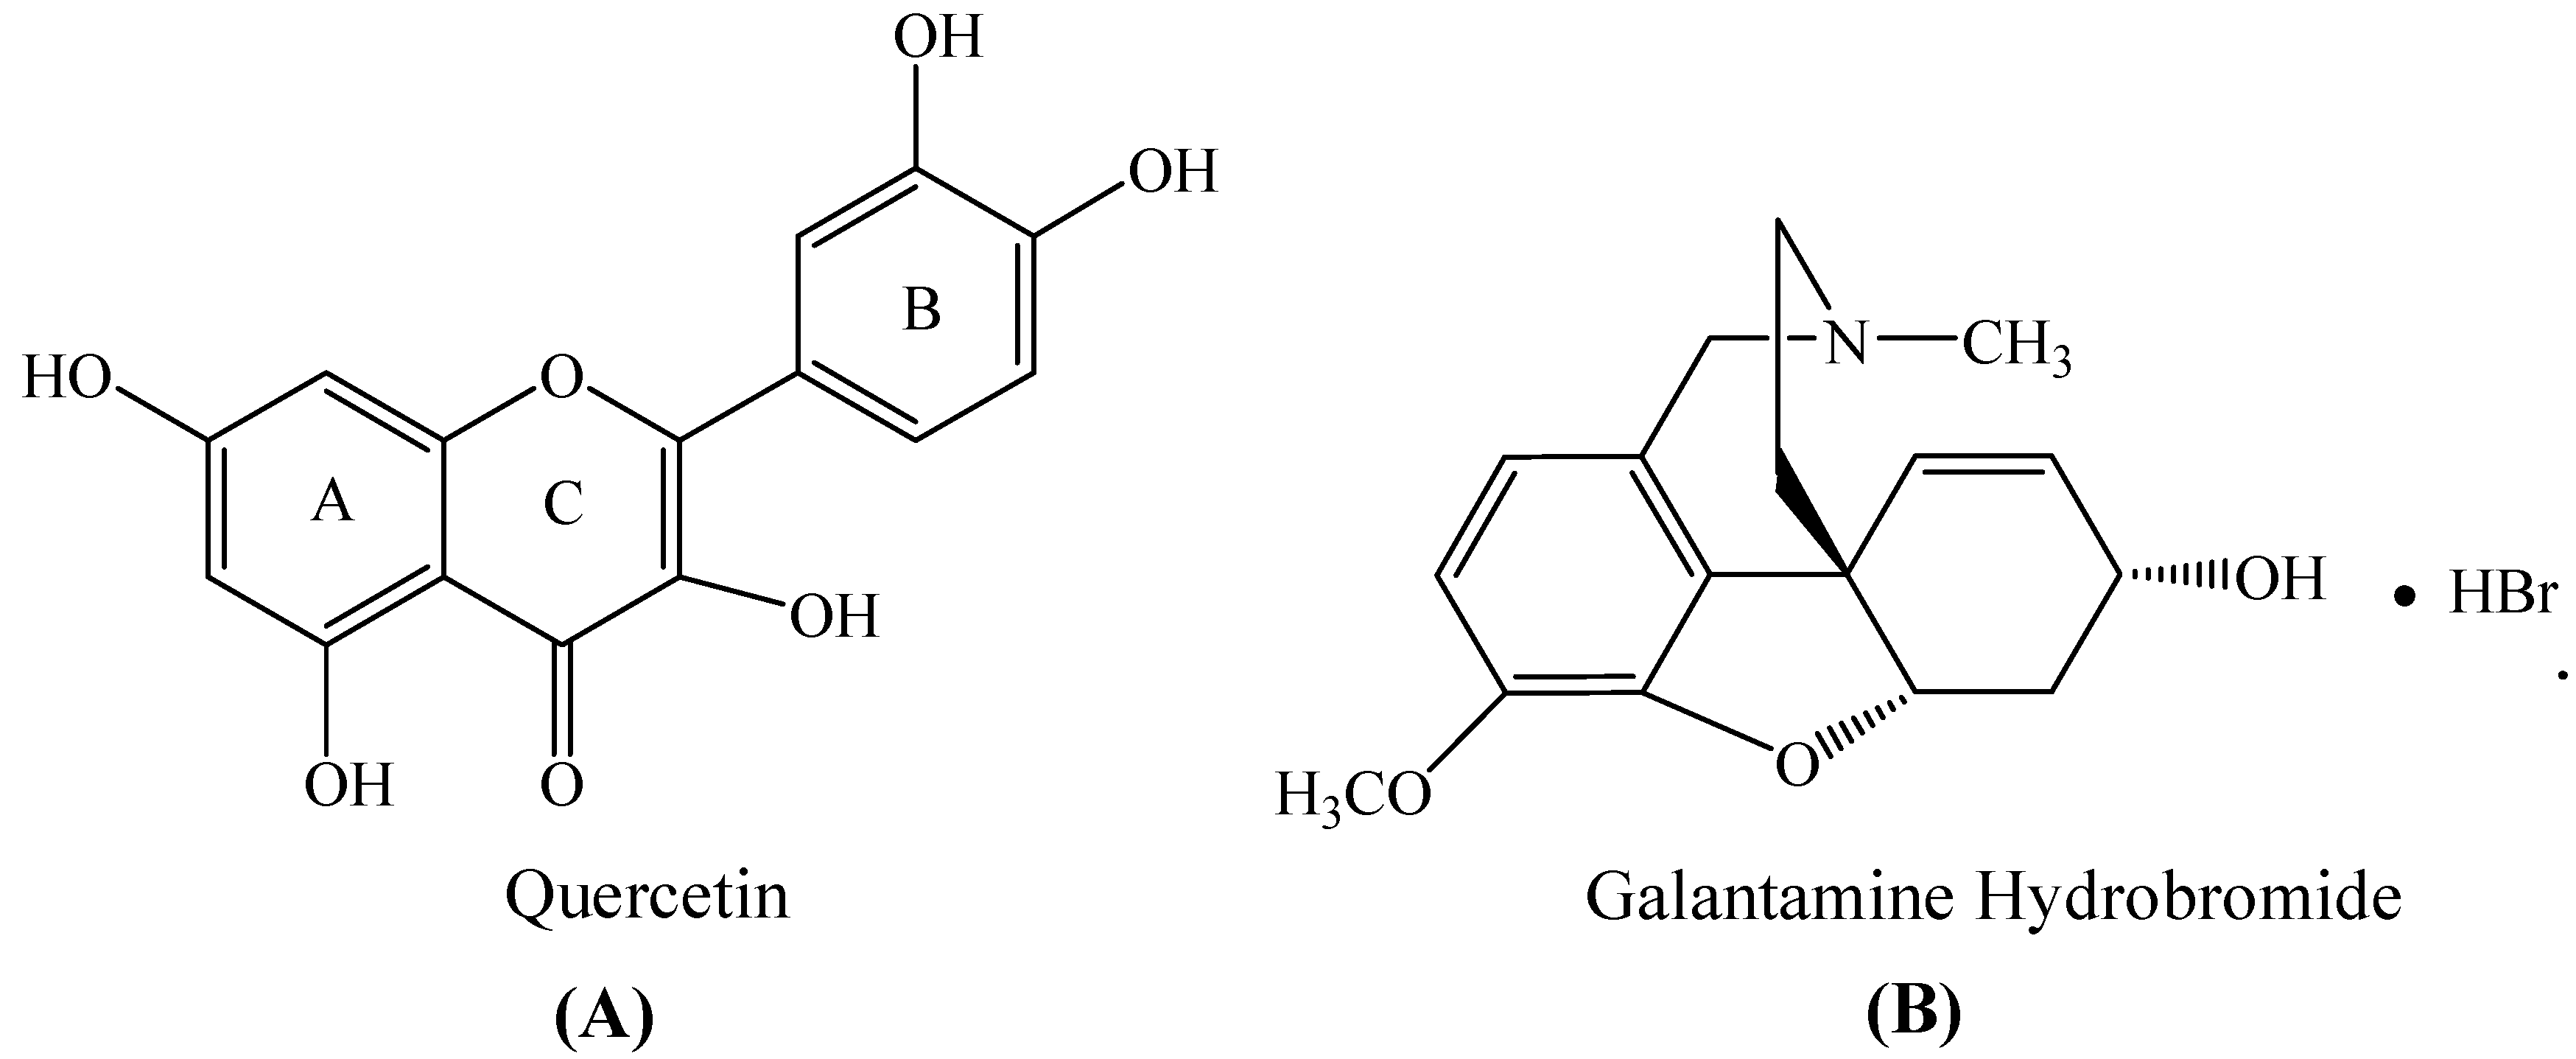
1. Introduction
2. Results and Discussion
2.1. Inhibitory Effect of Quercetin on AChE
2.2. Inhibition Kinetics of Quercetin
2.3. Inactivation Mechanics of Quercetin on AChE
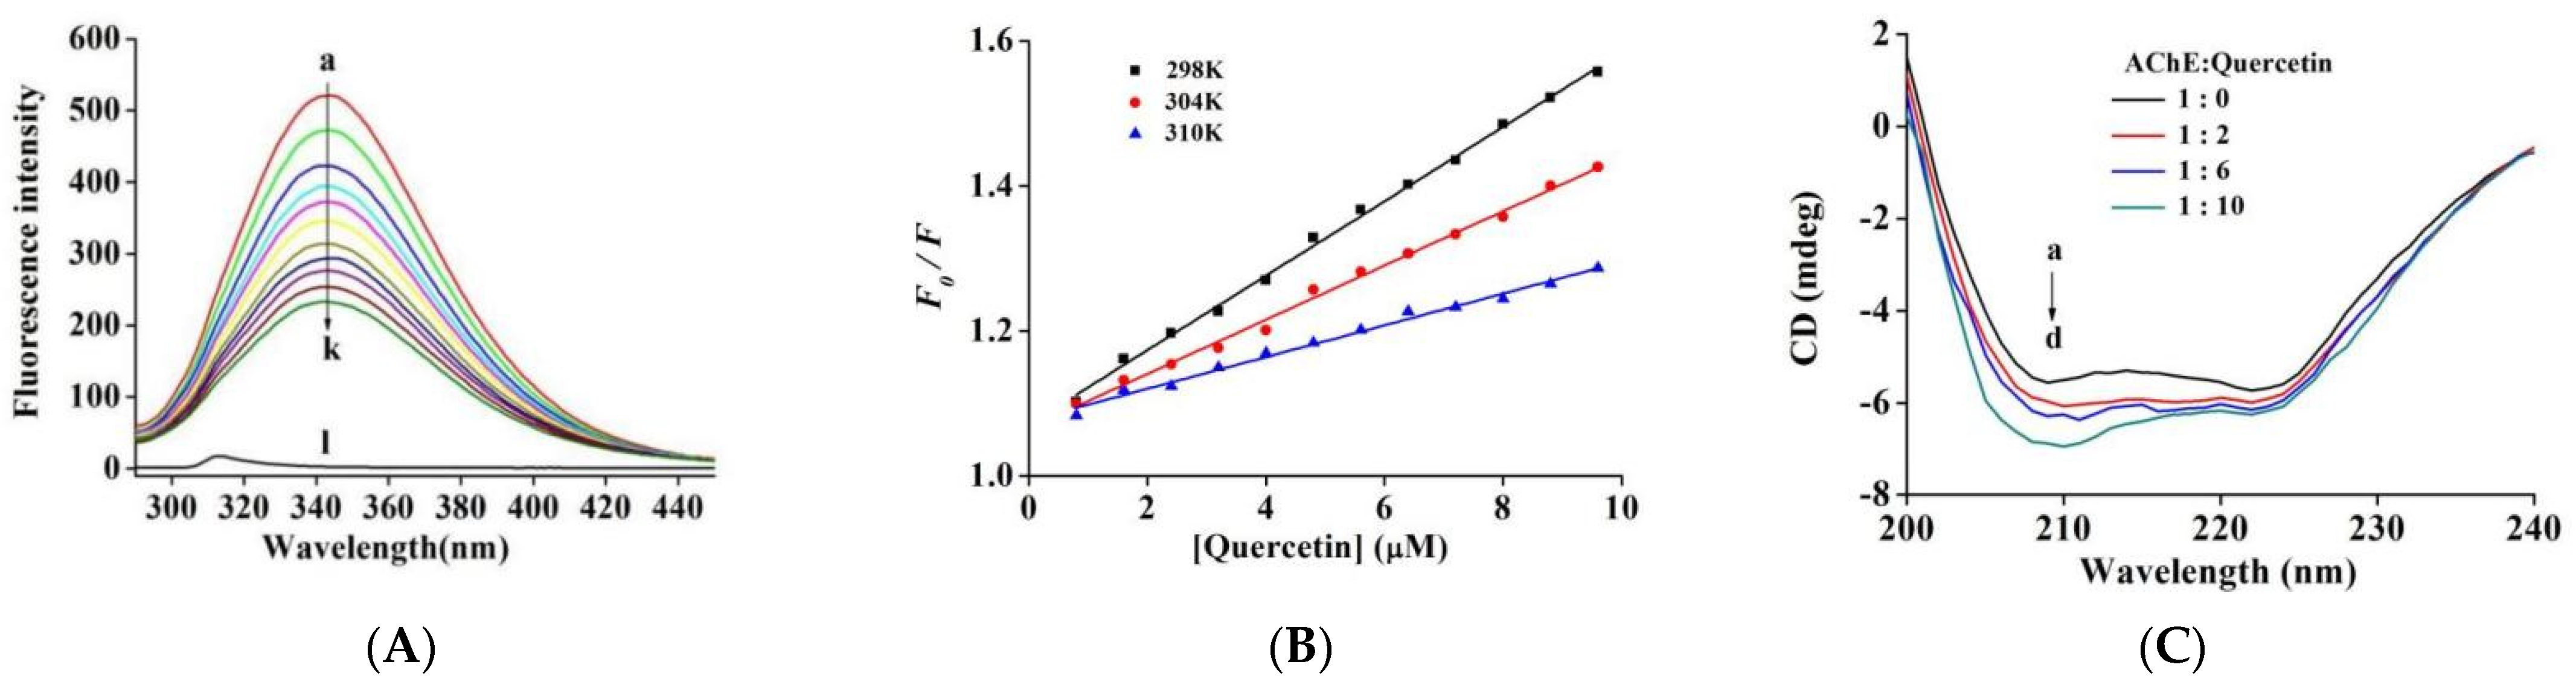
2.4. Fluorescence Quenching of AChE by Quercetin
2.5. CD Spectra
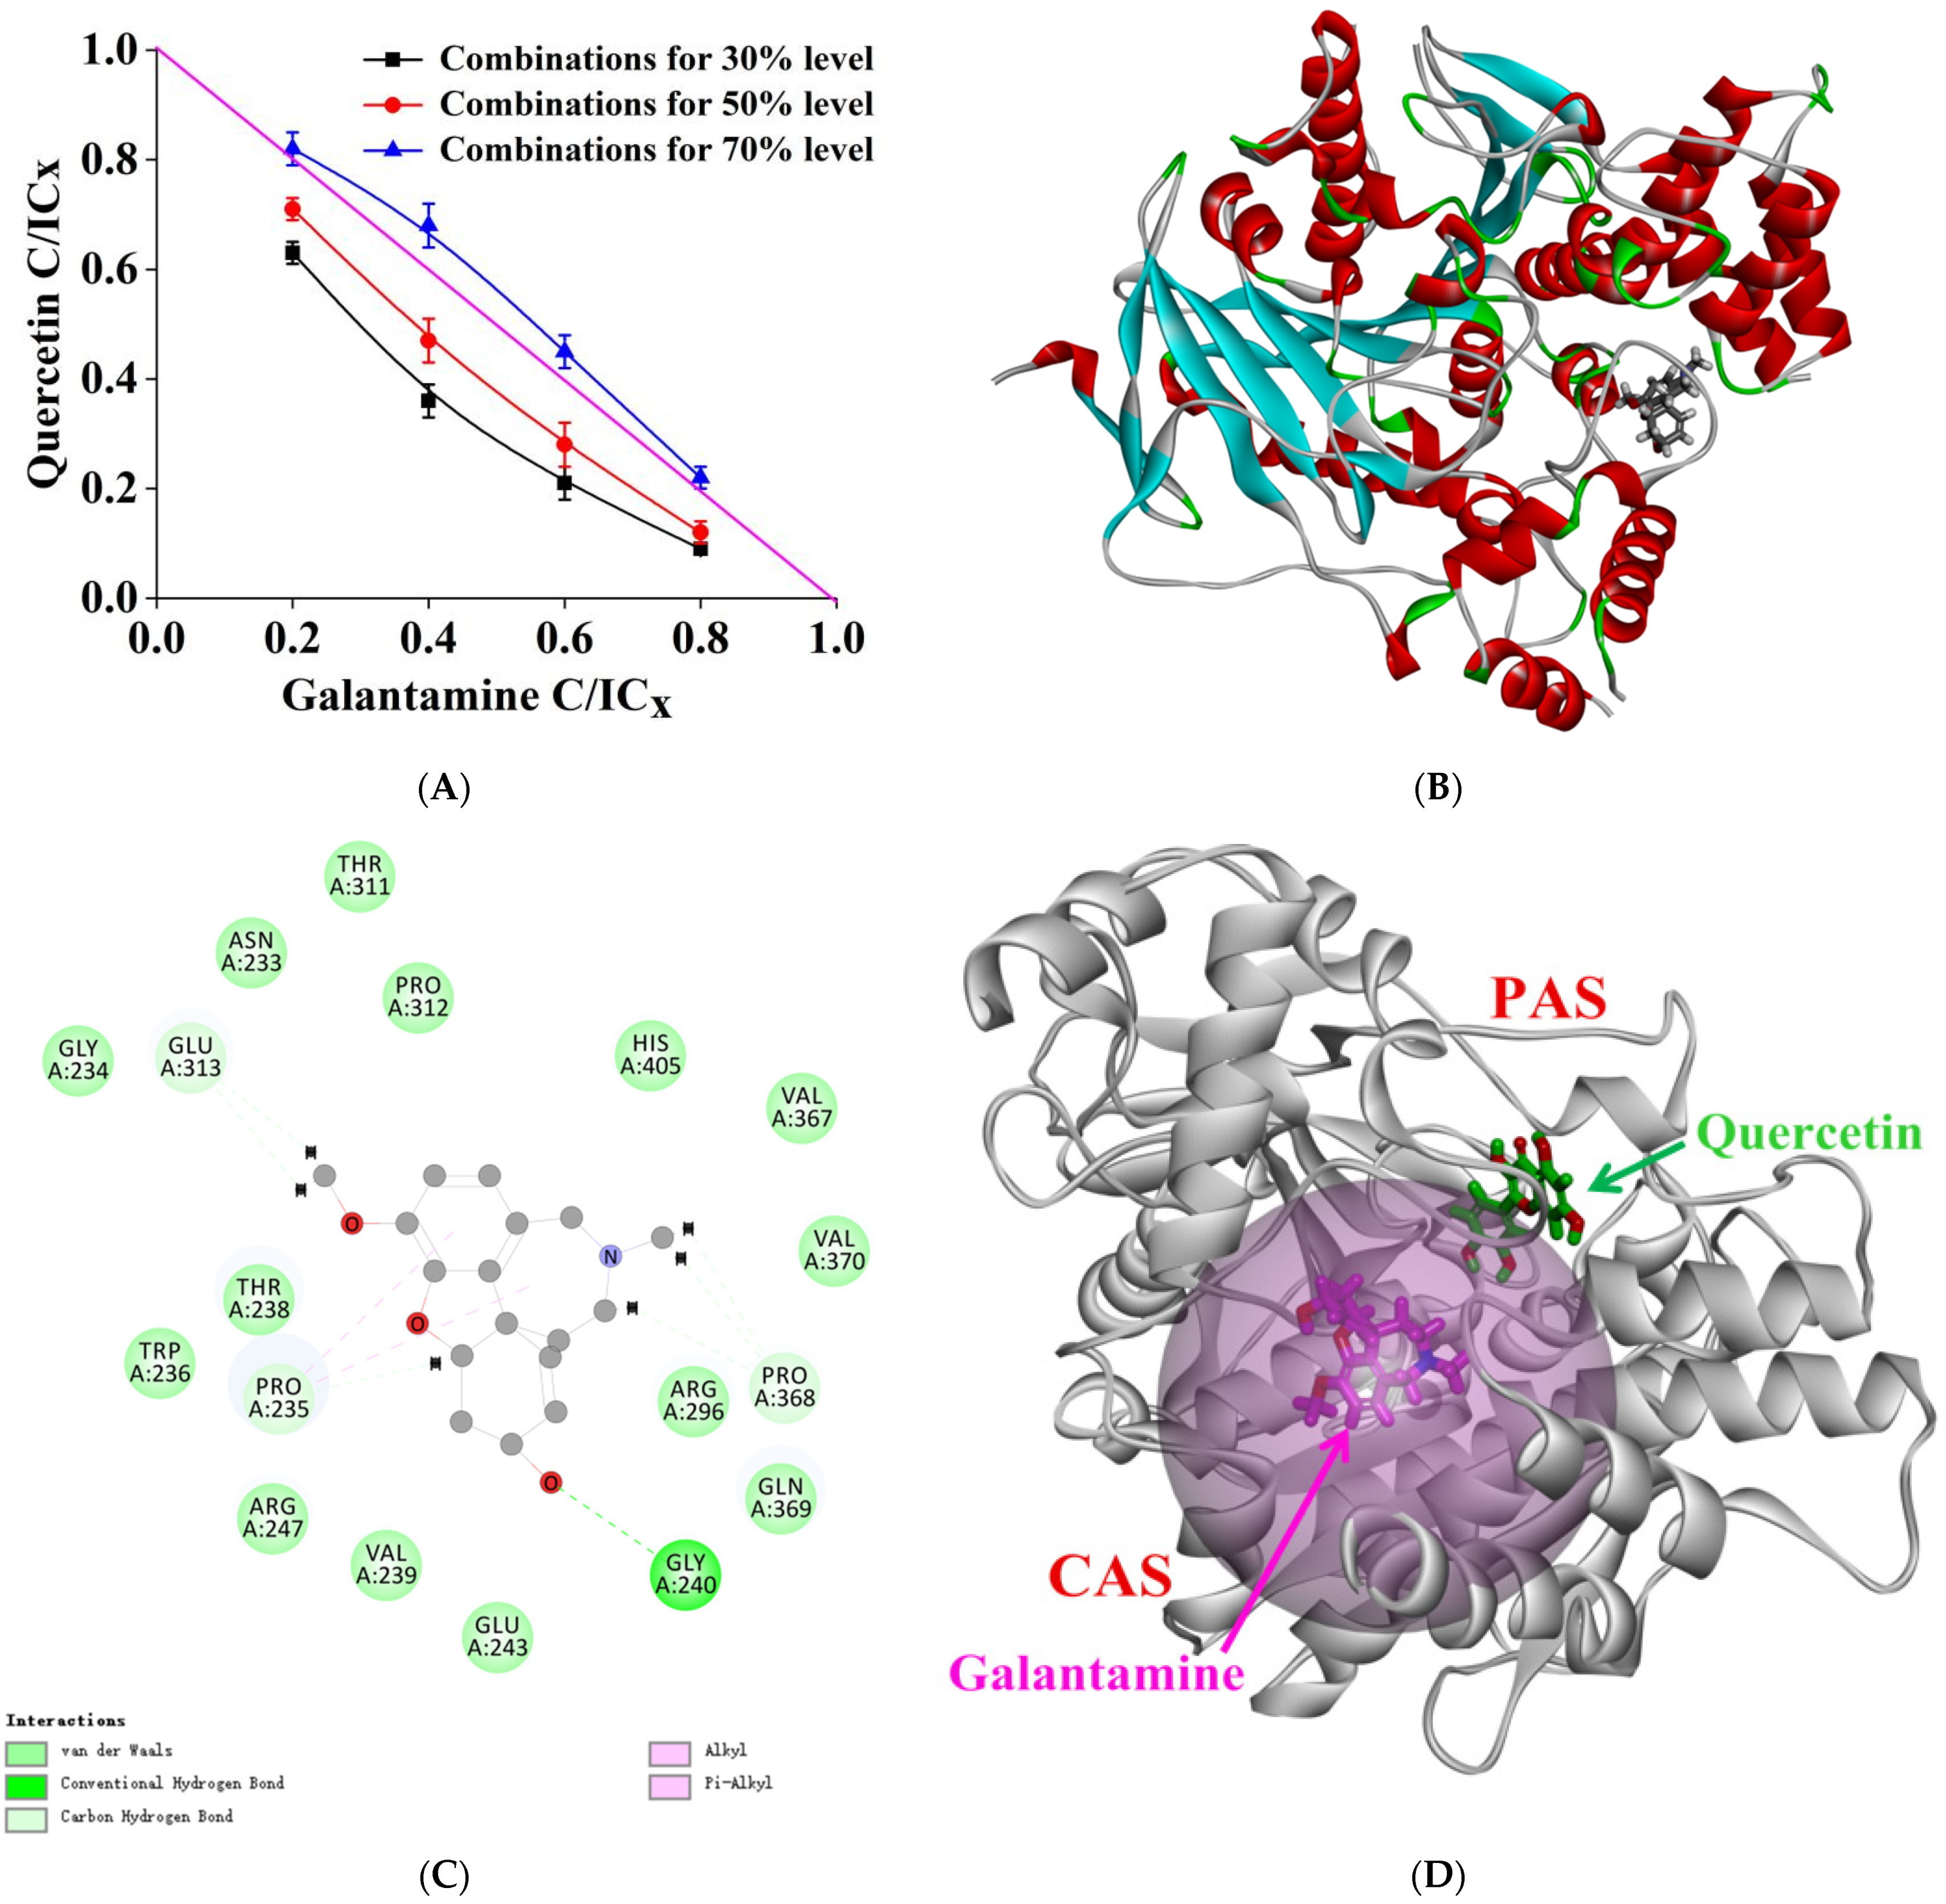
2.6. Molecular Docking
2.7. MD Simulation
2.8. Combined Inhibition Analysis
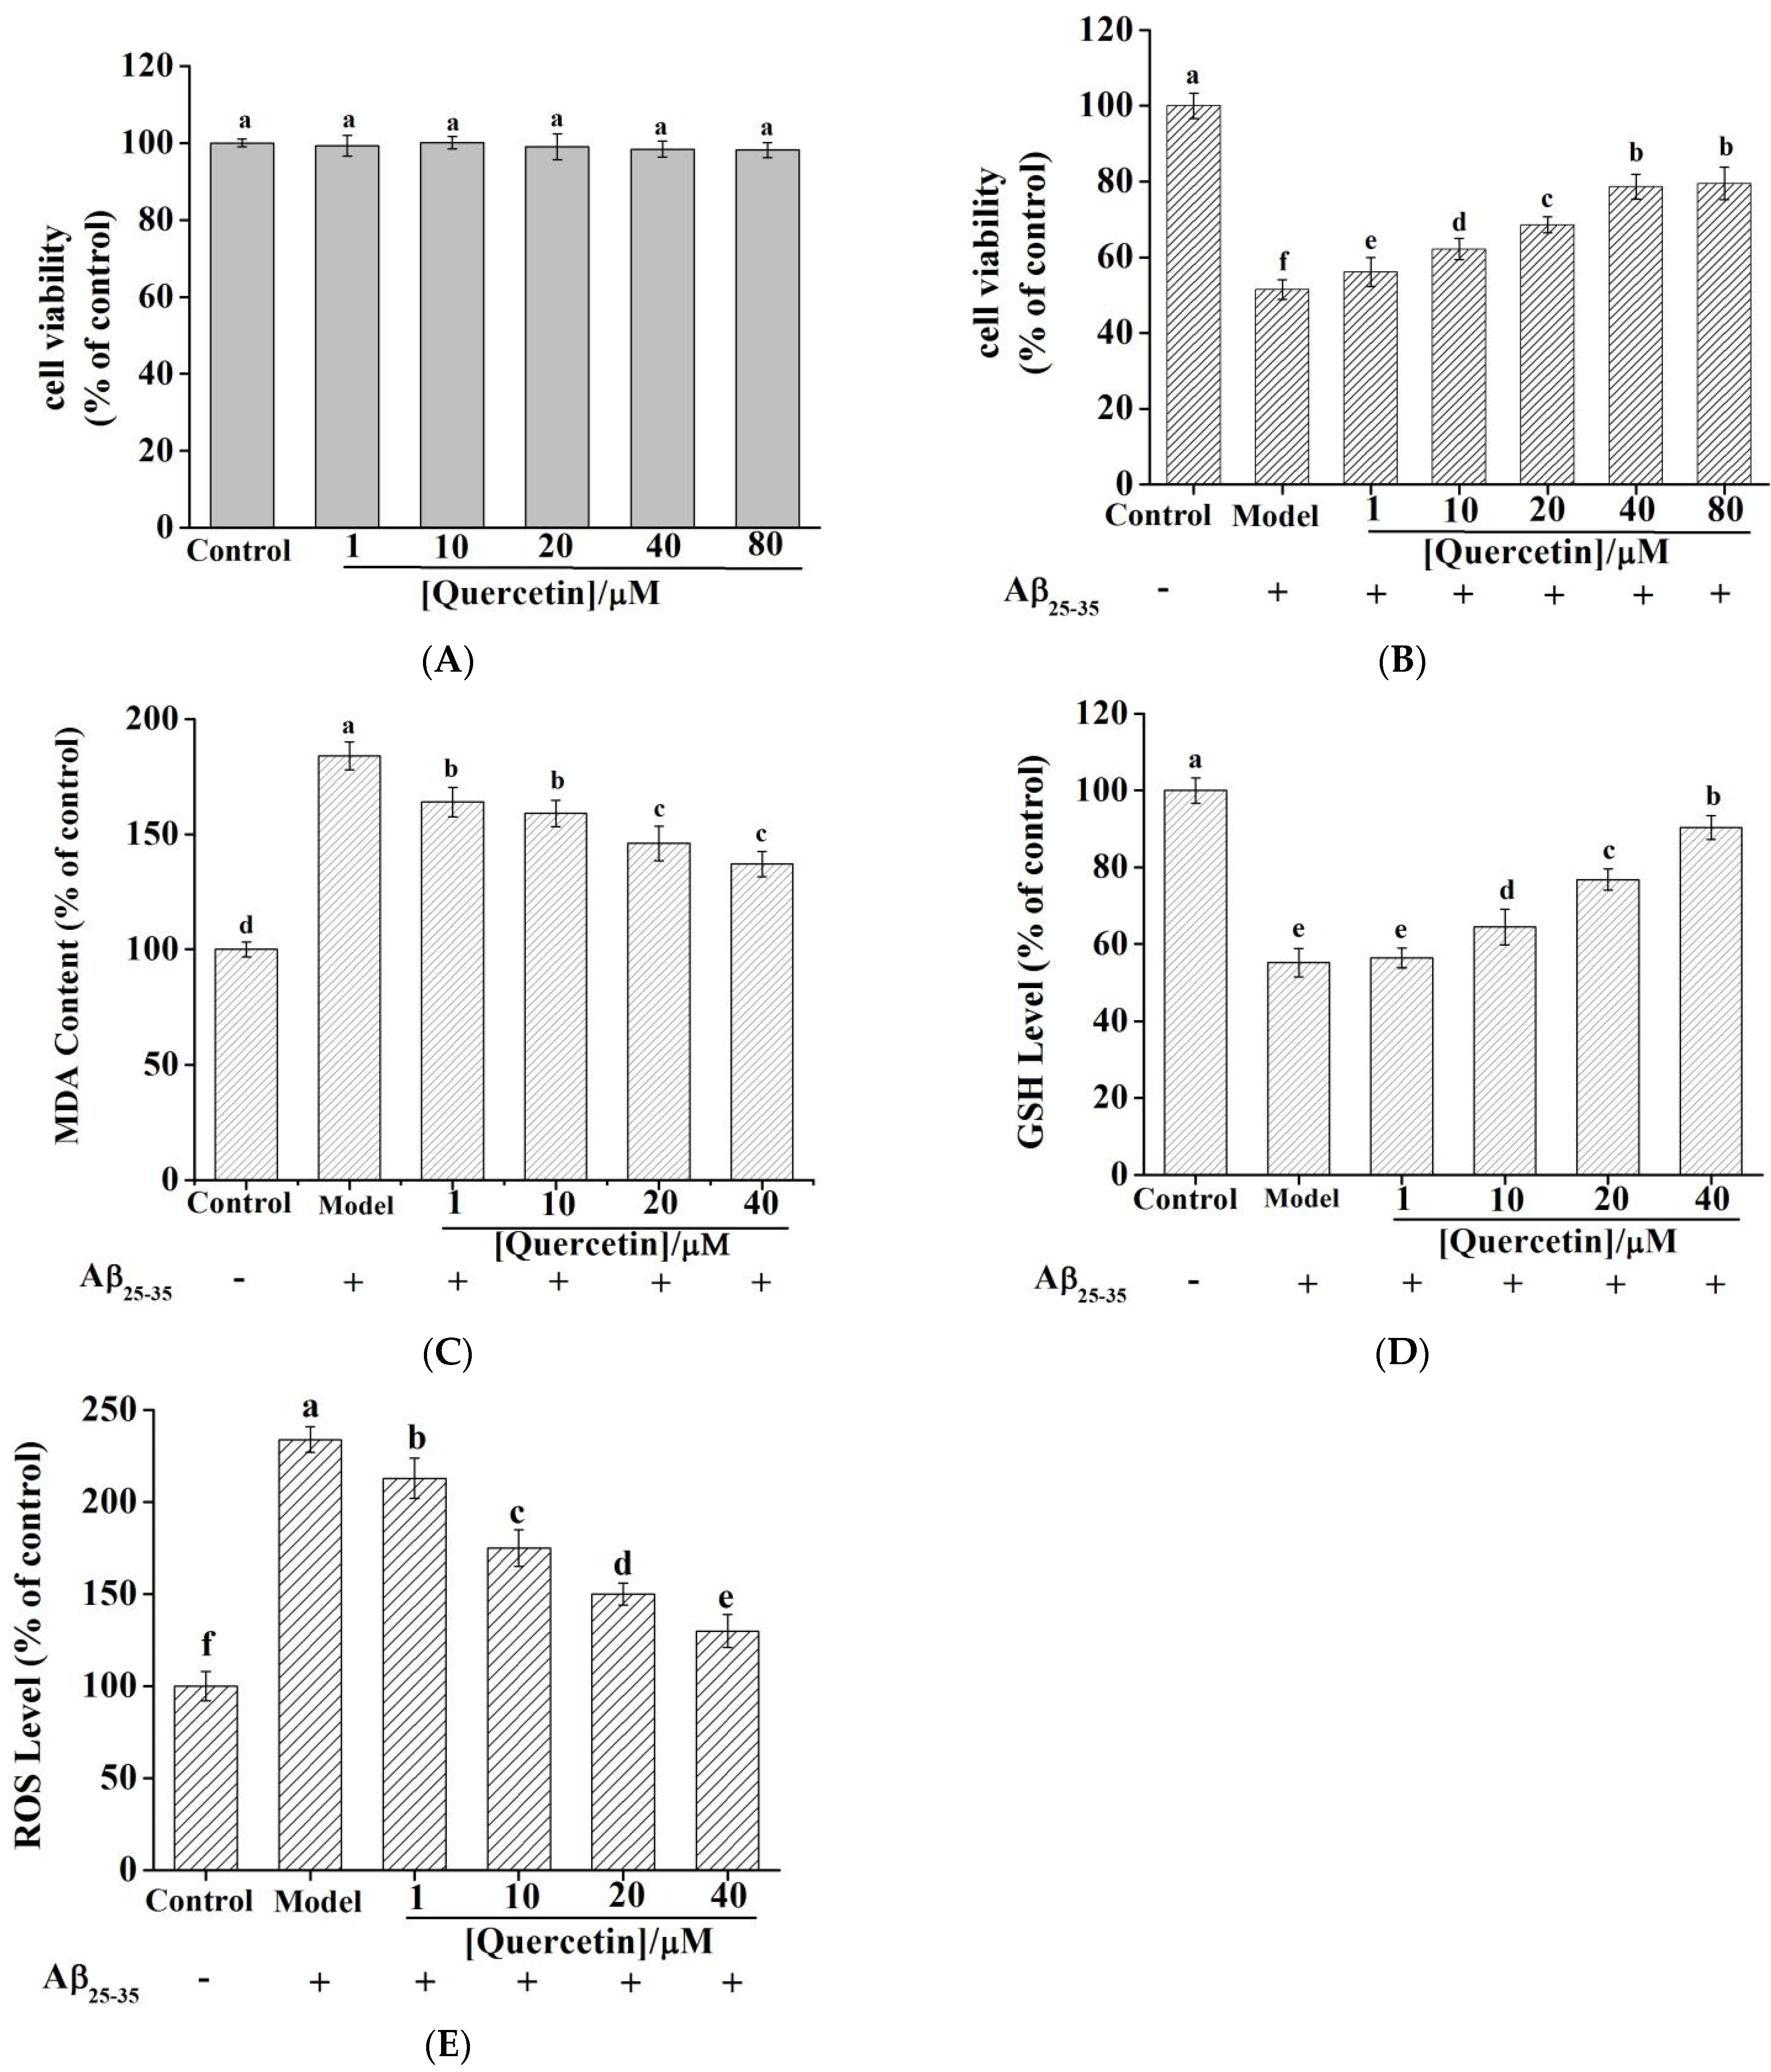
2.9. Quercetin Cytotoxicity in PC12 Cells
2.10. Quercetin Ameliorated Aβ25–35—Induced Toxicity in PC12 Cell
2.11. Quercetin Reduced MDA Content and Increased GSH Levels in PC12 Cells
2.12. Quercetin Reduced ROS Levels in Aβ25–35-Induced PC12 Cells
3. Materials and Methods
3.1. Materials
3.2. AChE Activity Assay
3.3. Inhibitory Type Kinetics Analysis
3.4. Fluorescence Spectrum Measurement
3.5. CD Spectra Measurement
3.6. Molecular Docking
3.7. MD Analysis
3.8. Analysis of Combined Inhibition
3.9. Cell Culture and Treatment
3.10. Quercetin-Induced Toxicity in PC12 Cells
3.11. Role of Quercetin in Aβ25–35-Induced PC12 Cell Viability
3.12. Determination of MDA, GSH, and ROS in PC12 Cells
3.13. Statistical Analysis
4. Conclusions
Supplementary Materials
Author Contributions
Funding
Institutional Review Board Statement
Informed Consent Statement
Data Availability Statement
Conflicts of Interest
References
- Graff-Radford, J.; Yong, K.X.X.; Apostolova, L.G.; Bouwman, F.H.; Carrillo, M.; Dickerson, B.C.; Rabinovici, G.D.; Schott, J.M.; Jones, D.T.; Murray, M.E. New insights into atypical Alzheimer’s disease in the era of biomarkers. Lancet Neurol. 2021, 20, 222–234. [Google Scholar] [CrossRef]
- Gauthier, S.; Rosa-Neto, P.; Morais, J.A.; Webster, C. World Alzheimer Report 2021: Journey through the Diagnosis of Dementia; Alzheimer’s Disease International: London, UK, 2021; Available online: https://www.alzint.org/resource/world-alzheimer-report-2021/ (accessed on 27 December 2021).
- Tiwari, S.; Atluri, V.; Kaushik, A.; Yndart, A.; Nair, M. Alzheimer’s disease: Pathogenesis, diagnostics, and therapeutics. Int. J. Nanomed. 2019, 14, 5541–5554. [Google Scholar] [CrossRef]
- Scheltens, P.; De Strooper, B.; Kivipelto, M.; Holstege, H.; Chételat, G.; Teunissen, C.E.; Cummings, J.; van der Flier, W.M. Alzheimer’s disease. Lancet 2021, 397, 1577–1590. [Google Scholar] [CrossRef]
- Selkoe, J.D. Preventing Alzheimer’s disease. Science 2012, 337, 1488–1492. [Google Scholar] [CrossRef]
- Citron, M. Alzheimer’s disease: Strategies for disease modification. Nat. Rev. Drug Discov. 2010, 9, 387–398. [Google Scholar] [CrossRef]
- Azman, N.A.N.; Alhawarri, M.B.; Rawa, M.S.A.; Dianita, R.; Gazzali, A.M.; Nogawa, T.; Wahab, H.A. Potential anti-acetylcholinesterase activity of Cassia timorensis DC. Molecules 2020, 25, 4545. [Google Scholar] [CrossRef]
- Ramachandran, A.K.; Das, S.; Joseph, A.; Shenoy, G.G.; Alex, A.T.; Mudgal, J. Neurodegenerative pathways in Alzheimer’s disease: A review. Curr. Neuropharmacol. 2021, 19, 679–692. [Google Scholar] [CrossRef]
- Graham, W.V.; Bonito-Oliva, A.; Sakmar, T.P. Update on Alzheimer’s disease therapy and prevention strategies. Annu. Rev. Med. 2017, 68, 413–430. [Google Scholar] [CrossRef]
- Bai, R.; Guo, J.; Ye, X.Y.; Xie, Y.; Xie, T. Oxidative stress: The core pathogenesis and mechanism of Alzheimer’s disease. Ageing Res. Rev. 2022, 77, 101619. [Google Scholar] [CrossRef]
- Pandey, S.N.; Rangra, N.K.; Singh, S.; Arora, S.; Gupta, V. Evolving role of natural products from traditional medicinal herbs in the treatment of Alzheimer’s disease. ACS Chem. Neurosci. 2021, 12, 2718–2728. [Google Scholar] [CrossRef]
- Ayaz, M.; Sadiq, A.; Junaid, M.; Ullah, F.; Ovais, M.; Ullah, I.; Ahmed, J.; Shahid, M. Flavonoids as prospective neuroprotectants and their therapeutic propensity in aging associated neurological disorders. Front. Aging Neurosci. 2019, 11, 155. [Google Scholar] [CrossRef]
- Limwachiranon, J.; Huang, H.; Shi, Z.H.; Li, L.; Luo, Z.S. Lotus flavonoids and phenolic acids: Health promotion and safe consumption dosages. Compr. Rev. Food Sci. Food Saf. 2018, 17, 458–471. [Google Scholar] [CrossRef]
- Lai, W.F.; Wong, W.T. Design and optimization of quercetin-based functional foods. Crit Rev. Food Sci. Nutr. 2021, 62, 7319–7335. [Google Scholar] [CrossRef]
- Zang, X.; Cheng, M.; Zhang, X.; Chen, X. Quercetin nanoformulations: A promising strategy for tumor therapy. Food Funct. 2021, 12, 6664–6681. [Google Scholar] [CrossRef]
- Sabogal-Guaqueta, A.M.; Munoz-Manco, J.I.; Ramirez-Pineda, J.R.; Lamprea-Rodriguez, M.; Osorio, E.; Cardona-Gomez, G.P. The flavonoid quercetin ameliorates Alzheimer’s disease pathology and protects cognitive and emotional function in aged triple transgenic Alzheimer’s disease model mice. Neuropharmacology 2015, 93, 134–145. [Google Scholar] [CrossRef]
- Park, D.J.; Kang, J.B.; Shah, F.A.; Jin, Y.B.; Koh, P.O. Quercetin attenuates decrease of thioredoxin expression following focal cerebral ischemia and glutamate-induced neuronal cell damage. Neuroscience 2020, 428, 38–49. [Google Scholar] [CrossRef]
- Ansari, M.A.; Abdul, H.M.; Joshi, G.; Opii, W.O.; Butterfield, D.A. Protective effect of quercetin in primary neurons against Aβ(1-42): Relevance to Alzheimer’s disease. J. Nutr. Biochem. 2009, 20, 269–275. [Google Scholar] [CrossRef]
- Khan, H.; Ullah, H.; Aschner, M.; Cheang, W.S.; Akkol, E.K. Neuroprotective effects of quercetin in Alzheimer’s disease. Biomolecules 2020, 10, 59. [Google Scholar] [CrossRef]
- Choi, R.C.; Zhu, J.T.; Yung, A.W.; Lee, P.S.; Xu, S.L.; Guo, A.J.; Zhu, K.Y.; Dong, T.T.; Tsim, K.W. Synergistic action of flavonoids, baicalein, and daidzein in estrogenic and neuroprotective effects: A development of potential health products and therapeutic drugs against Alzheimer’s disease. Evid. Based Complement. Altern. Med. 2013, 2013, 635694. [Google Scholar] [CrossRef]
- Abdel-Diam, M.M.; Samak, D.H.; El-Sayed, Y.S.; Aleya, L.; Alarifi, S.; Alkahtani, S. Curcumin and quercetin synergistically attenuate subacute diazinon-induced inflammation and oxidative neurohepatic damage, and acetylcholinesterase inhibition in albino rats. Environ. Sci. Pollut. Res. 2019, 26, 3659–3665. [Google Scholar] [CrossRef]
- Ni, M.T.; Hu, X.; Gong, D.M.; Zhang, G.W. Inhibitory mechanism of vitexin on α-glucosidase and its synergy with acarbose. Food Hydrocoll. 2020, 105, 105824. [Google Scholar] [CrossRef]
- Li, S.; Hu, X.; Pan, J.H.; Gong, D.M.; Zhang, G.W. Mechanistic insights into the inhibition of pancreatic lipase by apigenin: Inhibitory interaction, conformational change and molecular docking studies. J. Mol. Liq. 2021, 335, 116505. [Google Scholar] [CrossRef]
- Marucci, G.; Buccioni, M.; Ben, D.D.; Lambertucci, C.; Volpini, R.; Amenta, F. Efficacy of acetylcholinesterase inhibitors in Alzheimer’s disease. Neuropharmacology 2021, 190, 108352. [Google Scholar] [CrossRef]
- Ding, H.F.; Wu, X.Q.; Pan, J.H.; Hu, X.; Gong, D.M.; Zhang, G.W. New insights into the inhibition mechanism of betulinic acid on α-glucosidase. J. Agric. Food Chem. 2018, 66, 7065–7075. [Google Scholar] [CrossRef]
- Al-Shabib, N.A.; Khan, J.M.; Malik, A.; Alsenaidy, M.A.; Rehman, M.T.; AlAjmi, M.F.; Alsenaidy, A.M.; Husain, F.M.; Khan, R.H. Molecular insight into binding behavior of polyphenol (rutin) with beta lactoglobulin: Spectroscopic, molecular docking and MD simulation studies. J. Mol. Liq. 2018, 269, 511–520. [Google Scholar] [CrossRef]
- Jung, M.; Park, M. Acetylcholinesterase inhibition by flavonoids from Agrimonia pilosa. Molecules 2007, 12, 2130–2139. [Google Scholar] [CrossRef]
- Khan, M.T.H.; Orhan, I.; Senol, F.S.; Kartal, M.; Sener, B.; Dvorská, M.; Smejkal, K.; Slapetová, T. Cholinesterase inhibitory activities of some flavonoid derivatives and chosen xanthone and their molecular docking studies. Chem.-Biol. Interact. 2009, 181, 383–389. [Google Scholar] [CrossRef]
- Nyambe-Silavwe, H.; Villa-Rodriguez, J.A.; Ifie, I.; Holmes, M.; Aydin, E.; Jensen, J.M.; Williamson, G. Inhibition of human α-amylase by dietary polyphenols. J. Funct. Foods 2015, 19, 723–732. [Google Scholar] [CrossRef]
- Kuppusamy, A.; Arumugam, M.; George, S. Combining in silico and in vitro approaches to evaluate the acetylcholinesterase inhibitory profile of some commercially available flavonoids in the management of Alzheimer’s disease. Int. J. Biol. Macromol. 2017, 95, 199–203. [Google Scholar] [CrossRef]
- Ganeshpurkar, A.; Saluja, A.K. The pharmacological potential of rutin. Saudi. Pharm. J. 2017, 25, 149–164. [Google Scholar] [CrossRef]
- Xie, Y.; Yang, W.; Chen, X.; Xiao, J. Inhibition of flavonoids on acetylcholine esterase: Binding and structure-activity relationship. Food Funct. 2014, 5, 2582–2589. [Google Scholar] [CrossRef] [PubMed]
- Cao, H.; Liu, X.; Ulrih, N.P.; Sengupta, P.K.; Xiao, J. Plasma protein binding of dietary polyphenols to human serum albumin: A high performance affinity chromatography approach. Food Chem. 2019, 270, 257–263. [Google Scholar] [CrossRef] [PubMed]
- Wu, X.Q.; Ding, H.F.; Hu, X.; Pan, J.H.; Liao, Y.J.; Gong, D.M.; Zhang, G.W. Exploring inhibitory mechanism of gallocatechin gallate on a-amylase and a-glucosidase relevant to postprandial hyperglycemia. J. Funct. Foods 2018, 48, 200–209. [Google Scholar] [CrossRef]
- Zeng, N.; Zhang, G.W.; Hu, X.; Pan, J.H.; Zhou, Z.S.; Gong, D.M. Inhibition mechanism of baicalein and baicalin on xanthine oxidase and their synergistic effect with allopurinol. J. Funct. Foods 2018, 50, 172–182. [Google Scholar] [CrossRef]
- Zhu, M.; Pan, J.H.; Hu, X.; Zhang, G.W. Epicatechin gallate as xanthine oxidase inhibitor: Inhibitory kinetics, binding characteristics, synergistic inhibition, and action mechanism. Foods 2021, 10, 2191. [Google Scholar] [CrossRef]
- Huang, Y.; Wu, P.; Ying, J.; Dong, Z.; Chen, X.D. Mechanistic study on inhibition of porcine pancreatic alpha-amylase using the flavonoids from dandelion. Food Chem. 2021, 344, 128610. [Google Scholar] [CrossRef]
- Wu, C.-S.C.; Gan, L.; Yang, J.T. Conformation similarities of the globular and tailed forms of acetylcholinesterase from Torpedo californica. Biochim. Biophys. Acta 1987, 911, 25–36. [Google Scholar] [CrossRef]
- Manavalan, P.; Taylor, P.; Johnson, W.C., Jr. Circular dichroism studies of acetylcholinesterase conformation. Comparison of the 11 S and 5.6 S species and the differences induced by inhibitory ligands. Biochim. Biophys. Acta 1985, 829, 365–370. [Google Scholar] [CrossRef]
- Fu, X.; Belwal, T.; He, Y.; Xu, Y.; Li, L.; Luo, Z.S. Interaction and binding mechanism of cyanidin-3-O-glucoside to ovalbumin in varying pH conditions: A spectroscopic and molecular docking study. Food Chem. 2020, 320, 126616. [Google Scholar] [CrossRef]
- Sussman, J.L.; Harel, M.; Frolow, F.; Oefner, C.; Goldman, A.; Toker, L.; Silman, I. Atomic structure of acetyicholinesterase from Torpedo californica: A prototypic acetyicholine-binding protein. Science 1991, 253, 872–879. [Google Scholar] [CrossRef]
- Cheung, J.; Rudolph, M.J.; Burshteyn, F.; Cassidy, M.S.; Gary, E.N.; Love, J.; Franklin, M.C.; Height, J.J. Structures of human acetylcholinesterase in complex with pharmacologically important ligands. J. Med. Chem. 2012, 55, 10282–10286. [Google Scholar] [CrossRef] [PubMed]
- Eckroat, T.J.; Manross, D.L.; Cowan, S.C. Merged tacrine-based, multitarget-directed acetylcholinesterase inhibitors 2015-present: Synthesis and biological activity. Int. J. Mol. Sci. 2020, 21, 5965. [Google Scholar] [CrossRef] [PubMed]
- Islam, M.R.; Zaman, A.; Jahan, I.; Chakravorty, R.; Chakraborty, S. In silico QSAR analysis of quercetin reveals its potential as therapeutic drug for Alzheimer’s disease. J. Young Pharm. 2013, 5, 173–179. [Google Scholar] [CrossRef] [PubMed]
- Kryger, G.; Harel, M.; Giles, K.; Toker, L.; Velan, B.; Lazar, A.; Kronman, C.; Barak, D.; Ariel, N.; Shafferman, A.; et al. Structures of recombinant native and E202Q mutant human acetylcholinesterase complexed with the snake-venom toxin fasciculin-II. Acta Crystallogr. D 2000, 56, 1385–1394. [Google Scholar] [CrossRef]
- Liao, Y.J.; Hu, X.; Pan, J.H.; Zhang, G.W. Inhibitory mechanism of baicalein on acetylcholinesterase: Inhibitory interaction, conformational change, and computational simulation. Foods 2022, 11, 168. [Google Scholar] [CrossRef]
- Bolognesi, M.L.; Andrisano, V.; Bartolini, M.; Banzi, R.; Melchiorre, C. Propidium-based polyamine ligands as potent inhibitors of acetylcholinesterase and acetylcholinesterase-induced amyloid-β aggregation. J. Med. Chem. 2005, 48, 24–27. [Google Scholar] [CrossRef]
- Shaik, J.B.; Kandrakonda, Y.R.; Kallubai, M.; Gajula, N.N.; Dubey, S.; Aramati, B.M.R.; Subramanyam, R.; Amooru, G.D. Deciphering the AChE-binding mechanism with multifunctional tricyclic coumarin anti-Alzheimer’s agents using biophysical and bioinformatics approaches and evaluation of their modulating effect on Amyloidogenic peptide assembly. Int. J. Biol. Macromol. 2021, 193 Pt B, 1409–1420. [Google Scholar] [CrossRef]
- Song, X.; Ni, M.T.; Zhang, Y.; Zhang, G.W.; Pan, J.H.; Gong, D.M. Comparing the inhibitory abilities of epigallocatechin-3-gallate and gallocatechin gallate against tyrosinase and their combined effects with kojic acid. Food Chem. 2021, 349, 129172. [Google Scholar] [CrossRef] [PubMed]
- Shamsi, A.; Shahwan, M.; Khan, M.S.; Husain, F.M.; Alhumaydhi, F.A.; Aljohani, A.S.M.; Rehman, M.T.; Hassan, M.I.; Islam, A. Elucidating the interaction of human ferritin with quercetin and naringenin: Implication of natural products in neurodegenerative diseases: Molecular docking and dynamics simulation insight. ACS Omega 2021, 6, 7922–7930. [Google Scholar] [CrossRef]
- Pitchai, A.; Rajaretinam, R.K.; Mani, R.; Nagarajan, N. Molecular interaction of human acetylcholinesterase with trans-tephrostachin and derivatives for Alzheimer’s disease. Heliyon 2020, 6, e04930. [Google Scholar] [CrossRef]
- Yang, Y.W.; Tsai, C.W.; Mong, M.C.; Yin, M.C. Maslinic acid protected PC12 cells differentiated by nerve growth factor against β-amyloid-induced Apoptosis. J. Agric. Food Chem. 2015, 63, 10243–10249. [Google Scholar] [CrossRef] [PubMed]
- Heo, H.J.; Lee, C.Y. Protective effects of quercetin and vitamin C against oxidative stress-induced neurodegeneration. J. Agric. Food Chem. 2004, 52, 7514–7517. [Google Scholar] [CrossRef] [PubMed]
- Liu, X.; Xu, K.; Yan, M.; Wang, Y.; Zheng, X. Protective effects of galantamine against Aβ -induced PC12 cell apoptosis by preventing mitochondrial dysfunction and endoplasmic reticulum stress. Neurochem. Int. 2010, 57, 588–599. [Google Scholar] [CrossRef] [PubMed]
- Yan, X.; Chen, T.; Zhang, L.; Du, H. Protective effects of Forsythoside A on amyloid beta-induced apoptosis in PC12 cells by downregulating acetylcholinesterase. Eur. J. Pharmacol. 2017, 810, 141–148. [Google Scholar] [CrossRef] [PubMed]
- Xian, Y.F.; Ip, S.P.; Mao, Q.Q.; Lin, Z.X. Neuroprotective effects of honokiol against beta-amyloid-induced neurotoxicity via GSK-3β and β-catenin signaling pathway in PC12 cells. Neurochem. Int. 2016, 97, 8–14. [Google Scholar] [CrossRef] [PubMed]
- Cheignon, C.; Tomas, M.; Bonnefont-Rousselot, D.; Faller, P.; Hureau, C.; Collin, F. Oxidative stress and the amyloid beta peptide in Alzheimer’s disease. Redox Biol. 2018, 14, 450–464. [Google Scholar] [CrossRef] [PubMed]
- Zeng, Z.; Xu, J.; Zheng, W. Artemisinin protects PC12 cells against beta-amyloid-induced apoptosis through activation of the ERK1/2 signaling pathway. Redox Biol. 2017, 12, 625–633. [Google Scholar] [CrossRef] [PubMed]
- Jiang, S.; Zhao, Y.; Zhang, T.; Lan, J.; Yang, J.; Yuan, L.; Zhang, Q.; Pan, K.; Zhang, K. Galantamine inhibits β-amyloid- induced cytostatic autophagy in PC12 cells through decreasing ROS production. Cell Prolif. 2018, 51, e12427. [Google Scholar] [CrossRef]
- Ellman, G.L.; Courtney, K.D.; Andres, V.J.; Featherstone, J.M. A new and rapid colorimetric determination of acetylcholinesterase activity. Biochem. Pharmacol. 1961, 7, 88–95. [Google Scholar] [CrossRef]
- Chou, T.C. Theoretical basis, experimental design, and computerized simulation of synergism and antagonism in drug combination studies. Pharmacol. Rev. 2006, 58, 621–681. [Google Scholar] [CrossRef] [PubMed]


| Quercetin (µM) | Inactivation Rate Constant 1 (×10−4 s−1) | Transition Free Energy Change 2 (kJ mol−1 s−1) |
|---|---|---|
| k | ||
| 1.5 | 4.18 ± 0.06 d | 19.28 |
| 3.0 | 5.73 ± 0.03 c | 18.49 |
| 6.0 | 6.04 ± 0.08 b | 18.36 |
| 15.0 | 6.41 ± 0.05 a | 18.22 |
| T (°C) | KSV (×104 L mol−1) | R a | Ka (×104 L mol−1) | R b | n | ∆H° (kJ mol−1) | ∆G° (kJ mol−1) | ∆S° (J mol−1 K−1) |
|---|---|---|---|---|---|---|---|---|
| 25 | 6.21 ± 0.08 a | 0.9983 | 5.52 ± 0.05 a | 0.9976 | 0.75 ± 0.04 | −63.39 ± 0.07 | −27.09 ± 0.03 | -121.8 ± 0.06 |
| 31 | 4.81 ± 0.06 b | 0.9968 | 3.52 ± 0.03 b | 0.9983 | 0.69 ± 0.01 | −26.37 ± 0.05 | ||
| 37 | 3.33 ± 0.05 c | 0.9979 | 2.05 ± 0.02 c | 0.9975 | 0.67 ± 0.03 | −25.64 ± 0.07 |
| Molar Ratio (Quercetin):(AChE) | α-Helix (%) | β-Sheet (%) | β-Turn (%) | Random Coil (%) |
|---|---|---|---|---|
| 0:1 | 34.35 ± 0.74 d | 18.62 ± 0.06 a | 19.18 ± 0.28 d | 28.02 ± 0.65 a |
| 2:1 | 37.13 ± 0.16 c | 17.31 ± 0.09 b | 20.15 ± 0.24 c | 25.41 ± 0.34 b |
| 6:1 | 38..47 ± 0.21 b | 16.20 ± 0.17 c | 21.62 ± 0.13 b | 23.71± 0.28 c |
| 10:1 | 41.51 ± 0.28 a | 15.16 ± 0.14 d | 23.14 ± 0.32 a | 20.19 ± 0.37 d |
Publisher’s Note: MDPI stays neutral with regard to jurisdictional claims in published maps and institutional affiliations. |
© 2022 by the authors. Licensee MDPI, Basel, Switzerland. This article is an open access article distributed under the terms and conditions of the Creative Commons Attribution (CC BY) license (https://creativecommons.org/licenses/by/4.0/).
Share and Cite
Liao, Y.; Mai, X.; Wu, X.; Hu, X.; Luo, X.; Zhang, G. Exploring the Inhibition of Quercetin on Acetylcholinesterase by Multispectroscopic and In Silico Approaches and Evaluation of Its Neuroprotective Effects on PC12 Cells. Molecules 2022, 27, 7971. https://doi.org/10.3390/molecules27227971
Liao Y, Mai X, Wu X, Hu X, Luo X, Zhang G. Exploring the Inhibition of Quercetin on Acetylcholinesterase by Multispectroscopic and In Silico Approaches and Evaluation of Its Neuroprotective Effects on PC12 Cells. Molecules. 2022; 27(22):7971. https://doi.org/10.3390/molecules27227971
Chicago/Turabian StyleLiao, Yijing, Xi Mai, Xiaqing Wu, Xing Hu, Xiaoqiao Luo, and Guowen Zhang. 2022. "Exploring the Inhibition of Quercetin on Acetylcholinesterase by Multispectroscopic and In Silico Approaches and Evaluation of Its Neuroprotective Effects on PC12 Cells" Molecules 27, no. 22: 7971. https://doi.org/10.3390/molecules27227971
APA StyleLiao, Y., Mai, X., Wu, X., Hu, X., Luo, X., & Zhang, G. (2022). Exploring the Inhibition of Quercetin on Acetylcholinesterase by Multispectroscopic and In Silico Approaches and Evaluation of Its Neuroprotective Effects on PC12 Cells. Molecules, 27(22), 7971. https://doi.org/10.3390/molecules27227971