Article

Honeysuckle Berry (Lonicera caerulea L.) Inhibits Lipase Activity and Modulates the Gut Microbiota in High-Fat Diet-Fed Mice

1
Department of Food Science and Biotechnology, Gachon University, Seongnam-si 13120, Gyeonggi-do, Korea
2
Department of Food and Nutrition, Gachon University, Seongnam-si 13120, Gyeonggi-do, Korea
3
Institute for Aging and Clinical Nutrition Research, Gachon University, Seongnam-si 13120, Gyeonggi-do, Korea
*
Authors to whom correspondence should be addressed.
Molecules 2022, 27(15), 4731; https://doi.org/10.3390/molecules27154731
Submission received: 15 June 2022 / Revised: 20 July 2022 / Accepted: 22 July 2022 / Published: 24 July 2022
(This article belongs to the Special Issue Natural Polyphenols and Human Health)

Abstract

:
Honeysuckle berry (HB, Lonicera caerulea L.) is an oriental herbal medicine reported to have beneficial effects on metabolic disorders, such as obesity and non-alcoholic fatty liver disease. The fruit part of HB is rich in anthocyanin, a type of polyphenol. Most studies credit the antioxidant and anti-inflammatory properties of HB as the mechanisms of its effectiveness. This study investigated the inhibitory effects of HB on lipase using an in vitro assay and the modulatory effect of HB on gut microbiota in high-fat diet (HFD)-fed mice. HB inhibited pancreatic lipase activity with IC50 values of approximately 0.47 mg/mL. The fecal triglyceride (TG) levels were higher from the HFD of the HB-fed mice than they were for the control mice. Moreover, the fecal microbiota from the HFD of the HB-fed mice had relatively lower Firmicutes and higher Bacteroidetes than that from the HFD-only mice. These results suggest that HB modulates gut microbiota composition, which may contribute to body fat reduction. Hence, HB could present a useful agent for treating metabolic diseases through lower TG uptake and the regulation of gut microflora.

1. Introduction

Obesity is caused by the overconsumption of food and insufficient energy expenditure, and the prevalence of obesity is increasing worldwide [1,2]. Obesity is closely associated with non-communicable diseases, such as cardiovascular disease, type 2 diabetes, and cancer [3,4,5,6]. Lipid accumulation caused by obesity affects fat mass and adipocyte size. The enlarged adipocyte size (hypertrophy) and increased number of adipocytes (hyperplasia) are features of obese adipose tissue [7]. Adipogenesis, lipogenesis, lipid oxidation, and thermogenesis are well-known mechanisms for lipid accumulation [8].
Lipid metabolism is essential for controlling obesity, but there is another mechanism of obesity treatment from a different perspective. One way to reduce the extra energy that is synthesized as body fat is to interfere with the digestion of fat or make it difficult for its absorption in the small intestine [9].
Orlistat (tetrahydrolipstatin, or its commercial name, Xenical) is the best-known pancreatic lipase inhibitor currently used to treat obesity [9,10]. Orlistat is derived from Streptomyces toxitricini and blocks the absorption of lipids to inhibit lipid accumulation as described above [11]. On the other hand, side effects, such as gastrointestinal disorders and the inhibition of absorption of fat-soluble vitamins, have recently been reported [12]. In addition, orlistat is sold as a prescription drug in Korea and other countries. The development of natural substances, such as lipase inhibitors and lipid absorption inhibitors, is required to treat and prevent obesity safely [13].
Dysbiosis causes systemic inflammation that is associated with a higher risk of obesity [14]. The gut microbiota can be classified into harmful bacteria, which are potential pathogens, and beneficial bacteria [15]. Despite the controversial opinions, most studies have found that the gut microbiota of obese humans and mice have a relatively higher level of Firmicutes/Bacteroidetes ratio compared to their normal-weight counterparts [16].
Honeysuckle berry (HB, Lonicera caerulea L.) is used as a traditional medicine because of its antioxidant and anti-inflammatory properties [17,18,19]. HB has an ameliorating effect on metabolic diseases, such as non-alcoholic fatty liver disease and type 2 diabetes [20,21]. Our previous study reported that HB has anti-sarcopenic obesity effects by reducing body weight and increasing muscle mass in high-fat diet (HFD)-fed mice [22], and we hypothesized that HB regulates the aberrant gut microbiota due to an HFD as a follow-up idea. To the best of the authors’ knowledge, there have been few studies on obesity due to lipase inhibiting activity and the modulation of the gut microbiota, even though many studies have examined the antioxidant and anti-inflammatory effects of HB. Therefore, this study examined whether HB has preventive effects on obesity by inhibiting pancreatic lipase activity and the modulation effect on the gut microbiota in HFD-fed obese-induced mice.

2. Results

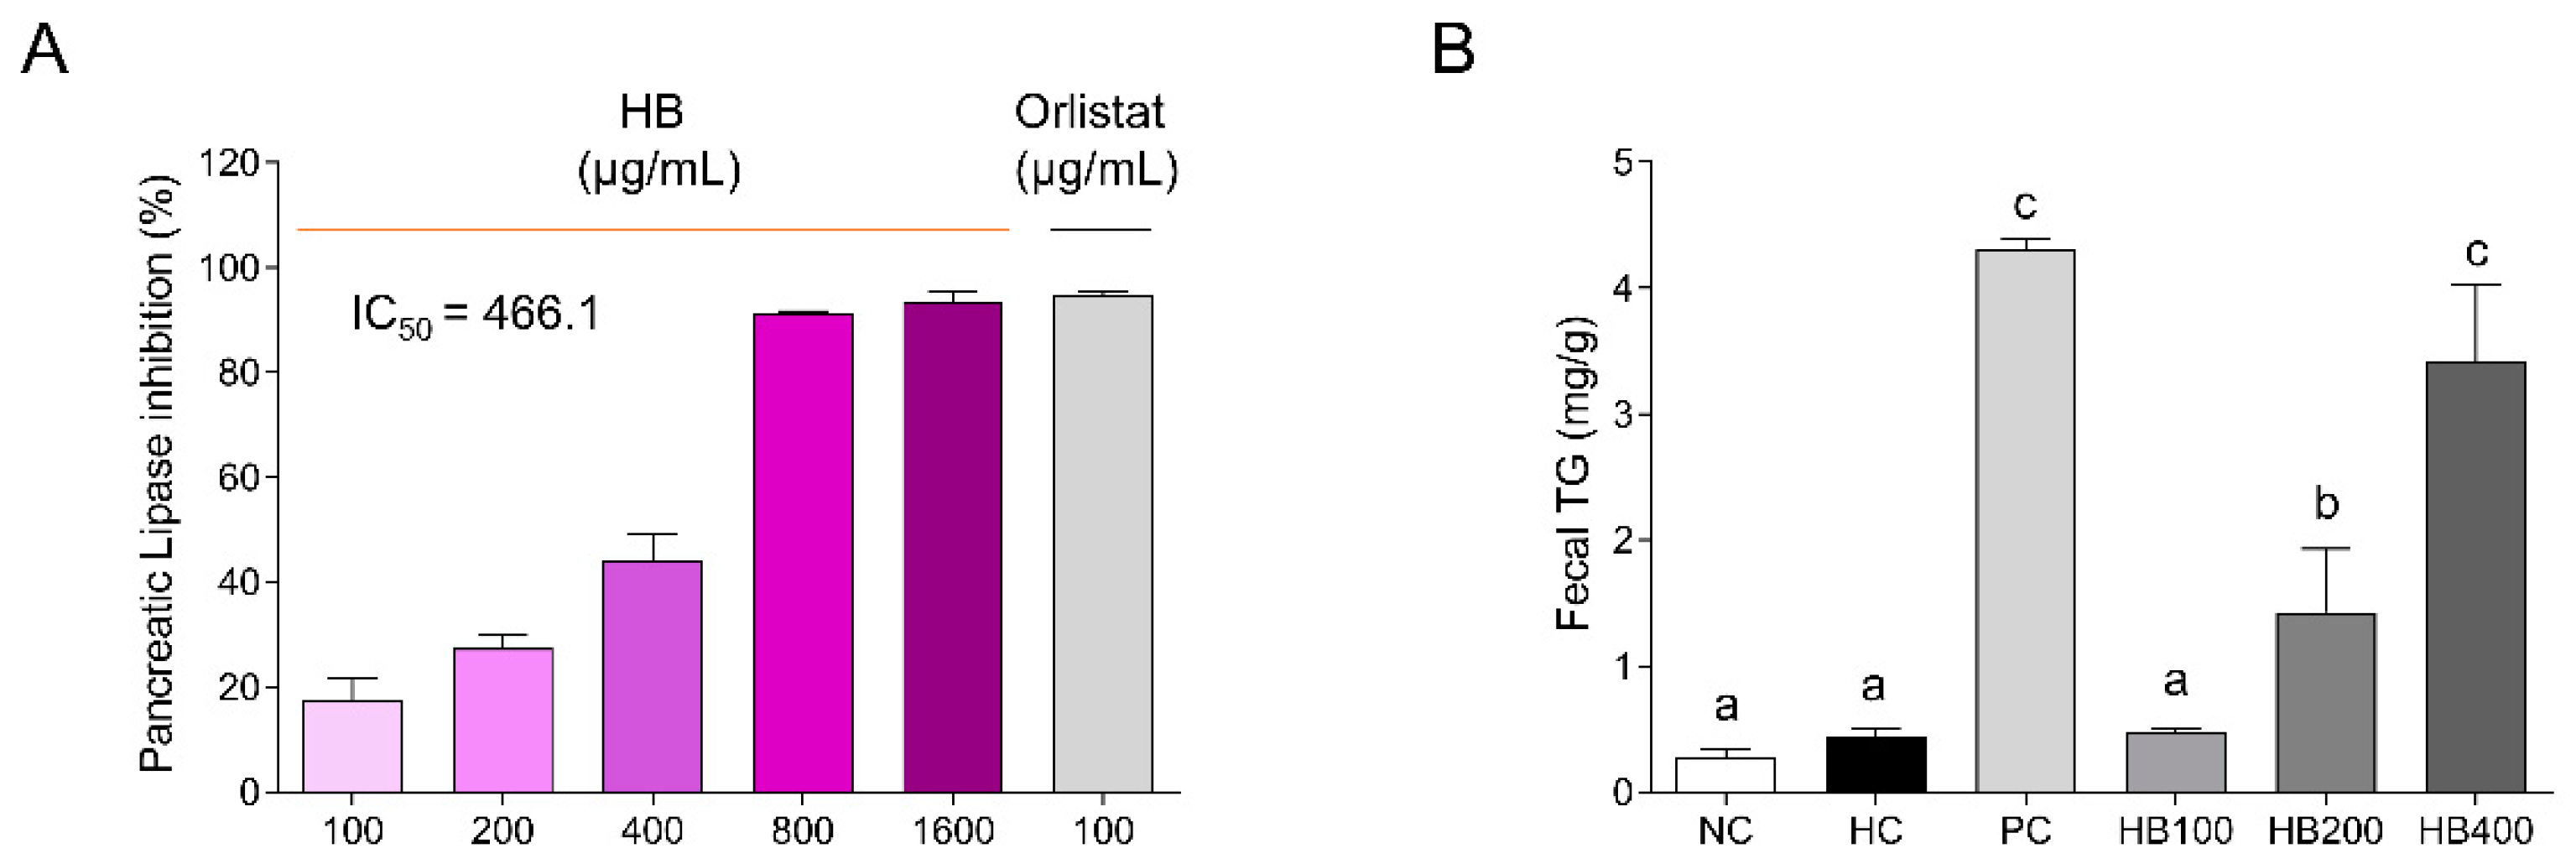
2.1. Effects of HB on Pancreatic Lipase Inhibition and TG Contents in the Feces

To examine the inhibitory effect of HB on lipase activity, a pancreatic lipase inhibition assay was carried out. When the effect of HB was examined at different concentrations, HB inhibited lipase activity in a concentration-dependent manner (Figure 1A). HB, at 800 μg/mL, had the same inhibitory effect as the positive control orlistat, with an IC50 value for the inhibition of pancreatic lipase activity of approximately 466 μg/mL. Consistent with these findings, the fecal TG levels in HB groups increased significantly in a concentration-dependent manner. (Figure 1B). The HB group with the highest concentration produced an almost identical outcome to the PC group.

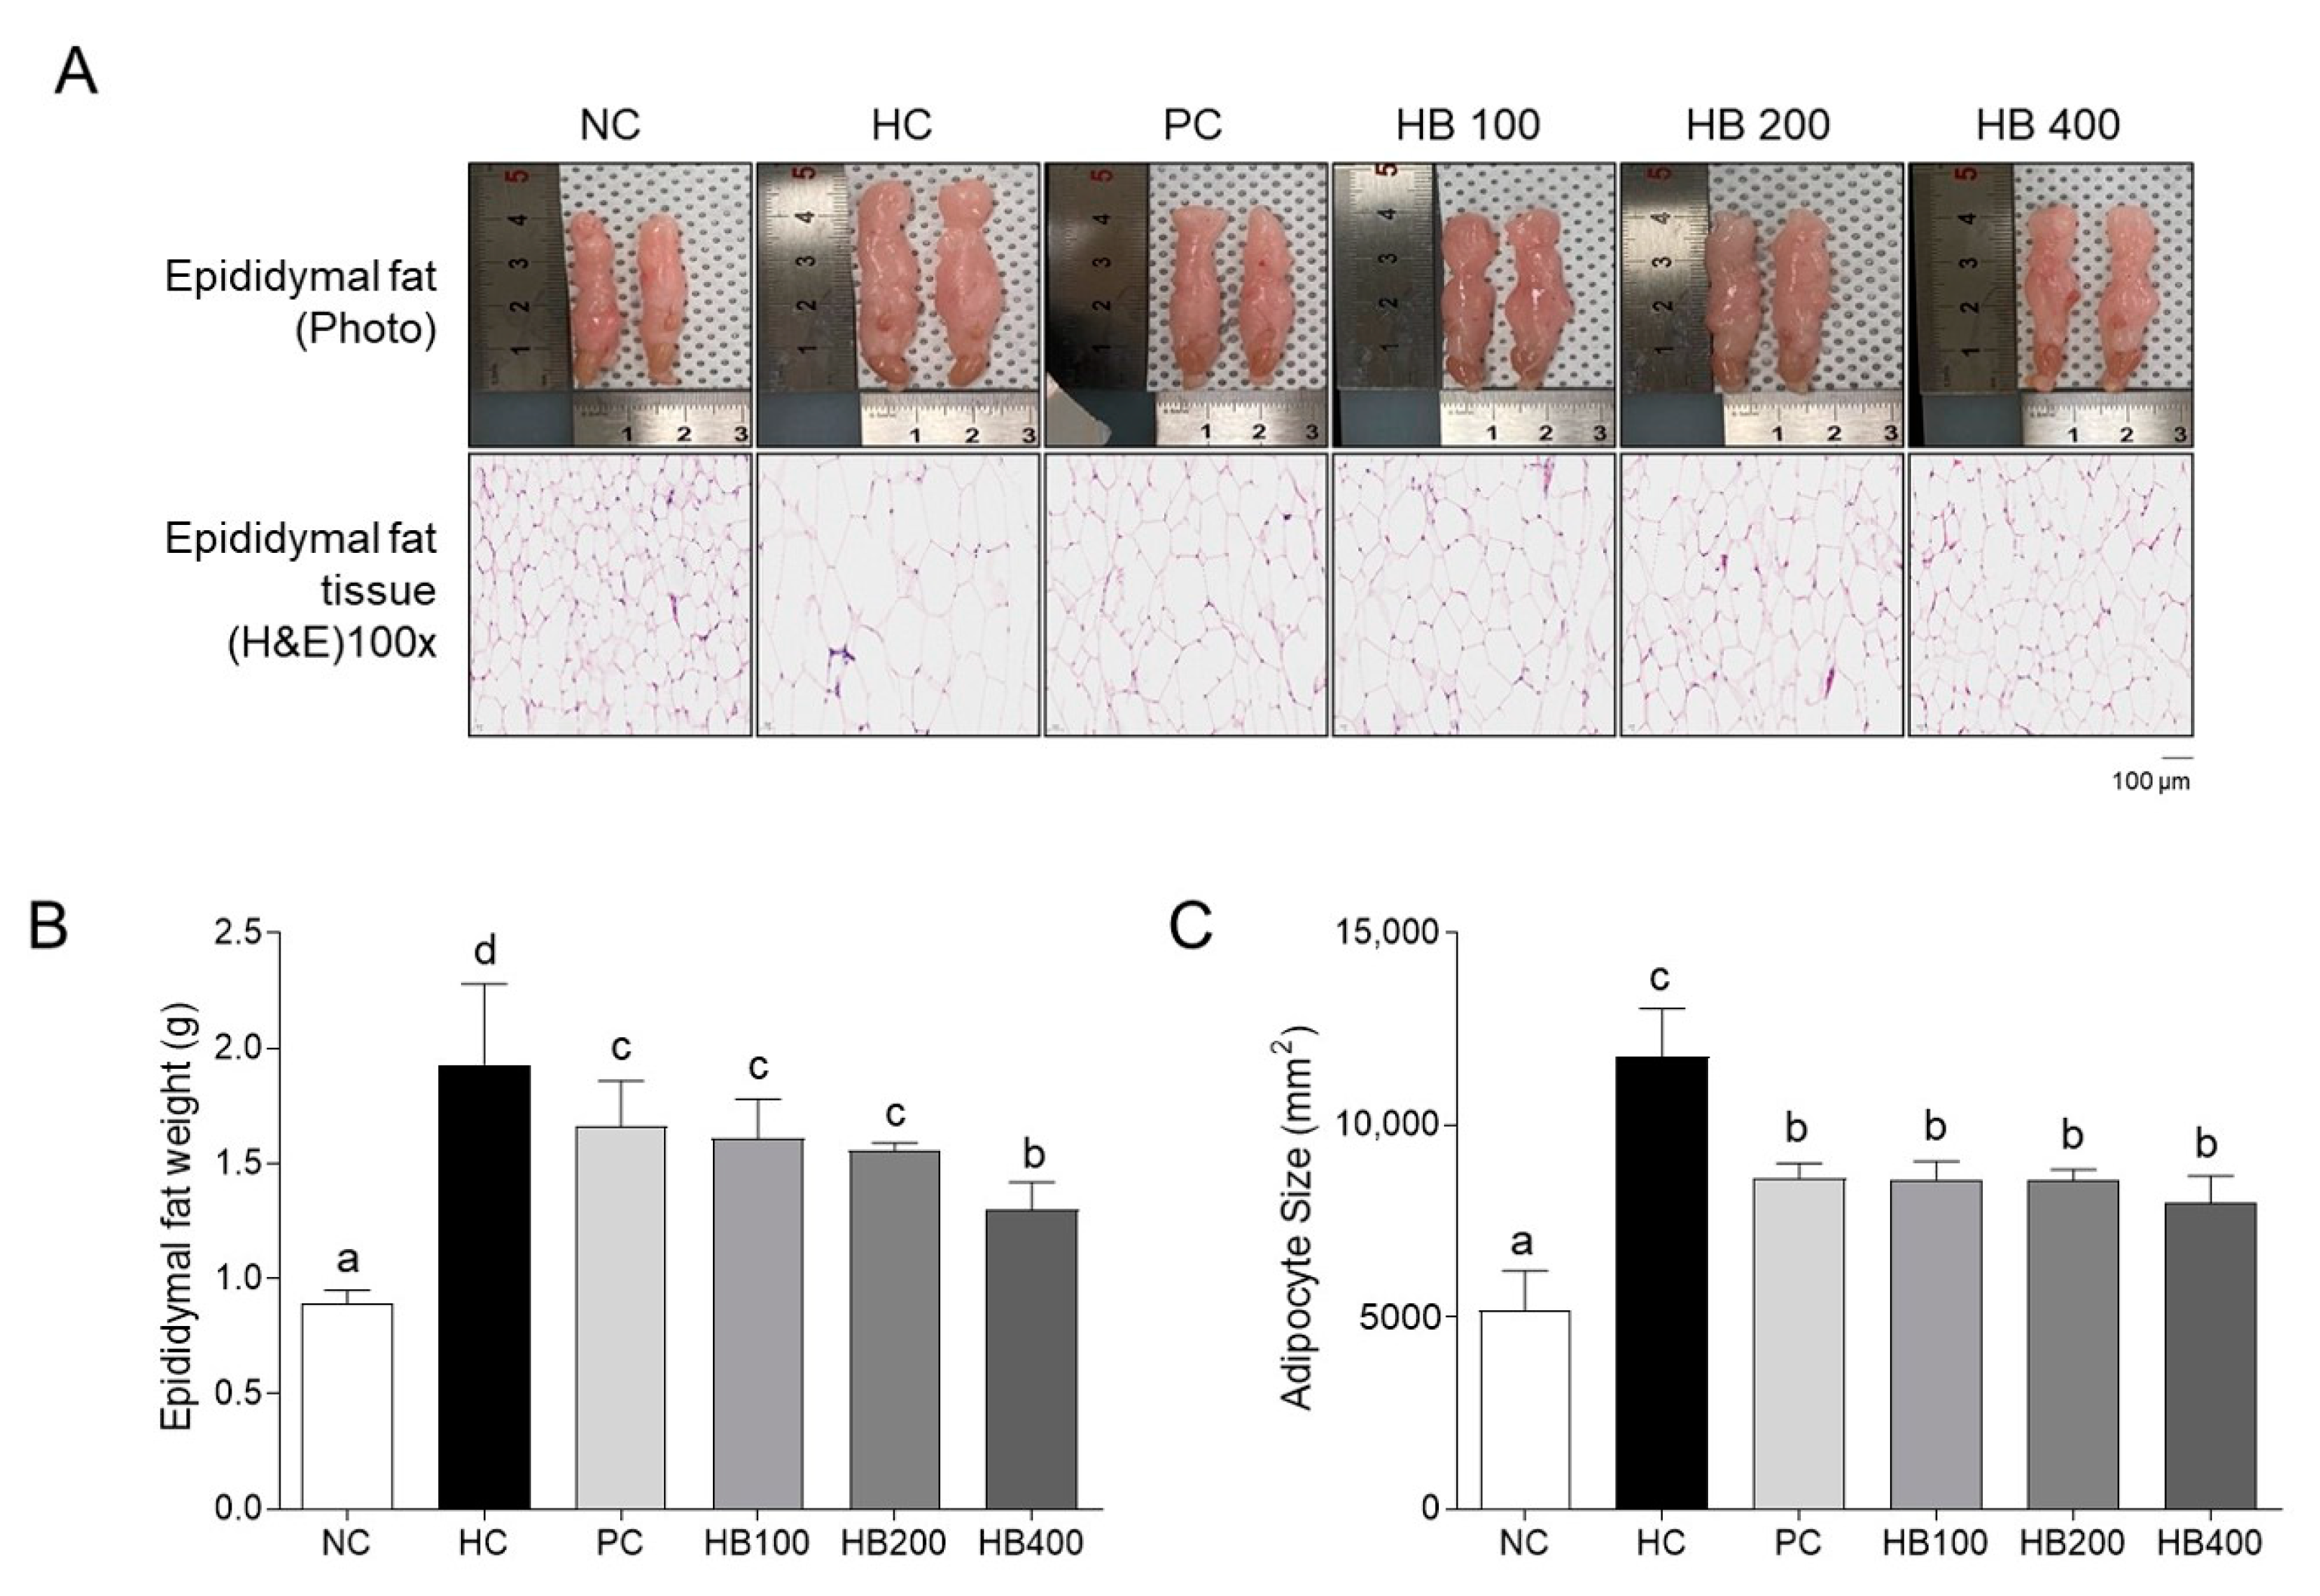
2.2. Effects of HB on Fat Accumulation in the Mice Model of HFD

To confirm the effect of HB on white adipose tissue fat accumulation, a visual examination, weight measurement, and hematoxylin and eosin (H&E) staining of epididymal fat were performed at the end of the experiment (Figure 2A). Visual inspection analysis showed that the epididymal fat size of the HC group was larger than that of the other groups (NC, PC, HB100, HB200, and HB400). In addition, the epididymal fat tissue weight and adipocyte size of the HB groups were reduced significantly compared to those of the HC group (Figure 2B,C).

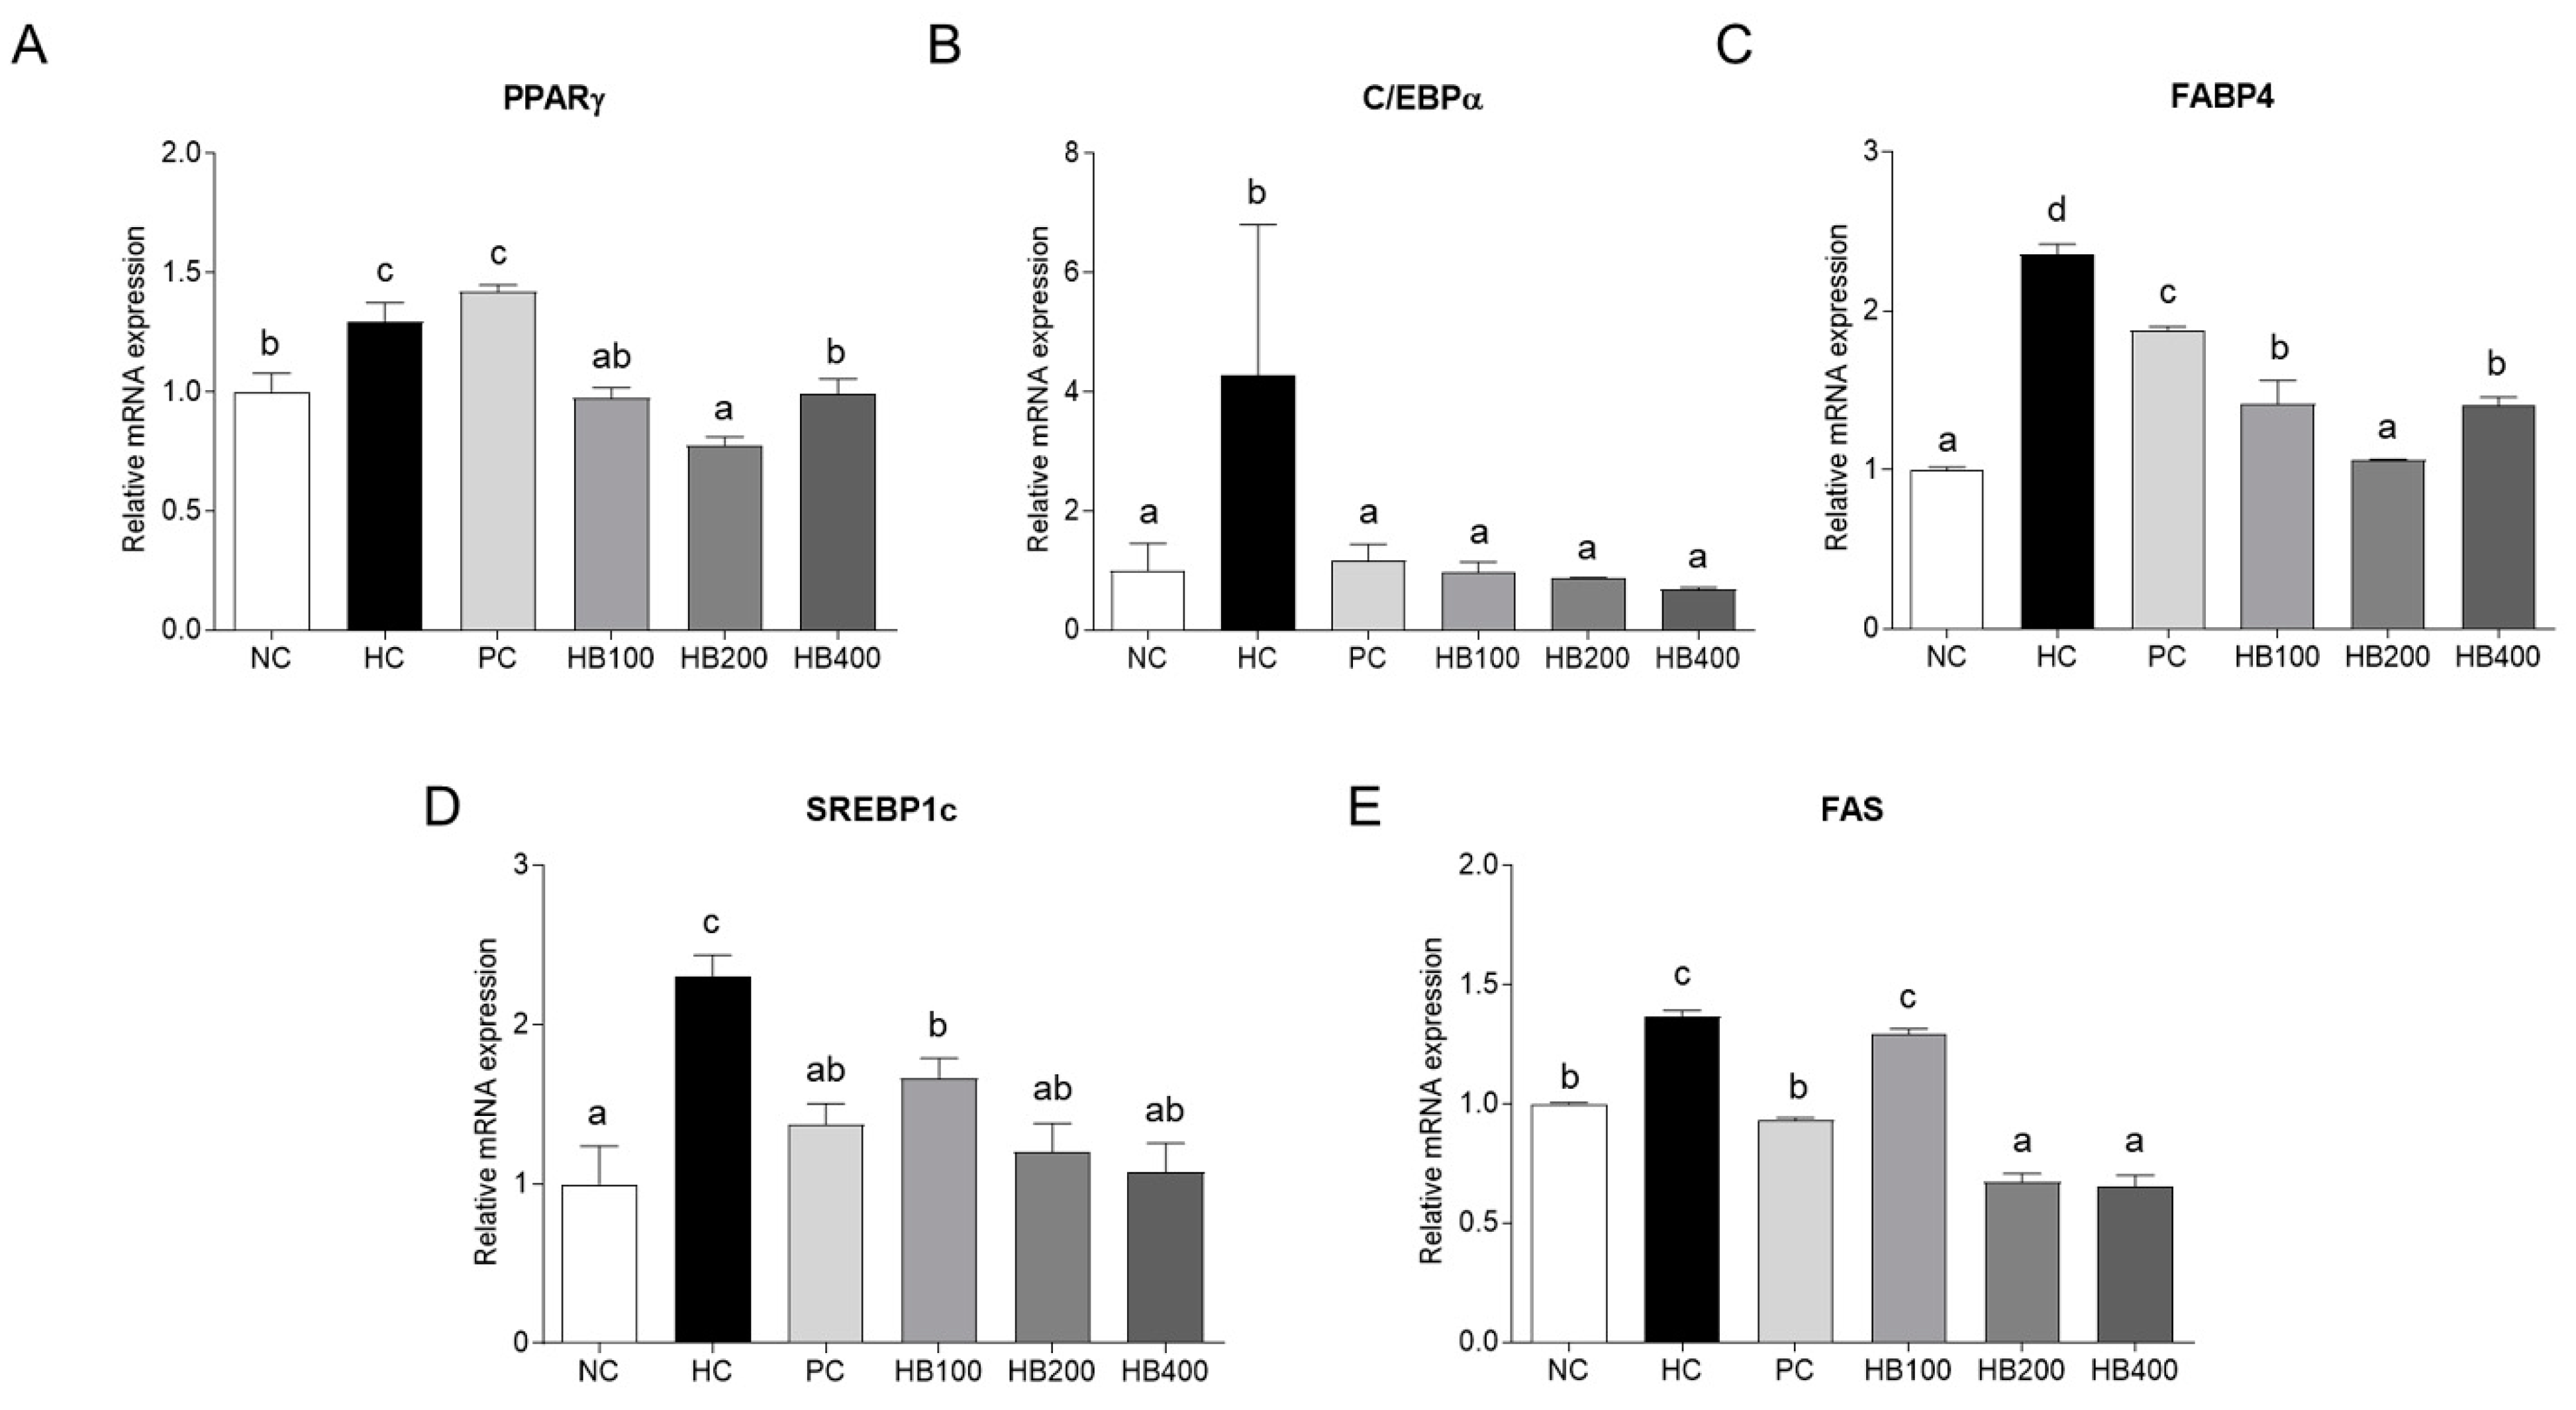
2.3. Effects of HB on Lipid Metabolism in Adipose Tissue

The adipogenesis and lipogenesis regulator genes were examined to determine the effects of HB on the lipid metabolism in adipose tissue. For adipogenesis, mRNA expressions of peroxisome proliferator-activated receptor-γ (PPARγ), CCAAT/enhancer-binding protein alpha (C/EBPα), and fatty acid-binding protein 4 (FABP4) in the HC group were significantly higher than in the NC group. The PPARγ, C/EBPα, and FABP4 mRNA expression levels were significantly lower in the HB group than in the HC group (Figure 3A–C). For lipogenesis, sterol regulatory element binding protein 1c (SREBP-1c) and fatty acid synthase (FAS) mRNA levels showed similar results to adipogenesis gene levels (Figure 3D,E).

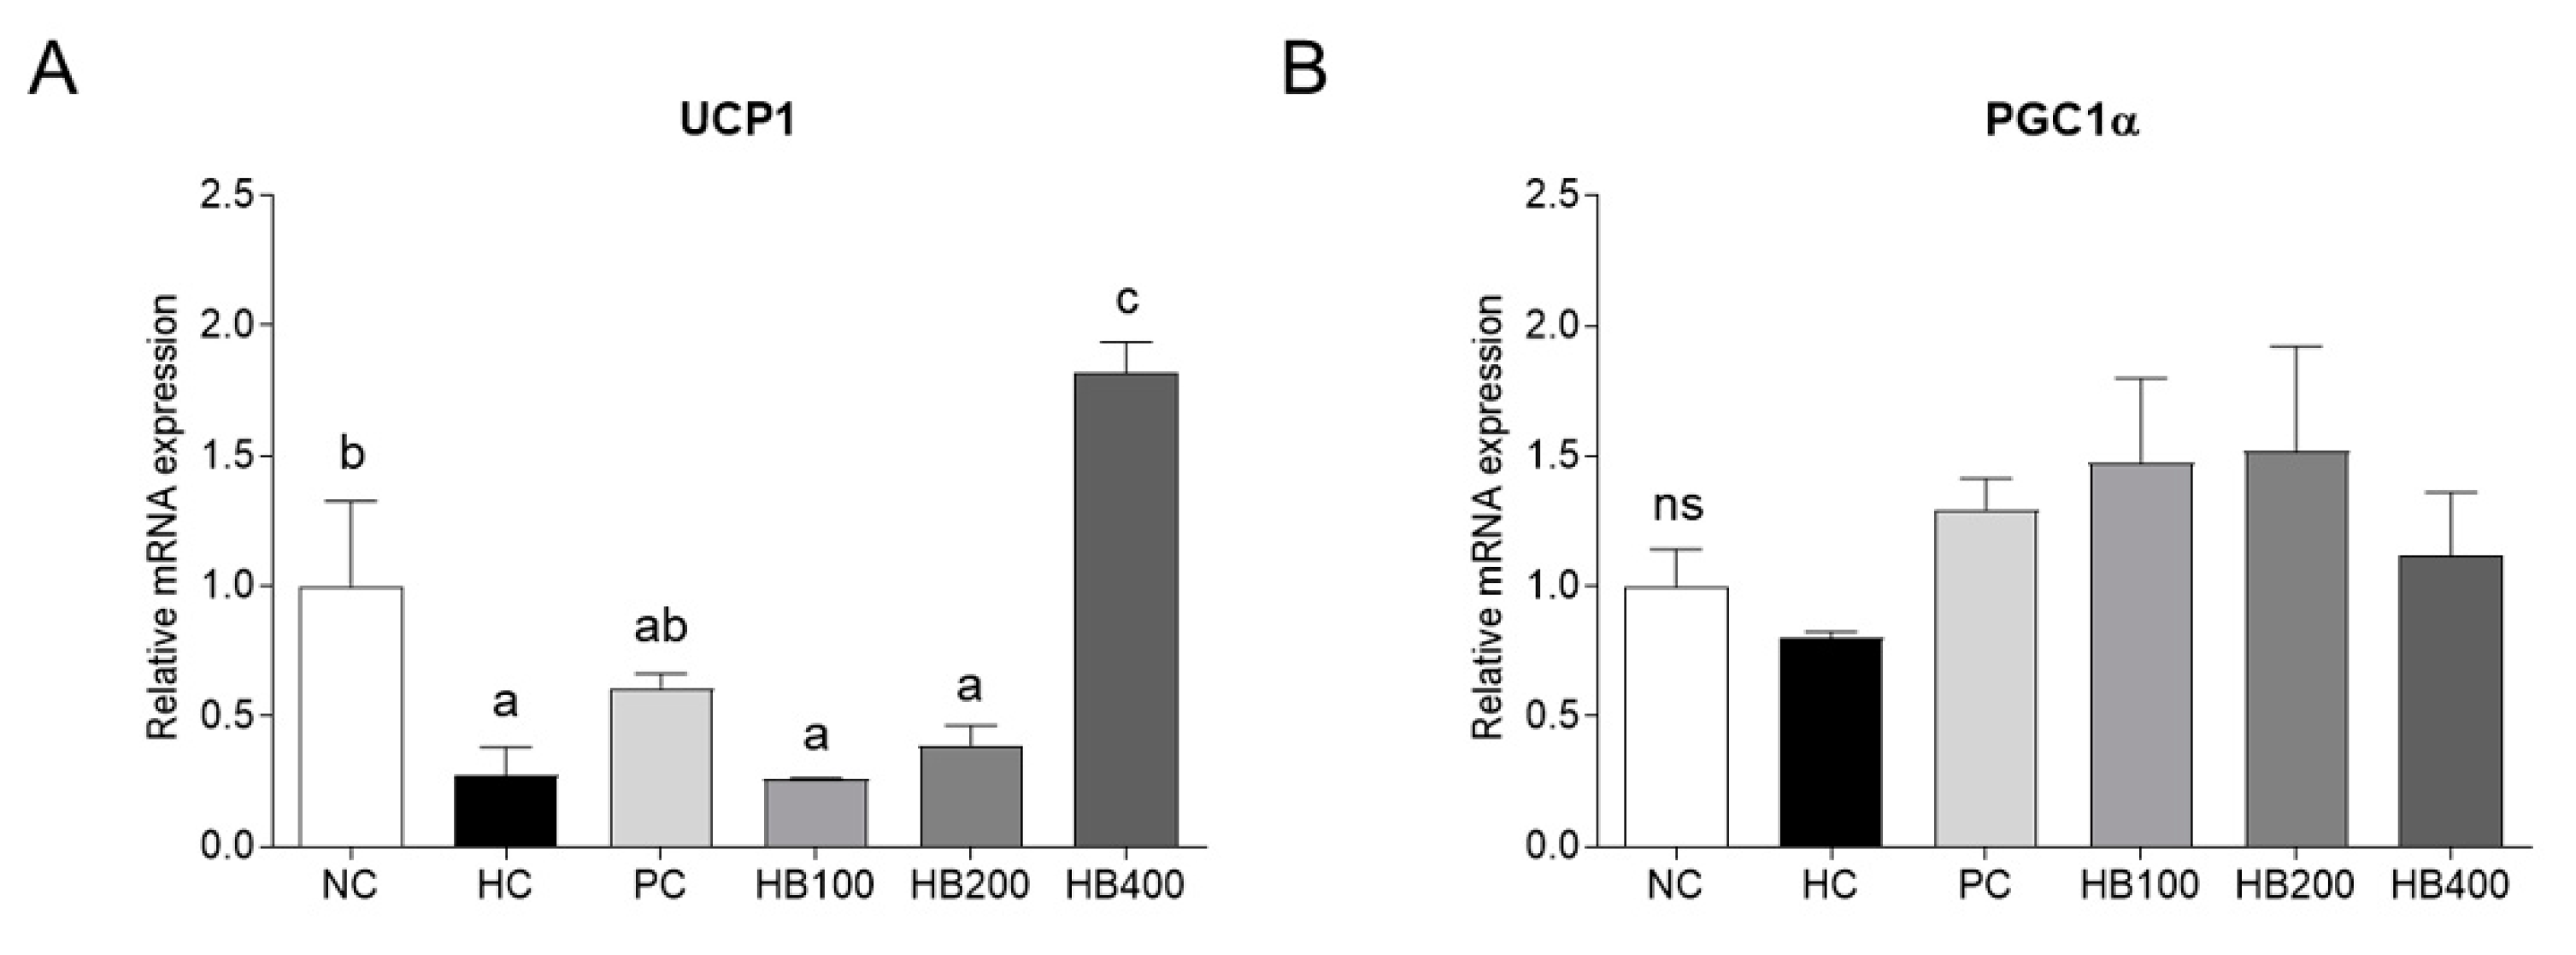
2.4. Effects of HB on Thermogenesis-Related Genes Expression in Adipose Tissue

The levels of Uncoupling protein 1 (UCP-1) and PPARγ coactivator 1-alpha (PGC1α) expression were quantified by qRT-PCR to evaluate the effects of HB on thermogenesis in the adipose tissue. There was a significant up-regulation of the mRNA expression of UCP-1 in the HB400 group compared to the NC, PC, HB100, and HB200, as well as the HC group. In addition, the mRNA expression of PGC1α tends to be upregulated in the HB100, HB200, and HB400 groups compared to that in the HC group, but there was no significant difference (Figure 4A,B).

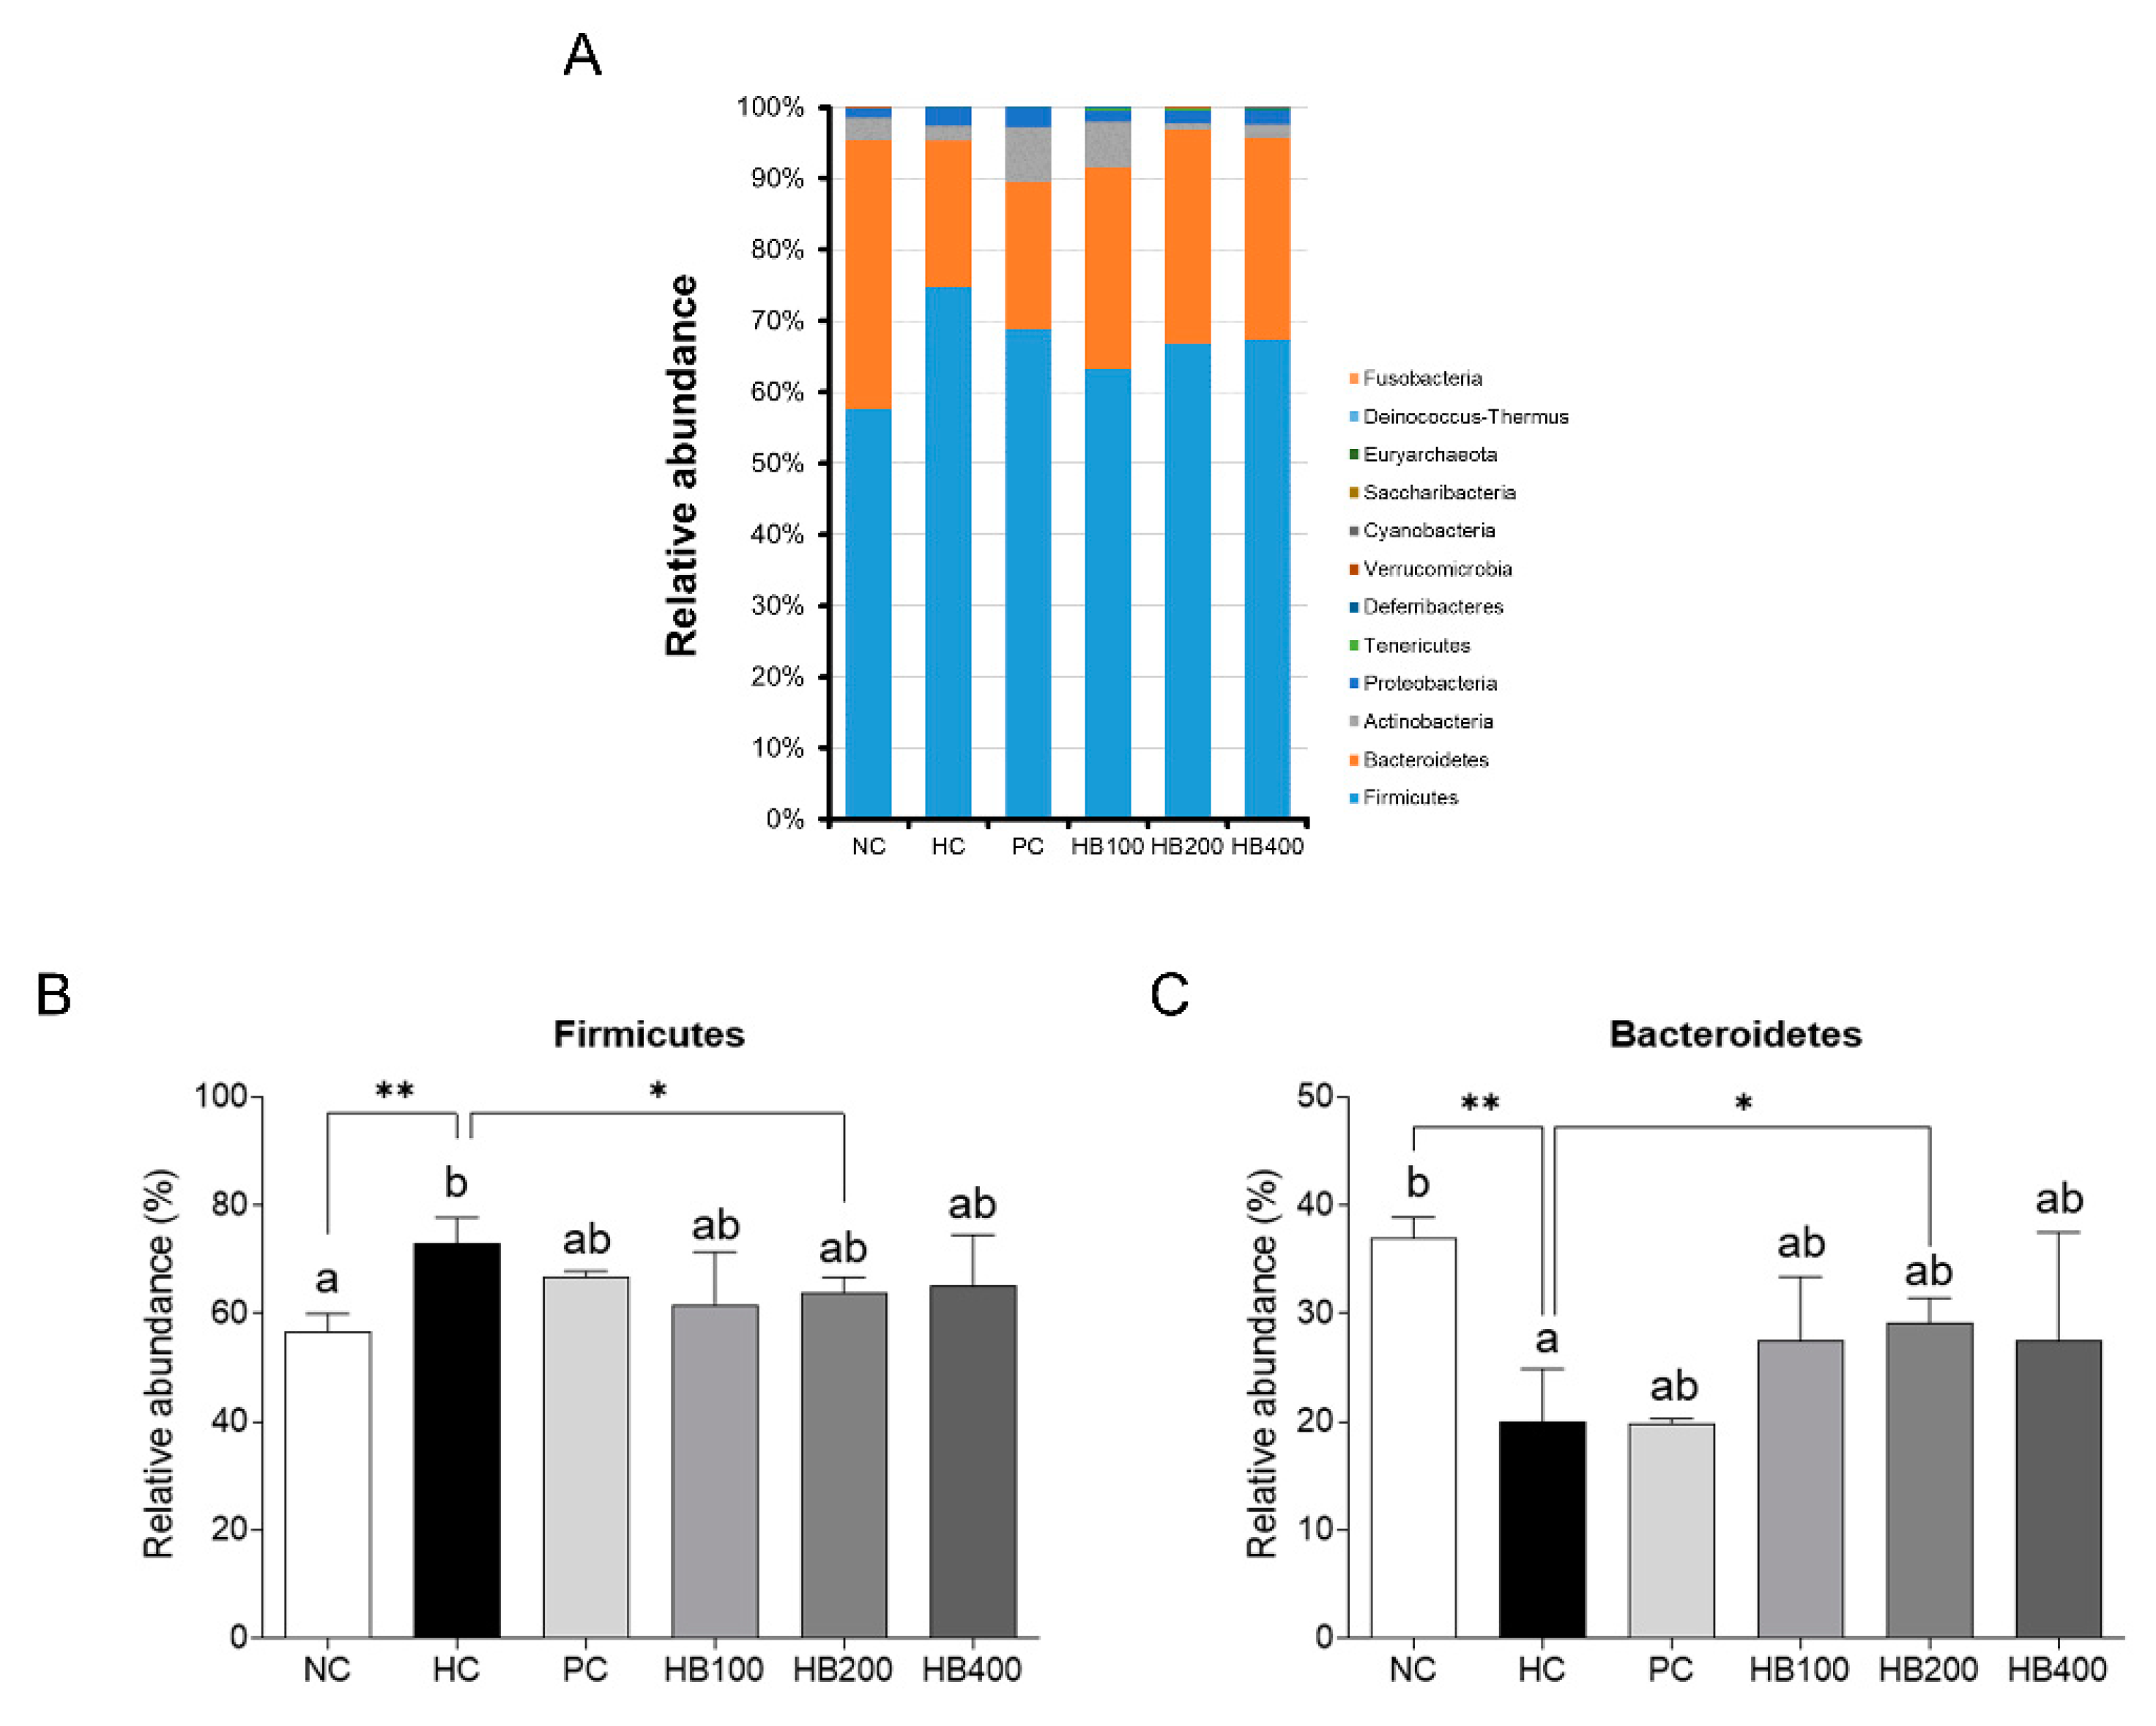
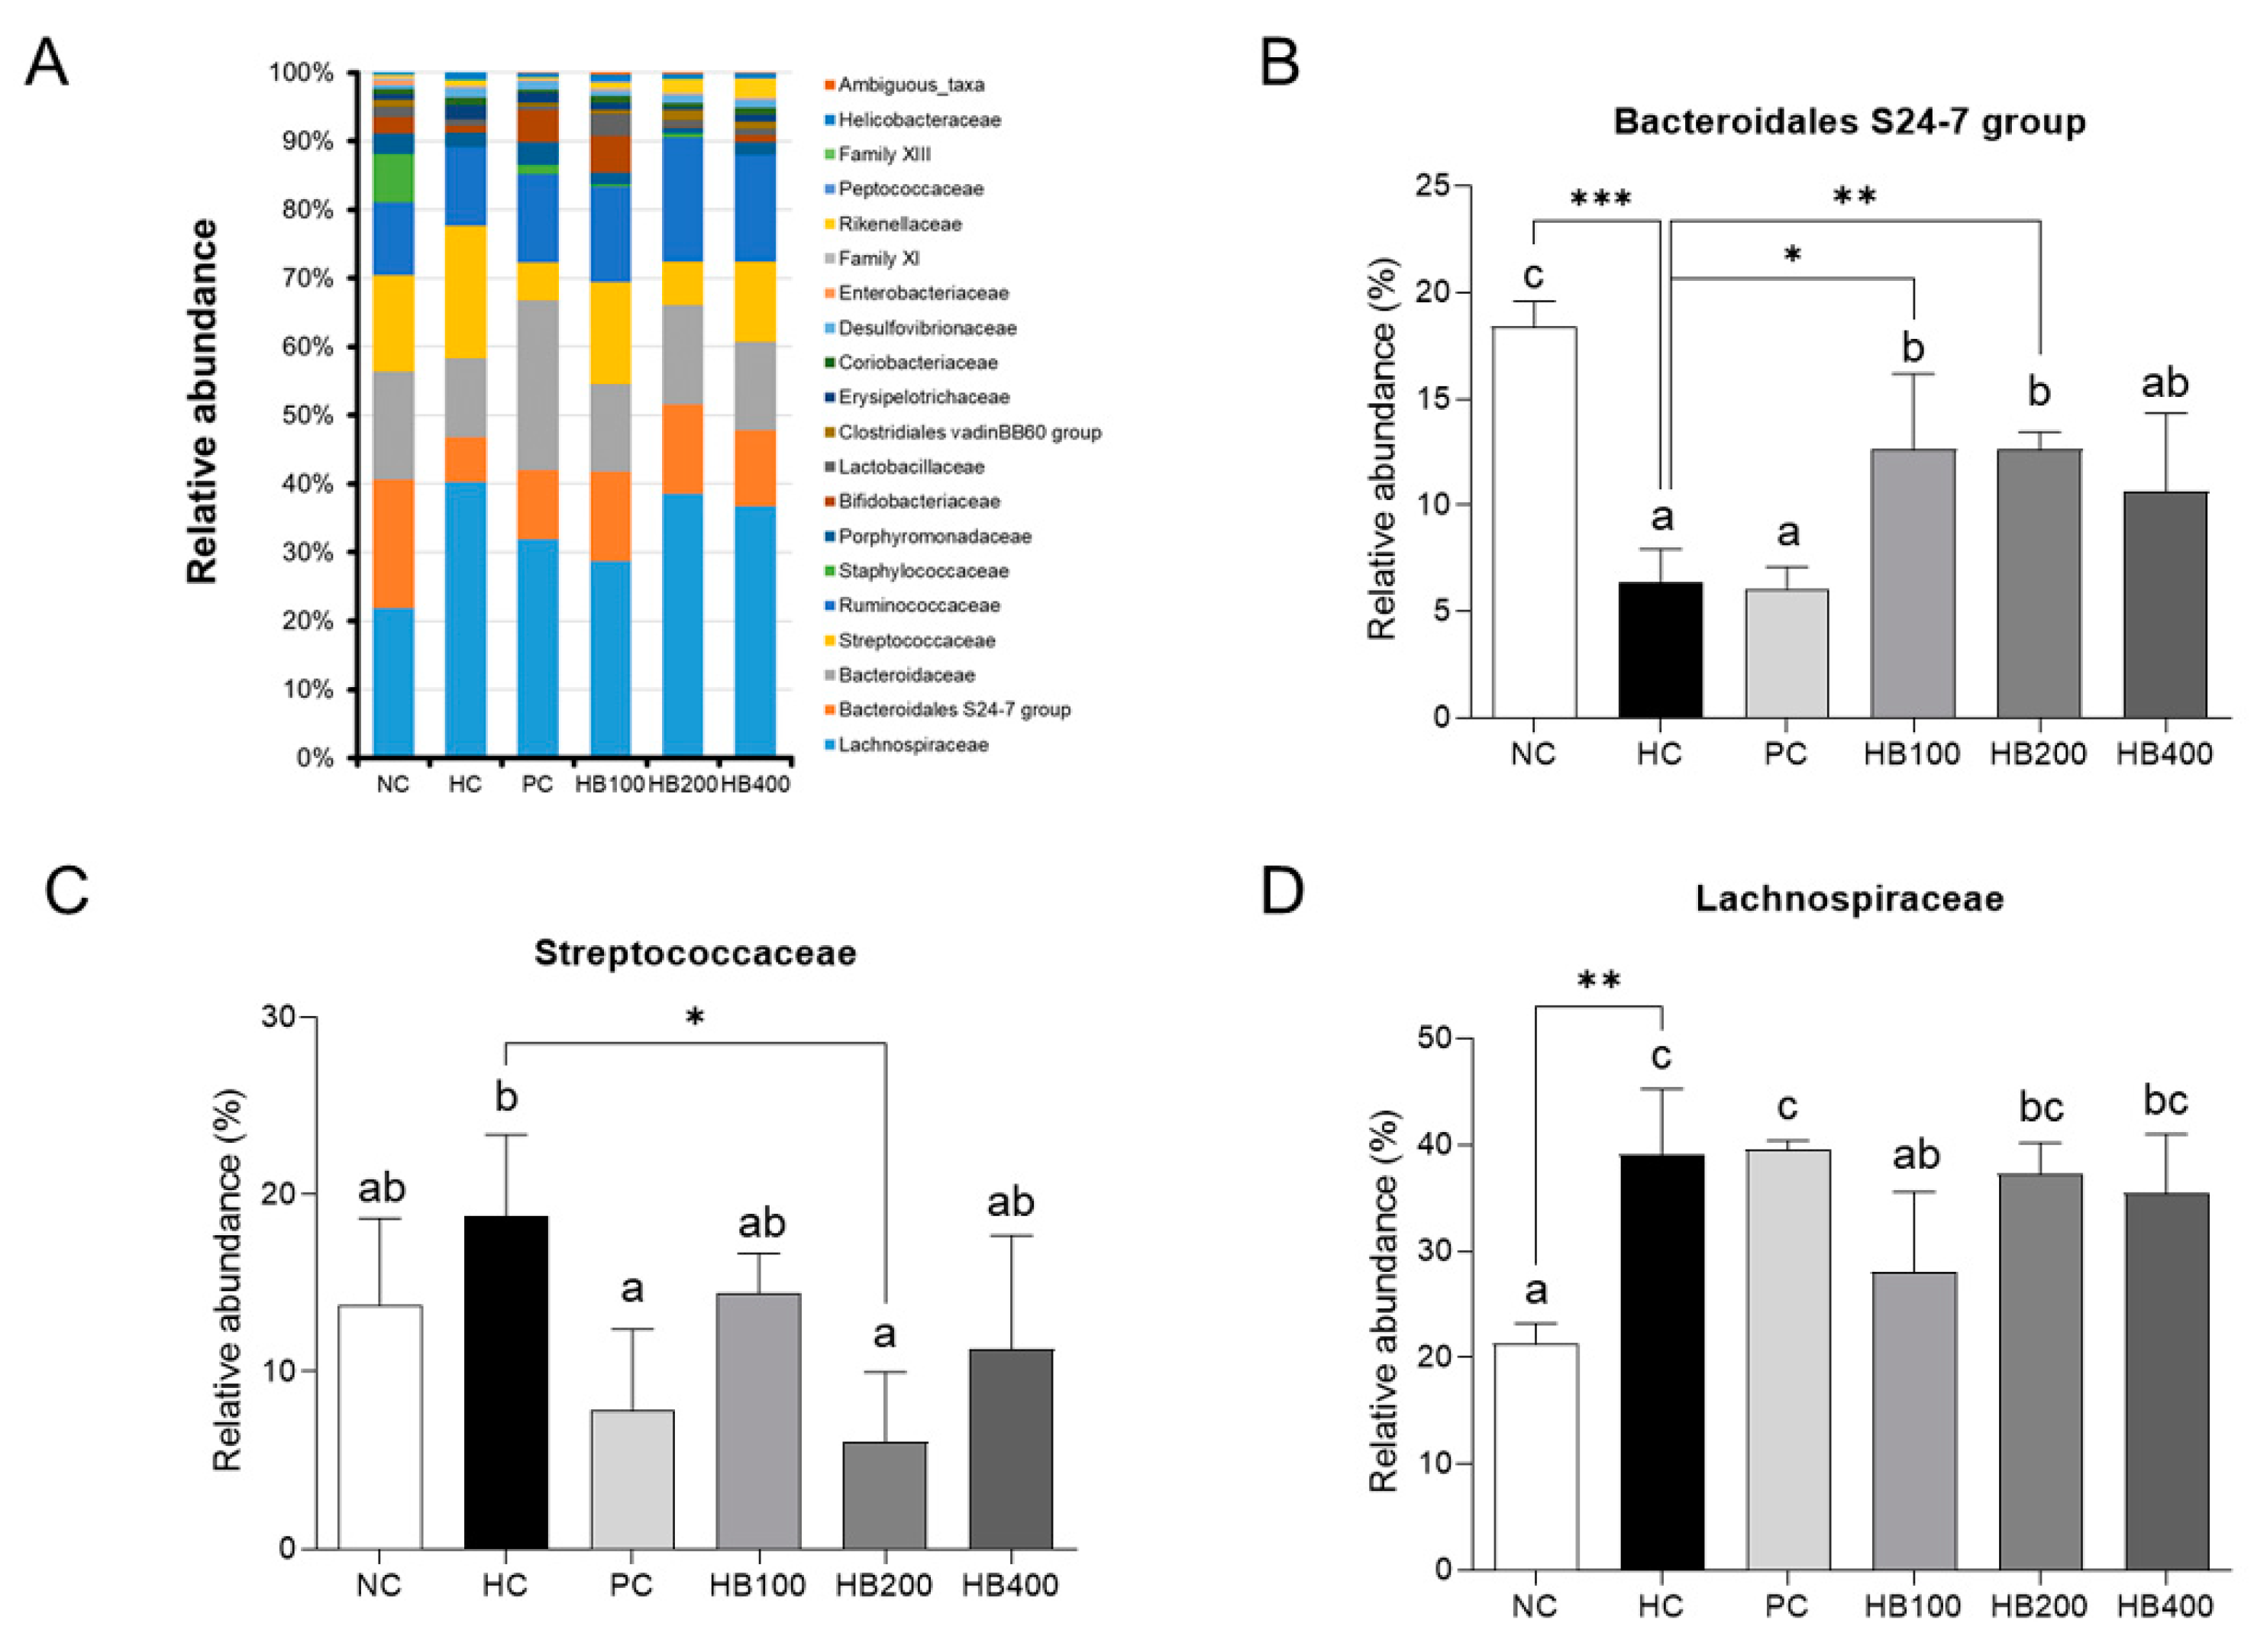
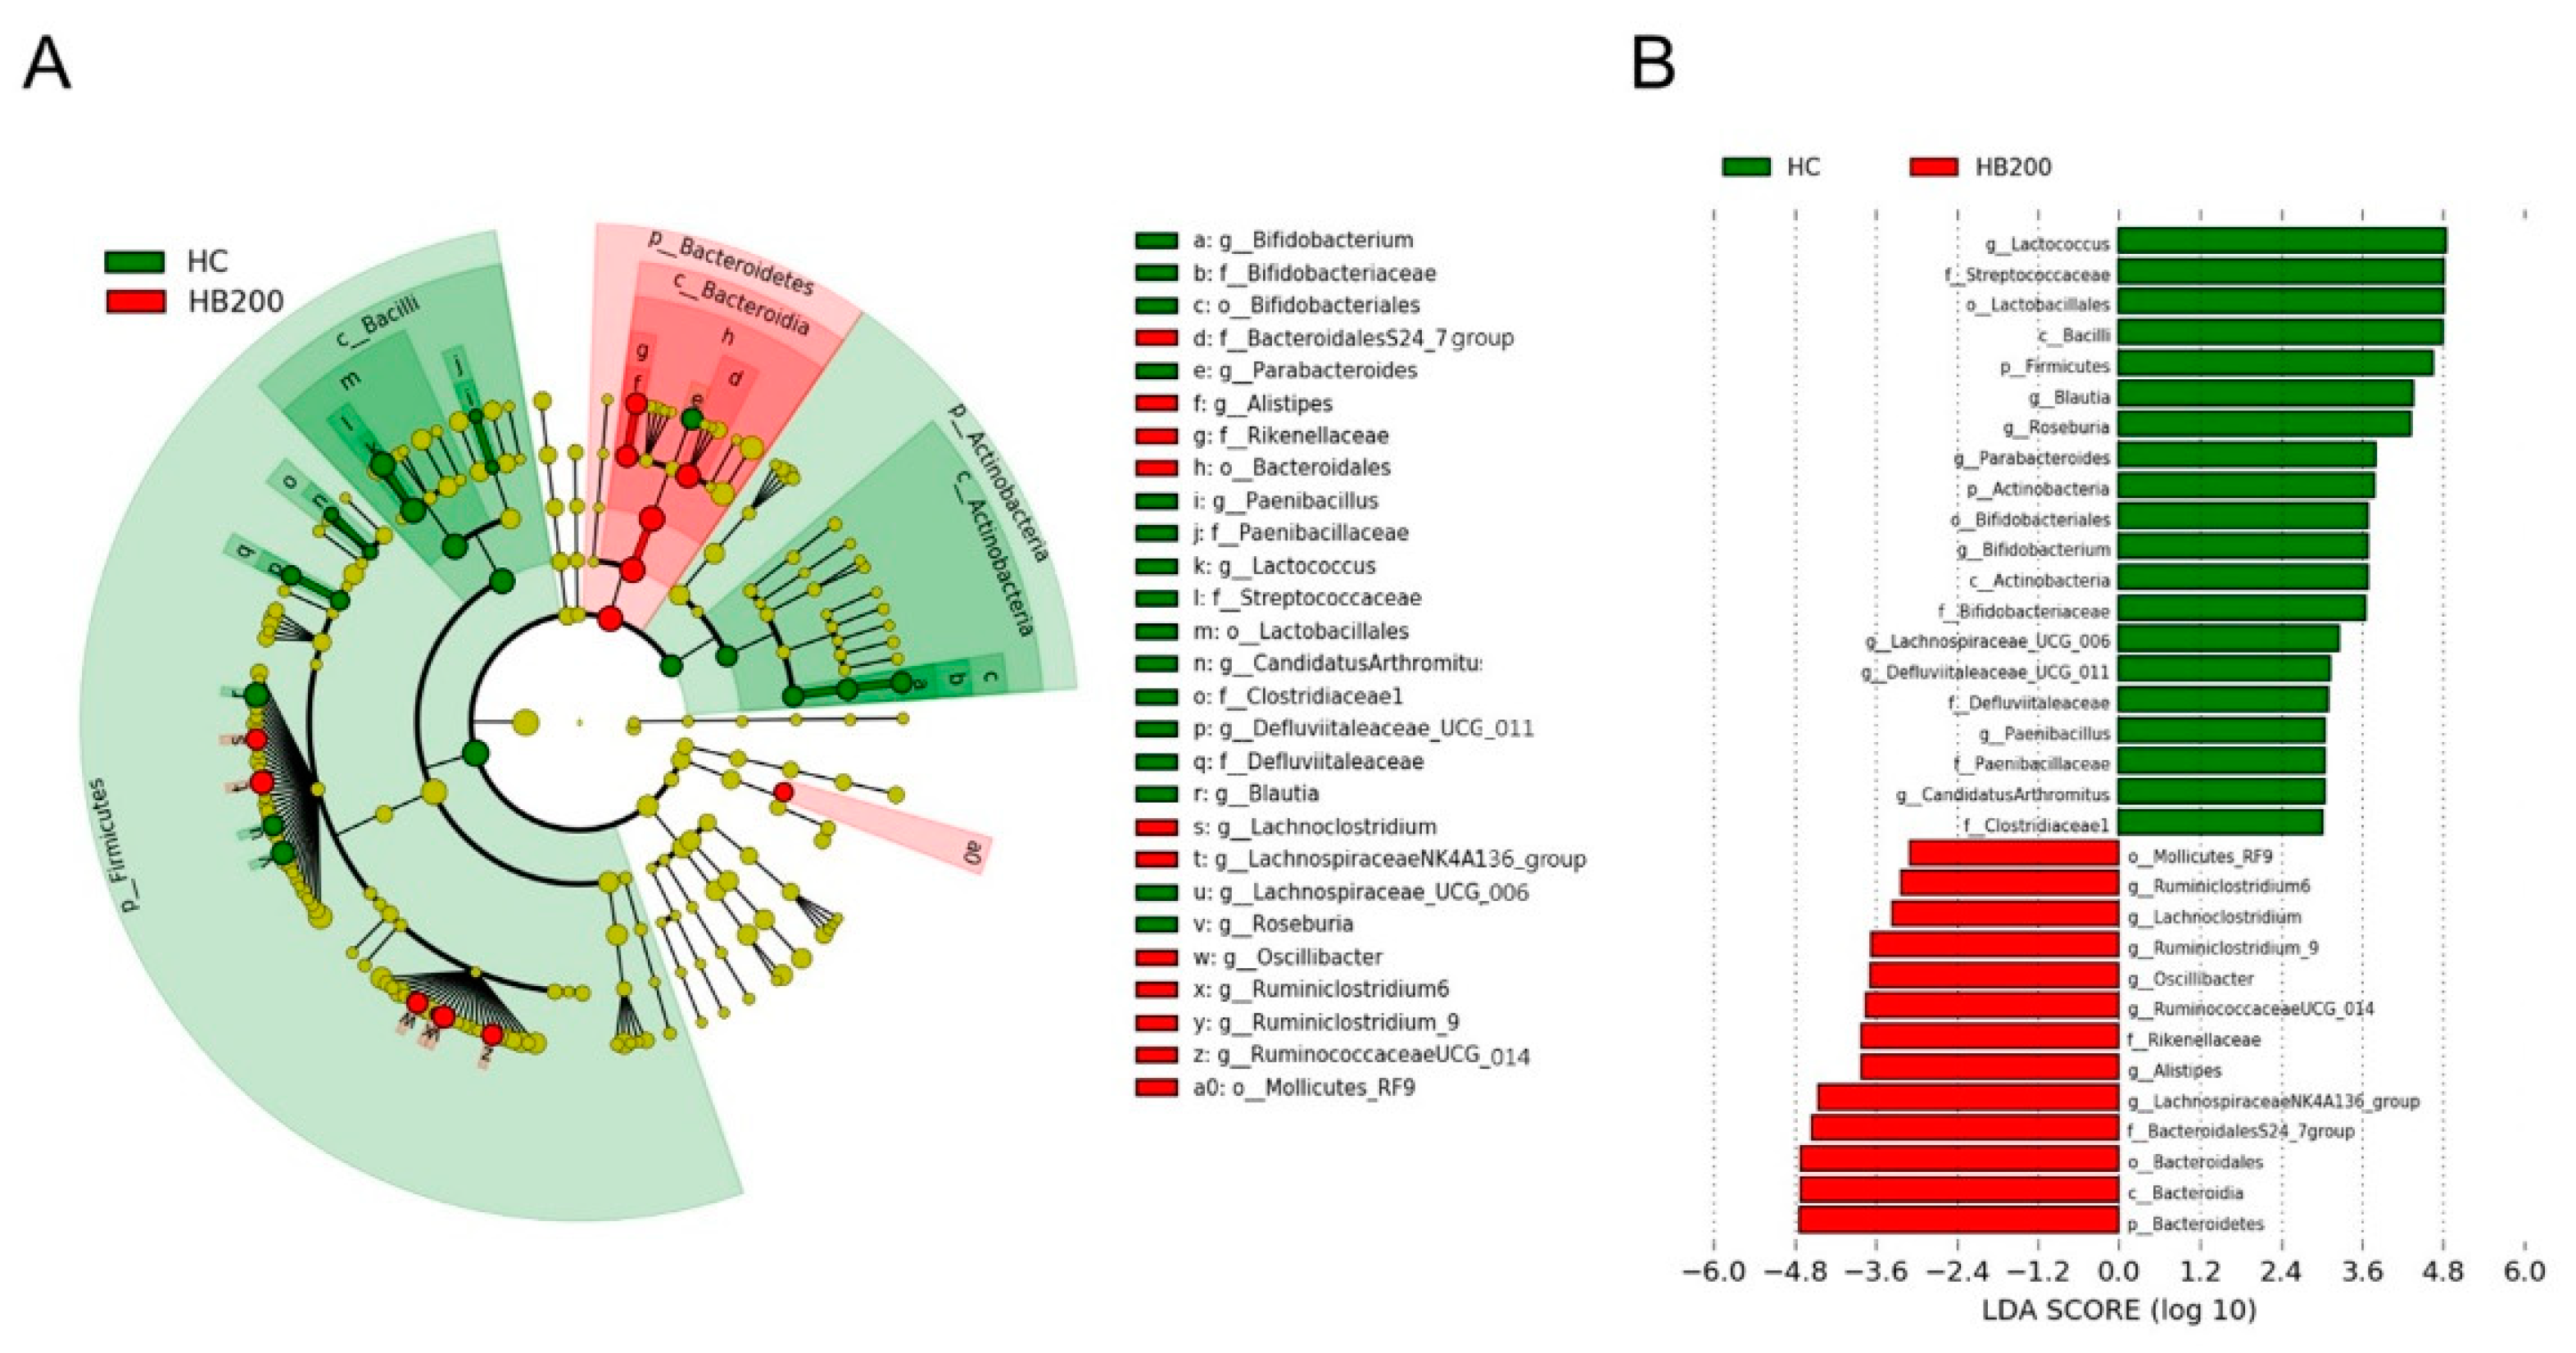
2.5. Effects of HB on the Composition of Fecal Microbiota

Fecal samples from each experimental group were analyzed to determine the effects of HB on the composition of fecal microbiota. In the case of the phylum level, the portion of Firmicutes and Bacteroidetes in the HC group was significantly different from the NC group and the HB200 group (Figure 5A–C).
HB also modulated the composition of the family level of the gut microbiota, increasing the Bacteroidales S24-7, while reducing Streptococcaceae and Lachnospiaceae, producing different results to that of the HC group (Figure 6A–D). A LEfSe tool was used to determine the dominant microbiota between the HC group and HB200 group. A comparison of the HC and HB200 groups revealed that 20 phylotypes had increased, while 13 phylotypes had decreased (Figure 7). Specifically, Firmicutes were found to be the major phylum of gut microbiota in the HC group, while Bacteroidetes were found in the HB200 group. The HB200 group increased the abundance of microbiota in the Bacteroidia class, Bacteroidales order, BacteroidalesS24-7 group family, Lachnospiraceae NK4A136 group genus, Alistipes genus, Rikenellaceae family, Ruminococcaceae UCG-014 genus, Oscillibacter genus, Ruminiclostridium 9 genus, Lachnoclostridium genus, Ruminiclostridium 6 genus, and Mollicutes RF9 order.

3. Discussion

This study confirmed the effects of HB on obesity in HFD-fed mice. The HB treatment alleviated the fat accumulation and inhibited the adipocyte hypertrophy of epididymal fat tissue. When it comes to the critical mechanisms for lipid accumulation, adipogenesis involves a cascade of transcriptional factors, including PPARγ, C/EBPα, and FABP4, which differentiate the new adipocytes from precursor cells [8,23,24]. Lipogenesis involves another transcription factor, SREBP1c, and its downstream target, FAS [25,26]. UCP1 and PGC1α are involved in thermogenesis and mitochondrial biogenesis in adipose tissue [27,28]. In this study, the expression of SREBP-1c and C/EBPα, a key regulator of lipid metabolism, changed after administering the HFD-fed mice with HB. These findings are consistent with a previous study showing that the blue honeysuckle extract (BHe) has anti-obesity effects in HFD-fed mice [29]. UCP1 acts in thermogenesis, protects against oxidative stress, and controls energy expenditure, leading to anti-obesity effects [30]. PGC1α is deacetylated by increasing SIRT1 concentration to activate the genes for fat oxidation [31,32]. The expression of UCP1 and PGC1α was upregulated after administering HB, contributing to the suppression of adipogenesis in adipocytes. These results suggest that HB regulates the mRNA expression of SREBP-1c and C/EBPα, which induces lipid metabolism and the expression of UCP1 and PGC1α, which causes thermogenesis, making it helpful for improving obesity.
Although previous research has revealed the health functional properties of HB, few studies have examined the effects of HB on lipase activity and the gut microbiota. In this study, the pancreatic lipase inhibition assay test revealed that HB inhibited pancreatic lipase activity. Pancreatic lipase is a key enzyme in the digestion of dietary fat [33]. This enzyme hydrolyzes dietary TG into fatty acids and monoglycerides, which are absorbed by the body [33]. Subsequently, fatty acids are re-synthesized to TG, which accumulates in the tissue and leads to obesity [34]. Therefore, the inhibition of pancreatic lipase suppresses fat absorption and accumulation by excreting fat out of the body [10]. Anthocyanin, a type of polyphenol, is a flavonoid found mainly in fruits and flowers, which has been shown to inhibit pancreatic lipase activity [35,36]. When the phytochemical composition of the extract used in this study was examined, it was discovered that the presence of anthocyanins, chlorogenic acid, rutin, and ellagic acid was observed (Figures S1 and S2, Tables S1 and S2). As expected, cyanidin 3-O-glucoside (C3G), a type of anthocyanin, was a major component, suggesting that it inhibits pancreatic lipase activity. Furthermore, we found HB increased the fecal TG level in this study and confirmed that HB decreased the serum TG level in our previous study [22]. These results support our results, suggesting that HB could be developed as a lipid absorption inhibitor.
The role of the gut microbiota in homeostasis, metabolism, adiposity, and energy regulation, as well as in vitamin production and nutrient harvesting, which together are related to obesity and obesity-associated disorders, continues to be investigated [37,38]. Anthocyanins showed prebiotic properties that are catabolized by the gut microbiota [39] and have been found to play a role in alleviating obesity by decreasing the Firmicutes/Bacteroidetes ratio [40,41]. This study confirmed that the HFD-fed mice increased the number of Firmicutes and decreased the number of Bacteroidetes. On the other hand, mice fed with the HFD with HB decreased in their number of Firmicutes and increased in Bacteroidetes. Furthermore, anthocyanin supplementation reversed the decrease of short-chain fatty acids (SCFAs) caused by the HFD [42]. Also, the Lachnospiraceae NK4A136 group and RuminococcaceaeUCG-014 group, which produce butyrate, were found to be enriched in the HFD-fed mice treated with an anti-obesity agent [43,44]. In this study, HB extract increased these two floras. Our findings are consistent with previous studies [43,44], suggesting that HB extract regulates fecal microbiota via their prebiotic properties and has a beneficial effect on HFD-induced obesity in mice.

4. Materials and Methods

4.1. Preparation of HB Extract

Raw HB fruits were extracted as described previously [22]. The amount of C3G, one of the major anthocyanins in HB extract, was measured to be 11.12 mg/g [22]. The HB extract was stored at −20 °C and dissolved in a 0.5% aqueous solution of carboxymethyl cellulose sodium (CMC-Na, TCI, Tokyo, Japan).

4.2. Pancreatic Lipase Inhibition Assay

The substrate p-nitrophenyl butyrate (p-NPB) was used to perform the pancreatic lipase inhibition assay and the method was slightly modified from the previous assay method [33]. Briefly, either the various concentrations of HB or 100 μg/mL Orlistat were mixed with the Tris buffer and enzyme buffer. After 15 min at 37 °C, the substrate solution was added and incubated for 30 min at 37 °C. All the materials used in the assay were purchased from Sigma–Aldrich (St. Louis, MO, USA). The pancreatic lipase inhibitory activity was measured at 405 nm. The inhibitory activity (%) was calculated as follows:
Lipase inhibition (%) = [1 − (B − b)/(A − a)] × 100
where A is the activity without the sample with the enzyme, and a denotes the activity without the sample and enzyme. B is the activity of the sample with the enzyme and b is the activity of the sample without the enzyme.

4.3. Animals and Treatment

Forty-eight six-week-old male C57BL/6 mice were purchased from Orient Bio Co. Ltd. (Seongnam-si, Gyeonggi-do, Korea) and maintained in a temperature and humidity-controlled room on a 12 h/12 h light/dark cycle at Gachon University, Korea. They were given access to food and drinking water ad libitum over a one-week acclimation period. The mice were randomly split into six groups of eight mice each: NC (normal diet control, 10% calories from fat, D12450B, Research Diets, New Brunswick, NJ, USA), HC (HFD, 45% calories from fat; D12451; Research Diets, NJ, USA), PC (positive control, HFD with orlistat 20 mg, TCI, Tokyo, Japan), HB100 (HFD with HB100 mg/kg), HB200 (HFD with HB200 mg/kg), and HB400 (HFD with HB400 mg/kg). The experimental extracts were dissolved in a 0.5% aqueous solution of CMC-Na (TCI, Tokyo, Japan). Orlistat and different doses of HB were administered orally to PC and the experimental group mice, respectively, whereas the solvent was administered orally to the NC and HC group mice. For eight weeks, oral administration was performed once per day. All the animals were cared for, operated in compliance with Gachon University’s guidelines for the care and use of laboratory animals (reference number: GIACUC-R2020009).

4.4. Epididymal Fat Tissue and Feces Collection

After 12 h of fasting, the mice were euthanized with CO2. The epididymal fat tissue was dissected and weighed immediately. The feces of the mice were collected the day before the end of the experiment. All samples were stored at −80 °C until analysis.

4.5. Fecal Triglyceride Analysis

After drying for 24 h at 60 °C in a drying oven (DAIHAN Scientific Co., Ltd. Wonju, Korea), 250 mg of fecal samples were homogenized with 2 mL of phosphate-buffered saline. Fecal fat was extracted using the method reported by Folch et al. [45]. The fecal triglyceride (TG) levels were determined using a TG enzymatic assay kit (Asanpharm, Hwaeong, Korea).

4.6. Histological Analysis

H&E staining was performed according to the previously described method [22]. Briefly, the epididymal fat tissue was fixed, waxed, cut, and stained with H&E. Subsequently, sample images were taken using a Nikon DS-Ri2 camera (Nikon, Tokyo, Japan).

4.7. Quantitative Reverse-Transcription Polymerase Chain Reaction (qRT-PCR)

The total RNA was extracted from the epididymal fat tissue, and the cDNA was synthesized from 50 ng/μL RNA. qRT-PCR was performed using an ABI QuantStudio 3 (Applied Biosystems, Foster City, CA, USA). Table 1 lists the primer sequences used for qRT-PCR.

4.8. Microbiota Analysis

Fecal microbiota analysis was performed pursuant to a previous study with some modifications [46]. Briefly, the QIAamp PowerFecal DNA Kit (QIAGEN, Hilden, Germany) was used to extract the genomic DNA from feces samples. The bacterial 16S rRNA V4 region was amplified with unique 8 bp barcodes and sequenced on the Illumina iSeq 100 system according to standard protocol [47]. The sequences were processed by the Quantitative Insights into Microbial Ecology (QIIME) pipeline [48] using the SILVA 128 database [49]. Linear discriminate analysis (LDA) effect size (LEfSe, http://huttenhower.sph.harvard.edu/galaxy/, accessed on 11 May 2022) was performed to compare the taxon microbes between HC and HB200 groups.

4.9. Statistical Analysis

Statistical differences of all data were analyzed using Duncan’s multiple range test after one-way analysis of the variance. Student’s t-test, using SPSS 25 (SPSS Inc., Chicago, IL, USA), was performed for two group comparisons. p values < 0.05 were considered significant.

5. Conclusions

Overall, this study showed that HB significantly inhibits pancreatic lipase activity, reducing dietary fat absorption. The anti-obesity efficacy of HB was comparable to that of the positive control, orlistat. Moreover, HB positively modulates the gut microbiome. These findings provide scientific evidence that HB prevents obesity and modulates the gut microbiota in HFD-induced obese mice.

Supplementary Materials

The following supporting information can be downloaded at: https://www.mdpi.com/article/10.3390/molecules27154731/s1, Figure S1: high-performance liquid chromatography (HPLC) of (A) phenolic compounds standards and (B) HB extract; Figure S2: high-performance liquid chromatography (HPLC) of (A) anthocyanin standard and (B) HB extract; Table S1: The identified phenolic compounds except anthocyanin in HB extracts by high performance liquid chromatography; Table S2: The identified anthocyanin in HB extracts by high performance liquid chromatography.

Author Contributions

Conceptualization, H.-J.L. and E.-J.P.; methodology, E.-J.P. and J.-Y.K.; validation, J.-Y.K. and Y.-S.L.; formal analysis, E.-J.P., Y.-S.L. and J.-Y.K.; investigation, J.-Y.K. and Y.-S.L.; writing—original draft preparation, J.-Y.K.; writing—review and editing, H.-J.L. and E.-J.P.; visualization, E.-J.P., J.-Y.K., and Y.-S.L.; supervision, H.-J.L. and E.-J.P.; project administration, H.-J.L. and E.-J.P. All authors have read and agreed to the published version of the manuscript.

Funding

This work was supported by the “Cooperative Research Program of the Center for Companion Animal Research (Project No. PJ01398403)” Rural Development Administration, Republic of Korea and partly supported by the Gachon University Research Fund of 2019 (GCU-2019-0318).

Institutional Review Board Statement

All animal study procedures were approved by the Institutional Animal Care and Use Committee of Gachon University, Korea (GIACUC-R2020009).

Informed Consent Statement

Not applicable.

Data Availability Statement

The data presented in this study are available in supplementary material.

Acknowledgments

The authors would like to thank Sung-Min Kim (Gachon University) for research assistance.

Conflicts of Interest

The authors declare no conflict of interest.

Sample Availability

Samples of the compounds are not available from the authors.

References

  1. Liu, J.; He, Z.; Ma, N.; Chen, Z.Y. Beneficial Effects of Dietary Polyphenols on High-Fat Diet-Induced Obesity Linking with Modulation of Gut Microbiota. J. Agric. Food Chem. 2020, 68, 33–47. [Google Scholar] [CrossRef] [PubMed]
  2. Lin, H.; An, Y.; Tang, H.; Wang, Y. Alterations of Bile Acids and Gut Microbiota in Obesity Induced by High Fat Diet in Rat Model. J. Agric. Food Chem. 2019, 67, 3624–3632. [Google Scholar] [CrossRef] [PubMed]
  3. Seravalle, G.; Grassi, G. Obesity and hypertension. Pharmacol. Res. 2017, 122, 1–7. [Google Scholar] [CrossRef] [PubMed]
  4. Malone, J.I.; Hansen, B.C. Does obesity cause type 2 diabetes mellitus (T2DM)? Or is it the opposite? Pediatric Diabetes 2019, 20, 5–9. [Google Scholar] [CrossRef] [PubMed] [Green Version]
  5. Salaun, H.; Thariat, J.; Vignot, M.; Merrouche, Y.; Vignot, S. Obesity and cancer. Bull. Cancer 2017, 104, 30–41. [Google Scholar] [CrossRef] [PubMed]
  6. Gallagher, E.J.; LeRoith, D. Obesity and Diabetes: The Increased Risk of Cancer and Cancer-Related Mortality. Physiol. Rev. 2015, 95, 727–748. [Google Scholar] [CrossRef] [PubMed] [Green Version]
  7. Muir, L.A.; Neeley, C.K.; Meyer, K.A.; Baker, N.A.; Brosius, A.M.; Washabaugh, A.R.; Varban, O.A.; Finks, J.F.; Zamarron, B.F.; Flesher, C.G.; et al. Adipose tissue fibrosis, hypertrophy, and hyperplasia: Correlations with diabetes in human obesity. Obesity 2016, 24, 597–605. [Google Scholar] [CrossRef]
  8. Lefterova, M.I.; Lazar, M.A. New developments in adipogenesis. Trends Endocrinol. Metab. 2009, 20, 107–114. [Google Scholar] [CrossRef]
  9. Birari, R.B.; Bhutani, K.K. Pancreatic lipase inhibitors from natural sources: Unexplored potential. Drug Discov. Today 2007, 12, 879–889. [Google Scholar] [CrossRef]
  10. Kim, D.H.; Park, Y.H.; Lee, J.S.; Jeong, H.I.; Lee, K.W.; Kang, T.H. Anti-Obesity Effect of DKB-117 through the Inhibition of Pancreatic Lipase and alpha-Amylase Activity. Nutrients 2020, 12, 3053. [Google Scholar] [CrossRef]
  11. Rajan, L.; Palaniswamy, D.; Mohankumar, S.K. Targeting obesity with plant-derived pancreatic lipase inhibitors: A comprehensive review. Pharmacol. Res. 2020, 155, 104681. [Google Scholar] [CrossRef] [PubMed]
  12. McDuffie, J.R.; Calis, K.A.; Booth, S.L.; Uwaifo, G.I.; Yanovski, J.A. Effects of orlistat on fat-soluble vitamins in obese adolescents. Pharmacotherapy 2002, 22, 814–822. [Google Scholar] [CrossRef] [PubMed]
  13. Karri, S.; Sharma, S.; Hatware, K.; Patil, K. Natural anti-obesity agents and their therapeutic role in management of obesity: A future trend perspective. Biomed. Pharmacother. 2019, 110, 224–238. [Google Scholar] [CrossRef] [PubMed]
  14. Liu, Y.; Ding, W.; Wang, H.L.; Dai, L.L.; Zong, W.H.; Wang, Y.Z.; Bi, J.; Han, W.; Dong, G.J. Gut microbiota and obesity-associated osteoarthritis. Osteoarthr. Cartil. 2019, 27, 1257–1265. [Google Scholar] [CrossRef]
  15. Yu, D.; Meng, X.; de Vos, W.M.; Wu, H.; Fang, X.; Maiti, A.K. Implications of Gut Microbiota in Complex Human Diseases. Int. J. Mol. Sci. 2021, 22, 12661. [Google Scholar] [CrossRef]
  16. Tseng, C.H.; Wu, C.Y. The gut microbiome in obesity. J. Formos. Med. Assoc. 2019, 118 (Suppl. 1), S3–S9. [Google Scholar] [CrossRef]
  17. An, M.Y.; Eo, H.J.; Son, H.J.; Geum, N.G.; Park, G.H.; Jeong, J.B. Antiinflammatory effects of leaf and branch extracts of honeyberry (Lonicera caerulea) on lipopolysaccharidestimulated RAW264.7 cells through ATF3 and Nrf2/HO1 activation. Mol. Med. Rep. 2020, 22, 5219–5230. [Google Scholar] [CrossRef] [PubMed]
  18. Golba, M.; Sokol-Letowska, A.; Kucharska, A.Z. Health Properties and Composition of Honeysuckle Berry Lonicera caerulea L. An Update on Recent Studies. Molecules 2020, 25, 749. [Google Scholar] [CrossRef] [Green Version]
  19. Sharma, A.; Lee, H.J. Lonicera caerulea: An updated account of its phytoconstituents and health-promoting activities. Trends Food Sci. Technol. 2021, 107, 130–149. [Google Scholar] [CrossRef]
  20. Sharma, A.; Kim, J.W.; Ku, S.K.; Choi, J.S.; Lee, H.J. Anti-diabetic effects of blue honeyberry on high-fed-diet-induced type II diabetic mouse. Nutr. Res. Pract. 2019, 13, 367–376. [Google Scholar] [CrossRef]
  21. Park, M.; Yoo, J.H.; Lee, Y.S.; Lee, H.J. Lonicera caerulea Extract Attenuates Non-Alcoholic Fatty Liver Disease in Free Fatty Acid-Induced HepG2 Hepatocytes and in High Fat Diet-Fed Mice. Nutrients 2019, 11, 494. [Google Scholar] [CrossRef] [PubMed] [Green Version]
  22. Lee, Y.S.; Park, E.J.; Kim, S.M.; Kim, J.Y.; Lee, H.J. Anti-Sarcopenic Obesity Effects of Lonicera caerulea Extract in High-Fat Diet-Fed Mice. Antioxidants 2021, 10, 1633. [Google Scholar] [CrossRef]
  23. Nishina, A.; Itagaki, M.; Suzuki, Y.; Koketsu, M.; Ninomiya, M.; Sato, D.; Suzuki, T.; Hayakawa, S.; Kuroda, M.; Kimura, H. Effects of Flavonoids and Triterpene Analogues from Leaves of Eleutherococcus sieboldianus (Makino) Koidz. ‘Himeukogi‘ in 3T3-L1 Preadipocytes. Molecules 2017, 22, 671. [Google Scholar] [CrossRef] [Green Version]
  24. Kim, J.Y.; Park, E.J.; Kim, S.M.; Lee, H.J. Optimization of adipogenic differentiation conditions for canine adipose-derived stem cells. J. Vet. Sci. 2021, 22, e53. [Google Scholar] [CrossRef]
  25. Shimano, H.; Yahagi, N.; Amemiya-Kudo, M.; Hasty, A.H.; Osuga, J.; Tamura, Y.; Shionoiri, F.; Iizuka, Y.; Ohashi, K.; Harada, K.; et al. Sterol regulatory element-binding protein-1 as a key transcription factor for nutritional induction of lipogenic enzyme genes. J. Biol. Chem. 1999, 274, 35832–35839. [Google Scholar] [CrossRef] [PubMed] [Green Version]
  26. Heo, M.G.; Choung, S.Y. Anti-obesity effects of Spirulina maxima in high fat diet induced obese rats via the activation of AMPK pathway and SIRT1. Food Funct. 2018, 9, 4906–4915. [Google Scholar] [CrossRef] [PubMed]
  27. Maeda, H.; Hosokawa, M.; Sashima, T.; Funayama, K.; Miyashita, K. Fucoxanthin from edible seaweed, Undaria pinnatifida, shows antiobesity effect through UCP1 expression in white adipose tissues. Biochem. Biophys. Res. Commun. 2005, 332, 392–397. [Google Scholar] [CrossRef]
  28. Palacios-Gonzalez, B.; Vargas-Castillo, A.; Velazquez-Villegas, L.A.; Vasquez-Reyes, S.; Lopez, P.; Noriega, L.G.; Aleman, G.; Tovar-Palacio, C.; Torre-Villalvazo, I.; Yang, L.J.; et al. Genistein increases the thermogenic program of subcutaneous WAT and increases energy expenditure in mice. J. Nutr. Biochem. 2019, 68, 59–68. [Google Scholar] [CrossRef]
  29. Kim, J.W.; Lee, Y.S.; Seol, D.J.; Cho, I.J.; Ku, S.K.; Choi, J.S.; Lee, H.J. Anti-obesity and fatty liver-preventing activities of Lonicera caerulea in high-fat diet-fed mice. Int. J. Mol. Med. 2018, 42, 3047–3064. [Google Scholar] [CrossRef] [Green Version]
  30. D‘Orazio, N.; Gemello, E.; Gammone, M.A.; de Girolamo, M.; Ficoneri, C.; Riccioni, G. Fucoxantin: A treasure from the sea. Mar. Drugs 2012, 10, 604–616. [Google Scholar] [CrossRef] [Green Version]
  31. Okla, M.; Kim, J.; Koehler, K.; Chung, S. Dietary Factors Promoting Brown and Beige Fat Development and Thermogenesis. Adv. Nutr. 2017, 8, 473–483. [Google Scholar] [CrossRef] [PubMed] [Green Version]
  32. Kleiner, S.; Mepani, R.J.; Laznik, D.; Ye, L.; Jurczak, M.J.; Jornayvaz, F.R.; Estall, J.L.; Chatterjee Bhowmick, D.; Shulman, G.I.; Spiegelman, B.M. Development of insulin resistance in mice lacking PGC-1alpha in adipose tissues. Proc. Natl. Acad. Sci. USA 2012, 109, 9635–9640. [Google Scholar] [CrossRef] [PubMed] [Green Version]
  33. Lee, Y.M.; Kim, Y.S.; Lee, Y.; Kim, J.; Sun, H.; Kim, J.H.; Kim, J.S. Inhibitory activities of pancreatic lipase and phosphodiesterase from Korean medicinal plant extracts. Phytother. Res. 2012, 26, 778–782. [Google Scholar] [CrossRef] [PubMed]
  34. Kwon, O.J.; Lee, H.Y.; Kim, T.H.; Kim, S.G. Antioxidant and pancreatic lipase inhibitory activities of Anemarrhena asphodeloides. Korean J. Food Preserv. 2014, 21, 421–426. [Google Scholar] [CrossRef]
  35. Vijayaraj, P.; Nakagawa, H.; Yamaki, K. Cyanidin and cyanidin-3-glucoside derived from Vigna unguiculata act as noncompetitive inhibitors of pancreatic lipase. J. Food Biochem. 2019, 43, e12774. [Google Scholar] [CrossRef] [PubMed]
  36. Fabroni, S.; Ballistreri, G.; Amenta, M.; Romeo, F.V.; Rapisarda, P. Screening of the anthocyanin profile and in vitro pancreatic lipase inhibition by anthocyanin-containing extracts of fruits, vegetables, legumes and cereals. J. Sci. Food Agric. 2016, 96, 4713–4723. [Google Scholar] [CrossRef]
  37. Lin, C.S.; Chang, C.J.; Lu, C.C.; Martel, J.; Ojcius, D.M.; Ko, Y.F.; Young, J.D.; Lai, H.C. Impact of the gut microbiota, prebiotics, and probiotics on human health and disease. Biomed. J. 2014, 37, 259–268. [Google Scholar]
  38. Torres-Fuentes, C.; Schellekens, H.; Dinan, T.G.; Cryan, J.F. The microbiota-gut-brain axis in obesity. Lancet Gastroenterol. Hepatol. 2017, 2, 747–756. [Google Scholar] [CrossRef]
  39. Kapoor, P.; Kumari, A.; Sheoran, B.; Sharma, S.; Kaur, S.; Bhunia, R.K.; Rajarammohan, S.; Bishnoi, M.; Kondepudi, K.K.; Garg, M. Anthocyanin biofortified colored wheat modifies gut microbiota in mice. J. Cereal Sci. 2022, 104, 103433. [Google Scholar] [CrossRef]
  40. Wu, S.; Hu, R.; Nakano, H.; Chen, K.; Liu, M.; He, X.; Zhang, H.; He, J.; Hou, D.X. Modulation of Gut Microbiota by Lonicera caerulea L. Berry Polyphenols in a Mouse Model of Fatty Liver Induced by High Fat Diet. Molecules 2018, 23, 3213. [Google Scholar] [CrossRef] [Green Version]
  41. Liu, J.; Hao, W.; He, Z.; Kwek, E.; Zhu, H.; Ma, N.; Ma, K.Y.; Chen, Z.Y. Blueberry and cranberry anthocyanin extracts reduce bodyweight and modulate gut microbiota in C57BL/6 J mice fed with a high-fat diet. Eur. J. Nutr. 2021, 60, 2735–2746. [Google Scholar] [CrossRef] [PubMed]
  42. Lee, S.; Keirsey, K.I.; Kirkland, R.; Grunewald, Z.I.; Fischer, J.G.; de La Serre, C.B. Blueberry Supplementation Influences the Gut Microbiota, Inflammation, and Insulin Resistance in High-Fat-Diet-Fed Rats. J. Nutr. 2018, 148, 209–219. [Google Scholar] [CrossRef] [PubMed] [Green Version]
  43. Clarke, S.F.; Murphy, E.F.; O‘Sullivan, O.; Ross, R.P.; O‘Toole, P.W.; Shanahan, F.; Cotter, P.D. Targeting the microbiota to address diet-induced obesity: A time dependent challenge. PLoS ONE 2013, 8, e65790. [Google Scholar] [CrossRef] [PubMed] [Green Version]
  44. He, C.; Cheng, D.; Peng, C.; Li, Y.; Zhu, Y.; Lu, N. High-Fat Diet Induces Dysbiosis of Gastric Microbiota Prior to Gut Microbiota in Association With Metabolic Disorders in Mice. Front. Microbiol. 2018, 9, 639. [Google Scholar] [CrossRef] [PubMed]
  45. Folch, J.; Lees, M.; Sloane Stanley, G.H. A simple method for the isolation and purification of total lipides from animal tissues. J. Biol. Chem. 1957, 226, 497–509. [Google Scholar] [CrossRef]
  46. Park, E.J.; Lee, Y.S.; Kim, S.M.; Park, G.S.; Lee, Y.H.; Jeong, D.Y.; Kang, J.; Lee, H.J. Beneficial Effects of Lactobacillus plantarum Strains on Non-Alcoholic Fatty Liver Disease in High Fat/High Fructose Diet-Fed Rats. Nutrients 2020, 12, 542. [Google Scholar] [CrossRef] [Green Version]
  47. Nakao, R.; Inui, R.; Akamatsu, Y.; Goto, M.; Doi, H.; Matsuoka, S. Illumina iSeq 100 and MiSeq exhibit similar performance in freshwater fish environmental DNA metabarcoding. Sci. Rep. 2021, 11, 15763. [Google Scholar] [CrossRef]
  48. Caporaso, J.G.; Kuczynski, J.; Stombaugh, J.; Bittinger, K.; Bushman, F.D.; Costello, E.K.; Fierer, N.; Pena, A.G.; Goodrich, J.K.; Gordon, J.I.; et al. QIIME allows analysis of high-throughput community sequencing data. Nat. Methods 2010, 7, 335–336. [Google Scholar] [CrossRef] [Green Version]
  49. Quast, C.; Pruesse, E.; Yilmaz, P.; Gerken, J.; Schweer, T.; Yarza, P.; Peplies, J.; Glockner, F.O. The SILVA ribosomal RNA gene database project: Improved data processing and web-based tools. Nucleic Acids Res. 2013, 41, D590–D596. [Google Scholar] [CrossRef]
Figure 1. Effects of HB on pancreatic lipase inhibition and TG contents in the feces for HFD-fed mice. (A) Pancreatic lipase inhibition of HB; (B) fecal TG contents, NC–normal diet control; HC–high-fat diet (HFD) control; PC–HFD with orlistat at 20 mg/kg; HB100–HFD with HB 100 mg/kg; HB200–HFD with HB 200 mg/kg; and HB400–HFD with HB 400 mg/kg. All data are mean ± SD. Significant differences among six groups are expressed as different letters based on one-way ANOVA (p < 0.05), followed by Duncan’s multiple range tests.
Molecules 27 04731 g001
Figure 2. Effects of HB on the epididymal fat weight and adipocyte size in HFD-fed mice. (A) Photography of epididymal fat and hematoxylin and eosin (H&E) staining of epididymal fat tissue; (B) epididymal fat weight; and (C) average adipocyte cell size. All data are mean ± SD. Significant differences among six groups are expressed as different letters based on one-way ANOVA (p < 0.05), followed by Duncan’s multiple range tests.
Molecules 27 04731 g002
Figure 3. Effects of HB on the expression levels of genes related to the lipid metabolism in epididymal fat tissue of HFD-fed mice. All data are mean ± SD. Significant differences among six groups are expressed as different letters based on one-way ANOVA (p < 0.05), followed by Duncan’s multiple range tests.
Molecules 27 04731 g003
Figure 4. Effects of HB on the expression levels of genes related to thermogenesis in the epididymal fat tissue of HFD-fed mice. All data are mean ± SD. Significant differences among six groups are expressed as different letters based on one-way ANOVA (p < 0.05), followed by Duncan’s multiple range tests.
Molecules 27 04731 g004
Figure 5. Fecal microbial relative abundance of phyla. (A) Bar plot represent the relative bacterial phylum abundance. Colors are used to distinguish each taxon. From the bottom, Firmicutes, Bacteroidetes, Actinobacteria, Proteobacteria, Tenericutes, Deferribacteres, Verrucomicrobia, Cyanobacteria, Saccharibacteria, Euryarchaeota, Deinococcus-Thermus, and Fusobacteria are shown. All data are mean ± SD. Significant differences among six groups are expressed as different letters based on one-way ANOVA (p < 0.05), followed by Duncan’s multiple range tests. * p < 0.05, ** p < 0.01 versus HC group. The group means were compared by Student’s t-test.
Molecules 27 04731 g005
Figure 6. Fecal microbial relative abundance of family. (A) Bar plot of relative bacterial family abundance. All data are mean ± SD. Significant differences among six groups are expressed as different letters based on one-way ANOVA (p < 0.05), followed by Duncan’s multiple range tests. * p < 0.05, ** p < 0.01, *** p < 0.001 versus HC group. The group means were compared by Student’s t-test.
Molecules 27 04731 g006
Figure 7. (A) Taxonomic cladogram and (B) linear discriminant analysis (LDA), obtained from LEfSe analysis of the gut microbiota in HC and HB200 groups. The only taxa meeting an LDA-significant threshold of >3 are shown.
Molecules 27 04731 g007
Table 1. Primer sequence used for qRT-PCR.
GenesForward Primer (5′-3′)Reverse Primer (5′-3′)Accession Number
PparγTTTTCAAGGGTGCCAGTTTAATCCTTGGCCCTCTGAGATNM_001127330.2
C/ebpαTTACAACAGGCCAGGTTTCCGGCTGGCGACATACAGTACANM_001287523
Fabp4TCACCTGGAAGACAGCTCCTAATCCCCATTTACGCTGATGNM_024406.3
Srebp1cATCGCAAACAAGCTGACCTGAGATCCAGGTTTGAGGTGGGNM_011480
FasTTGCTGGCACTACAGAATGCAACAGCCTCAGAGCGACAATNM_007988.3
Ucp1CTTTGCCTCACTCAGGATTGGACTGCCACACCTCCAGTCATTNM_009463.3
Ppargc1αATGTGTCGCCTTCTTGCTCTATCTACTGCCTGGGGACCTTNM_008904.2
ActbCCACAGCTGAGAGGAAATCAAGGAAGGCTGGAAAAGAGCNM_007393.5
qRT-PCR, quantitative reverse transcription-polymerase chain reaction; Pparγ, Peroxisome proliferator-activated receptor-gamma; C/ebpα, CCAAT/enhancer-binding protein alpha; Fabp4, Fatty acid-binding protein 4; Srebp1c, Sterol regulatory element binding protein 1c; Fas, Fatty acid synthase; UCP, Uncoupling protein; Ppargc1a, Peroxisome proliferator-activated receptor-gamma coactivator.
Publisher’s Note: MDPI stays neutral with regard to jurisdictional claims in published maps and institutional affiliations.

