Article

Smartphone-Based Dopamine Detection by Fluorescent Supramolecular Sensor

by
Rossella Santonocito
1,
Nunzio Tuccitto
1,2,
Andrea Pappalardo
1,3 and
Giuseppe Trusso Sfrazzetto
1,3,*
1
Department of Chemical Sciences, University of Catania, Viale A. Doria 6, 95100 Catania, Italy
2
Laboratory for Molecular Surfaces and Nanotechnology—CSGI, 95125 Catania, Italy
3
National Interuniversity Consortium for Materials Science and Technology (I.N.S.T.M.) Research Unit of Catania, 95125 Catania, Italy
*
Author to whom correspondence should be addressed.
Molecules 2022, 27(21), 7503; https://doi.org/10.3390/molecules27217503
Submission received: 7 October 2022 / Revised: 28 October 2022 / Accepted: 31 October 2022 / Published: 3 November 2022
(This article belongs to the Special Issue Modern Trends in Fluorescent Probes)

Abstract

:
Supramolecular recognition of dopamine by two quinoxaline cavitands was studied in solution by fluorescence titrations, ESI-MS and ROESY measurements. In addition, the tetraquinoxaline cavitand was dropped onto a siloxane-based polymeric solid support, obtaining a sensor able to detect dopamine in a linear range of concentrations 10 Mm–100 pM, with a detection limit of 1 pM, much lower than the normal concentration values in the common human fluids (plasma, urine and saliva), by using a simple smartphone as detector. This sensor shows also good selectivity for dopamine respect to the other common analytes contained in a saliva sample and can be reused after acid–base cycles, paving the way for the realization of real practical sensor for human dopamine detection.

Graphical Abstract

1. Introduction

Dopamine (DA), a phenethylamine derivative produced by the adrenal medulla, is fundamental in many brain functions. In particular, alteration of DA levels can be related to different diseases, such as Alzheimer [1], schizophrenia [2], Parkinson, Huntington [3] attention-deficit hyperactivity disorder [4] and paragangliomas [5]. For these reasons, DA sensing is crucial to monitoring the human health condition. In normal conditions, the DA concentration in plasma is around 20 ng/mL [6], 18.9 pg/mL in saliva [7] and is 0.2–1 mg/mL in human urine [8]. Different DA detection methods have been reported, including chromatographic [9], electrophoretic [10], electrochemical [11,12,13] and methods based on Surface Plasmon Resonance [14,15]. However, these techniques require expert personal, high-cost, long and complicated analysis. The possibility to obtain a point-of-care DA detection method is undoubtedly interesting and useful for a rapid screening of the DA levels in blood, saliva and urine. To this end, optical or colorimetric sensors are more useful [16,17,18,19,20,21,22,23,24,25,26,27,28]. In addition, the use of a simple smartphone as detector leads to the possibility to a “homemade” DA levels detection. Few examples of smartphone-based methods able to determine the DA concentration, in micromolar ranges, have been reported [29,30,31,32,33,34,35]. In this context, the possibility to restore the starting sensor leads to the opportunity to reuse the device. This goal can be achieved by exploiting the principle of supramolecular chemistry, and in particular the non-covalent interactions between a receptor/host (sensor) and the analyte/guest (DA). To the best of our knowledge, only a few examples of non-covalent sensing of DA have been reported, also exploiting cyclodextrins [36,37,38,39], calixarenes [40,41], pillararenes [42,43] and cucurbiturils [44,45,46,47] in these cases with micromolar ranges of linearity and limits of detection.
Here, we report the first example of DA detection by a reusable solid device exploiting a quinoxaline cavitand as supramolecular receptor, by using a smartphone as detector. This sensor shows, on siloxane-based polymeric solid state, good linearity range (10 mM–100 pM), low limit of detection value (1 pM, corresponding to 87 fg of DA) and excellent selectivity for DA respect to the other common analytes contained in the saliva. Notably, the picomolar limit of detection allows the detection of DA concentrations in real saliva samples. The novelty of this proposed sensor is the possibility to detect DA by supramolecular approach, obtaining a reusable device able to be used with a smartphone as detector. The possibility to monitor DA levels by a simple smartphone leads to the easy homemade DA monitoring. In addition, the high resolution of modern cameras allows the detection of slight changes of color/emission, not easily detectable by the naked eye.
To choose the optimal receptor for dopamine, we focused our attention on two quinoxaline cavitands, Cav-4-Qx and Cav-3-Qx, reported in Chart 1, containing four and three quinoxaline walls, respectively. In particular, DA shows a molecular volume of 315 Å3 (considering van der Waals radius). Considering the ideal guest/host volume ratio (~0.55, known as “The 55% solution”) suggested by Rebek and Mecozzi [48,49], quinoxaline cavitands shows the perfect inner volume (580 Å3) to include DA inside the quinoxaline cavity.

2. Results

Cav-4-Qx and Cav-3-Qx have been synthesized following the reactions showed in Scheme 1. In particular, 1,3 dihydroxybenzene and heptanal have been mixed in acid solution, in high concentration value, leading to resorcinarene 1, which in the presence of potasium carbonate and an excess of 2,3 dichloroquinoxaline, leads to Cav-4-Qx. Excision reaction, using CsF as base and catechol, allows to remove selectively one quinoxaline unit, leading to Cav-3-Qx.
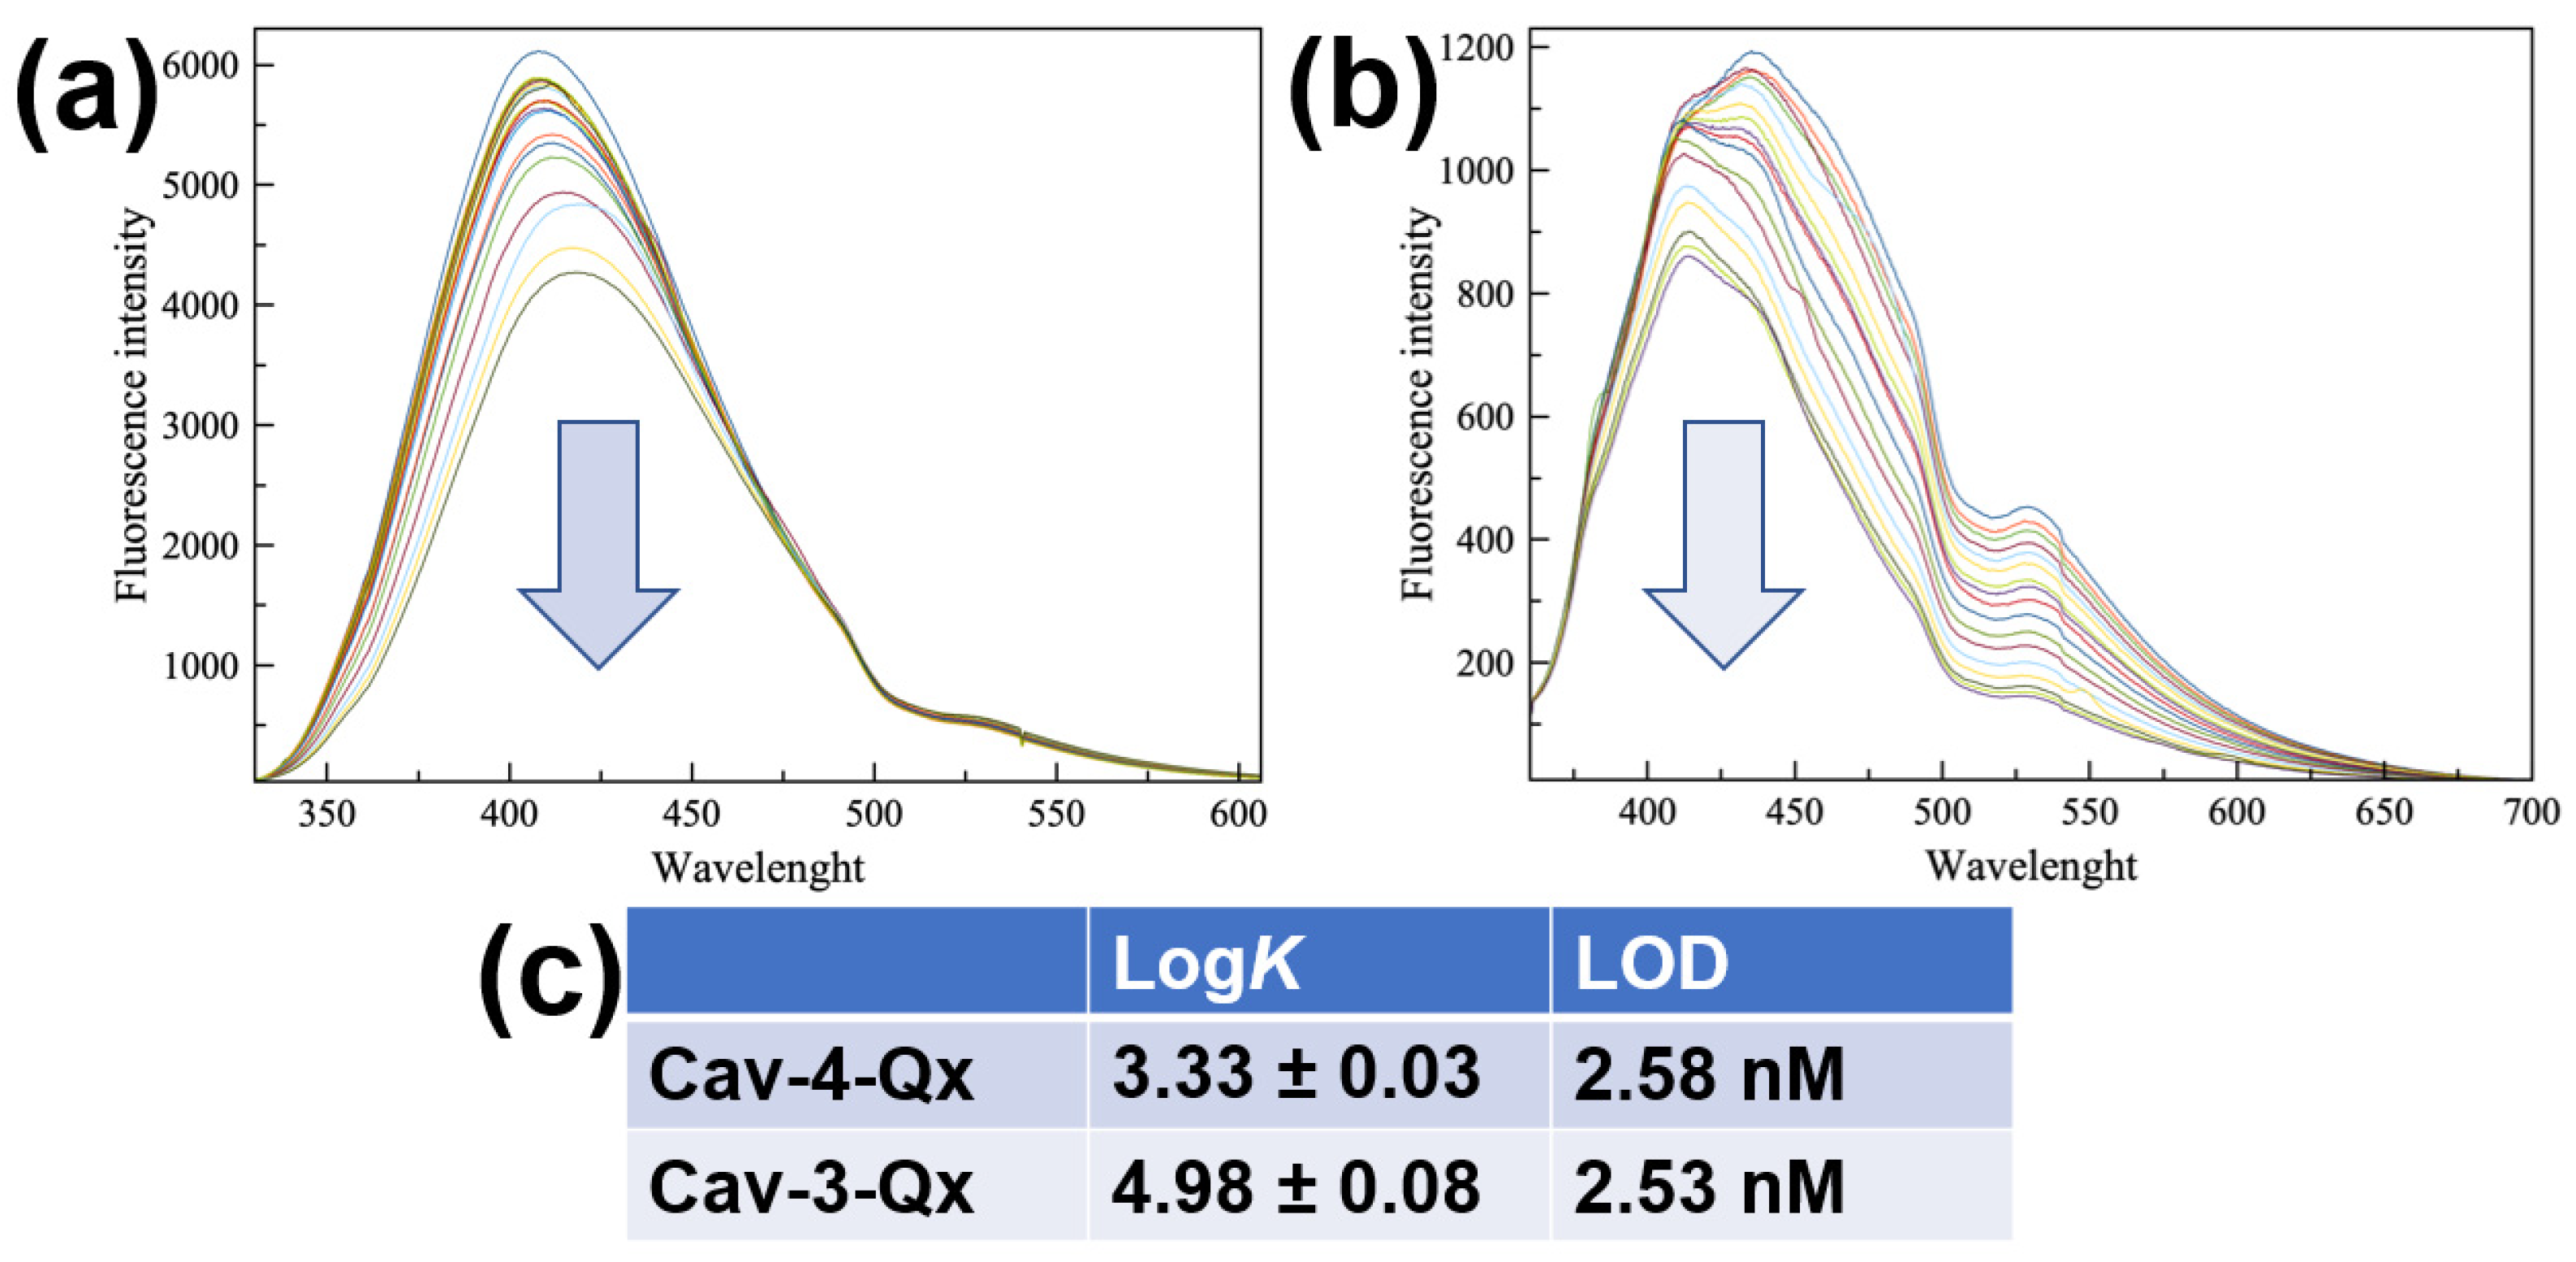
Due to the easy oxidation of dopamine in air, sensing properties have been evaluated by using dopamine hydrochloride (DA, see Chart 1), more stable in normal conditions. Figure 1a,b show the fluorescence titrations of Cav-4-Qx and Cav-3-Qx, respectively, with DA in chloroform solution (see the Supplementary Materials). Cav-4-Qx and Cav-3-Qx have been excited at 320 nm and 340 nm, respectively.
In both cases, a quenching of cavitand emissions can be observed, due to a PET mechanism between quinoxaline units of hosts and DA, also observed with other organic guests in solution [50,51,52,53]. Emission maximum at 408 nm for Cav-4-Qx and 436 nm for Cav-3-Qx have been used to calculate the binding affinity for DA, by using HypSpec software.
Figure 1. Fluorescence titrations between DA and Cav-4-Qx (a) and Cav-3-Qx (b) in CHCl3 ((Host) = 1 × 10⁻⁵ M, (DA) = 0~1.13 × 10⁻⁴ M, λex 320 and 340 nm for Cav-4-Qx and Cav-3-Qx, respectively); (c) binding constant values of supramolecular complexes with DA calculated by HypSpec version 1.1.33 [54,55,56,57], detection limit was calculated by the method of the calibration curve, using the formula LOD = 3σ/K, where s is the standard deviation of the blank and K is the slope of the calibration curve.
Molecules 27 07503 g001
In particular, Cav-4-Qx undergoes to a slight redshift of emission upon the addition of DA (10 nm), probably due to the decrease in energy of the excited state in the supramolecular complex. Cav-3-Qx shows two emission bands (at 411 and 435 nm), which decrease differently. These changes of emission can be related to the variation of energy levels involved in the fluorescence emission after the inclusion of DA.
Figure 1c shows the binding constant values, assuming a 1:1 stoichiometry, as suggested by Job’s Plot experiments (see the Supplementary Materials), and the relative limit of detections (LOD) calculated by the method of the calibration curve. In particular, we observed that Cav-3-Qx shows an affinity for DA more than one order of magnitude higher than Cav-4-Qx, probably due to the absence of a quinoxaline wall (thus leading to a less steric hindrance) and the presence of two free phenolic groups (leading to the possibility to establish hydrogen bonds with the guest). The formation of the supramolecular complexes was further supported by ESI-MS and ROESY measurements. In particular, ESI-MS analysis of an equimolar solution of Cav-4-Qx and DA shows a peak at m/z 1482.9, relative to the 1:1 supramolecular complex (see the Supplementary Materials). The same result has been obtained by the ESI-MS of an equimolar solution of Cav-3-Qx and DA, in which a peak at m/z 1355.6 supported the formation of the 1:1 supramolecular complex (see the Supplementary Materials).
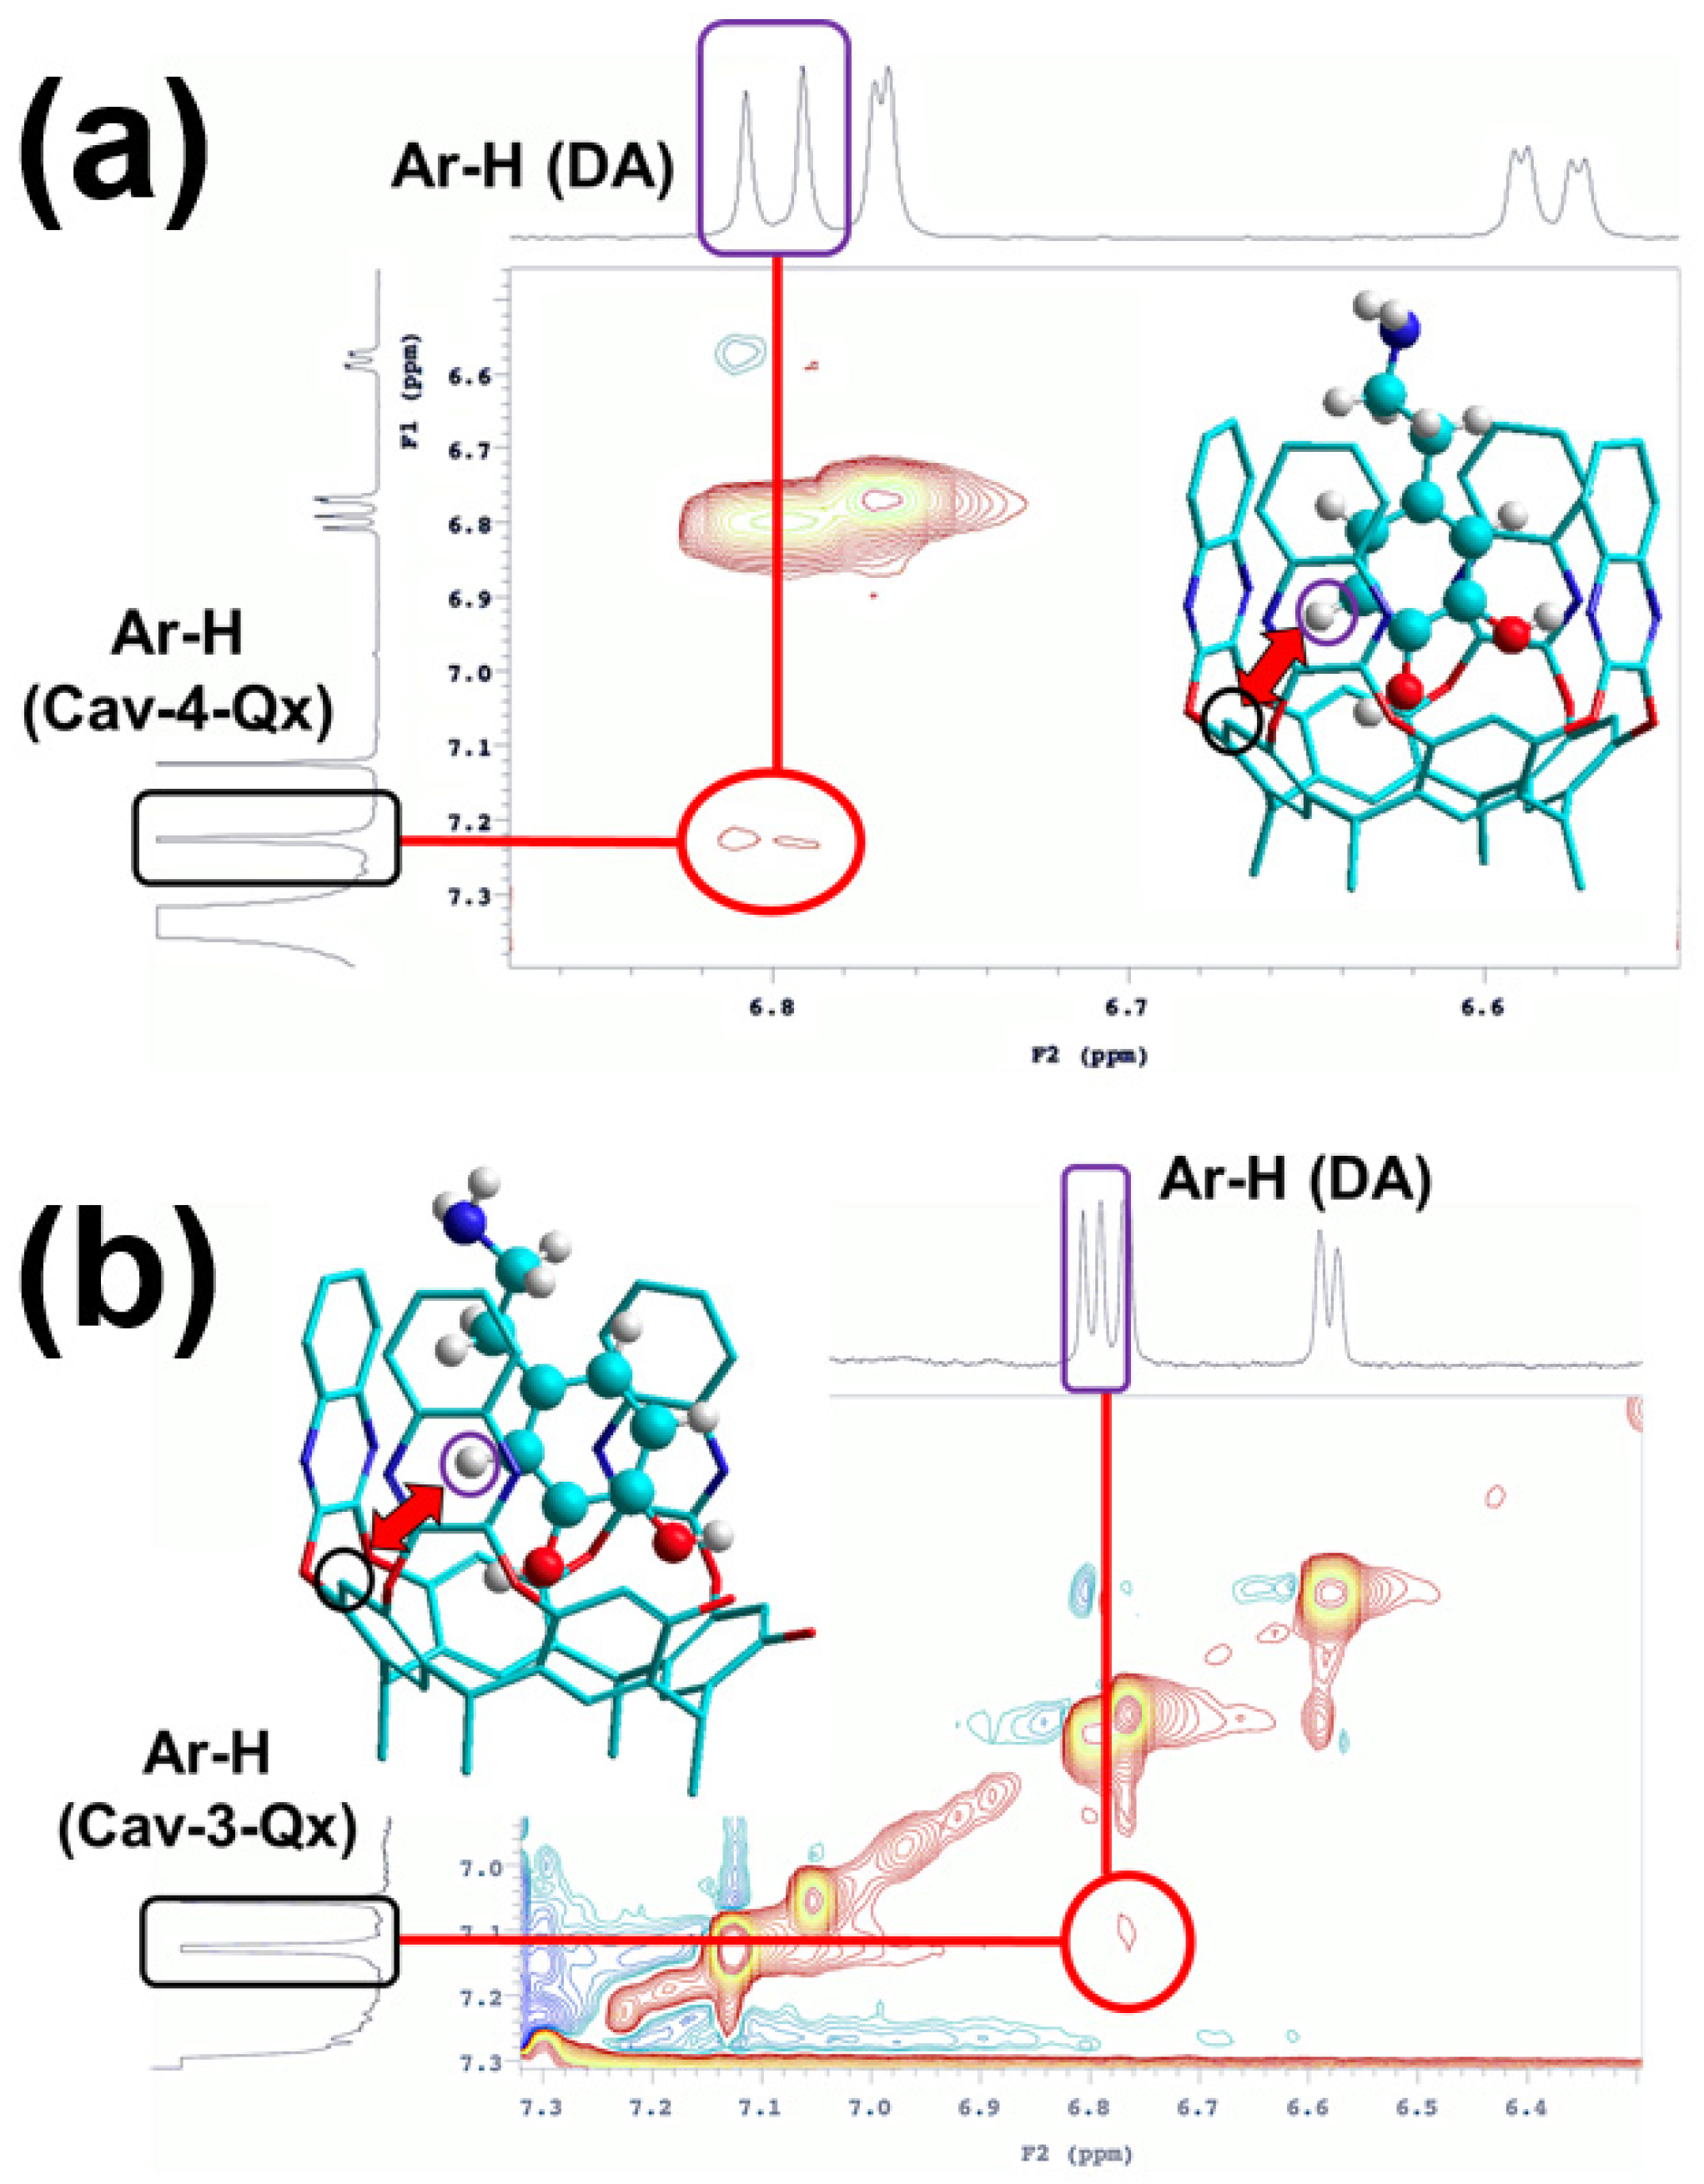
Recognition of DA by Cav-4-Qx and Cav-3-Qx was further supported by the NMR ROESY experiments. In particular, ROESY spectrum of equimolar CDCl3/CD3OD (6/1) solution of Cav-4-Qx and DA shows ROE contact between the upper-rim aromatic proton of resorcinarene scaffold and the aromatic proton of DA (Figure 2a). Similarly, ROESY spectrum of the supramolecular complex between Cav-3-Qx and DA shows similar ROE contact (Figure 2b). In both cases, the ROESY experiment suggests the inclusion of the aromatic ring of DA inside the quinoxaline cavities (1H NMR signals of hosts and guest did not undergo to a significant chemical shift change). These supramolecular complexes can be stabilized by CH-π interactions between aromatic protons of DA and quinoxaline walls of the receptors. In addition, Cav-3-Qx can also further stabilize DA by hydrogen bonds between free phenolic OH groups.
In order to obtain a real practical sensor able to detect DA in real samples, we realized a test strip dropping Cav-4-Qx and Cav-3-Qx onto a siloxane-based polymeric substrate (see Materials and Methods for the details). Unfortunately, Cav-3-Qx dropped onto the siloxane-based polymeric support did not show a significant emission of fluorescence; thus, our studies were performed with Cav-4-Qx. The presence of free OH groups in Cav-3-Qx likely leads to a quenching of emission after deposition. This phenomenon has also been detected using silica gel as solid substrate, during the TLC analyses.
Test strip was prepared by dropping 2 μL of Cav-4-Qx (1 mM in CHCl3) onto the polymeric support. The as-prepared solid sensor was illuminated by UV lamp at 365 nm in a dark chamber room and emission image was acquired by a commercial smartphone (see Materials and Methods for the details). The use of a smartphone as a detector is, in this case, fundamental due to the small emission changes of the Cav-4-Qx upon the exposure to few amounts of DA (femtograms of compound). At this stage, the naked eye cannot recognize this difference of emission.
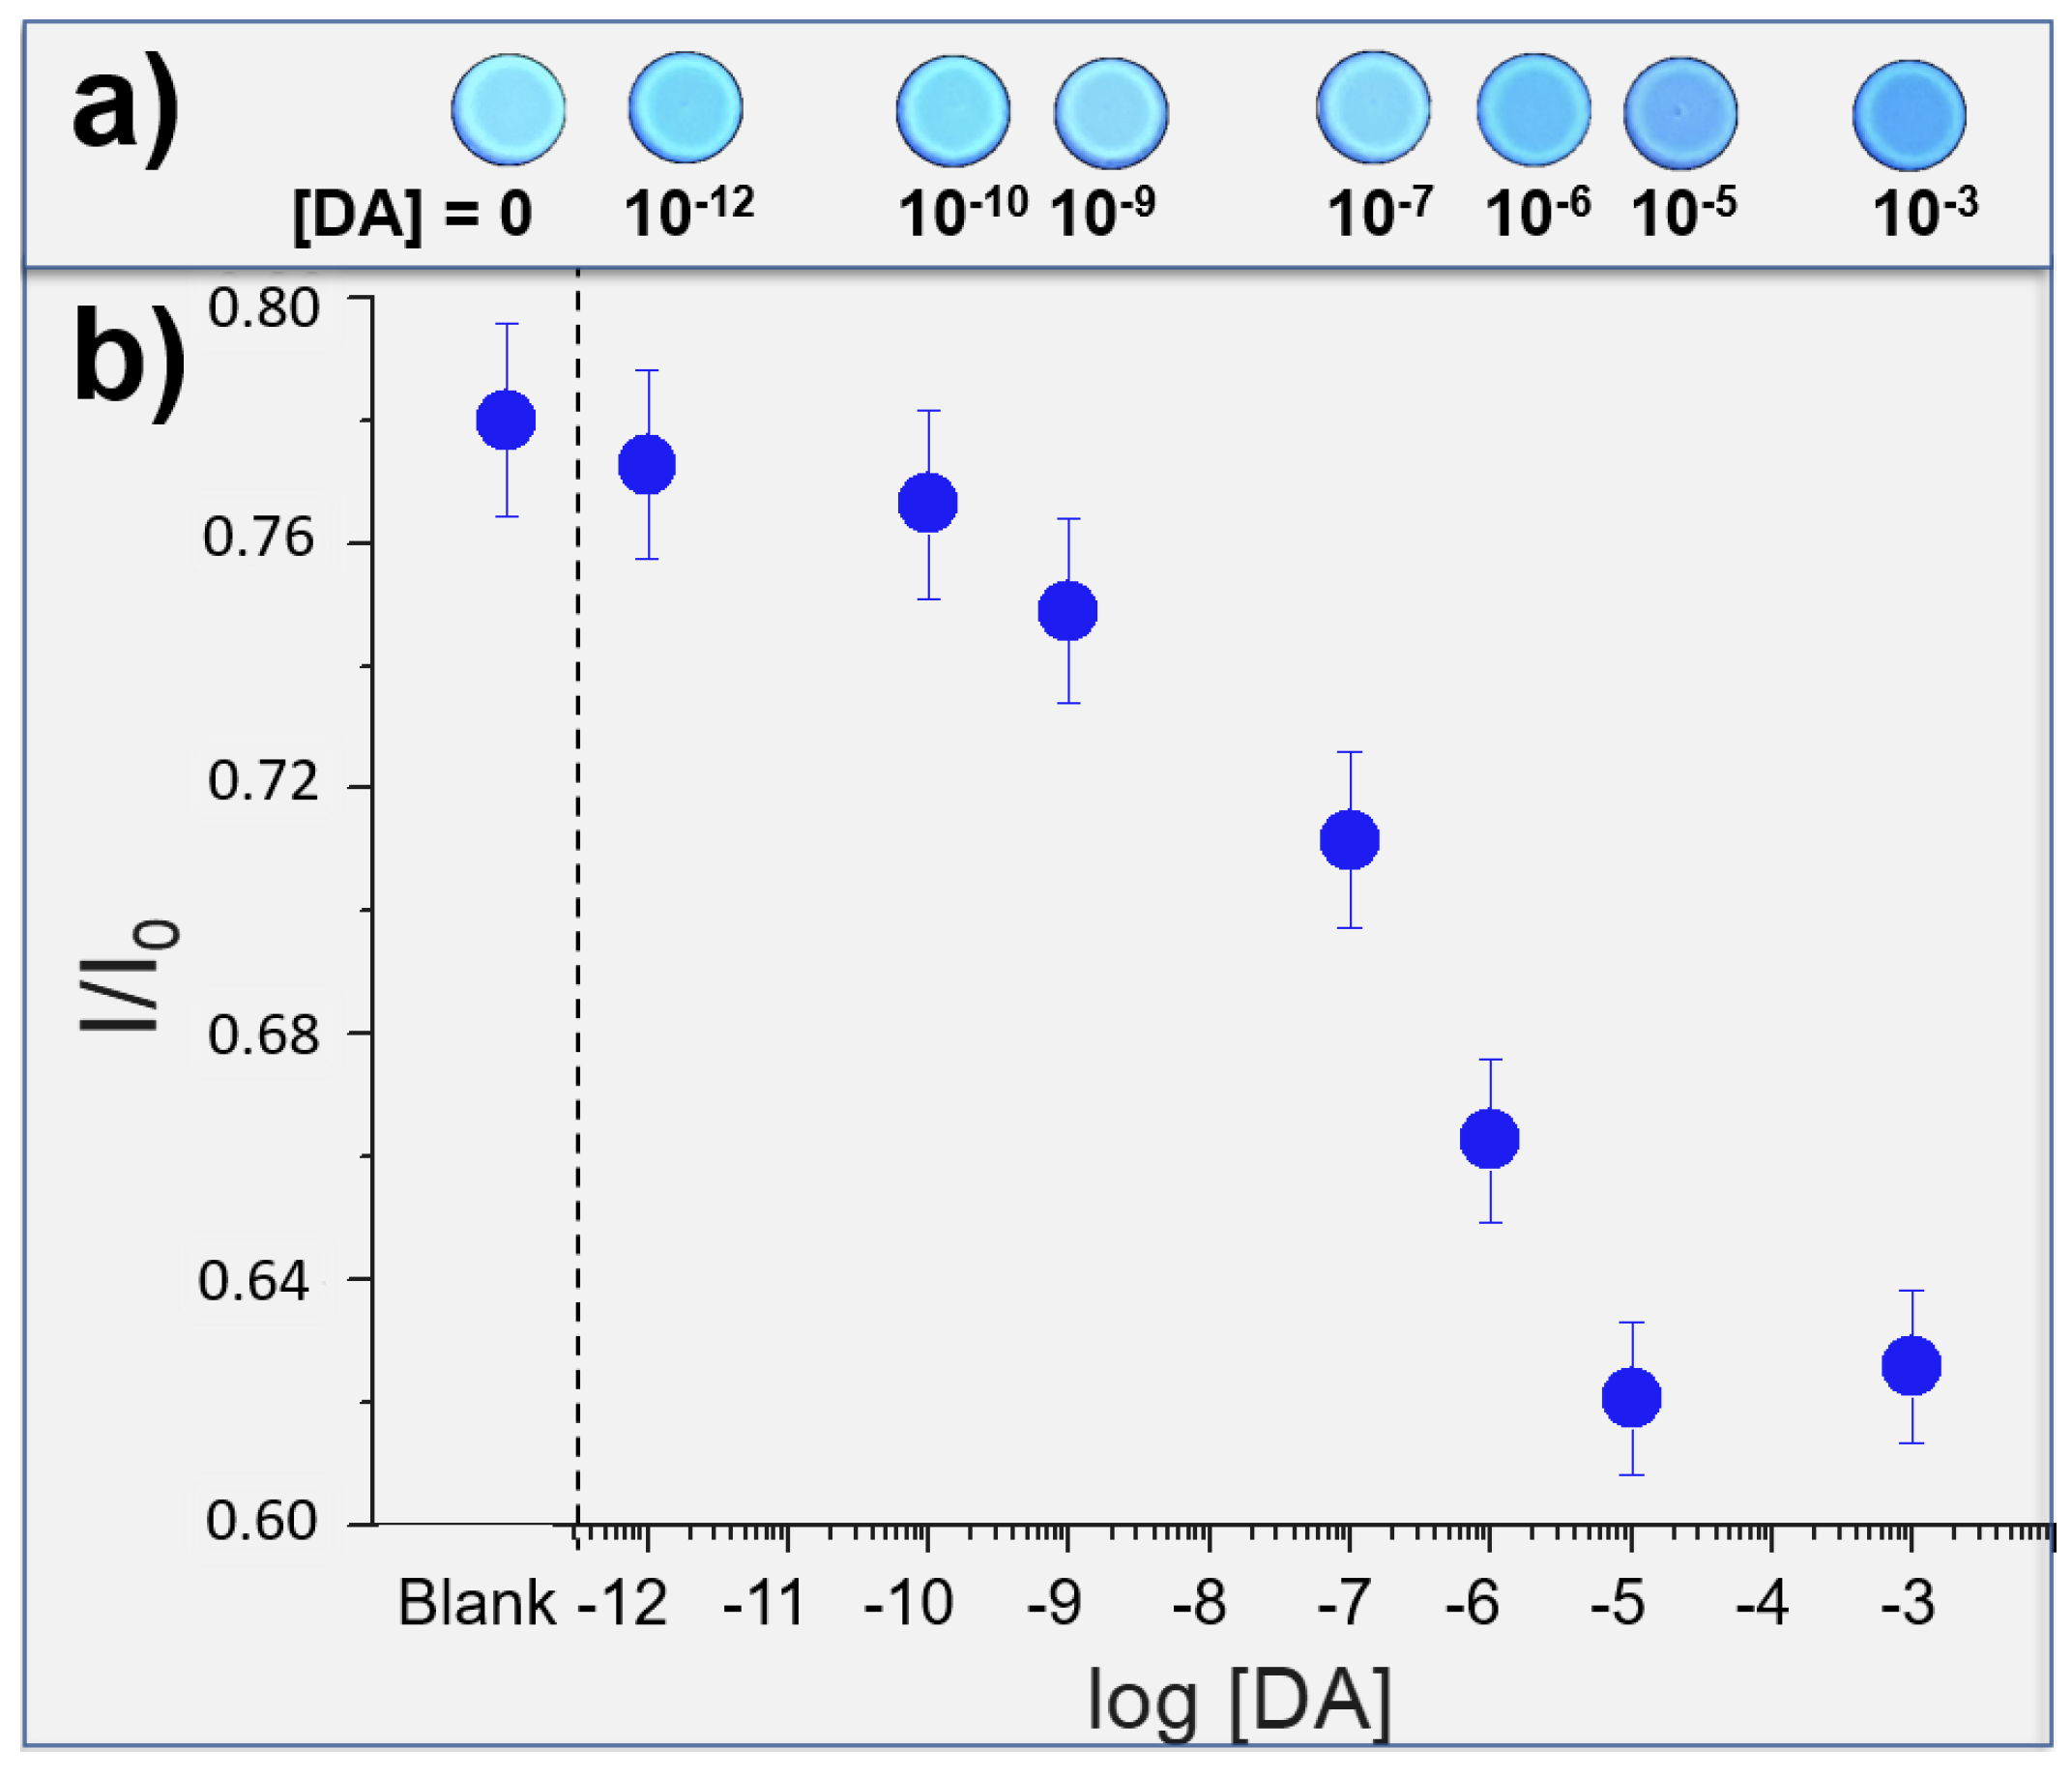
Then, DA solutions (from 10−3 M to 10−12 M solution in EtOH) were nebulized on to the solid sensor and, after the solvent evaporation, new images were acquired (see Figure 3a). These images were elaborated by Fiji software [58], in particular, each image has been converted into RGB channel values, and then converted into Gray scale value (G) by using the formula G = (Rvalue + Gvalue + Bvalue)/3, thus obtaining a single value for each pixel. The emission intensities of G relative to the probe have been compared with the control molecule (phenanthrene, a fluorescent molecule that does not interact with the DA), and these normalized values (ratio between the intensities of the probe and the control) have been reported in Figure 3b, compared with the emission of the Cav-4-Qx without DA (Blank). We can observe detection properties from 1 mM to 1 pM (detection limit, LOD), corresponding to an amount of DA nebulized of 87 mg and 87 fg, respectively (these amounts have been calculated considering the concentration of the solution nebulized and represent the total amount of DA nebulized in each experiment). In addition, a linear trend can be found in the range 10 μM–100 pM. Considering that, DA concentrations in the common human fluids are 0.13 μM, 7 μM and 0.124 nM in plasma, urine and saliva, respectively, our solid sensor should be employed to detect DA in these human matrixes.
We supported in solution the formation of a supramolecular complex between Cav-4-Qx and DA by ROESY and ESI-MS experiments; however, the formation of a similar complex also on solid state cannot be demonstrated.
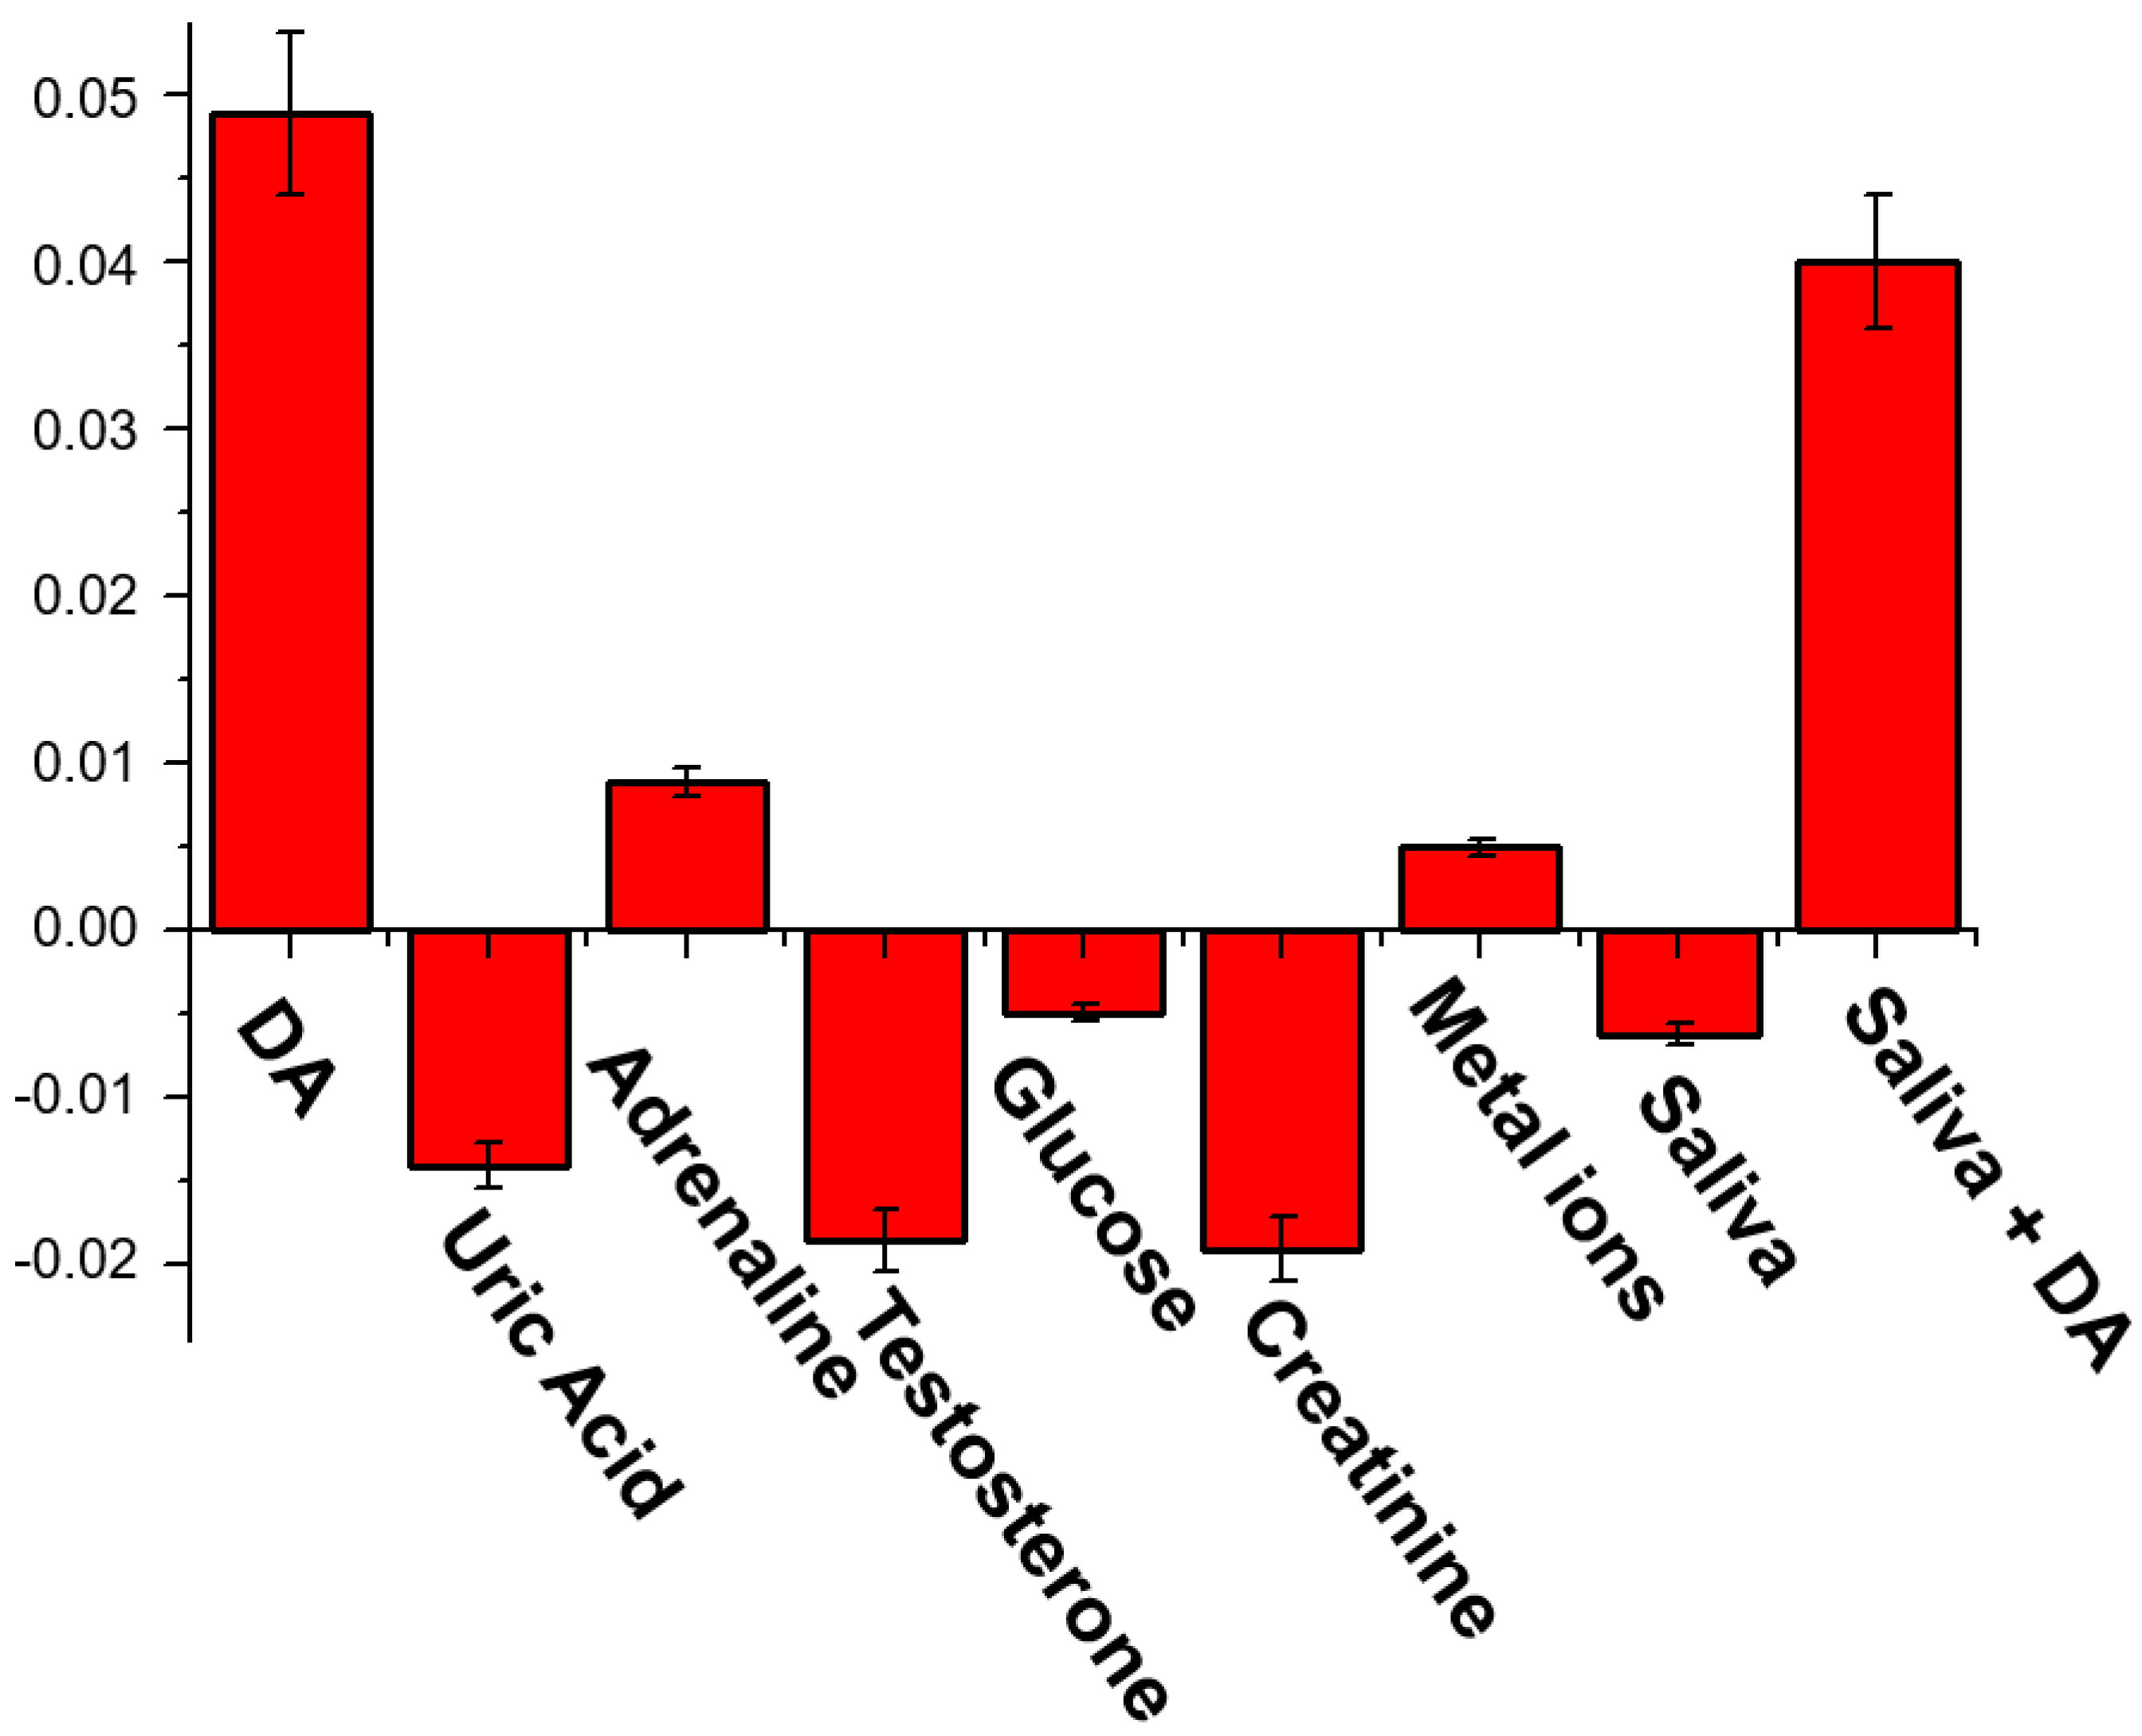
To validate the possibility to use our solid sensor in real life and demonstrate the selectivity for DA with respect to the other common analytes contained in the human fluids, we chose to use saliva as real sample, due to the ease and stress-free sampling and the lower DA concentration respect to the plasma and urine. Firstly, we tested the response of our sensor to some important analytes contained in the human saliva (Figure 4) [59]. In particular, we exposed test strip to DA (0.1 nM), uric acid (20 μM), adrenaline (0.1 nM), testosterone (0.1 pM), glucose (72 μM), creatinine (1 μM) and some metal cations (Mg2+, Ca2+, Mn2+, Fe2+, Cu2+, Zn2+), dissolved in artificial saliva [60]. DA and adrenaline led to an enhancement of the emission, significant only in the case of DA. The other analytes leaded to a quenching of the strip emission.
Then, we exposed our test strip to a real saliva sample, also observing in this case a decrease of the emission of the cavitand onto the solid support. The same sample, after the addition of 0.1 nM of DA, generated an increase of the emission, comparable to the initial 0.1 nM standard DA solution, suggesting the possibility to use this prototype in real samples.
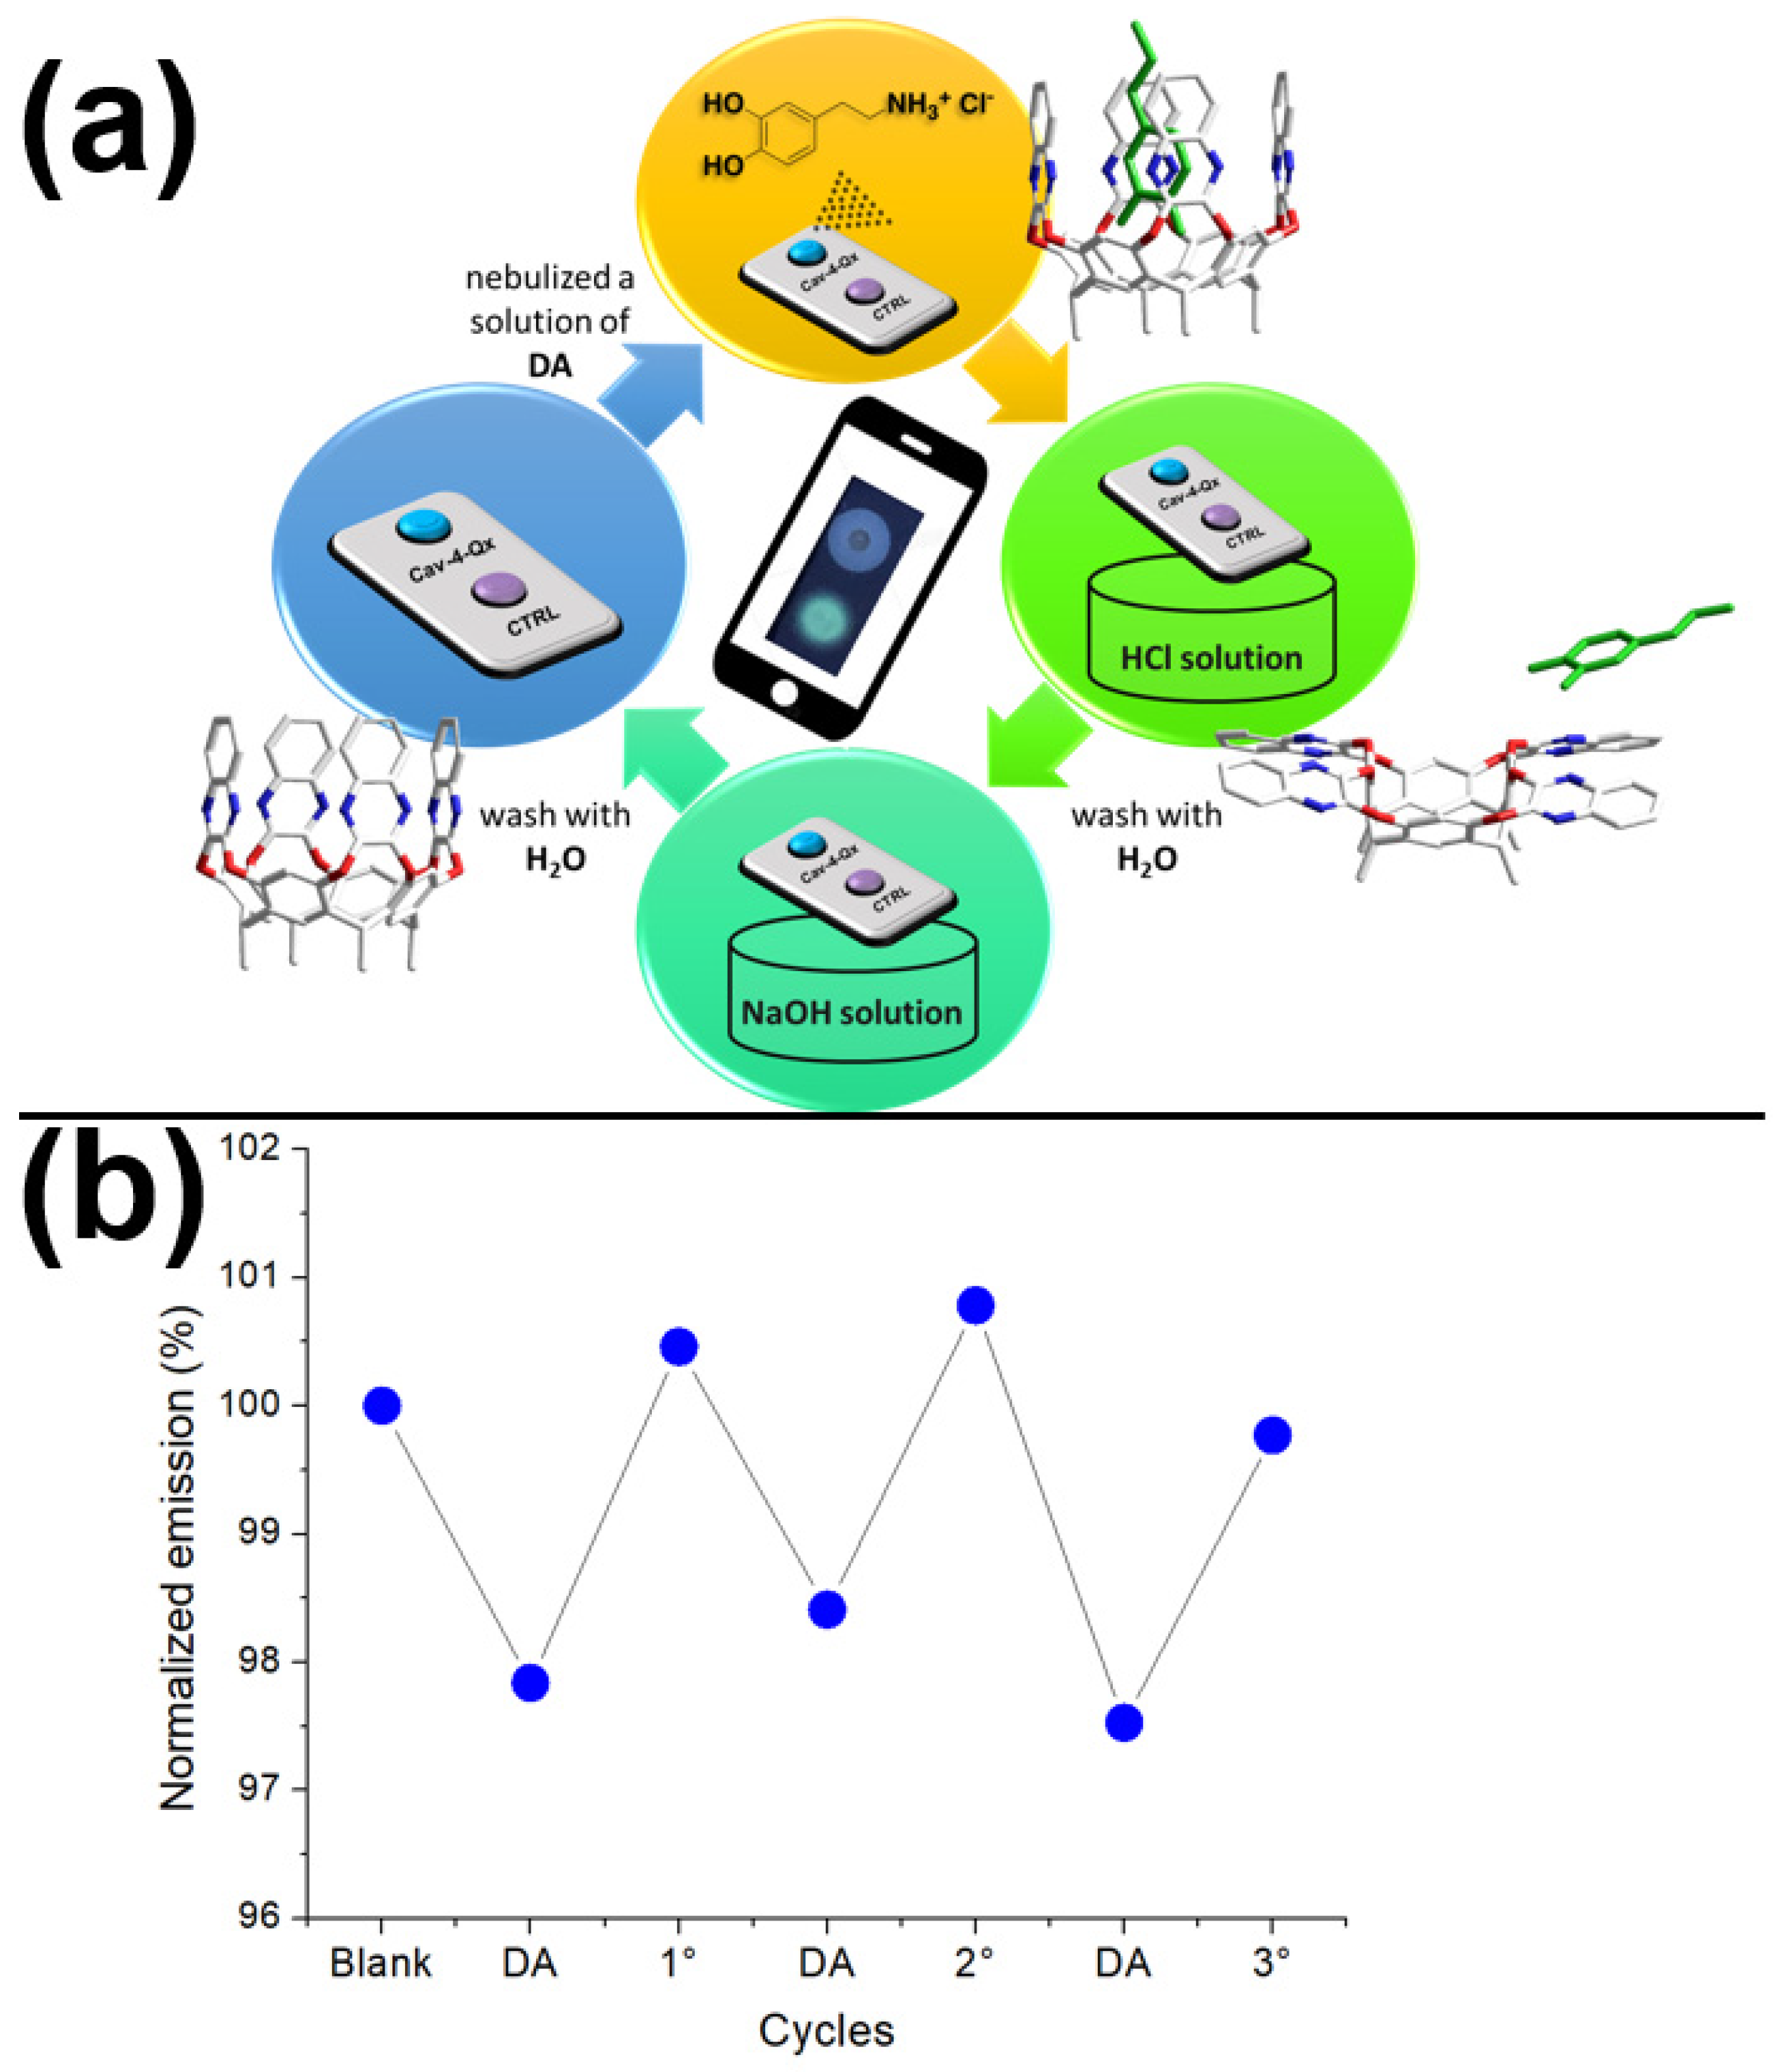
One of the main goals of the Supramolecular approach in the sensing is the reversibility of the non-covalent interactions, leading to the possibility to restore the starting sensor [54,55,57,60]. In this context, we exploited the ability of the quinoxaline cavitand to release a guest inside the hydrophobic cavity by switching from the vase to the kite conformation, at low pH values [61]. Due to the reversibility of this equilibrium, the further increase of the pH value leads to the restoration of the vase conformation, recovering the starting recognition properties (see Figure 5a). Figure 5b shows the possibility to recover the solid sensor by acid–base cycles (see Materials and Methods for details). In particular, after the first DA exposure that leads to a quenching of the emission, the solid sensor can be restored by immersion into a HCl solution (1 mM in water), followed by a second immersion into a NaOH solution (1 mM in water). After this treatment, the emission of the Cav-4-Qx is almost restored. This behavior has been demonstrated for three cycles (see Figure 5b).
Other sensoristic systems has been used by employing a smartphone as detector for DA sensing in real samples. In particular, DA has been detected in urine, with a linear response in the range of micromolar, and a limit of detection under micromolar concentration [8,32]; in plasma with a linear response in the range of nanomolar—micromolar and a detection limit of micromolar concentration [34]; and in sweat with a linear response up to millimolar concentration and a nanomolar limit of detection [31]. Our device, with a picomolar limit of detection and a linearity in the range 10 pM–10 μM, shows better results in these analytical parameters.

3. Materials and Methods

3.1. General Experimental Methods

The NMR experiments were carried out at 27 °C on a Varian UNITY Inova 500 MHz spectrometer (1H at 499.88 MHz, Varian-Agilent, Santa Clara, CA, USA) equipped with pulse field gradient module (Z axis) and a tunable 5 mm Varian inverse detection probe (ID-PFG). ESI mass spectra (AB Sciex, Milan, Italy) were acquired on an API 2000 using CH3CN (positive ion mode). Luminescence measurements were carried out using a Cary Eclipse Fluorescence spectrophotometer (Agilent, Santa Clara, CA, USA) with resolution of 0.5 nm, at room temperature. The emission was recorded at 90° with respect to the exciting line beam using 5:5 slit widths for all measurements. All chemicals were reagent grade and were used without further purification. 3D minimized structures reported in the manuscript and molecular volume of DA and cavitands were obtained using HyperChem v8.0.7, MM+ force field.

3.2. Synthesis of 1

A total of 16.5 g (150 mmol) of resorcinol was dissolved in 20 mL of ethanol and 20 mL of HCl conc. The reaction temperature was cooled at 5 °C and 17.1 mL (150 mmol) of heptanal were added slowly in one hour. The temperature was further increased to reflux for 8 h obtaining a solid precipitate. After the addition of water, the precipitate was filtered and washed with water. Compound 1 (15.8 g, 51%) was crystallized by methanol. 1H NMR (acetone-d6, 500 MHz) δ 0.88 (t, J = 6.5 Hz, 12H, CH3), 1.29 (bs, 32H, CH2), 2.28 (q, J = 6.5 Hz, 8H, CHCH2), 4.23 (t, J = 8 Hz, 4H, CH), 6.23 (s, 4H, Ar–H), 7.54 (s, 4H, ArH), 8.50 (s, 8H, OH). ESI-MS m/z 825 [M+H]+. Anal. Calcd for C52H72O8: C, 75.69; H, 8.80. Found: C, 75.62; H, 8.71.

3.3. Synthesis of Cav-4-Qx

A total of 1.40 g (1.65 mmol) of 1, 2.00 g (10.0 mmol) of 2,3-dichloroquinoxaline and 1.50 g (10.0 mmol) of anhydrous potassium carbonate were mixed in 30 mL of dry DMF. The reaction was stirred at room temperature for 8 h, and then heated at 50 °C for 18 h. The reaction was quenched with 60 mL of water and filtered to obtain a crude solid. Cav-4-Qx (1.10 g, 50%) was isolated after column chromatography (CHCl3:EtOAc 95:5). 1H NMR (CDCl3, 500 MHz) δ 0.92 (t, J = 6.5 Hz, 12H, CH3), 1.29 (bs, 32H, CH2), 2.28 (brq, J = 6.5 Hz, 8H, CHCH2), 5.54 (t, J = 8.0 Hz, 4H, CH), 7.21 (s, 4H, ArH), 7.47–7.79 (m, 16H, ArH), 8.15 (s, 4H, ArH). ESI-MS m/z 1329 [M+H]+. Anal. Calcd for C84H80N8O8: C, 75.88; H, 6.06; N, 8.43; O, 9.63. Found C, 75.81; H, 6.03; N, 8.40.

3.4. Synthesis of Cav-3-Qx

A total of 180 mg (0.136 mmol) of Cav-4-Qx and 411 mg (0.907 mmol) of CsF were mixed in 48 mL of DMF dry. The reaction was heated at 80 °C, and 15.4 mg (0.136 mmol) of catechol were added. The reaction was quenched by addition of 250 mL of brine. The crude solid was washed with water and purified by column chromatography (CH2Cl2:EtOAc 95:5) leading to 91.2 mg of Cav-3-Qx (60%). 1H NMR (CDCl3, 500 MHz): δ 8.23 (s, 2H, ArH), 7.92 (dd, J = 1.0 Hz, 8.0 Hz, 2H, ArH), 7.86 (bs, 2H, OH), 7.81 (m, 2H, ArH), 7.66 (dd, J = 1.0 Hz, 8 Hz, 2H, ArH), 7.54 (t, J = 7.0 Hz, 2H, ArH), 7.49–7.43 (m, 4H, ArH), 7.28 (s, 2H, ArH), 7.13 (s, 2H, ArH), 7.08 (s, 2H, ArH), 5.58 (t, J = 8.0 Hz, 1H, CH), 5.50 (t, J = 8.0 Hz, 2H, CH), 4.25 (t, J = 8.0 Hz, 1H, CH), 2.29–2.16 (m, 8H, CH2(CH2)3CH3), 1.46–1.24 (m, 32H, CH2(CH2)3CH3), 0.93 (t, J = 7.0 Hz, 12H, CH3). ESI-MS m/z 1202 [M+H]+. Anal. Calcd. For C76H78N6O8 C, 75.85; H, 6.53; N, 6.98; O, 10.64. Found C, 75.77; H, 6.45; N, 6.89.

3.5. Procedure for Fluorescence Titrations

Two mother solutions of host and guest (1.0 × 10⁻³ M) in dry solvent (cavitands were solubilized in CHCl3 and DA in EtOH) were prepared. From these, different solutions with different ratio receptor/guest were prepared.
Fluorescence titration of Cav-4-Qx and DA was carried out using λex = 320 nm in dry CHCl3, recording at λem = 408 nm at 25 °C. Fluorescence titration of Cav-3-Qx and DA was carried out in dry CHCl3, using λex = 340, recording at λem = 436 nm, at 25 °C. With this data treatment, the apparent binding affinities of receptors with DA were estimated using HypSpec (version 1.1.33, Protonic Software, Florence, Italy)) [54,55,56,57], a software designed to extract equilibrium constants from potentiometric and/or spectrophotometric titration data. HypSpec starts with an assumed complex formation scheme and uses a least-squares approach to derive the spectra of the complexes and the stability constants. Χ2 test (chi-square) was applied, where the residuals follow a normal distribution (for a distribution approximately normal, the χ2 test value is around 12 or less). In all of the cases, χ2 ≤ 10 were found, as obtained by 3 independent measurements sets.

3.6. Determination of Stoichiometry

Stoichiometry of the complexes were investigated by the Job’s plot method, using spectrophotometric measurements. The samples were prepared by mixing equimolecular stock solutions (1.0 × 10⁻³ M) of the appropriate host and guest to cover the whole range of molar fractions, keeping constant the total concentration (1 × 10⁻⁵ M). The changes in absorbance compared to uncomplexed receptor species (ΔA × χ−1) were calculated and reported versus the receptor mole fraction (χ). These plots show invariably a maximum at 0.5 mol fraction of receptor, thus suggesting its 1:1 complex formation.

3.7. Preparation of Solid Support

The siloxane-based polymeric support was prepared by mixing a precursor based on dodecamethylcyclohexasiloxane with a cross-linking agent (5 wt%) according to the producer instruction. The product is commercially available from Reschimica S.r.l. (Florence, Italy). It was used as received. Following vigorous mixing for about 10 min of the two components, the product was poured onto a solid glass substrate and incubated in an oven at 120 °C for 2 h. The mixture also contains silica to make the final polymer white in color.

3.8. Procedure for Sensing by Strip Test

In a 1.5 × 1.0 cm of siloxane-based polymeric support we dropped on different positions 2 μL of the Cav-4-Qx (1 × 10⁻³ M in CHCl3) and 2 μL of the phenanthrene (1 × 10⁻³ M in CHCl3). The solid sensor was illuminated with a UV lamp (365 nm) in a dark chamber and the visible emission image was acquired with a smartphone (iPhone 13, 24 Mpixel). Then, 10 nebulizations (having a total amount of 460 μL) of a solution of the DA (from 10−3 M to 10−12 M in EtOH) was nebulized by a conical nebulizer onto the sensor. The amounts of nebulized DA (87 μg~87 fg) have been calculated from the respective concentrations of the solutions of DA and the volume nebulized. After evaporation on air at room temperature of the nebulized solvent, the solid sensor was further photographed, and the images before and after nebulization have been elaborated by Fiji [58]. In particular, images have been converted in RGB channel values, and converted into Gray scale value (G) by using the formula G = (Rvalue + Gvalue + Bvalue)/3, thus obtaining a single value for each pixel. The emission intensities of this scale for each probe have been compared to the control (phenanthrene), and these normalized values (ratio between the intensity of the Cav-4-Qx probe and the intensity of the control) have been reported. The resulting values were tabulated for statistical treatment using the Excel software (Microsoft 365).

3.9. Procedure for Sensing by Strip Test-Experimental Setup

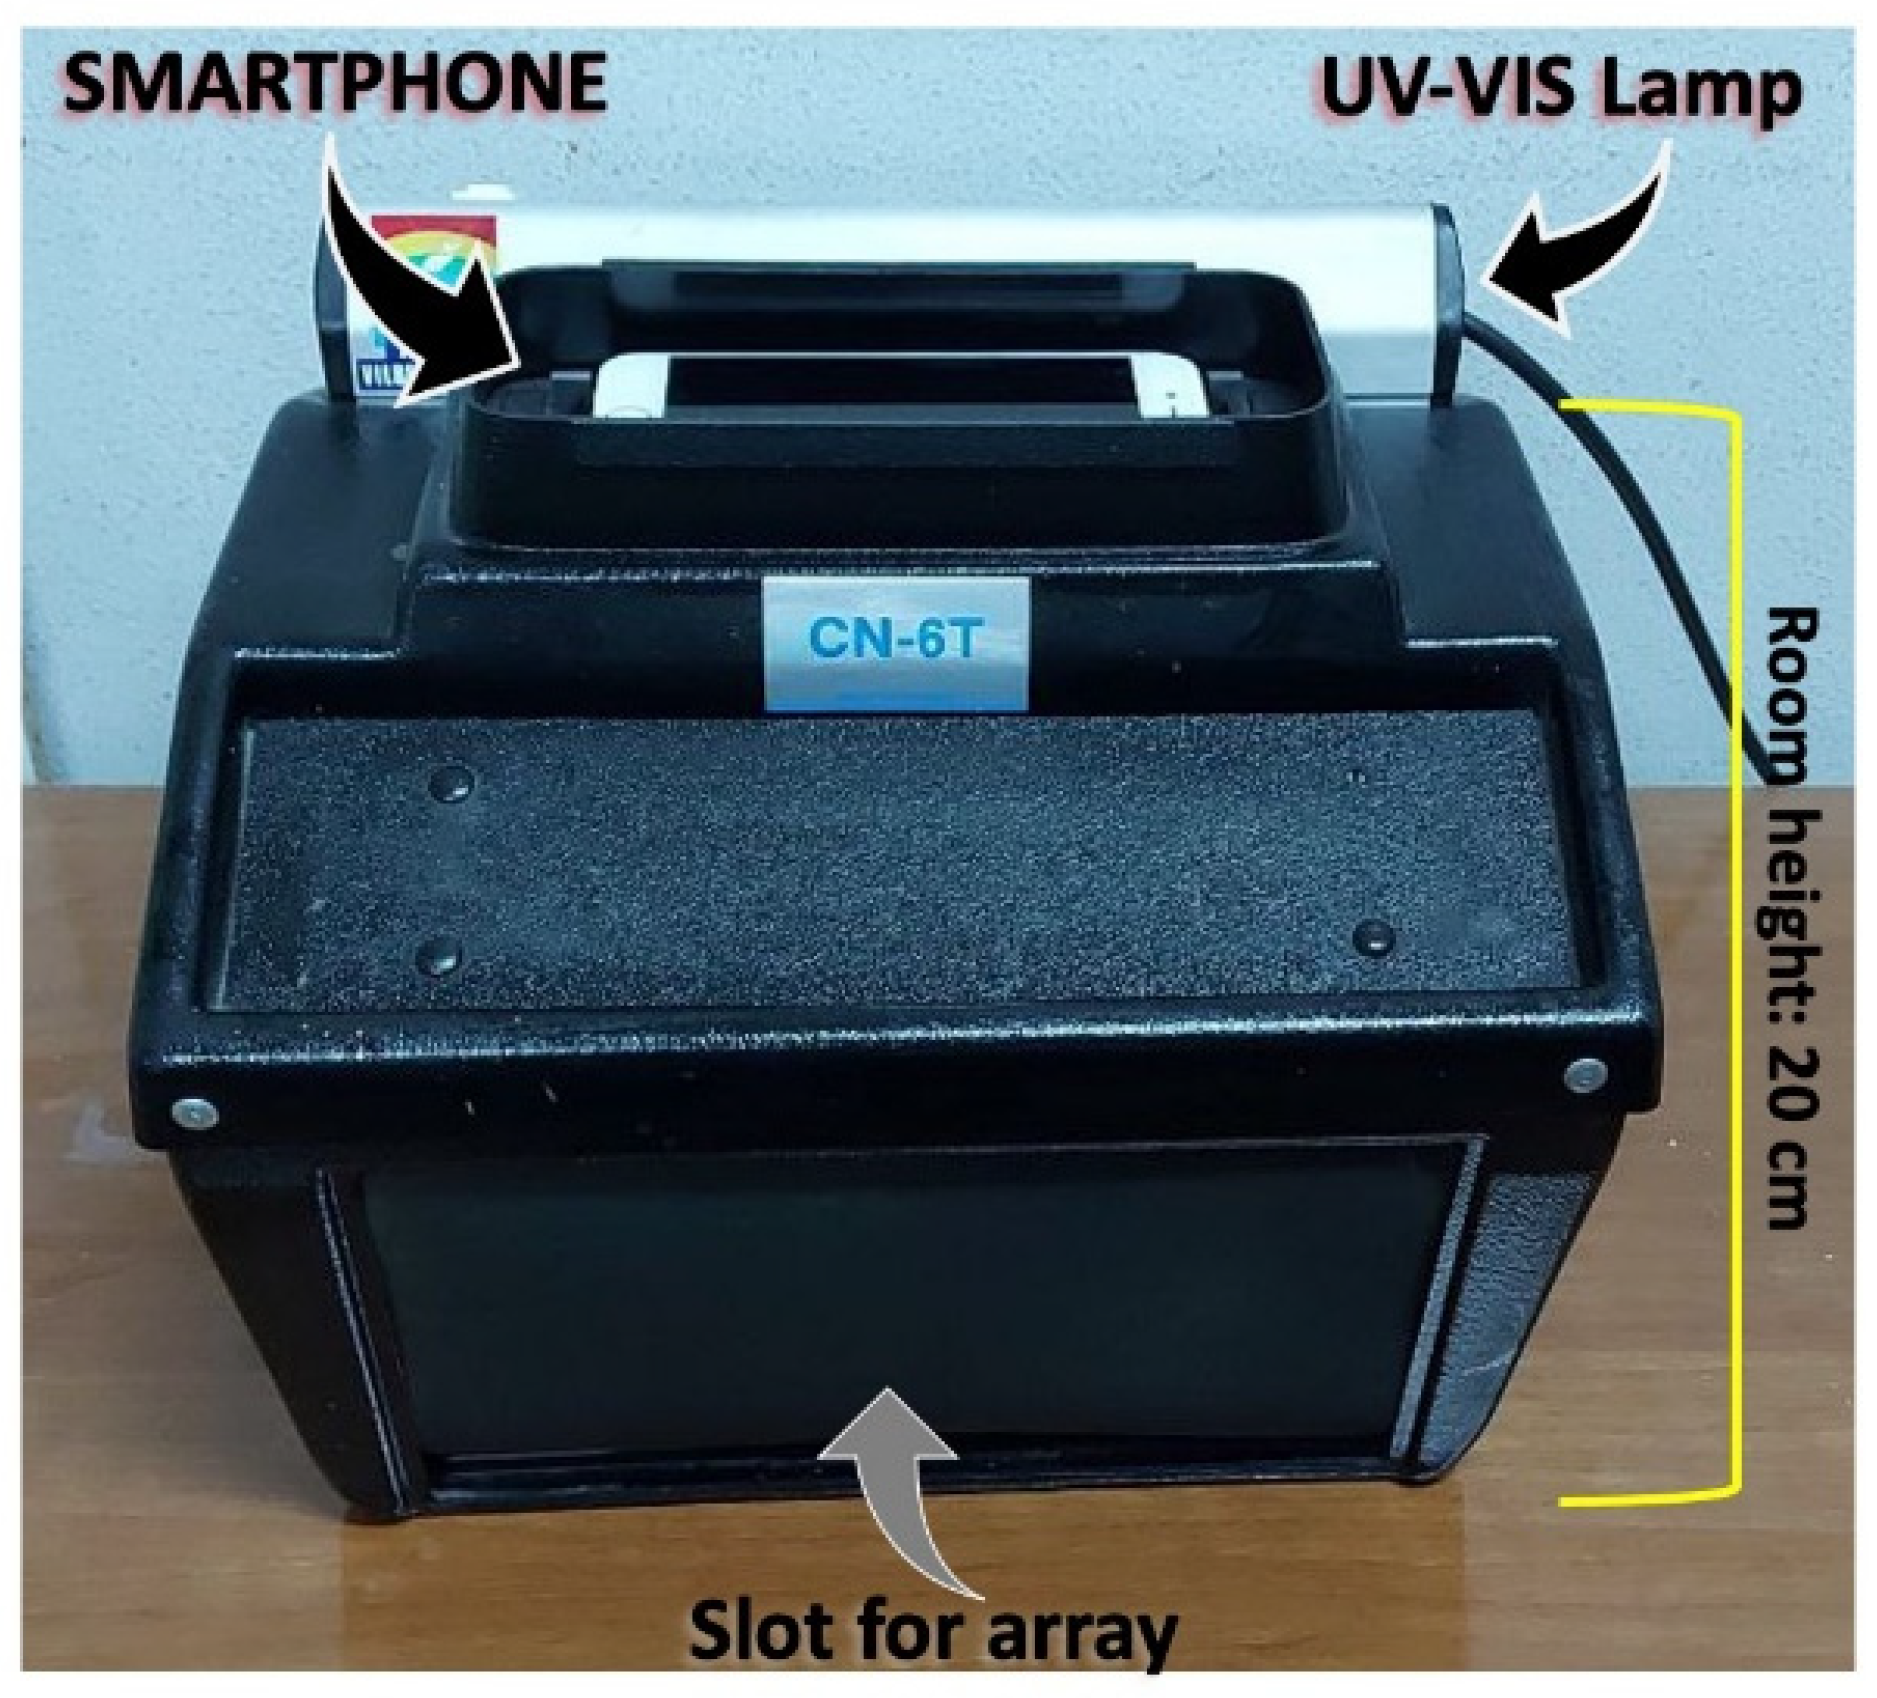
UV-Vis lamp power 6W, excitation wavelength 365 nm. The position of the solid sensor into the dark chamber can be modified, due to the presence of the control probe. In fact, the possible variations of the irradiation are normalized by the comparison with the control. The solid sensor is located at 20 cm from the smartphone and UV source. The dark chamber used is reported in Figure 6.

3.10. Recovery

The recovery of the solid sensor was tested by performing an acid–base cycle. Firstly, DA (1.0 × 10⁻³ M in EtOH) was nebulized onto the solid sensor, which was dried in air for 30 s and images have been acquired as reported above. Then, the solid sensor was immerged in a solution of HCl (1.0 × 10⁻³ M in water) for 1 min, in pure water for other 30 s, in a solution of NaOH (1.0 × 10⁻³ M in water) for 1 min, and then in pure water for other 30 s. At the end, the image was acquired. The cycle was repeated three times.

4. Conclusions

In conclusion, the possibility to use quinoxaline cavitands for the supramolecular recognition of dopamine has been demonstrated both in solution and in solid state. In fact, the formation of supramolecular complexes with dopamine has been supported by fluorescence titrations, ESI-MS and ROESY measurements, with a nanomolar detection limit in solution. In addition, the tetraquinoxaline cavitand has been used to create a solid sensor by using siloxane-based polymeric as solid support. This new device shows a linear emission response to DA in the range 10 mM~100 pM, with a 1 pM detection limit on solid phase. Due to the DA concentration values in the common human fluids (0.13 mM in plasma, 7 mM in urine and 0.124 nM in saliva), this study represents proof of concept for the realization of real sensors for the easily detection of human dopamine. Further studies are ongoing to (i) optimize the deposition of the cavitand onto the siloxane-based polymeric support (also by an inkjet-printer); (ii) optimize the portability of the system, by using commercial UV lamps and optical fibers as detector, and (iii) detect other important biomarkers, such as cortisol, by using the array technology.

Supplementary Materials

The following supporting information can be downloaded at: https://www.mdpi.com/article/10.3390/molecules27217503/s1, Fluorescence titrations, Job’s Plots, HypSpec results, ESI-MS of supramolecular complexes, ROESY spectra.

Author Contributions

Conceptualization, G.T.S. and R.S.; methodology, R.S.; validation, N.T. and A.P.; formal analysis, A.P.; data curation, N.T. and R.S.; writing—original draft preparation, G.T.S.; funding acquisition, G.T.S. All authors have read and agreed to the published version of the manuscript.

Funding

This research was funded by the University of Catania for financial support. G.T.S. acknowledges the University of Catania for the funding received under the Starting Grant entitled “DetCWAs” (PIA.CE.RI 2020–2022-Linea Intervento 3). A.P. acknowledges the funding received on this project from Università degli Studi di Catania under the Grant Scheme PIACERI with the project MAF-moF “Materiali multifunzionali per dispositivi micro-optofluidici”. There are no conflicts to declare.

Institutional Review Board Statement

Not applicable.

Informed Consent Statement

Written informed consent has been obtained from the patient (Rossella Santonocito) to publish this paper.

Data Availability Statement

Cav-4-Qx, Cav-3-Qx and all data reported in this work can be obtained by the authors, after formal request.

Acknowledgments

The authors thank the University of Catania for the support.

Conflicts of Interest

The authors declare no conflict of interest.

Sample Availability

Samples of the compounds 1, Cav-4-Qx and Cav-3-Qx, are available from the authors.

References

  1. Wang, Y.; Kang, K.; Wang, S.; Kang, W.; Cheng, C.; Niu, L.M.; Guo, Z. A novel label-free fluorescence aptasensor for dopamine detection based on an Exonuclease III- and SYBR Green I- aided amplification strategy. Sens. Actuators B 2020, 305, 127348. [Google Scholar] [CrossRef]
  2. Meyer-Lindenberg, A.; Miletich, R.S.; Kohn, P.D.; Esposito, G.; Carson, R.E.; Quarantelli, M.; Weinberger, D.R.; Berman, K.F. Reduced prefrontal activity predicts exaggerated striatal dopaminergic function in schizophrenia. Nat. Neurosci. 2002, 5, 267–271. [Google Scholar] [CrossRef] [PubMed]
  3. Vidoni, C.; Secomandi, E.; Castiglioni, A.; Melone, M.A.B.; Isidoro, C. Resveratrol protects neuronal-like cells expressing mutant Huntingtin from dopamine toxicity by rescuing ATG4-mediated autophagosome formation. Neurochem. Int. 2018, 117, 174–187. [Google Scholar] [CrossRef]
  4. Zhou, J.; Wang, W.; Yu, P.; Xiong, E.; Zhang, X.; Chen, J. A simple label-free electrochemical aptasensor for dopamine detection. RSC Adv. 2014, 4, 52250–52255. [Google Scholar] [CrossRef]
  5. Li, B.-R.; Hsieh, Y.-J.; Chen, Y.-X.; Chung, Y.-T.; Pan, C.-Y.; Chen, Y.-T. An ultrasensitive nanowire-transistor biosensor for detecting dopamine release from living PC12 cells under hypoxic stimulation. J. Am. Chem. Soc. 2013, 135, 16034–16037. [Google Scholar] [CrossRef]
  6. Turkmen, D.; Bakhshpour, M.; Gokturk, I.; Asir, S.; Yilmaz, F.; Denizli, A. Selective dopamine detection by SPR sensor signal amplification using gold nanoparticles. New J. Chem. 2021, 45, 18296–18306. [Google Scholar] [CrossRef]
  7. Okumura, T.; Nakajima, Y.; Matsuok, M.; Takamatsu, T. Study of salivary catecholamines using fully automated column-switching high-performance liquid chromatography. J. Chromatogr. B 1997, 694, 305–316. [Google Scholar] [CrossRef]
  8. Ji, D.; Liu, Z.; Liu, L.; Low, S.S.; Lu, Y.; Yu, X.; Zhu, L.; Li, C.; Liu, Q. Smartphone-based integrated voltammetry system for simultaneous detection of ascorbic acid, dopamine, and uric acid with graphene and gold nanoparticles modified screen-printed electrodes. Biosens. Bioelectron. 2018, 119, 55–62. [Google Scholar] [CrossRef]
  9. Syslova, K.; Rambousek, L.; Kuzma, M.; Najmanovà, V.; Bubenikova-Valesova, V.; Slamberova, R.; Kacer, P. Monitoring of dopamine and its metabolites in brain microdialysates: Method combining freeze-drying with liquid chromatography-tandem mass spectrometry. J. Chromatogr. A 2011, 1218, 3382–3391. [Google Scholar] [CrossRef]
  10. Claude, B.; Nehme, R.; Morin, P. Analysis of urinary neurotransmitters by capillary electrophoresis: Sensitivity enhancement using field-amplified sample injection and molecular imprinted polymer solid phase extraction. Anal. Chim. Acta 2011, 699, 242–248. [Google Scholar] [CrossRef]
  11. Jackowska, K.; Krysinski, P. New trends in the electrochemical sensing of dopamine. Anal. Bioanal. Chem. 2013, 405, 3753–3771. [Google Scholar] [CrossRef] [PubMed] [Green Version]
  12. Rahman, M.; Lee, J.-J. Electrochemical Dopamine Sensors Based on Graphene. J. Electrochem. Sci. Technol. 2019, 10, 185–195. [Google Scholar]
  13. Sun, X.; Zhang, L.; Zhang, X.; Liu, X.; Jian, J.; Kong, D.; Zeng, D.; Yuan, H.; Feng, S. Electrochemical dopamine sensor based on superionic conducting potassium ferrite. Biosens. Bioelectron. 2020, 153, 112045. [Google Scholar] [CrossRef] [PubMed]
  14. Eddin, F.B.K.; Fen, Y.W.; Sadrolhosseini, A.R.; Liew, J.Y.C.; Daniyal, W.M.E.M.M. Optical Property Analysis of Chitosan-Graphene Quantum Dots Thin Film and Dopamine Using Surface Plasmon Resonance Spectroscopy. Plasmonic 2022, 17, 1985–1997. [Google Scholar] [CrossRef]
  15. Rithesh Raj, D.; Prasanth, S.; Vineeshkumar, T.V.; Sudarsanakumar, C. Surface plasmon resonance based fiber optic dopamine sensor using green synthesized silver nanoparticles. Sens. Actuators B 2016, 224, 600–606. [Google Scholar] [CrossRef]
  16. Rostami, S.; Mehdinia, A.; Jabbari, A.; Kowsari, E.; Niroum, R.; Booth, T.J. Colorimetric sensing of dopamine using hexagonal silver nanoparticles decorated by task-specific pyridinum based ionic liquid. Sens. Actuators, B 2018, 271, 64–72. [Google Scholar] [CrossRef]
  17. Yildirim, A.; Mehmet, M. Turn-on Fluorescent Dopamine Sensing Based on in Situ Formation of Visible Light Emitting Polydopamine Nanoparticles. Anal. Chem. 2014, 86, 5508–5512. [Google Scholar] [CrossRef]
  18. Baluta, S.; Malecha, K.; Zajac, D.; Soloducho, J.; Cabaj, J. Dopamine sensing with fluorescence strategy based on low temperature co-fired ceramic technology modified with conducting polymers. Sens. Actuators B 2017, 252, 803–812. [Google Scholar] [CrossRef]
  19. Li, N.; Nan, C.; Mei, X.; Sun, Y.; Feng, H.; Li, Y. Electrochemical sensor based on dual-template molecularly imprinted polymer and nanoporous gold leaf modified electrode for simultaneous determination of dopamine and uric acid. Microchim. Acta 2018, 187, 496. [Google Scholar] [CrossRef]
  20. Ghosh, S.; Nagarjun, N.; Nandi, S.; Dhakshinamoorthy, A.; Biswas, S. Two birds with one arrow: A functionalized Al (iii) MOF acts as a fluorometric sensor of dopamine in bio-fluids and a recyclable catalyst for the Biginelli reaction. J. Mater. Chem. C 2022, 10, 6717–6727. [Google Scholar] [CrossRef]
  21. Gajendar, S.; Amisha, K.; Manu, S. Mildly acidic pH and room temperature triggered peroxidase-mimics of rGO–Cu3(OH)2(MoO4)2 cuboidal nanostructures: An effective colorimetric detection of neurotransmitter dopamine in blood serum and urine samples. CrystEngComm 2021, 23, 599–616. [Google Scholar] [CrossRef]
  22. Kumar, A.; Kumari, A.; Mukherjee, P.; Saikia, T.; Pal, K.; Sahu, S.K. A design of fluorescence-based sensor for the detection of dopamine via FRET as well as live cell imaging. Microchem. J. 2020, 159, 105590. [Google Scholar] [CrossRef]
  23. Moghzi, F.; Soleimannejad, J.; Sañudo, E.C.; Janczak, J. Dopamine Sensing Based on Ultrathin Fluorescent Metal–Organic Nanosheets. ACS Appl. Mater. Interf. 2020, 12, 44499. [Google Scholar] [CrossRef] [PubMed]
  24. Zhuo, S.; Guan, L.; Li, H.; Fang, J.; Zhang, P.; Du, J.; Zhu, C. Facile fabrication of fluorescent Fe-doped carbon quantum dots for dopamine sensing and bioimaging application. Analyst 2019, 144, 656–662. [Google Scholar] [CrossRef] [PubMed]
  25. Tang, Z.; Jiang, K.; Sun, S.; Qian, S.; Wang, Y.; Lin, H. A conjugated carbon-dot–tyrosinase bioprobe for highly selective and sensitive detection of dopamine. Analyst 2019, 144, 468–473. [Google Scholar] [CrossRef]
  26. Wang, K.; Song, J.; Duan, X.; Mu, J.; Wang, Y. Perovskite LaCoO3 nanoparticles as enzyme mimetics: Their catalytic properties, mechanism and application in dopamine biosensing. New J. Chem. 2017, 41, 8554–8564. [Google Scholar] [CrossRef]
  27. He, X.-P.; Zeng, Y.-L.; Tang, X.-Y.; Li, N.; Zhou, D.-M.; Chen, G.-R.; Tian, T. Rapid Identification of the Receptor-Binding Specificity of Influenza A Viruses by Fluorogenic Glycofoldamers. Angew. Chem. Int. Ed. 2016, 55, 13995–13999. [Google Scholar] [CrossRef]
  28. Dou, W.-T.; Han, H.-H.; Sedgwick, A.-C.; Zhu, G.-B.; Zang, Y.; Yang, X.-R.; Yoon, J.; James, T.D.; Li, J.; He, X.P. Fluorescent probes for the detection of disease-associated biomarkers. Sci. Bull. 2022, 67, 853–878. [Google Scholar] [CrossRef]
  29. Kwon, H.J.; Rivera, E.C.; Neto, M.R.C.; Marsh, D.; Swerdlow, J.J.; Summerscales, R.L.; Tadi, P.P. Development of smartphone-based ECL sensor for dopamine detection: Practical approaches. Results Chem. 2020, 2, 100029. [Google Scholar] [CrossRef]
  30. Shen, X.; Ju, F.; Li, G.; Ma, L. Smartphone-Based Electrochemical Potentiostat Detection System Using PEDOT: PSS/Chitosan/Graphene Modified Screen-Printed Electrodes for Dopamine Detection. Sensors 2020, 20, 2781. [Google Scholar] [CrossRef]
  31. Muralidharan, R.; Chandrashekhar, V.; Butler, D.; Ebrahimi, A. A Smartphone-Interfaced, Flexible Electrochemical Biosensor Based on Graphene Ink for Selective Detection of Dopamine. IEEE Sens. J. 2020, 20, 13204–13211. [Google Scholar] [CrossRef]
  32. Dadkhah, S.; Mehdinia, A.; Jabbari, A.; Manbohi, A. Rapid and sensitive fluorescence and smartphone dual-mode detection of dopamine based on nitrogen-boron co-doped carbon quantum dots. Microchim. Acta 2020, 187, 569. [Google Scholar] [CrossRef] [PubMed]
  33. Wang, Y.; Li, Y.; Bao, X.; Han, J.; Xia, J.; Tian, X.; Ni, L. A smartphone-based colorimetric reader coupled with a remote server for rapid on-site catechols analysis. Talanta 2016, 160, 194–204. [Google Scholar] [CrossRef]
  34. Chellasamy, G.; Ankireddy, S.R.; Lee, K.-N.; Govindaraju, S.; Yun, K. Smartphone-integrated colorimetric sensor array-based reader system and fluorometric detection of dopamine in male and female geriatric plasma by bluish-green fluorescent carbon quantum dots. Mater Today Bio 2021, 12, 100168. [Google Scholar] [CrossRef]
  35. Bhaiyya, M.; Kulkarni, M.B.; Pattnaik, P.K.; Goel, S. Internet of things-enabled photomultiplier tube- and smartphone-based electrochemiluminescence platform to detect choline and dopamine using 3D-printed closed bipolar electrodes. Luminescence 2022, 37, 357–365. [Google Scholar] [CrossRef]
  36. Zheng, G.; Shen, C.; Huan, L.; Zhao, R.; Chen, M.; Diao, G. Electrochemical detection dopamine by Ester-calix[n]arenes/graphene nanosheets modified electrodes. J. Electroanal. Chem. 2017, 804, 16–22. [Google Scholar] [CrossRef]
  37. Halawa, M.; Wu, I.; Fereja, T.H.; Lou, B.; Xu, G. One-pot green synthesis of supramolecular β-cyclodextrin functionalized gold nanoclusters and their application for highly selective and sensitive fluorescent detection of dopamine. Sens. Actuators B 2018, 254, 1017–1024. [Google Scholar] [CrossRef]
  38. Fragoso, A.; Almirall, E.; Cao, R.; Echegoyen, L.; Gonzalez-Jonte, R. A supramolecular approach to the selective detection of dopamine in the presence of ascorbate. Chem. Commun. 2004, 19, 2230–2231. [Google Scholar] [CrossRef]
  39. Palomar-Pardavè, M.; Corona-Avendano, S.; Romero-Romo, M.; Alarcon-Angeles, G.; Merkoci, A.; Ramirez-Silva, M.T. Supramolecular interaction of dopamine with β-cyclodextrin: An experimental and theoretical electrochemical study. J. Electroanal. Chem. 2014, 717, 103–109. [Google Scholar] [CrossRef]
  40. Harley, C.C.; Annibaldi, V.; Yu, T.; Breslin, C.B.; Carmel, B. The selective electrochemical sensing of dopamine at a polypyrrole film doped with an anionic β−cyclodextrin. J. Electroanal. Chem. 2019, 855, 113614. [Google Scholar]
  41. Kurzatkowska, K.; Sayin, S.; Yilmaz, M.; Radecka, H.; Radecki, J. Calix[4]arene derivatives as dopamine hosts in electrochemical sensors. Sens. Actuators B Chem. 2015, 218, 111–121. [Google Scholar] [CrossRef]
  42. Mei, Y.; Zhang, Q.-W.; Gu, Q.; Liu, Z.; He, X.; Tian, Y. Pillar[5]arene-Based Fluorescent Sensor Array for Biosensing of Intracellular Multi-neurotransmitters through Host–Guest Recognitions. J. Am. Chem. Soc. 2022, 144, 2351–2359. [Google Scholar] [CrossRef] [PubMed]
  43. Xiao, X.-D.; Shi, L.; Guo, L.-H.; Wang, J.-W.; Zhang, X. Determination of dopamine hydrochloride by host-guest interaction based on water-soluble pillar[5]arene. Spectrochim. Acta A 2017, 173, 6–12. [Google Scholar] [CrossRef] [PubMed]
  44. Sindelar, V.; Cejas, M.A.; Raymo, F.M.; Chen, W.; Parker, S.E.; Kaifer, A.E. Supramolecular Assembly of 2,7-Dimethyldiazapyrenium and Cucurbit[8]uril: A New Fluorescent Host for Detection of Catechol and Dopamine. Chem. Eur. J. 2005, 11, 7054–7059. [Google Scholar] [CrossRef]
  45. Kasera, S.; Walsh, Z.; Del Barrio, J.; Scherman, O.A. A selective supramolecular photochemical sensor for dopamine. Supramol. Chem. 2014, 26, 280–285. [Google Scholar] [CrossRef]
  46. Shee, N.K.; Kim, M.K.; Kim, H.-J. Fluorescent chemosensing for aromatic compounds by a supramolecular complex composed of tin(IV) porphyrin, viologen, and cucurbit[8]uril. Chem. Commun. 2019, 55, 10575–10578. [Google Scholar] [CrossRef]
  47. Danylyuk, O.; Worzakowsk, M.; Osypiuk-Tomasik, J.; Sashuk, V.; Kedra-Krolik, K. Solution-mediated and single-crystal to single-crystal transformations of cucurbit[6]uril host–guest complexes with dopamine. CrystEngComm 2020, 22, 634–638. [Google Scholar] [CrossRef]
  48. Mecozzi, S.; Rebek, J., Jr. The 55 % Solution: A Formula for Molecular Recognition in the Liquid State. Chem. Eur. J. 1998, 4, 1016. [Google Scholar] [CrossRef]
  49. Mosca, S.; Yang, Y.; Rebek, J., Jr. Preparative scale and convenient synthesis of a water-soluble, deep cavitand. Nat. Prot. 2016, 11, 1371. [Google Scholar] [CrossRef]
  50. Trusso Sfrazzetto, G.; Satriano, C.; Tomaselli, G.A.; Rizzarelli, E. Synthetic fluorescent probes to map metallostasis and intracellular fate of zinc and copper. Coord. Chem. Rev. 2016, 311, 125–167. [Google Scholar] [CrossRef]
  51. Giuffrida, M.L.; Rizzarelli, E.; Tomaselli, G.A.; Satriano, C.; Trusso Sfrazzetto, G. A novel fully water-soluble Cu(I) probe for fluorescence live cell imaging. Chem. Commun. 2014, 50, 9835–9838. [Google Scholar] [CrossRef] [PubMed]
  52. Ballistreri, F.P.; Brancatelli, G.; Demitri, N.; Geremia, S.; Guldi, D.M.; Melchionna, M.; Pappalardo, A.; Prato, M.; Tomaselli, G.A.; Trusso Sfrazzetto, G. Recognition of C60 by tetra- and tri-quinoxaline cavitands. Supramol. Chem. 2016, 28, 601–607. [Google Scholar] [CrossRef]
  53. Legnani, L.; Puglisi, R.; Pappalardo, A.; Chiacchio, M.A.; Trusso Sfrazzetto, G. Supramolecular recognition of phosphocholine by an enzyme-like cavitand receptor. Chem. Commun. 2020, 56, 539–542. [Google Scholar] [CrossRef] [PubMed]
  54. Puglisi, R.; Pappalardo, A.; Gulino, A.; Trusso Sfrazzetto, G. Multitopic Supramolecular Detection of Chemical Warfare Agents by Fluorescent Sensors. ACS Omega 2019, 4, 7550–7555. [Google Scholar] [CrossRef]
  55. Tuccitto, N.; Riela, L.; Zammataro, A.; Spitaleri, L.; Li Destri, G.; Sfuncia, G.; Nicotra, G.; Pappalardo, A.; Capizzi, G.; Trusso Sfrazzetto, G. Functionalized Carbon Nanoparticle-Based Sensors for Chemical Warfare Agents. ACS Appl. Nano Mater. 2020, 3, 8182–8191. [Google Scholar] [CrossRef]
  56. Puglisi, R.; Pappalardo, A.; Gulino, A.; Trusso Sfrazzetto, G. Supramolecular recognition of a CWA simulant by metal–salen complexes: The first multi-topic approach. Chem. Commun. 2018, 54, 11156–11159. [Google Scholar] [CrossRef]
  57. Trusso Sfrazzetto, G.; Millesi, S.; Pappalardo, A.; Tomaselli, G.A.; Ballistreri, F.P.; Toscano, R.M.; Fragalà, I.; Gulino, A. Nerve Gas Simulant Sensing by a Uranyl–Salen Monolayer Covalently Anchored on Quartz Substrates. Chem. Eur. J. 2017, 23, 1576–1583. [Google Scholar] [CrossRef]
  58. Schindelin, J.; Arganda-Carreras, I.; Frise, E.; Kaynig, V.; Longair, M.; Pietzsch, T.; Preblisch, S.; Rueden, C.; Saalfeld, S.; Schmid, B.; et al. Fiji: An open-source platform for biological-image analysis. Nat. Methods 2012, 9, 676–682. [Google Scholar] [CrossRef] [Green Version]
  59. Ngamchuea, K.; Chaisiwamongkhol, K.; Batchelor-McAuley, C.; Compton, R.G. Chemical analysis in saliva and the search for salivary biomarkers—A tutorial review. Analyst 2018, 143, 81–99. [Google Scholar] [CrossRef]
  60. Tuccitto, N.; Catania, G.; Pappalardo, A.; Trusso Sfrazzetto, G. Agile Detection of Chemical Warfare Agents by Machine Vision: A Supramolecular Approach. Chem. Eur. J. 2021, 27, 13715–13718. [Google Scholar] [CrossRef]
  61. Pagliusi, P.; Lagugne-Labarthet, F.; Shenoy, D.K.; Dalcanale, E.; Shen, Y.R. Sensing Vase-to-Kite Switching of Cavitands by Sum-Frequency Vibrational Spectroscopy. J. Am. Chem. Soc. 2006, 128, 12610–12611. [Google Scholar] [CrossRef] [PubMed]
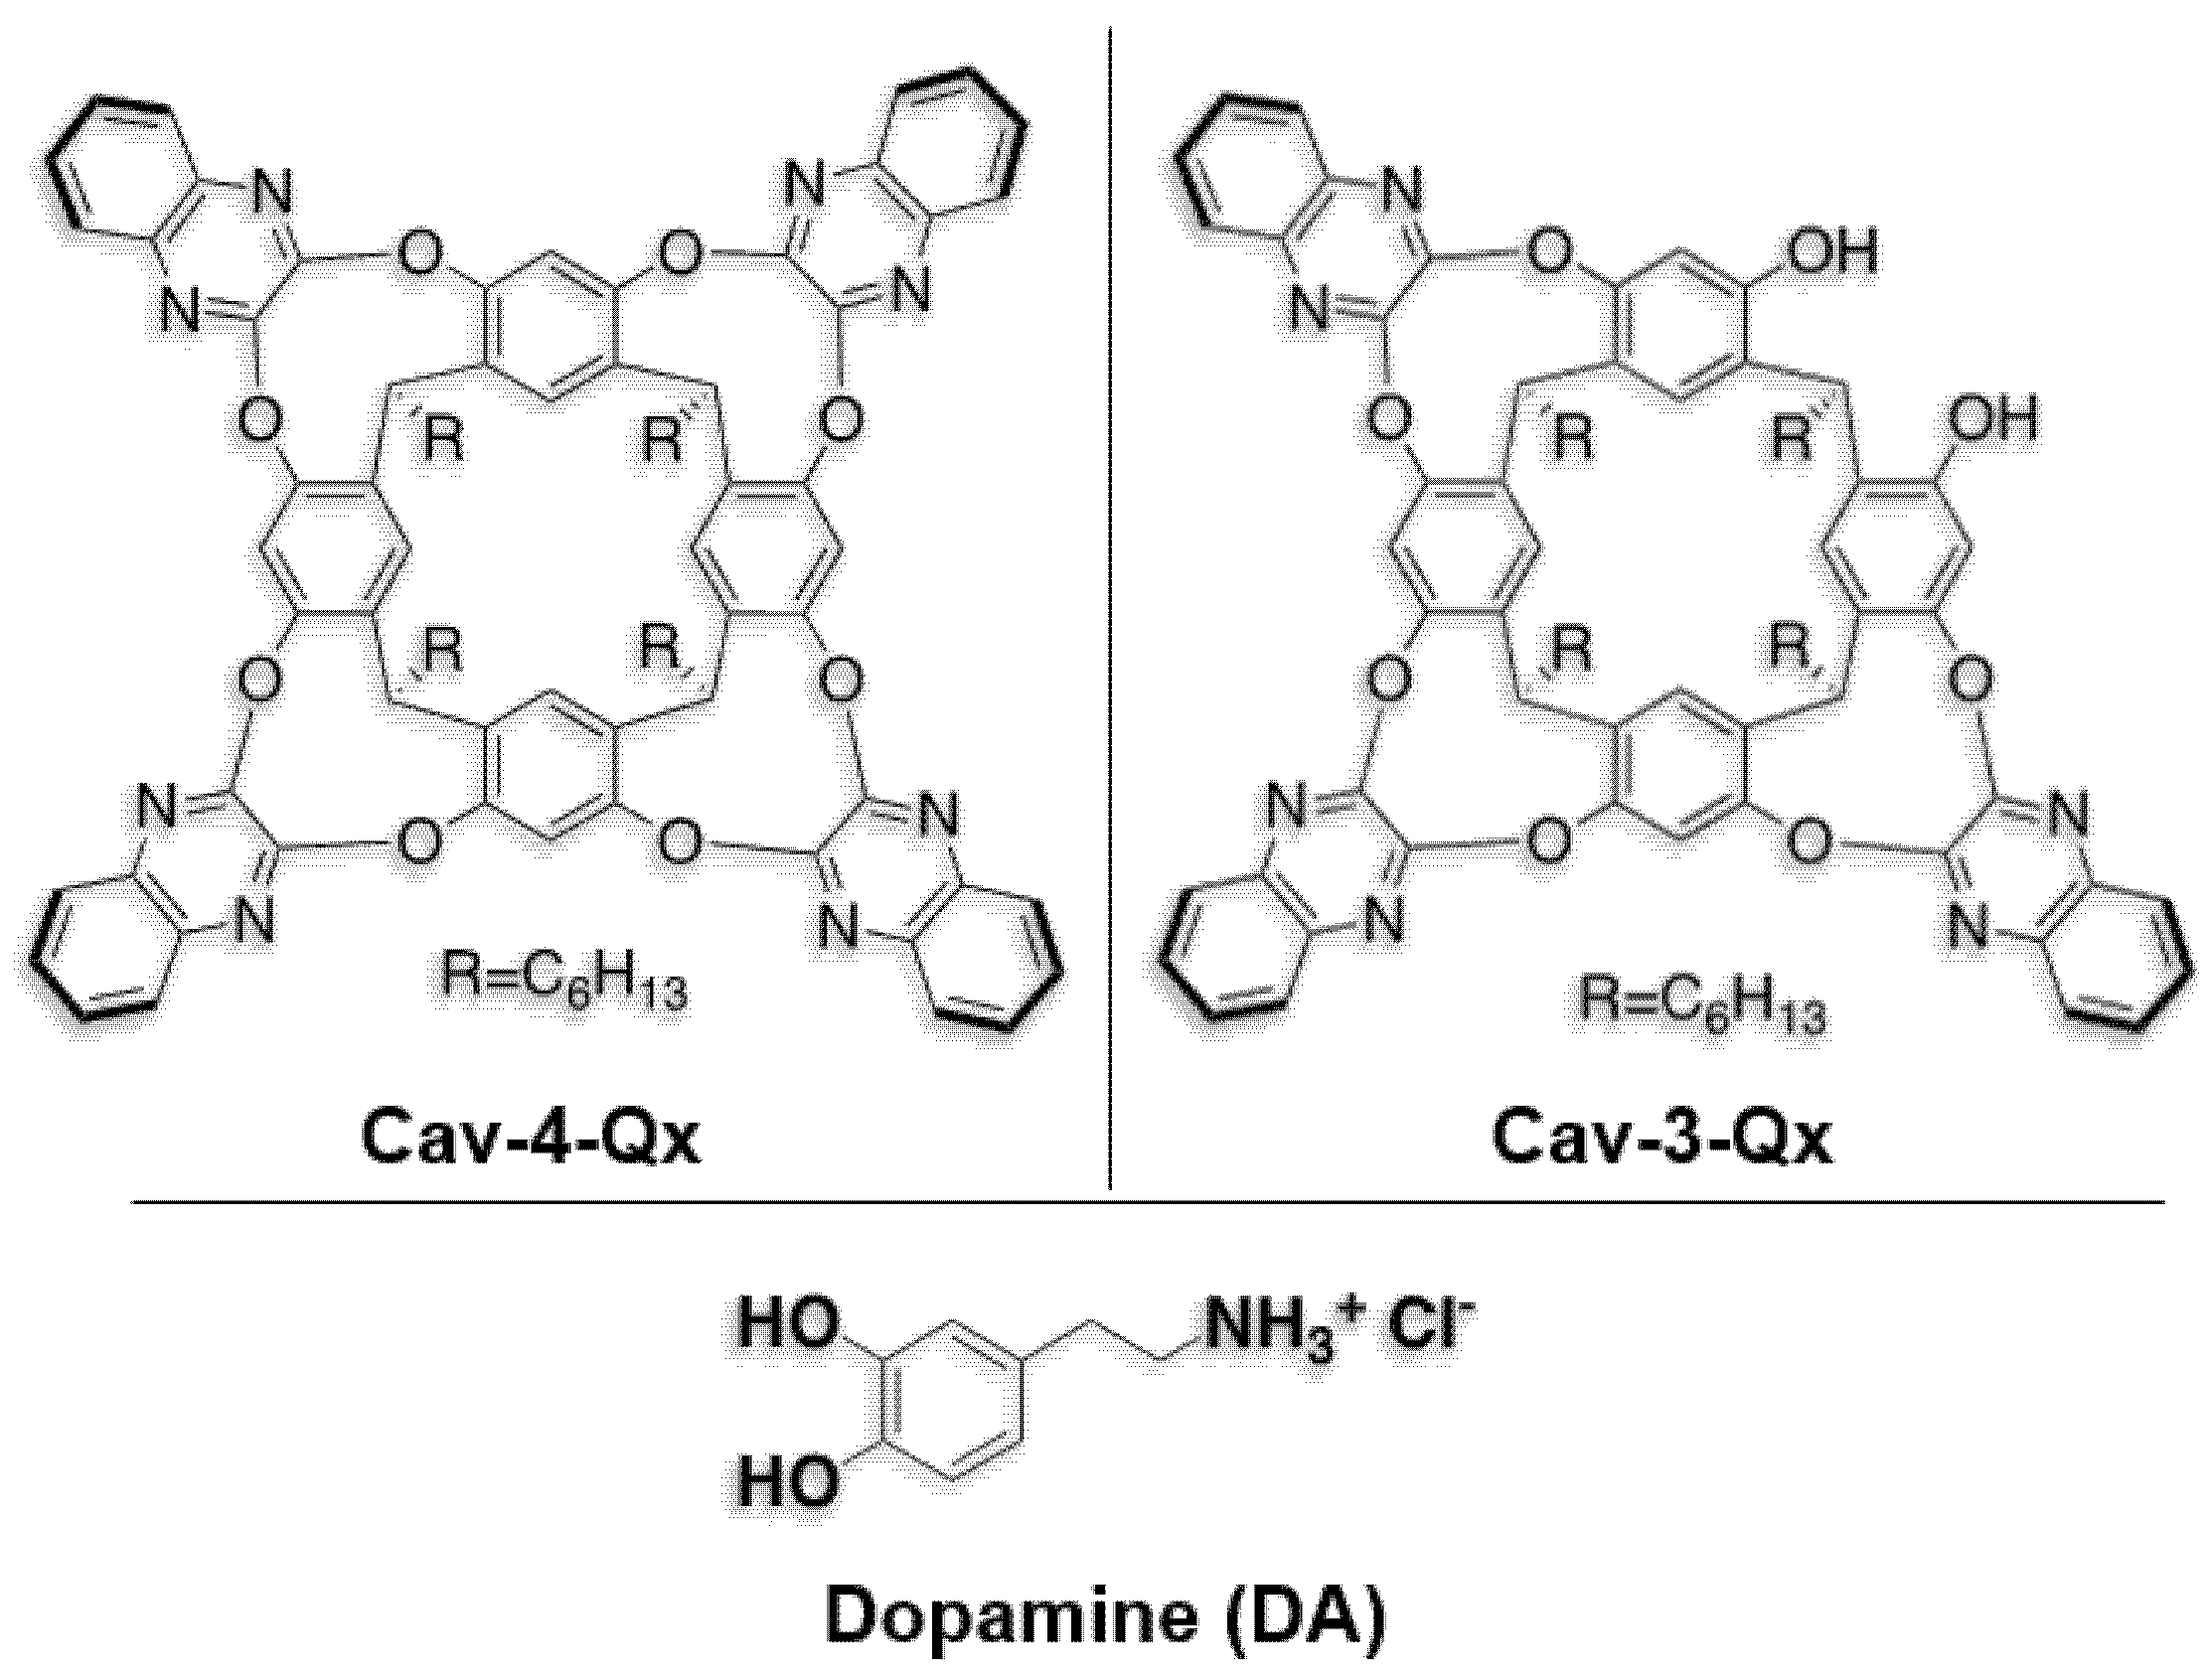
Chart 1. Chemical structures of quinoxaline cavitands and dopamine hydrochloride (DA) used in this work.
Molecules 27 07503 ch001
Scheme 1. Synthesis of Cav-4-Qx and Cav-3-Qx.
Molecules 27 07503 sch001
Figure 2. Detail of ROESY spectra of (a) Cav-4-Qx and DA and (b) Cav-3-Qx and DA in CDCl3/CD3OD (6/1) ((Host) = (DA) = 1 × 10⁻³ M); insets show the minimized structure (force field MM+) of the supramolecular complexes, highlighting the functional groups involved in the ROE contacts (host signals are shown in black, DA is highlighted in violet, hydrogens of the hosts are omitted for clarity).
Molecules 27 07503 g002
Figure 3. (a) photos of test strips exposed to increased amounts of DA; (b) correlation between the log[DA] and the normalized emission values of the solid sensor (I/I0, where I and I0 are the Gray channel emission values of Cav-4-Qx and control probe, respectively).
Molecules 27 07503 g003
Figure 4. Selectivity tests: emission response (I-I0, where I and I0 are the Gray channel emission values of each test image after and before the analyte exposition, respectively) of the solid sensor to different analytes dissolved in artificial saliva (composition: NaCl 2.9 mg/mL, KCl 6.35 mg/mL, Na2HPO4 1.7 mg/mL, KH2PO4 1.65 mg/mL, KSCN 0.8 mg/mL, CaCl2 × 2H2O 0.85 mg/mL, Urea 1 mg/mL, NH4Cl 0.8 mg/mL, ascorbic acid 0.01 mg/mL), metal ions (MgCl2 1 mg/mL, MnCl2 1 mg/mL, FeCl2 1 mg/mL, CuCl2 1 mg/mL, ZnCl2 1 mg/mL), real saliva and real saliva containing 0.1 nM of DA.
Molecules 27 07503 g004
Figure 5. Recovery test: (a) representation of acid–base cycle and switch of the Cav-4-Qx vase-kite conformations (DA is reported in green); (b) normalized emission response (respect to the emission of the blank) of the solid sensor without (blank), after nebulization of DA (10−3 M in EtOH) and after acid–base cycles.
Molecules 27 07503 g005
Figure 6. Dark chamber used in this work.
Molecules 27 07503 g006
Publisher’s Note: MDPI stays neutral with regard to jurisdictional claims in published maps and institutional affiliations.