Article

Total Flavonoids Extracts of Apocynum L. from the Ili River Valley Region at Different Harvesting Periods and Bioactivity Analysis

1
Institute of Bast Fiber Crops, Chinese Academy of Agricultural Sciences, Changsha 410205, China
2
Department of Agronomy, Bayero University Kano, Kano P.M.B. 3011, Nigeria
3
Ili Agricultural Science Institute, Yining 835100, China
4
Key Laboratory of Biological and Processing for Bast Fiber Crops, Changsha 410221, China
*
Authors to whom correspondence should be addressed.
These authors contributed equally to this work.
Molecules 2022, 27(21), 7343; https://doi.org/10.3390/molecules27217343
Submission received: 16 October 2022 / Revised: 25 October 2022 / Accepted: 26 October 2022 / Published: 28 October 2022

Abstract

:
In the current study, the total content from two Apocynum species leaves (Apocynum venetum and Apocynum hendersonii) collected from the Ili River Valley Region were extracted, and their bioactivities were investigated. The results showed a significant variation in the total flavonoid contents in the leaf samples collected at different periods (June, July, August, and September), with the highest content in August (60.11 ± 0.38 mg RE/g DW for A. venetum and 56.56 ± 0.24 mg RE/g DW for A. hendersonii), and the lowest in June (22.36 ± 0.05 mg RE/g DW for A. venetum and 20.79 ± 0.02 mg RE/g DW for A. hendersonii). The total flavonoid content was comparably higher in A. venetum than in A. hendersonii. Leaves extracts from the two species demonstrated strong bioactivity, which positively correlated with the total flavonoid contents. The anti-oxidative activity of A. venetum was higher than that of A. hendersonii in tandem with its higher flavonoid contents; the antibacterial activity, however, was conversely opposite. Furthermore, a total of 83 flavonoid metabolites were identified in the two species based on UPLC-ESI-MS/MS, out of which 24 metabolites were differentially accumulated. The variability in these metabolites might be the reason for the different bioactivities displayed by the two species. The present study provides insight into the optimal harvest time for Apocynum species planted in the major distribution area of the Ili River Valley and the specific utilization of A. venetum and A. hendersonii.

1. Introduction

Plant secondary metabolites that comprise polyphenols, alkaloids, and terpenes have been the source of pharmacology and therapeutics for decades [1]. Flavonoids are the most active secondary metabolites in controlling metabolic syndrome in vivo and in vitro [2]. They also exhibit a potential function in preventing chronic noninfectious diseases such as diabetes, cardiovascular disease and cancer [3]. Due to the health risks associated with consuming synthetic antioxidants, natural flavonoids extracted from plants are recommended, for they are relatively safe [4]. Flavonoids are known to alleviate reactive oxygen species and boost the body’s immune system, enabling the plant to have the most value in industrial use [5,6]. However, significant variations in total content, component, and bioactivity of natural flavonoids exist among plant species, varieties, and their geographical distribution [7]. Therefore, understanding the variations in natural flavonoids will bring a clearer guide for the precise utilization of plants.
Apocynum species are perennial herbs belonging to the family Apocynaceae and were reported to be a unique source of polyphenols with medicinal significance [8]. Previous studies have detected a considerable number of flavonoid constituents in Apocynum, which were proven to impact stress resistance, antioxidant, antibacterial, anti-inflammatory, and sedative effects [9,10,11,12]. Extracts from the species alleviated doxorubicin-induced cardiotoxicity via the AKT/Bcl-2 signaling pathway and showed significant hepatoprotective effects against carbon tetrachloride-induced hepatotoxicity [13,14]. The phytochemicals characteristic made the plant adapt to drought and saline lands and a suitable alternative to synthetic human drugs for treating heart disease, hepatitis, and hypertension [15,16]. However, the total flavonoid content varies in different species and regions depending on their growing conditions and physiological distribution [7], which causes poor consistency of the natural extracts and derivative products.
In China, Apocynum plants are mainly grown in Xinjiang Uygur Autonomous Region, especially in the area where agriculture is severely limited by soil salinity, alkalinity, and drought, owing to the plant’s excellent tolerance to stresses [17]. The Ili River Valley Region in the northwestern part of Xinjiang is the wettest [18]. Due to its unique topography, landform, and mountainous terrain, it has developed a humid temperate climate with abundant light, fertile soil, abundant water resources, and excellent natural conditions, which makes it suitable for the growth and distribution of Apocynum species [19]. Therefore, there is great significance in the comprehensive development and utilization of Apocynum genus plants in the Ili River Valley Region. The major cultivated species of Apocynum are divided into Apocynum venetum and Apocynum hendersonii (Figure 1A), which are excellent raw materials for both textiles and medicine, as well as pioneer crops for ecological restoration of saline soil and controlling desertification [8,20]. The biological activity of Apocynum L. has been associated with its rich flavonoids [21]. However, there are marked differences in total flavonoids and bioactivity between A. venetum and A. hendersonii, which require in-depth study to unravel the causes or stages.
In this study, the total flavonoid contents of the leaf extracts of A. venetum and A. hendersonii grown in the Ili River Valley Region at different harvesting stages were determined by the aluminum chloride colorimetric method. In addition, the antioxidant activities of the extracts at different harvesting stages were analyzed by DPPH, ABTS, and FRAP methods, and their antibacterial activity against Escherichia coli, Staphylococcus aureus, and Aspergillus niger was investigated. The composition and relative content differences of the metabolites of A. venetum and A. hendersonii were analyzed using a targeted metabolomics approach. This study provides new insights into the differences in total flavonoid and bioactivity between A. venetum and A. hendersonii.

2. Results and Discussion

2.1. Total Flavonoid Content Determination

The total flavonoid content of A. venetum and A. hendersonii leaves was determined at the four different harvesting stages. In previous studies, A. venetum and A. hendersonii contained significant amounts of flavonoids, and methanol was shown to be more effective in recovering flavonoids from the Apocynum [22]. Therefore, methanol was used as the extraction solvent, and the result of the total flavonoid content in the two species is shown in Figure 1B. There was significant variation in the total flavonoid content of the species at the different harvesting stages, and it was in the ranges of 20.79 mg RE/g DW to 60.11 mg RE/g DW, with an increasing trend in total flavonoid content from June to August and subsequently decreasing in September in both. A. venetum, however, displayed the highest amount of total flavonoids at the different harvesting stages compared to A. hendersonii. The highest total flavonoid contents of A. venetum and A. hendersonii leaves were both in the August harvesting period, with 60.11 ± 0.38 mg RE/g DW and 56.56 ± 0.24 mg RE/g DW, respectively. The lowest total flavonoid content was recorded in the June harvest (A. venetum, 22.36 ± 0.05 mg RE/g DW and A. hendersonii, 20.79 ± 0.02 mg RE/g DW). A different study showed the total flavonoid contents of A. venetum collected from Shanxi Province, China, in July 2006 and that of A. hendersonii collected from Qinghai Province, China, in July 2007 to have had 31.09 mg RE/g DW and 18.16 mg RE/g DW, respectively [23]. Both were lower than what was obtained in this study in the August harvest for A. venetum (60.11 ± 0.38 mg RE/g DW) and A. hendersonii (56.56 ± 0.24 mg RE/g DW). These might be due to the differences in the harvesting stage, climate, and extraction procedures. Accordingly, it can be concluded that August is the best harvesting period for A. venetum and A. hendersonii growing in the Ili River Valley Region, as this period has the highest total flavonoid content, which is reflective of medicinal significance.

2.2. Antioxidant Activity Analysis of Apocynum L. at Different Harvesting Stages

Due to the antioxidants’ different principles of action, diversity of substrates, active substances involved, and the complexity of the oxidation process itself [24], we used a combination of 2,2-diphenyl-1-picrylhydrazyl (DPPH), 2,2-azinos-bis (3-ethylbenzo thiazoline-6-sulphonic acid) (ABTS), and ferric-reducing antioxidant power (FRAP) to evaluate the antioxidant capacity of the various extracts.
DPPH is a stable free radical widely used to screen for active antioxidants in natural treatments [25]. The ability of A. venetum and A. hendersonii to scavenge DPPH free radicals was determined, and the result is presented in Figure 1C. The radical scavenging activities of A. venetum and A. hendersonii leaf extracts against DPPH free radicals ranged from 48.54% to 72.99% and 46.09% to 65.17% at different harvesting stages, respectively. There was a significant difference (p < 0.05) between the harvesting periods. The result followed similar trends to that of the total flavonoids, showing a substantial increase from June to August, before declining in the September harvest in each species. Between the two species, however, A. venetum extracts of all the harvest stages had comparably higher radical scavenging activity than its harvest pair from A. hendersonii (p < 0.05).
ABTS free radical solution reacts with antioxidants; the solution color fades in reflection of the antioxidant ability to scavenge free radicals [26]. The ABTS assay result for A. venetum and A. hendersonii ranged from 73.62% to 89.44% and 69.69% to 85.77%, as depicted in Figure 1D. The highest and lowest were in August and June, respectively, in each species, consistent with the DPPH result. Similarly, A. venetum leaf extracts displayed higher ABTS radical scavenging activity than A. hendersonii (p < 0.05) as in DPPH.
The Fe3+-TPTZ is reduced by the antioxidant to a stable blue Fe2+-TPTZ, where the color change reflects the antioxidant capacity of the reactants [27]. The reducing power of A. venetum leaf extracts, according to the FRAP result (Figure 1E), was higher than that of A. hendersonii leaf extracts and followed a similar pattern with DPPH and ABTS with the highest in the August harvest and the lowest in the June harvest.
Based on the three different antioxidant activities, both A. venetum and A. hendersonii leaf extracts had potentially excellent antioxidant activity in tandem with the relevant literature [1], though A. venetum displayed better capacity. The best harvesting time of the Apocynum is August when the target is the flavonoid contents. A study on Tephrosia purpurea that assessed the seasonal variation of the polyphenols and their antioxidant capacity reported significant variation in the antioxidant capacity of the three harvesting times (April, August, and December), with the August harvest displaying the highest antioxidant activity [28]. The overall result of this study further revealed a positive and significant correlation between the total flavonoid content and the DPPH (r = 0.926), ABTS (r = 0.923), and FRAP (r = 0.734) antioxidant capacities (Table 1). Similar to this finding, Ouerghemmi et al. reported a higher correlation between the total flavonoids extracted from the flower of Ruta chalepensis and its antioxidant capacity [29].

2.3. Antimicrobial Activity of A. venetum and A. hendersonii Extracts

The antimicrobial activities of the total flavonoids from the two Apocynum species were significantly different (p < 0.05) and antagonistic against all three microbial strains compared to the control, as shown in Figure 2A. The zones of inhibition diameters for A. venetum extracts against E. coli, MARS, and A. niger were 11.20 mm, 9.81 mm, and 7.96 mm, while that of A. hendersonii were 17.80 mm, 13.99 mm, and 10.09 mm, respectively (Figure 2B). Compared to A. venetum, the A. hendersonii extract exhibited a larger inhibition zone, indicating better antimicrobial activities against all three strains, consistent with the results of Gao et al. [21]. The leaves of Apocynum L. collected from the Ili River Valley region of Xinjiang demonstrated a relatively higher total flavonoids content and bioactivity on the microbes (A. niger, fungi; E. coli, gram-negative bacteria, and MARS, gram-negative bacteria).
The extracts from both Apocynum species showed comparably higher activity against bacterial strains, having exhibited higher inhibition zones than the fungi (Figure 2C). The overall result thus revealed the medicinal and economic value of Apocynum plants as a promising antibacterial agent and could be a potential candidate in pharmaceutical industries. However, it remains to be seen whether there was a specific inhibition mechanism between the extracts of A. venetum and A. hendersonii against the three mentioned microbial strains. Since the membrane structure and composition of the three strains were significantly complex and different [30], the growth inhibition of strains is due to the abnormal changes in the morphology caused by the extracts, extravasation of intracellular material, or the inability of the cells to selectively control the intracellular transport of nutrients and metabolites, needs to be studied by further scanning electron microscopy.

2.4. Metabolomic Profiling of the Apocynum Species

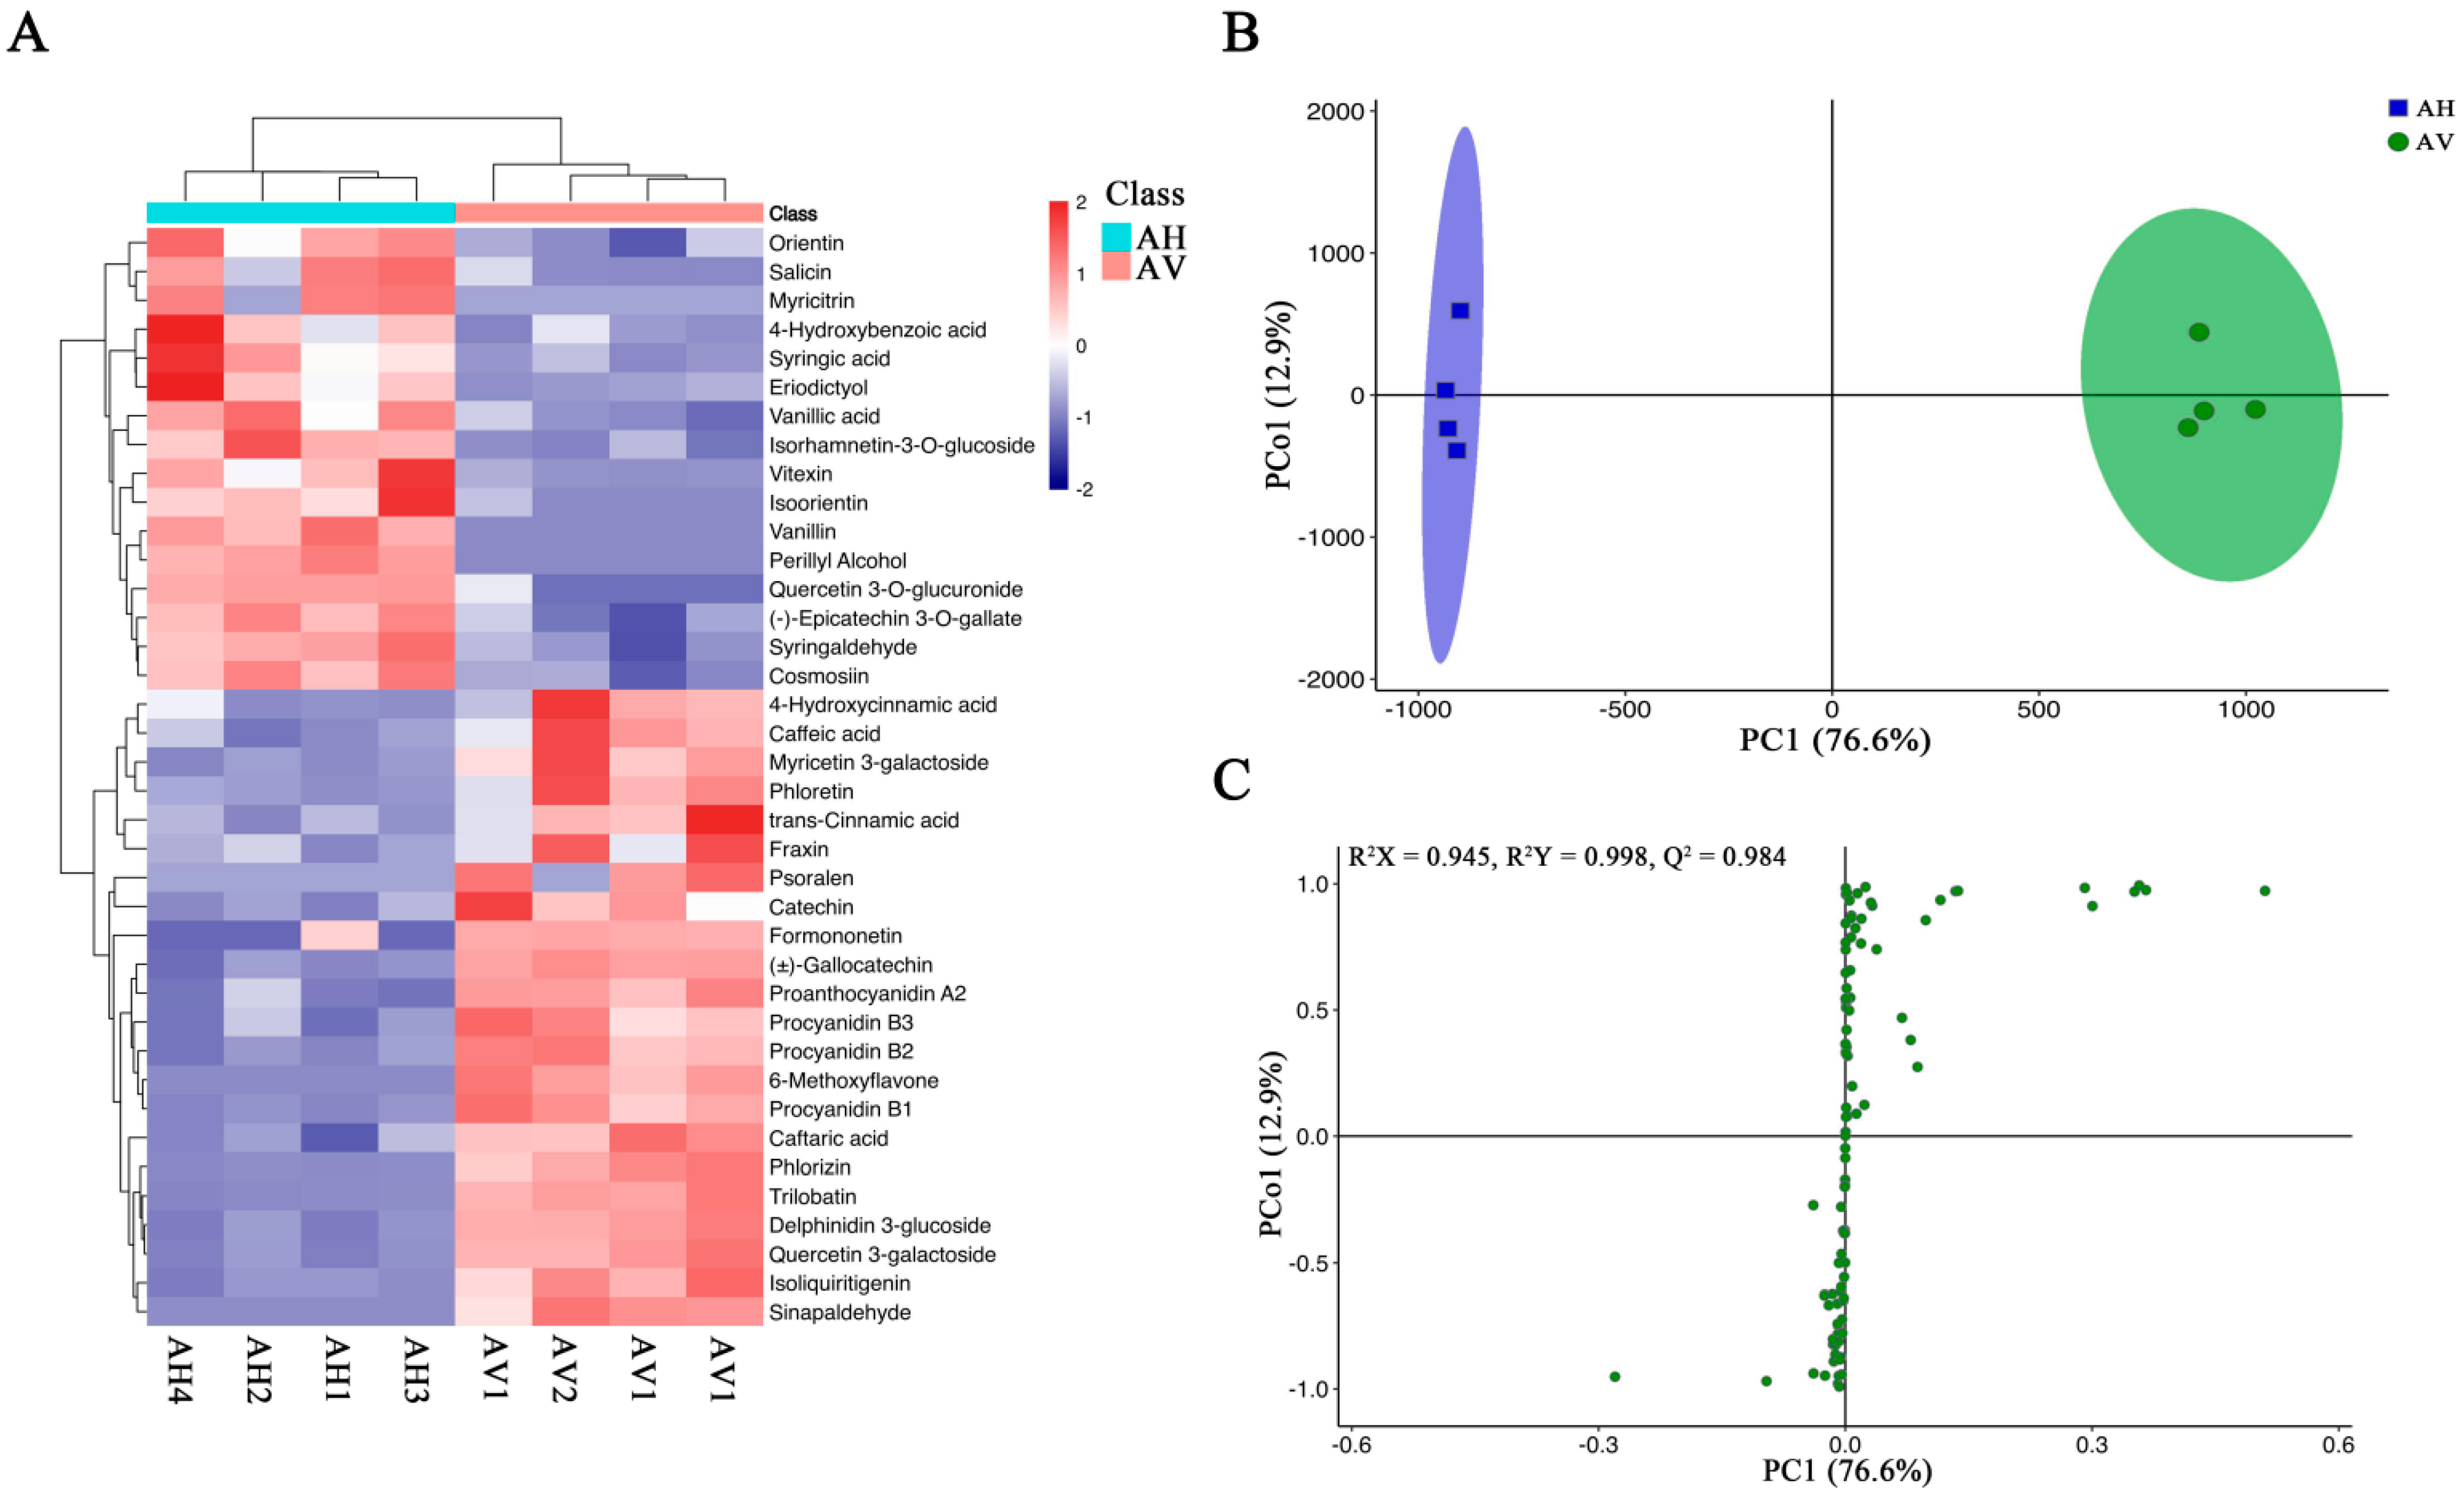
The total ion current (TIC) and multi-peak detection plots for the A. venetum and A. hendersonii quality control (QC) samples are shown in Figure S1. The overlap of the TIC plots of the three QC samples indicated a complete overlap of the TIC plots of the metabolites, which demonstrated the instrumental stability and good reproducibility of the metabolite assays for the same samples at different time points. The metabolite multi-peak detection plot in MRM mode shows that the A. venetum and A. hendersonii contain multiple flavonoids, where each differently colored mass spectral peak represents one metabolite detected. The flavonoid metabolites in the leaves of A. venetum and A. hendersonii were studied based on UPLC-ESI-MS/MS and a metabolite database. A total of 83 flavonoid metabolites were identified, including 27 flavonols, 13 flavones, 13 flavanones, 10 catechin derivatives, 8 isoflavones, 5 anthocyanins, 4 proanthocyanidins, and 3 dihydrochalcones (Supplementary Materials, Table S1). The thermograms of all the flavonoid metabolites in A. venetum and A. hendersonii are shown in Figure 3A after homogenization, which indicated significant differences in the flavonoid metabolite contents. However, the compositions of the respective flavonoid metabolites were essentially the same. Cluster analysis further confirmed this, revealing a clear distinction between A. venetum and A. hendersonii. Moreover, it was found that more than half of the flavonoid metabolites in A. venetum were higher than in A. hendersonii.

2.5. Orthogonal Projection to Latent Structures–Discriminant Analysis (OPLS-DA) and Principal Component Analysis (PCA) for A. venetum and A. hendersonii

Orthogonal projection to latent structures-discriminant analysis (OPLS-DA) is an effective method for identifying differential metabolites as it maximizes the distinction between different groups [31]. Q2 is an essential parameter for evaluating the model in OPLS-DA, where a value of Q2 greater than 0.9 indicates that the model is a good one [31]. In this study, the OPLS-DA model was used to compare the flavonoid metabolite content of A. venetum (AV) and A. hendersonii (AH) samples (R2X = 0.945, R2Y = 998, Q2 = 0.984; Figure 3B,C). The Q2 values exceeded 0.9 in all control groups indicating the model’s stability and reliability [32] and can be used to further screen different flavonoid metabolites.
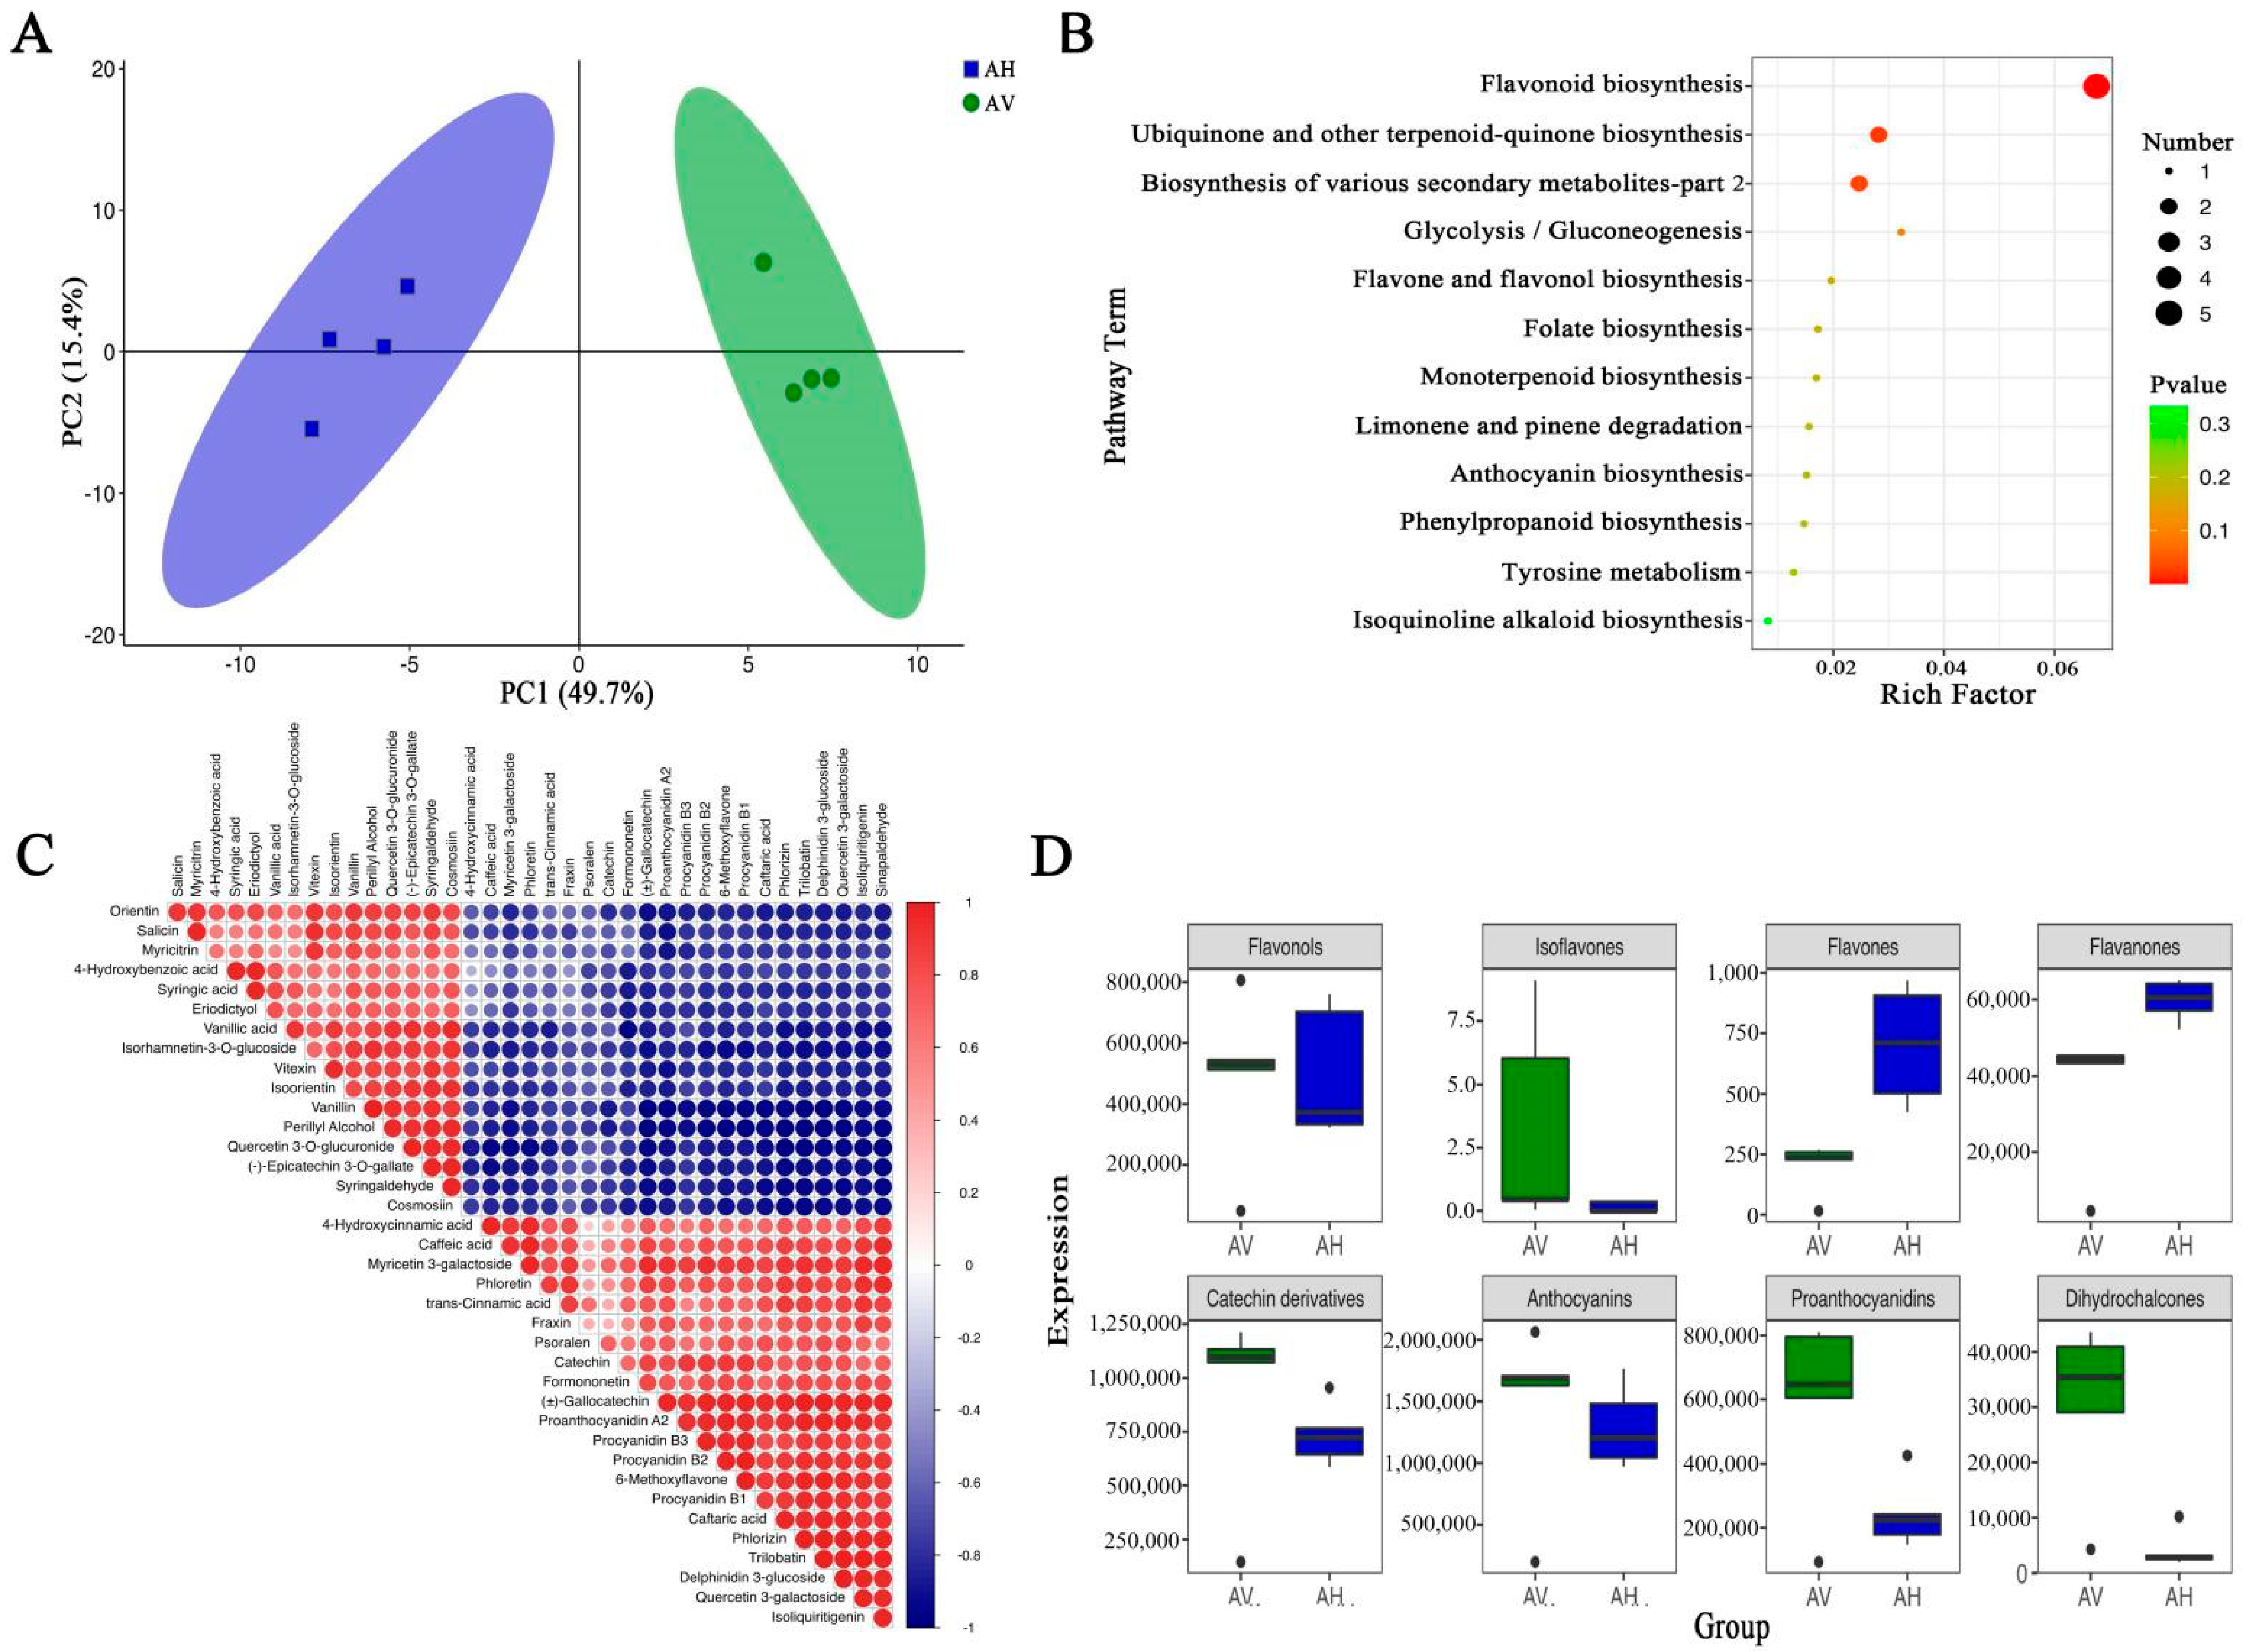
The principal component analysis (PCA) revealed the intrinsic structure between multiple variables, with PC1 and PC2 accounting for 49.7% and 15.4%, respectively. There was a clear separation between A. venetum and A. hendersonii, as shown in the PCA scoring plots (Figure 4A), with the replicates clustered closely together, demonstrating the reliability and reproducibility of the experiment.

2.6. Screening, Functional Annotation, and Enrichment Analysis of Differential Flavonoid Metabolites

To clarify the differences in flavonoid metabolites between A. venetum and A. hendersonii in greater depth, differential flavonoid metabolites were screened for each control group by combining the OPLS-DA model of ploidy variation and variable importance (VIP) values. Screening criteria included the fold change (≥2 or ≤0.5) and VIP ≥ 1 [31,32]. The results are shown in Table 2. In brief, there were 24 significantly different flavonoid metabolites (15 down-regulated and 9 up-regulated) between A. venetum and A. hendersonii.
The Kyoto Encyclopedia of Genes and Genomes (KEGG) database serves as the primary public database of metabolic pathways that can be used to study metabolite accumulation and gene expression information networks. In the present study, we enriched the differential metabolites of A. venetum and A. hendersonii and grouped them into different pathways, with the main pathways presented as bubble plots (Figure 4B, Table S2). For the most notable, the metabolic pathways, including “flavonoid biosynthesis”, “ubiquinone and other terpenoid-quinone biosynthesis”, “biosynthesis of various secondary metabolites”, and “glycolysis/gluconeogenesis” were significantly upregulated in A. venetum compared to A. hendersonii (p value < 0.05). The correlation analysis of the first 37 different flavonoid metabolites between A. venetum and A. hendersonii is shown in Figure 4C, which visually demonstrates the intensity of potential chemical biomarkers between A. venetum and A. hendersonii.

2.7. Differential Flavonoid Metabolites between A. Venetum and A. Hendersonii

The differential metabolites of A. venetum and A. hendersonii were grouped into eight different categories (Table 2). There were six major classes of flavonoid metabolites that were higher in A. venetum than in A. hendersonii, including isoflavones, flavonols, anthocyanins, proanthocyanidins, dihydrochalcones, and catechin derivatives. Only two major flavonoid metabolites, including flavones and flavanones, were lower in A. venetum than in A. hendersonii (Figure 4D). The overall result revealed that the activities exhibited by A. hendersonii were contributed to more by its rich flavone and flavanones, which were significantly higher than in A. venetum. Conversely, the activities exhibited by A. venetum were apparently due to its rich flavonols, which were comparably higher than the A. hendersonii. This constituent variation might be the reason for the species’ differential antimicrobial and antioxidant activities. Three notable flavones, vitexin, orientin, and isoorientin, as well as the flavanone eriodictyol, were found to be higher in A. hendersonii, which might be the reason for its better antimicrobial property. Vitexin, for example, has long been used as an antibacterial. It was recently demonstrated to play a critical role in modulating S. aureus surface hydrophobicity by aggregation forming biofilm and pathogenesis in a host organism. It also exhibited a protective response in S. aureus-infected macrophages via modulation of cytokine expression at protein and mRNA levels [33]. Orientin was reported to have displayed the best antibacterial effect against Mycobacterium tuberculosis, H37Rv [34]. Isoorientin and vitexin isolated from Rumex cyprius have shown promising activity against Syncephalastrum racemosum and Streptococcus pneumoniae at minimal concentrations of 0.98 and 1.95 μg/mL, respectively [35].
Conversely, the better antioxidant activity displayed by A. venetum might have been due to its relatively higher flavonols content. Flavonols such as quercetin and its derivatives are used in many pharmaceutical products as antioxidants [22]. Myricetin is shown to possess antitumor, anti-obesity, anti-inflammatory, and protection against cardiovascular and neurological ailments [36].

3. Materials and Methods

3.1. Plant Material

A. venetum and A. hendersonii were planted at the field of Ili Agricultural Institute, Xinjiang Uygur Autonomous Region, China (81°15′ E, 43°57′ N, altitude 656 m) in April of 2021. The leaves at the first 30 cm of the tender branches were selected, and samples were collected during four different periods (June, July, August, and September). The sampled leaves were then dried in an oven at 70 °C, ground into powder in a wall breaker, sieved through 160 mm meshes, and kept at −80 °C until analysis.

3.2. Extraction and Determination of Total Flavonoids

A modified approach [22] was adopted for the extraction. Apocynum L. leaf powder (5 g) was extracted with 100 mL methanol at 80 °C for 2 h. The supernatant was filtered with Whatman No.1 filter paper and dried with a rotary evaporator to obtain the dried extract powder, which was stored at 4 °C in the dark.
According to the method [22] with slight modification, the content of flavonoids was determined quantitatively by a spectrophotometer. In brief, 0.3 mL of 5% NaNO2 and 0.3 mL of 10% AlCl3 were added to 2 mL of the extract solutions and mixed, followed by 6 min incubation and the addition of 4 mL of 4% NaOH. The solution was then diluted to 10 mL with methanol and allowed to stand for 15 min before measuring the absorbance at 500 nm using a spectrophotometer (UV-3000, Mapada Instruments Inc., Shanghai, China). The total flavonoid content was calculated from a calibration curve of rutin as the standard (0–80 mg·mL−1) according to the above steps and expressed as rutin equivalents per gram of dry extract. All the procedures were repeated three times.

3.3. Antioxidant Assays

The DPPH radical scavenging activity of the different extracts was performed following the method reported [37,38] with slight modifications. 2.5 mL of the extract was mixed with 1 mL of 0.3 mM DPPH in a 95% ethanol working solution and reacted for 30 min in the dark at room temperature, and the absorbance was measured at 518 nm. The DPPH radical scavenging ability was expressed as inhibition rate and calculated using the formula: (Acontrol–Asample)/Acontrol × 100%, where Acontrol is the absorbance of the control solution (without sample), and Asample is the absorbance of the sample solution.
The ABTS radical scavenging activity of the extracts was conducted according to the method described by Ghasemzadeh et al. [39] with slight modifications. A total of 950 μL of ABTS working solution was added to 50 μL of the extract, and the absorbance was measured at 405 nm after 6 min of reaction at room temperature in the dark. The free radical scavenging activity was calculated as a percentage of inhibition using similar formula as DPPH, where Acontrol is the absorbance of ABTS working solution without sample and Asample is the absorbance of the sample solution. The experiments were all repeated three times, and the average values were taken.
The FRAP assay was conducted according to the method described by Yi et al. [40] with slight modifications. FRAP working solution consisted of 300 mM acetate buffer at pH 3.6, 10 mM TPTZ, and 20 mM FeCl3–6H2O in a 10:1:1 ratio, which was preheated to 37 °C before use. FRAP working solution (2.85 mL) was mixed thoroughly with 150 μL of Apocynum leaves extract and reacted for 10 min at room temperature under dark conditions, and the absorbance was measured at 593 nm. A calibration curve of Fe2+ was used to calculate the results. The reducing power of the methanolic extract of Apocynum leaves was expressed as µmol·ml−1. The higher the absorbance, the stronger the reducing power.

3.4. In Vitro Antimicrobial Assay

The extracts with the highest flavonoid contents (August harvest samples) for each species were selected for antibacterial assay and subsequent analysis. The in vitro inhibition assay was tested using the procedure described by Gao et al. [21]. The fungi, Aspergillus niger (ATCC 33591, Manassas, VA, USA) single colonies grown in Potato Dextrose Agar (PDA) solid medium (4.0% PDA, Solarbio, Beijing, China), were picked out and dispersed in 10 mL of fresh potato dextrose broth (2.5% PDB, Solarbio) and incubated at 28 °C, 200 rpm for 8 h. Escherichia coli (ATCC 25922) and Methicillin-resistant Staphylococcus aureus (ATCC 11632) were cultured in Luria Bertani (LB) solid medium (1% NaCl, 0.5% yeast extract, 1% tryptone and 1.5% agar, pH 6.8) or fresh LB liquid medium at 37 °C, and other conditions were the same as the fungi. The enriched microorganisms were then diluted to the same concentration (approximately 1.0 × 10⁷ CFU/mL) and then subjected to inhibition tests. A total of 100 μL of A. niger suspension was applied uniformly on PDA solid medium with sterilized cotton swabs, and 100 μL of E. coli and MRSA suspension was applied uniformly on LB agar plates.
A mixed solution (70% saline + 20% PEG-4000 + 10% DMSO) was added to the crude powder of the Apocynum extract to form a suspension of 20 mg/mL. All the liquid solutions were filtered through a 0.22 μm sterile filter membrane to remove bacteria, and all processes were performed under aseptic conditions. A total of 20 μL of the 20 mg/mL Apocynum L. leaf extract solution and control (co-solvent, 70% saline + 20% PEG-4000 + 10% DMSO) were separately used to soak filter paper (6 mm), and the paper was subsequently transferred onto the A. niger, E. coli and MARS media plates. The microorganisms were incubated at 30 °C (fungal) or 37 °C (bacterial) for 8 h. The transparent halo visible on the agar plate was considered the inhibition circle, and the diameter of the inhibition circle was measured and recorded with Vernier calipers. The average value of three biological replicates was taken for each strain.

3.5. Qualitative and Quantitative Analysis of Flavonoid Constituents of A. venetum and A. hendersonii

3.5.1. Sample Preparation and Extraction

A total of 400 μL of chloroform and 0.6 mL of water: methanol (1:2 v/v) were added to 50 mg of Apocynum leaves extract [41], and ground for 2 min at 60 Hz using a grinder (JXFSTPRP-24/32, Shanghai Jingxin Industrial Development Co., Ltd., Shanghai, China) and centrifuged for 10 min at 13,000 rpm, 4 °C. The residues were re-extracted again using the same procedure. 200 μL of supernatant was evaporated and re-dissolved in 200 μL of water: methanol (18:7 v/v) solution containing 12 ng/mL of internal standard (L-2-chlorophenyl alanine), followed by centrifugation at 13,000 rpm at 4 °C for 5 min. A total of 100 μL of supernatant was filtered using a nylon syringe filter (BS-QT-013, 0.22 μm, Labgic Technology Co., Ltd., Beijing, China) and stored in sample bottles at −80 °C. All extraction reagents were pre-cooled at −20 °C before use, and three replicates were made for each sample. Quality control samples (QC) were prepared by mixing equal volumes of extracts from all samples, with each QC volume being the same as the sample.

3.5.2. UPLC Conditions and ESI-Q TRAP-MS/MS

The A. venetum and A. hendersonii extracts were analyzed using a UPLC-ESI-MS/MS system (UPLC, AB ExionLC system; MS, Applied Biosystems 6500 Q TRAP, Framingham, MA, USA). The UPLC conditions were based on the reported method [42]. The analytical conditions were as follows: UPLC HSS T3 C18 (1.7 μm, 2.1 × 100 mm, Waters Technology Co., Ltd., MA, USA) chromatographic column was used. The mobile phases were phase A (0.1% formic acid-water solution) and phase B (acetonitrile). The gradient elution procedure was 95% solvent A and 5% solvent B within 10 min; the gradient was changed to 5% solvent A, 95% solvent B, and held for 1 min. Subsequently, the gradient was adjusted to 95% solvent A and 5% solvent B within 0.10 min and held for 2.9 min. The injection volume was 5 μL, the flow rate was 0.4 mL/min, and the column temperature was 40 °C. After UPLC, the effluent was alternately connected to an ESI-triple quadrupole-linear ion trap (QTRAP)-MS.
Mass spectrometry was also according to Wang et al. [42]. Linear ion trap (LIT) and triple quadrupole (QqQ) scans were performed on a triple quadrupole–linear ion trap mass spectrometer (Q TRAP). The API 6500 Q TRAP UPLC/MS/MS system is equipped with an ESI turbo ion-spray interface, operating in positive and negative ion modes, controlled by Analyst 1.6.3 software (AB Sciex, Framingham, MA, USA). The ESI source operation parameters were: an ion source, turbo spray, source temperature 600 °C; ion spray voltage (IS) 5500 V (positive ion mode)/−4500 V (negative ion mode); ion source gas I (GSI), gas II (GSII) and curtain gas (CUR) was set to 60, 50 and 35.0 psi, respectively; the collision gas (CAD) was high. Instrument tuning and mass calibration were performed in QqQ and LIT modes with 10 and 100 μmol/L polypropylene glycol solutions, respectively. QqQ scans were obtained in MRM experiments with collision gas (nitrogen) set to 5 psi. The dispersion potential (DP) and collision energy (CE) of the individual MRM jumps were obtained by further DP and CE optimization. A specific set of MRM transitions were monitored for each period based on the metabolites eluted.
The metabolites were analyzed using triple quadrupole mass spectrometry in multiple reaction detection (MRM) mode, in which the quadrupole first screens for precursor ions (parent ions) of the target substance while screening for ions corresponding to other molecular weight substances to initially exclude their interference; the precursor ions are broken into many fragment ions by collision chamber-induced ionization and filtered through the triple quadrupole to select individual fragment ions of the desired characteristics ions while excluding the interference of non-target ions, a step that gives better accuracy and reproducibility of quantitative results. After obtaining the mass spectrometry data from different samples, the peak areas were integrated. The peaks of the same substance in different samples were also corrected for integration. To compare the contents of each metabolite in different samples, the detected mass spectral peaks of each metabolite in different samples were corrected according to the information on retention time and peak shape of metabolites, which further ensured the accuracy of the qualitative and quantitative analysis.

3.5.3. Multivariate Data Analysis

The analyst 1.6.3 software (AB Sciex, Framingham, MA, USA) was used for processing the raw data signal. A log transformation of the raw metamorphic abundance was performed to normalize the data and achieve homogeneity of variance. Orthogonal projections to latent structures–discriminant analysis (OPLS-DA), cluster analysis, and principal component analysis (PCA) were performed using R (http://www.r-project.org/) according to the previously described approaches. The variable importance in projection (VIP) values of all metabolites in OPLS-DA was obtained using the first fraction. Metabolites that met both of the following criteria: (I) high level of confidence for paired comparisons (VIP ≥ 1); (II) minimum 2-fold change or maximum 0.5-fold change (fold change ≥ 2 or fold change ≤ 0.5) were selected as differential metabolites between A. venetum and A. hendersonii.

3.5.4. Kyoto Encyclopedia of Genes and Genomes (KEGG) Annotations and Metabolic Pathway Analyses of Differential Metabolites

The differential metabolites were annotated and cataloged according to the KEGG database [43]. Enrichment results for metabolic pathways were defined by considering the pathways in the module where metabolites were involved in significant enrichment versus the background and determined by a hypergeometric test and p-value < 0.05 as a threshold, the smaller the p-value, the more significant the difference in that metabolic pathway.

3.6. Statistical Analysis

Statistical Package for the Social Sciences (SPSS v. 25.0; IBM Corp., Armonk, NY, USA) was used for data analysis of each treatment group. All the data were expressed as the mean ± standard deviation of three independent replicates. Differences were considered statistically significant when * p < 0.05, ** p < 0.01, *** p < 0.001 between treatment groups. Graphs were plotted using Origin 2018 (OriginLab Corporation, Northampton, MA, USA) software.

4. Conclusions

In this study, we investigated the optimal harvesting time of Apocynum venetum and Apocynum hendersonii for a maximal yield of total flavonoids, which are medicinally important constituents with higher bioactivity against clinically important diseases. A targeted metabolomics approach was also used to analyze the differences in the composition and relative contents of flavonoid metabolites of the two Apocynum L. species, and evaluate the antioxidant activities and the antibacterial activity against three microbial strains of Escherichia coli, Staphylococcus aureus, and Aspergillus niger. The results showed significant differences between the total flavonoid contents at the different harvesting periods, with August being the best. Bioactivity analysis revealed a striking difference between the two species extracts, with A. venetum displaying better antioxidant activities and A. hendersonii exhibiting better antibacterial effects. We thus investigated the likely reason for this remarkable difference. Our finding suggested that three notable flavones, vitexin, orientin, and isoorientin, which were significantly higher in A. hendersonii, might be responsible for the better antibacterial effect of the species extract. Flavonols such as quercetin, myricetin, and their derivatives, which have significant antioxidant activity, were conversely higher in A. venetum. The present work largely contributes to the understanding of the changes in the total flavonoid content of Apocynum L. leaves during different growth periods and proposes the best harvesting time according to the result and constituents’ bioactivities.

Supplementary Materials

The following supporting information can be downloaded at: https://www.mdpi.com/article/10.3390/molecules27217343/s1, Figure S1: Total ions current plot for standards (A), TIC plot for standards in positive ionization mode (B), TIC plot for standards extraction in negative ionization mode (C), TIC overlay plot of standards (D), TIC overlay plot of quality control samples (E). Table S1: The Metabolites information of A. venetum and A. hendersonii). Table S2: KEGG enrichment analysis of differential metabolites between A. venetum and A. hendersonii

Author Contributions

Conceptualization, C.Y. and A.Z.; data curation, D.S. and G.G.; formal analysis, D.S., P.C., J.C., K.C., X.W., Y.W. and Y.C.; funding acquisition, G.G., C.Y. and A.Z.; investigation, D.S., G.G., C.Y. and A.Z.; methodology, D.S., G.G., A.S.A., P.C., J.C., K.C., X.W., Y.W. and Y.C.; resources, H.H. and X.W.; software, D.S., K.C. and Y.W.; supervision, C.Y. and A.Z.; validation, G.G., A.S.A.; visualization, D.S., G.G., P.C., J.C., K.C., X.W. and Y.W.; writing—original draft, D.S.; writing—review and editing, G.G. and A.S.A. All authors have read and agreed to the published version of the manuscript.

Funding

This work was supported by the Excellent Young Innovators of Changsha (kq2107017), the Agricultural Science and Technology Innovation Project of the Chinese Academy of Agricultural Science (CAAS-ASTIP-IBFC04), the Special Training Plan for Minority Science and Technology Talents of Xinjiang Uyghur Autonomous Region (2020D03028) and the Tianshan Youth Grassroots Youth Science and Technology Talent Training Project (2020Q095).

Institutional Review Board Statement

Not applicable.

Informed Consent Statement

Not applicable.

Data Availability Statement

Data is contained within the article and Supplementary Material, and also available from the corresponding author on request.

Conflicts of Interest

The authors declare that they have no known competing financial interests or personal relationships that could have appeared to influence the work reported in this paper.

References

  1. Les, F.; Cásedas, G.; López, V. Bioactivity of Medicinal Plants and Extracts. Biology 2021, 10, 634. [Google Scholar] [CrossRef]
  2. Chen, L.; Cao, H.; Xiao, J. 2-Polyphenols: Absorption, Bioavailability, and Metabolomics. In Polyphenols: Properties, Recovery, and Applications; Galanakis, C.M., Ed.; Woodhead Publishing: Southen, UK, 2018; pp. 45–67. ISBN 978-0-12-813572-3. [Google Scholar]
  3. Cvejić, J.; Atanacković Krstonošić, M.; Mikulić, M.; Miljić, U. Polyphenols. In Nutraceutical and Functional Food Components; Elsevier: Amsterdam, The Netherlands, 2022; pp. 243–312. ISBN 978-0-323-85052-0. [Google Scholar]
  4. Carocho, M.; Ferreira, I.C.F.R. A Review on Antioxidants, Prooxidants and Related Controversy: Natural and Synthetic Compounds, Screening and Analysis Methodologies and Future Perspectives. Food Chem. Toxicol. 2013, 51, 15–25. [Google Scholar] [CrossRef] [PubMed]
  5. Aoi, W.; Iwasa, M.; Marunaka, Y. Metabolic Functions of Flavonoids: From Human Epidemiology to Molecular Mechanism. Neuropeptides 2021, 88, 102163. [Google Scholar] [CrossRef]
  6. Wang, X.; Ding, G.; Liu, B.; Wang, Q. Flavonoids and Antioxidant Activity of Rare and Endangered Fern: Isoetes Sinensis. PLoS ONE 2020, 15, e0232185. [Google Scholar] [CrossRef] [PubMed]
  7. Aibibaihan, M.-Z.; Zhang, J.; Zhu, J.; Wang, G.-P.; Li, X.-J.; Qiu, Y.-J.; He, W.; Wang, L. Comprehensive analysis of components in Chinese medicines derived from Apocynum venetum and Poacynum pictum in Xinjiang based on HPLC fingerprint and chemometrics. J. Chin. Mater. Med. 2021, 46, 3886–3892. [Google Scholar] [CrossRef]
  8. Abubakar, A.S.; Gao, G.; Zhu, A. Apocynum Venetum, A Bast Fiber Plant with Medicinal Significances and Potentials for Drought Tolerance and Phytoremediation Studies—A Review. J. Nat. Fibers 2021, 1–13. [Google Scholar] [CrossRef]
  9. Gao, G.; Chen, P.; Chen, J.; Chen, K.; Wang, X.; Abubakar, A.S.; Liu, N.; Yu, C.; Zhu, A. Genomic Survey, Transcriptome, and Metabolome Analysis of Apocynum venetum and Apocynum hendersonii to Reveal Major Flavonoid Biosynthesis Pathways. Metabolites 2019, 9, 296. [Google Scholar] [CrossRef] [Green Version]
  10. Feng, Y.; Feng, Y.; Jiang, C.; Jiang, C.; Yang, F.; Yang, F.; Chen, Z.; Chen, Z.; Li, Z.; Li, Z. Apocynum Venetum Leaf Extract Protects against H2O2-Induced Oxidative Stress by Increasing Autophagy in PC12 Cells. Biomed. Rep. 2020, 13, 6. [Google Scholar] [CrossRef]
  11. Du, S.; Huang, H.; Li, X.; Zhai, L.; Zhu, Q.; Zheng, K.; Song, X.; Xu, C.; Li, C.; Li, Y.; et al. Anti-Inflammatory Properties of Uvaol on DSS-Induced Colitis and LPS-Stimulated Macrophages. Chin. Med. 2020, 15, 43. [Google Scholar] [CrossRef]
  12. Yamatsu, A.; Yamashita, Y.; Maru, I.; Yang, J.; Tatsuzaki, J.; Kim, M. The Improvement of Sleep by Oral Intake of GABA and Apocynum venetum Leaf Extract. J. Nutr. Sci. Vitaminol. 2015, 61, 182–187. [Google Scholar] [CrossRef]
  13. Zhang, Y.; Liu, S.; Ma, J.-L.; Chen, C.; Huang, P.; Ji, J.-H.; Wu, D.; Ren, L.-Q. Apocynum venetum Leaf Extract Alleviated Doxorubicin-Induced Cardiotoxicity through the AKT/Bcl-2 Signaling Pathway. Phytomedicine 2022, 94, 153815. [Google Scholar] [CrossRef] [PubMed]
  14. Zhang, W.; Dong, Z.; Chang, X.; Zhang, C.; Rong, G.; Gao, X.; Zeng, Z.; Wang, C.; Chen, Y.; Rong, Y.; et al. Protective effect of the total flavonoids from Apocynum venetum L. on carbon tetrachloride-induced hepatotoxicity in vitro and in vivo. J. Physiol. Biochem. 2018, 74, 301–312. [Google Scholar] [CrossRef] [PubMed]
  15. Lau, Y.S.; Kwan, C.Y.; Ku, T.C.; Hsieh, W.T.; Wang, H.D.; Nishibe, S.; Dharmani, M.; Mustafa, M.R. Apocynum venetum Leaf Extract, an Antihypertensive Herb, Inhibits Rat Aortic Contraction Induced by Angiotensin II: A Nitric Oxide and Superoxide Connection. J. Ethnopharmacol. 2012, 143, 565–571. [Google Scholar] [CrossRef]
  16. Xie, W.; Jiang, Z.; Wang, J.; Zhang, X.; Melzig, M.F. Protective Effect of Hyperoside against Acetaminophen (APAP) Induced Liver Injury through Enhancement of APAP Clearance. Chem. Biol. Interact. 2016, 246, 11–19. [Google Scholar] [CrossRef] [PubMed]
  17. Jiang, L.; She, C.; Tian, C.; Tanveer, M.; Wang, L. Storage Period and Different Abiotic Factors Regulate Seed Germination of Two Apocynum Species—Cash Crops in Arid Saline Regions in the Northwestern China. Front. Plant Sci. 2021, 12, 671157. [Google Scholar] [CrossRef]
  18. Zhuang, Q.; Wu, S.; Feng, X.; Niu, Y. Analysis and Prediction of Vegetation Dynamics under the Background of Climate Change in Xinjiang, China. PeerJ 2020, 8, e8282. [Google Scholar] [CrossRef] [PubMed]
  19. Meng, F.; Olesen, J.E.; Sun, X.; Wu, W. Inorganic Nitrogen Leaching from Organic and Conventional Rice Production on a Newly Claimed Calciustoll in Central Asia. PLoS ONE 2014, 9, e98138. [Google Scholar] [CrossRef] [PubMed]
  20. Xie, W.; Zhang, X.; Wang, T.; Hu, J. Botany, Traditional Uses, Phytochemistry and Pharmacology of Apocynum venetum L. (Luobuma): A Review. J. Ethnopharmacol. 2012, 141, 1–8. [Google Scholar] [CrossRef]
  21. Gao, G.; Liu, N.; Yu, C.; Chen, P.; Chen, J.; Chen, K.; Wang, X.; Liu, B.; Zhu, A. UPLC-ESI-MS/MS Based Characterization of Active Flavonoids from Apocynum spp. and Anti-Bacteria Assay. Antioxidants 2021, 10, 1901. [Google Scholar] [CrossRef]
  22. Abubakar, A.S.; Huang, X.; Birhanie, Z.M.; Gao, G.; Feng, X.; Yu, C.; Chen, P.; Chen, J.; Chen, K.; Wang, X.; et al. Phytochemical Composition, Antioxidant, Antibacterial, and Enzyme Inhibitory Activities of Various Organic Extracts from Apocynum hendersonii (Hook.f.) Woodson. Plants 2022, 11, 1964. [Google Scholar] [CrossRef]
  23. Liang, T.; Yue, W.; Li, Q. Comparison of the Phenolic Content and Antioxidant Activities of Apocynum venetum L. (Luo-Bu-Ma) and Two of Its Alternative Species. Int. J. Mol. Sci. 2010, 11, 4452–4464. [Google Scholar] [CrossRef] [PubMed]
  24. Almaiman, S.A.; Albadr, N.A.; Alsulaim, S.; Alhuthayli, H.F.; Osman, M.A.; Hassan, A.B. Effects of Microwave Heat Treatment on Fungal Growth, Functional Properties, Total Phenolic Content, and Antioxidant Activity of Sorghum (Sorghum bicolor L.) Grain. Food Chem. 2021, 348, 128979. [Google Scholar] [CrossRef] [PubMed]
  25. Munteanu, I.G.; Apetrei, C. Analytical Methods Used in Determining Antioxidant Activity: A Review. Int. J. Mol. Sci. 2021, 22, 3380. [Google Scholar] [CrossRef] [PubMed]
  26. Ilyasov, I.R.; Beloborodov, V.L.; Selivanova, I.A.; Terekhov, R.P. ABTS/PP Decolorization Assay of Antioxidant Capacity Reaction Pathways. Int. J. Mol. Sci. 2020, 21, 1131. [Google Scholar] [CrossRef] [PubMed] [Green Version]
  27. Benzie, I.F.F.; Strain, J.J. The Ferric Reducing Ability of Plasma (FRAP) as a Measure of “Antioxidant Power”: The FRAP Assay. Anal. Biochem. 1996, 239, 70–76. [Google Scholar] [CrossRef] [PubMed] [Green Version]
  28. Pandey, M.M.; Khatoon, S.; Rastogi, S.; Rawat, A.K.S. Determination of Flavonoids, Polyphenols and Antioxidant Activity of Tephrosia Purpurea: A Seasonal Study. J. Integr. Med. 2016, 14, 447–455. [Google Scholar] [CrossRef]
  29. Ouerghemmi, I.; Bettaieb Rebey, I.; Rahali, F.Z.; Bourgou, S.; Pistelli, L.; Ksouri, R.; Marzouk, B.; Saidani Tounsi, M. Antioxidant and Antimicrobial Phenolic Compounds from Extracts of Cultivated and Wild-Grown Tunisian Ruta Chalepensis. J. Food Drug Anal. 2017, 25, 350–359. [Google Scholar] [CrossRef] [PubMed] [Green Version]
  30. Babii, C.; Bahri, L.G.; Neagu, A.-N.; Gostin, I.; Mihasan, M.; Birsa, L.M.; Stefan, M. Antibacterial activity and proposed action mechanism of a new class of synthetic tricyclic flavonoids. J. Appl. Microbiol. 2016, 120, 630–637. [Google Scholar] [CrossRef] [Green Version]
  31. Shen, T.; Hu, F.; Liu, Q.; Wang, H.; Li, H. Analysis of Flavonoid Metabolites in Chaenomeles Petals Using UPLC-ESI-MS/MS. Molecules 2020, 25, 3994. [Google Scholar] [CrossRef]
  32. Guo, Y.-P.; Yang, H.; Wang, Y.-L.; Chen, X.-X.; Zhang, K.; Wang, Y.-L.; Sun, Y.-F.; Huang, J.; Yang, L.; Wang, J.-H. Determination of Flavonoids Compounds of Three Species and Different Harvesting Periods in Crataegi folium Based on LC-MS/MS. Molecules 2021, 26, 1602. [Google Scholar] [CrossRef]
  33. Das, M.C.; Samaddar, S.; Jawed, J.J.; Ghosh, C.; Acharjee, S.; Sandhu, P.; Das, A.; Daware, A.V.; De, U.C.; Majumdar, S.; et al. Vitexin Alters Staphylococcus Aureus Surface Hydrophobicity to Obstruct Biofilm Formation. Microbiol. Res. 2022, 263, 127126. [Google Scholar] [CrossRef]
  34. de Jesus, C.C.M.; de Araújo, M.H.; Simão, T.L.B.V.; Lasunskaia, E.B.; Barth, T.; Muzitano, M.F.; Pinto, S.C. Natural Products from Vitex polygama and Their Antimycobacterial and Anti-Inflammatory Activity. Nat. Prod. Res. 2022, 36, 1337–1341. [Google Scholar] [CrossRef]
  35. Abdelwahab, M.; Sangi, S.; Arafat, H.; Ragab, E. New Phytochemical Constituent and Bioactivities of Horwoodia dicksoniae and Rumex cyprius. Pharmacogn. Mag. 2016, 12, 165. [Google Scholar] [CrossRef] [Green Version]
  36. Song, X.; Tan, L.; Wang, M.; Ren, C.; Guo, C.; Yang, B.; Ren, Y.; Cao, Z.; Li, Y.; Pei, J. Myricetin: A Review of the Most Recent Research. Biomed. Pharmacother. 2021, 134, 111017. [Google Scholar] [CrossRef]
  37. Mensor, L.L.; Menezes, F.S.; Leitão, G.G.; Reis, A.S.; dos Santos, T.C.; Coube, C.S.; Leitão, S.G. Screening of Brazilian Plant Extracts for Antioxidant Activity by the Use of DPPH Free Radical Method: Antioxidant Activity in Brazilian Plants. Phytother. Res. 2001, 15, 127–130. [Google Scholar] [CrossRef]
  38. Barros, L.; Pereira, E.; Calhelha, R.C.; Dueñas, M.; Carvalho, A.M.; Santos-Buelga, C.; Ferreira, I.C.F.R. Bioactivity and Chemical Characterization in Hydrophilic and Lipophilic Compounds of Chenopodium ambrosioides L. J. Funct. Foods 2013, 5, 1732–1740. [Google Scholar] [CrossRef]
  39. Ghasemzadeh, A.; Jaafar, H.Z.E.; Rahmat, A. Antioxidant Activities, Total Phenolics and Flavonoids Content in Two Varieties of Malaysia Young Ginger (Zingiber officinale Roscoe). Molecules 2010, 15, 4324–4333. [Google Scholar] [CrossRef] [Green Version]
  40. Yi, Y.; Hua, H.; Sun, X.; Guan, Y.; Chen, C. Rapid Determination of Polysaccharides and Antioxidant Activity of Poria cocos Using Near-Infrared Spectroscopy Combined with Chemometrics. Spectrochim. Acta A Mol. Biomol. Spectrosc. 2020, 240, 118623. [Google Scholar] [CrossRef]
  41. Yang, G.; Liang, K.; Zhou, Z.; Wang, X.; Huang, G. UPLC-ESI-MS/MS-Based Widely Targeted Metabolomics Analysis of Wood Metabolites in Teak (Tectona grandis). Molecules 2020, 25, 2189. [Google Scholar] [CrossRef]
  42. Wang, A.; Li, R.; Ren, L.; Gao, X.; Zhang, Y.; Ma, Z.; Ma, D.; Luo, Y. A Comparative Metabolomics Study of Flavonoids in Sweet Potato with Different Flesh Colors (Ipomoea batatas (L.) Lam). Food Chem. 2018, 260, 124–134. [Google Scholar] [CrossRef]
  43. Kanehisa, M.; Furumichi, M.; Tanabe, M.; Sato, Y.; Morishima, K. KEGG: New perspectives on genomes, pathways, diseases and drugs. Nucleic Acids Res. 2017, 45, D353–D361. [Google Scholar] [CrossRef]
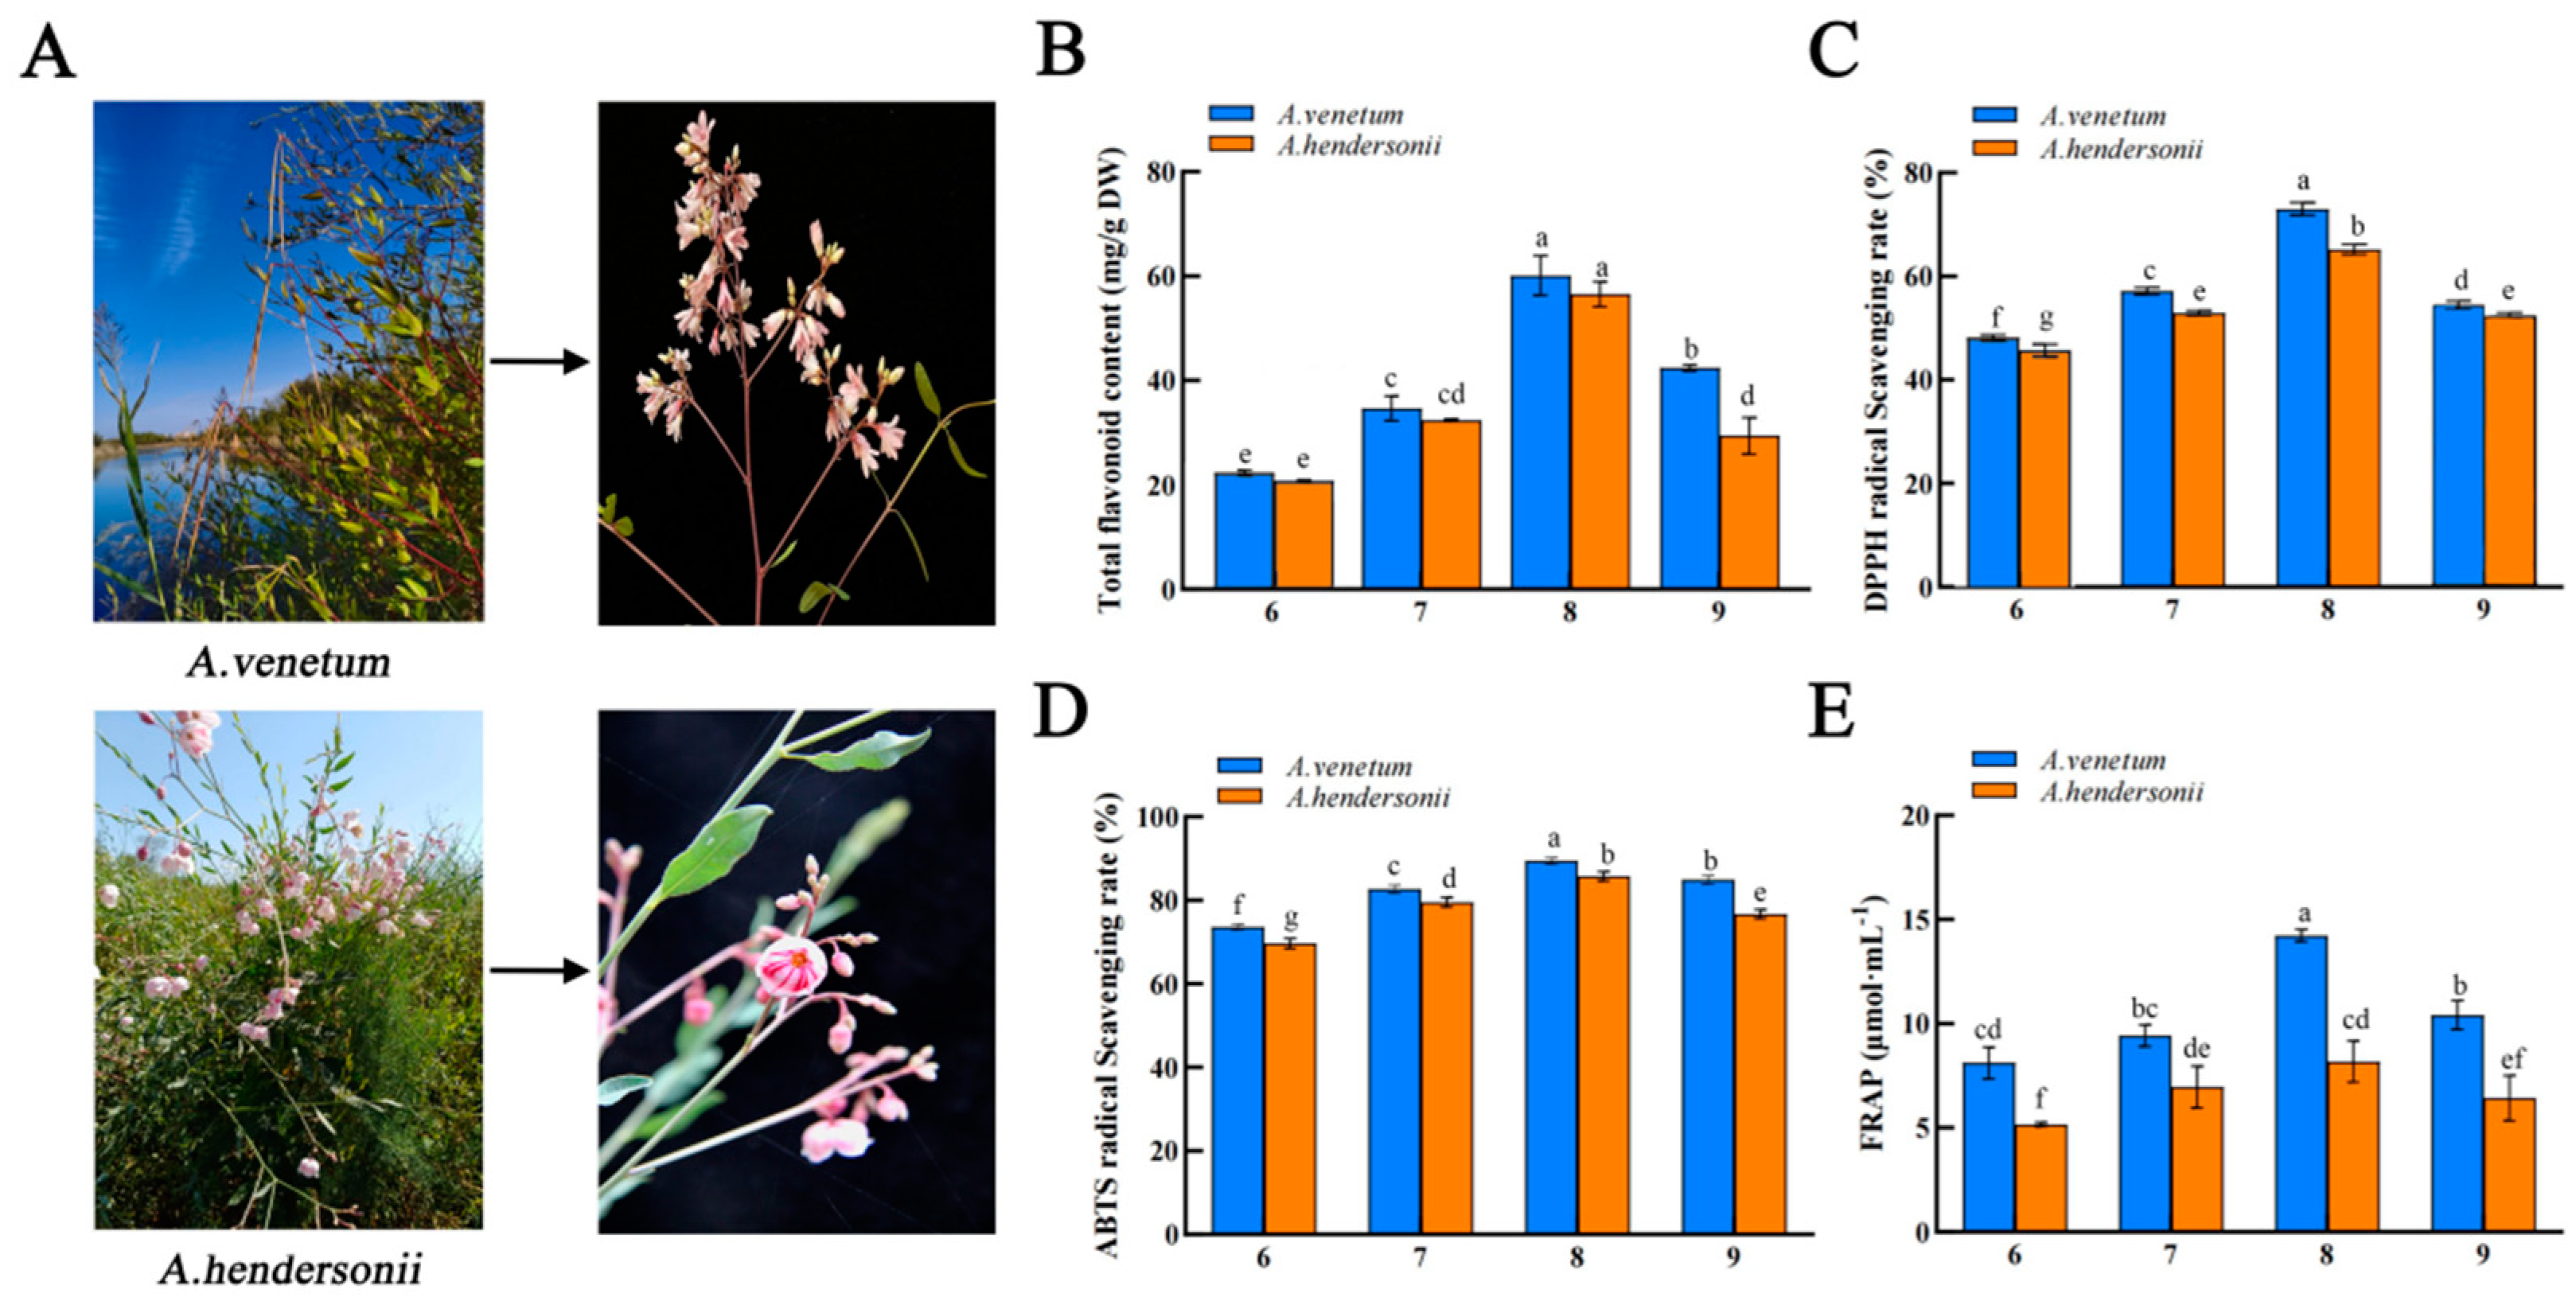
Figure 1. Morphology of A. venetum and A. hendersonii. (A) Total flavonoid content of A. venetum and A. hendersonii at different harvesting stages. (B) DPPH (C) and ABTS. (D) Radical scavenging activities, and FRAP. (E) The 6, 7, 8, and 9 represent the sampling periods June, July, August, and September, respectively. Histogram bars with different letters (a–f) are statistically different (p < 0.05).
Molecules 27 07343 g001
Figure 2. Digital images of inhibition zones of the Apocynum extracts against (A) Gram-negative E. coli, gram-positive MRSA, and fungal A. niger after treatment with different treatment groups: (1) Cosolvent; (2) A. hendersonii extract; (3) A. venetum extract, respectively. Diameter of the zone of inhibition. (B) The relative bacteriostatic ring area (C) was computed using π r 2 . Data are presented as mean ± SD, n = 3. Histogram bars with different letters (a–e) are statistically different (p < 0.05).
Molecules 27 07343 g002
Figure 3. Heat map of the various flavonoid components and differential flavonoid metabolite analysis based on OPLS-DA. (A) a heat map of the various flavonoid components. (B,C) OPLS-DA differential metabolite analysis plots. AV means A. venetum, AH A. hendersonii, and the numbers 1, 2, 3, and 4 (as in AV1, AH1) stand for replicates numbers.
Molecules 27 07343 g003
Figure 4. PCA score plot, KEGG enrichment analysis, correlation of flavonoid constituents and differentially enriched flavonoids of A. venetum and A. hendersonii (AD). (A) PCA score plot. (B) KEGG enrichment of differential metabolites between AV and AH. (C) Correlations of AV and AH metabolites; the red and blue indicate positive and negative correlations, respectively. (D) Differentially enriched flavonoids of AV and AH. Each bubble represents a metabolic pathway. The colour of the bubbles represents the p-value for the enrichment analysis, with darker colours indicating higher levels of enrichment and larger bubbles indicating a more significant influence on the pathway.
Molecules 27 07343 g004
Table 1. Pearson correlation coefficient of the Apocynum total flavonoid content and antioxidant capacities.
Antioxidant AssayCorrelation Coefficient
DPPH0.926 **
ABTS0.923 **
FRAP0.734 *
**,* Significant correlation (p < 0.01, p < 0.05, respectively).
Table 2. A list of differential metabolites between A. venetum and A. hendersonii.
CompoundsClassAverage (AH)Average (AV)VIPFClog2 (FC)
FormononetinIsoflavones0.0000.4450.0040.204−2.292
6-MethoxyflavoneFlavones0.0000.6290.0060.000−19.262
VitexinFlavones320.05613.0030.12224.6144.621
IsoorientinFlavones59.5003.7600.05215.8233.984
OrientinFlavones138.48044.1950.0683.1331.648
IsoliquiritigeninFlavanones0.4131.4220.0070.291−1.783
EriodictyolFlavanones191.39852.8120.0793.6241.858
Myricetin 3-galactosideFlavonols2479.29527,784.4661.1560.089−3.486
CosmosiinFlavonols1430.489262.0410.2475.4592.449
MyricitrinFlavonols31.2700.0000.0379.0654.898
Quercetin 3-galactosideFlavonols48,353.573296,554.4393.6550.163−2.617
Quercetin 3-O-glucuronideFlavonols168,298.27220,235.552.8008.3173.056
Isorhamnetin-3-O-glucosideFlavonols3351.903479.2930.3876.9932.806
Delphinidin 3-glucosideAnthocyanins32,306.137188,173.0562.9110.172−2.542
Proanthocyanidin A2Proanthocyanidins148.867556.4780.1480.268−1.902
Procyanidin B1Proanthocyanidins4123.93038,822.6971.3700.106−3.235
Procyanidin B3Proanthocyanidins431.0802299.4890.3110.187−2.415
Procyanidin B2Proanthocyanidins193,378.541673,060.9205.1030.287−1.799
PhloretinDihydrochalcones12.653115.9650.0710.109−3.196
TrilobatinDihydrochalcones112.8711210.5400.2450.093−3.423
PhlorizinDihydrochalcones2479.88935,922.7881.3400.069−3.857
(-)-Epicatechin 3-O-gallateCatechin derivatives74.90536.3120.0452.0631.045
CatechinCatechin derivatives12,482.78032,814.5460.9780.380−1.394
(±)-GallocatechinCatechin derivatives87,069.706318,346.7583.5730.274−1.870
Average (AV/AH): Average expression of A. venetum/A. hendersonii metabolites, VIP: Variable importance in the projection, FC: Fold change, Log2 (FC): Ratio of the mean expression of metabolites in the two sets of samples, positive values indicate upregulation, negative values indicate downregulation.
Publisher’s Note: MDPI stays neutral with regard to jurisdictional claims in published maps and institutional affiliations.