Abstract
The deficiency or wrong combination of metal ions in Cu, Zn-superoxide dismutase (SOD1), is regarded as one of the main factors causing the aggregation of SOD1 and then inducing amyotrophic lateral sclerosis (ALS). A ligands-targets screening process based on native electrospray ionization ion mobility mass spectrometry (ESI-IMS-MS) was established in this study. Four glycosides including daidzin, sophoricoside, glycitin, and genistin were screened out from seven soybean isoflavone compounds and were found to interact with zinc-deficient or metal-free SOD1. The structure and conformation stability of metal-free and zinc-deficient SOD1 and their complexes with the four glycosides was investigated by collision-induced dissociation (CID) and collision-induced unfolding (CIU). The four glycosides could strongly bind to the metal-free and copper recombined SOD1 and enhance the folding stability of these proteins. Additionally, the ThT fluorescence assay showed that these glycosides could inhibit the toxic aggregation of the zinc-deficient or metal-free SOD1. The competitive interaction experiments together with molecular docking indicate that glycitin, which showed the best stabilizing effects, binds with SOD1 between β-sheet 6 and loop IV. In short, this study provides good insight into the relationship between inhibitors and different SOD1s.
1. Introduction
Cu, Zn-superoxide dismutase (SOD1, a 32 kDa homodimeric protein) was the first protein found to be closely related to amyotrophic lateral sclerosis (ALS) [1]. One of the possible mechanisms of ALS is the death of motor neurons caused by toxic aggregated SOD1. The toxic aggregated SOD1 has been found in both familial and sporadic ALS cases [2]. The misfolding and dissociation of SOD1 due to mutations, wrong metallization, or aberrant post-translational modifications are the main causes of aggregation [3,4,5].
Although there is still no cure strategy for ALS, researchers never stop making efforts to find effective medicine and treatment methods. Inhibiting the aggregation of SOD1 was thought to be one of the key treatment methods [6]. Some small molecules or peptides that contain high-affinity structures with target proteins may disturb or change the aggregation pathway [7,8,9]. A variety of such molecules were searched from natural products [10,11,12]. In our previous work, some natural flavonoids and their derivatives have been studied, and proved to be effective inhibitors of SOD1 misfolding and aggregation [13,14,15,16].
Soybean isoflavones including aglycones and glycosides are a series of 3-benzopyranone compounds mainly found in soybeans [17]. Epidemiological investigations and research have connected these compounds to a variety of health factors such as limiting the development of cardiovascular diseases, osteoporosis, type 2 diabetes, and breast cancer [18,19,20,21]. The ability of antioxidants, the regulation of hormones, and the cell growth of isoflavones lead to the reduction of disease risk [22,23]. Many studies have proved the antioxidant properties of soybean isoflavones by the expression and activity changes of SOD1 [22]. However, no research has ever been concerned about the possible direct influence on the structure of SOD1 taken by these isoflavones.
Native mass spectrometry (MS) has been proven effective in analyzing the structural dynamics of non-covalent protein interactions such as protein-ligand (P-L) interactions [24]. The binding situation of P-L can be read directly from mass to charge (m/z) changes in the spectra. The signal intensity of the complexes usually provides binding affinity information of ligands. Comparing the structure stability of protein and P-L complexes is a reliable way of screening more targeted drug molecules [25]. Sometimes the research of ligand binding requires denaturing of the protein in order to increase the sensitivity or fragmentation of the protein to study the binding sites. This would reduce the biological significance. Ion mobility spectrometry can show structure information in the gas phase while keeping the native state in the solution during sample pretreatment [26]. Additionally, collision-induced-dissociation and collision-induced-unfolding are two adjunctive methods by giving collision energy (CE) to proteins or P-L complexes. The resulting structural changes bring different drift times (DT) and peak intensity distributions in ion mobility spectrometry (IMS) [27].
Based on our previous work, some kinds of flavonoids [13], stilbenoids [14], catechins [15], and caffeoylquinic acids [16] were found to form stable non-covalent complexes with wild-type SOD1 (Cu2Zn2SOD1) or metal-free SOD1 (ApoSOD1). Some of these compounds were proved to inhibit the aggregation of ApoSOD1. As isoflavones contain similar structure as the compounds mentioned above and show multiple biological functions, in this study, we firstly used the ESI-MS method to screen the bioactive ligands, which could effectively interact with different SOD1s from the incubation system of the soybean isoflavone mixture with various SOD1 species and confirm the target SOD1 species of these bioactive ligands (four glycosides). We then investigated the interaction between bioactive isoflavone glycoside and target SOD1s. Partly or wrongly metallated SOD1 has been reported to induce the toxic aggregation linked with ALS [28]. Therefore, two kinds of abnormally metallated SOD1s became our targets for screening, interaction, structure, and aggregation analysis. CID and CIU experiments were performed to show the influence on the target SOD1s’ structure taken by the isoflavone glycosides. The method of TFE-induced aggregation was used to investigate the inhibition ability of the isoflavone glycosides to the aggregation of target SOD1s. The binding sites of these bioactive ligands on target SOD1s were predicted by experimental and theoretical methods.
2. Results and Discussion
2.1. Screening of Potential Inhibitors and Targets
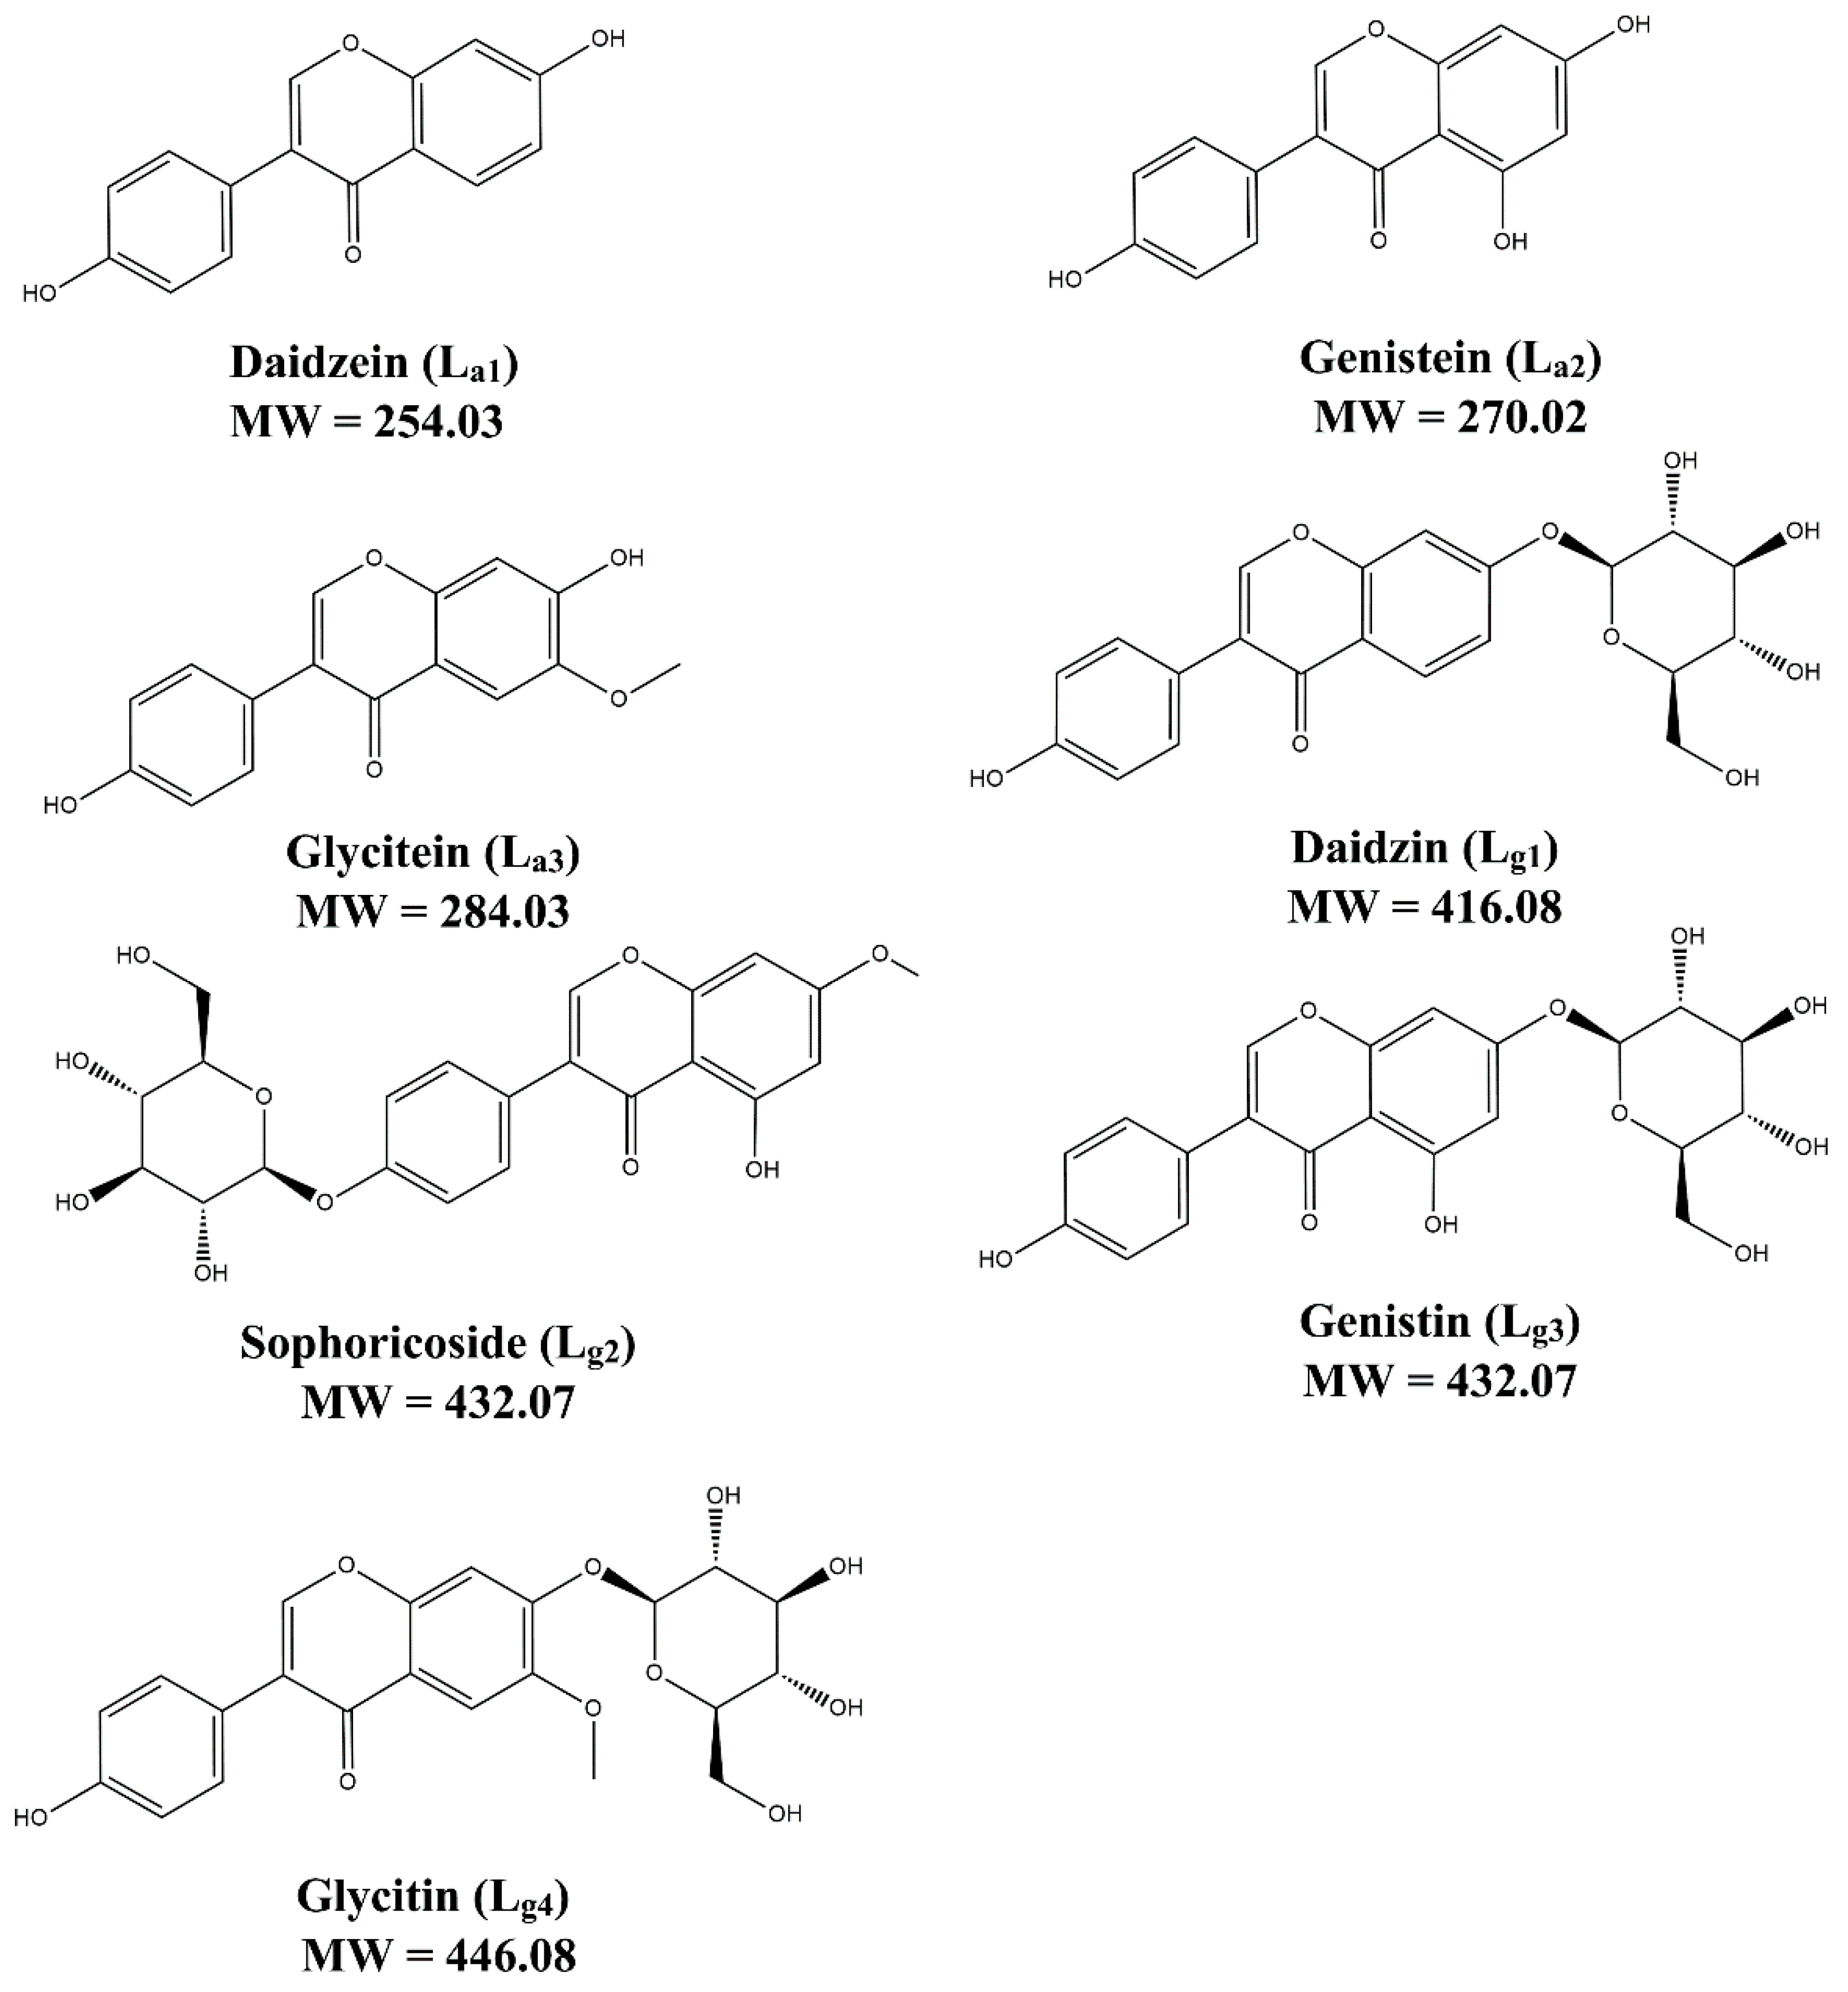
Ligands that can bind with SOD1 are firstly screened from a mixture of seven soybean isoflavones, including three aglycones (La1–La3) and four glycosides (Lg1–Lg4). Their structures are shown in Figure 1. ESI–MS experiments of the isoflavone mixture with and without ApoSOD1, Cu2SOD1, and Cu2Zn2 SOD1 (P1, P2, and P3) are performed. Here we used bovine SOD1 instead of human SOD1, as their secondary structure are quite similar (referred from 1SXA and 6FN8 in the PDB database). Observing the MS intensity fading of free components is a usual method in ligand screening [29]. Here, compared with the intensity fading mass spectra (Figure S1, Table S1), it can be found that the intensity of free Lg1–Lg4 decreases after the addition of proteins while the intensity of free La1–La3 does not change the attenuation of free Lg1–Lg4, which indicates that part of these glycosides interact with the SOD1s. Thus, the following study focuses on these glycosides.
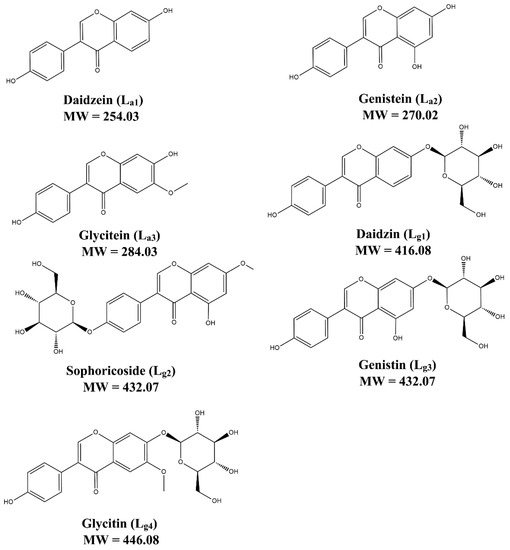
Figure 1.
The structure of seven soybean isoflavones.
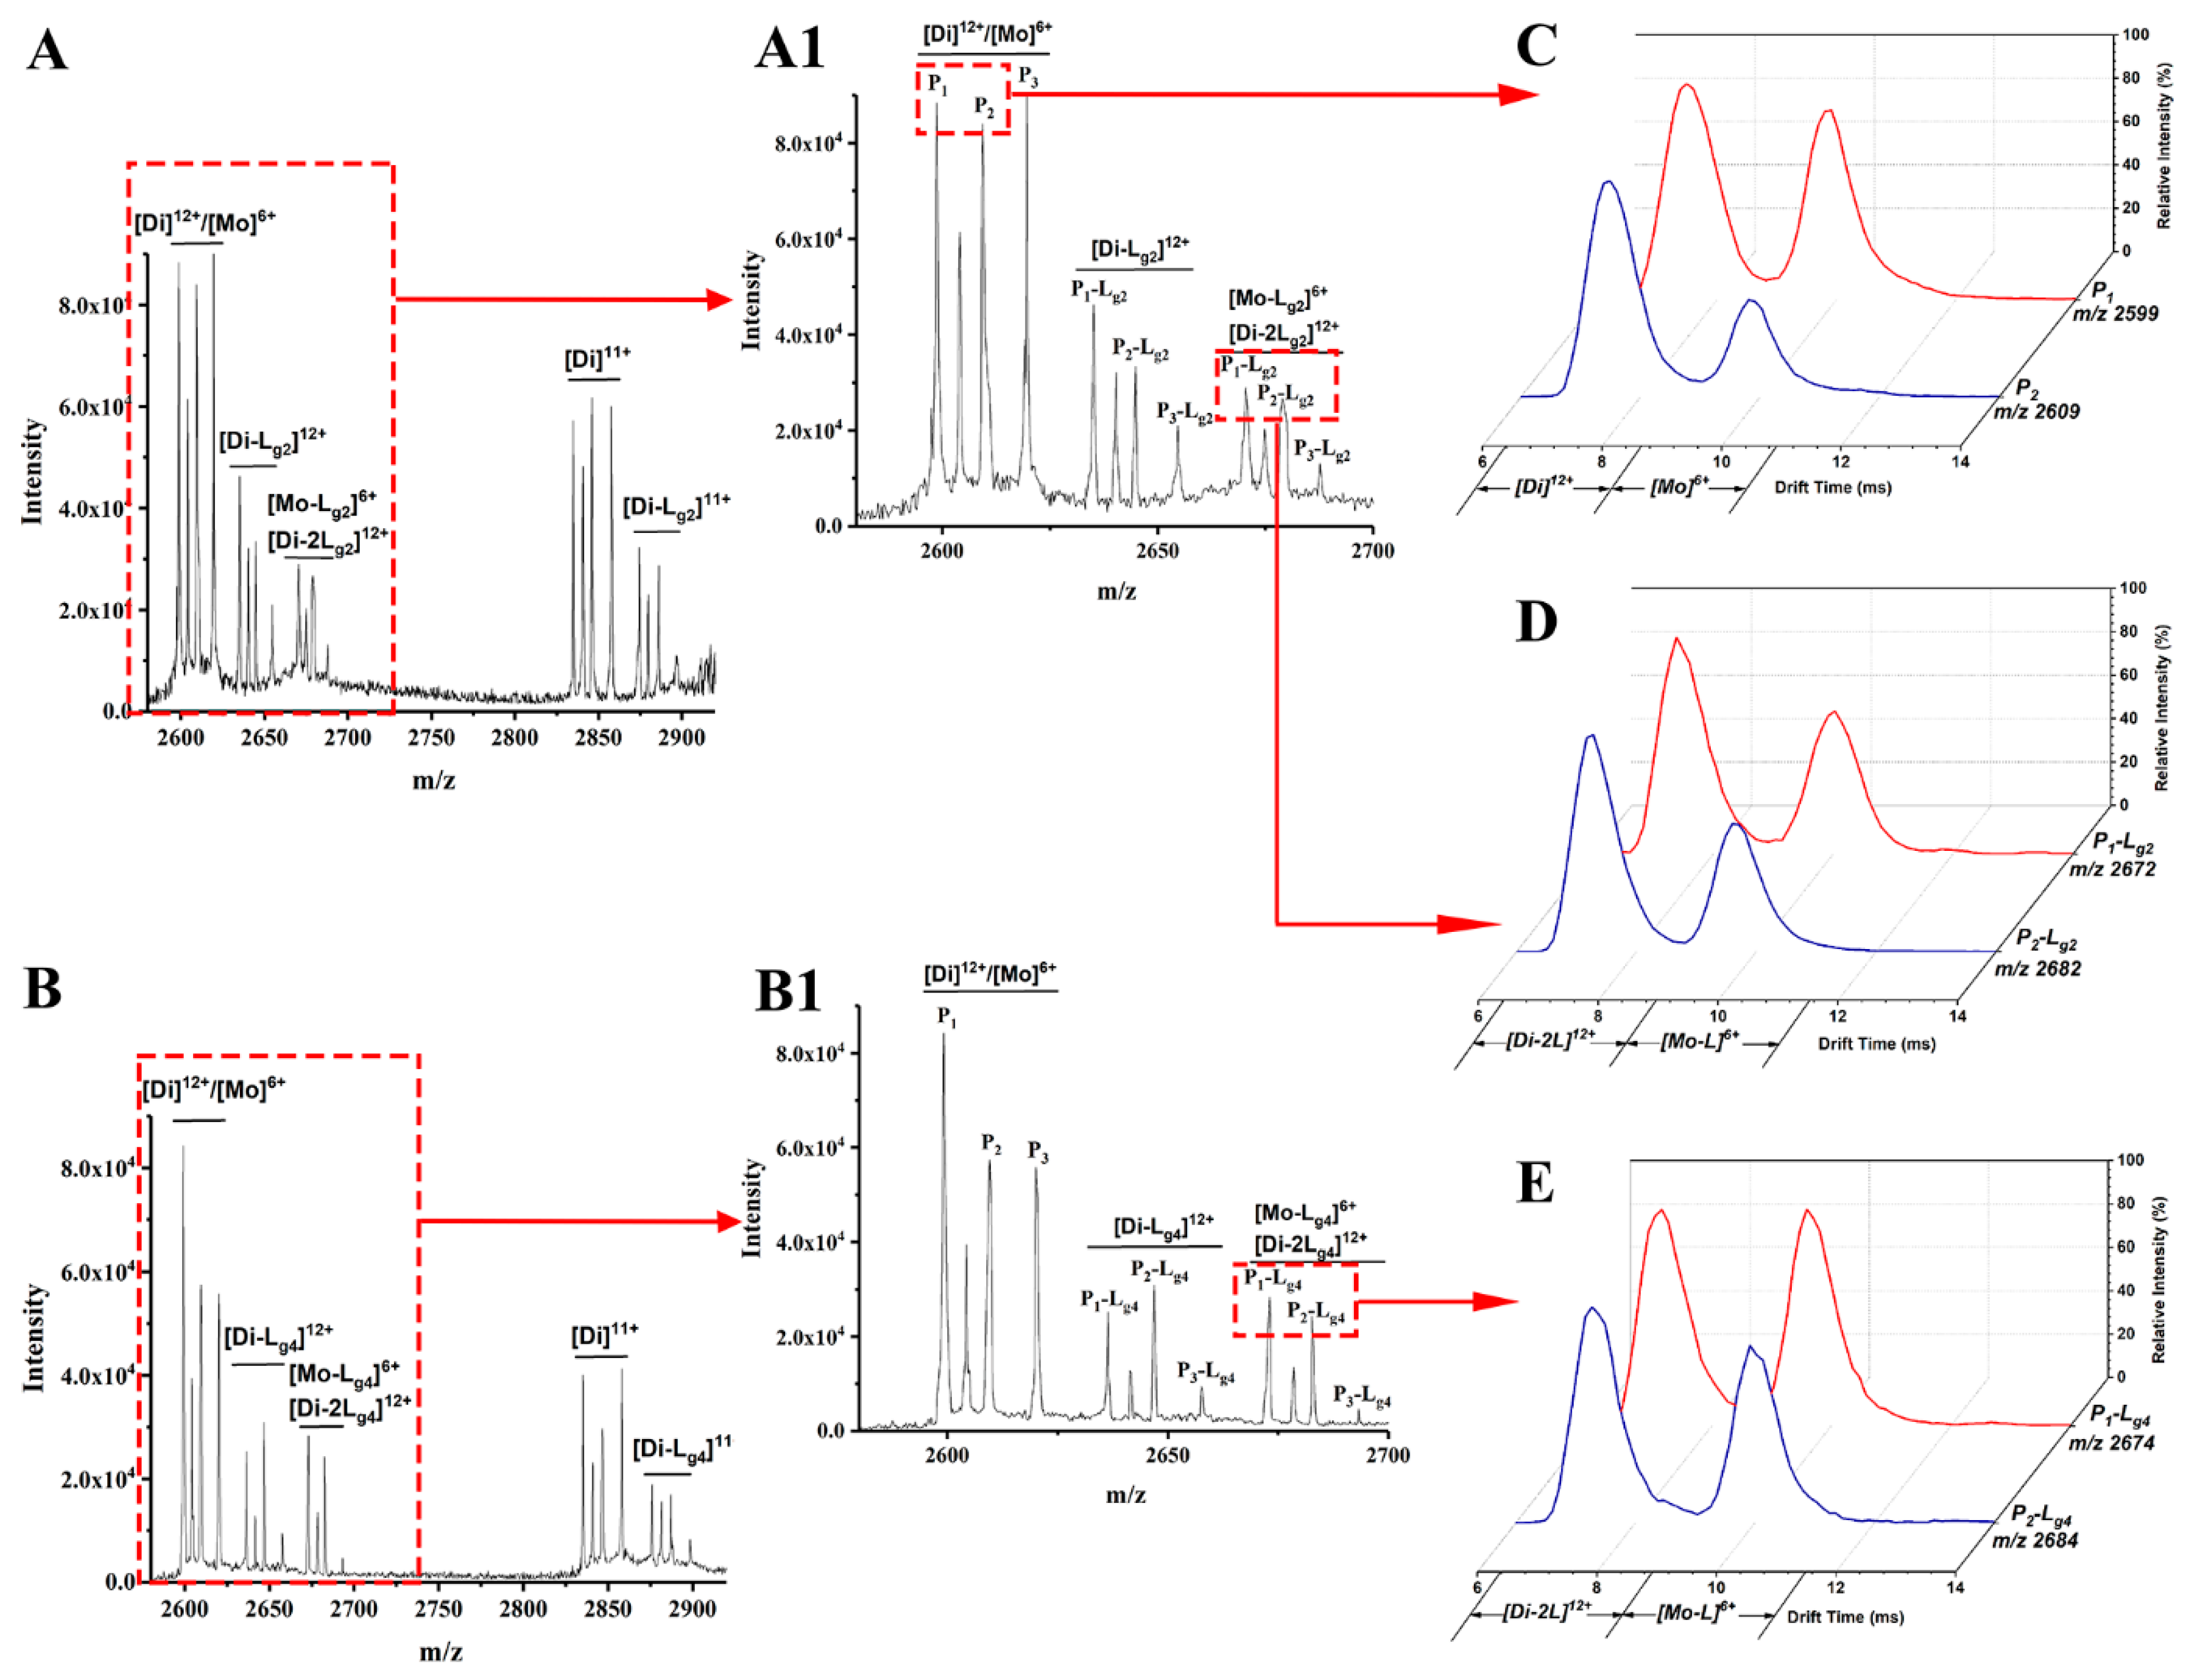
Lg2 and Lg4 are chosen as an example of glycosides interacting with the P1–P3 mixture. The possible target proteins for these glycosides include P1–P3 dimers (Di) and the monomers (Mo) dissociated from these dimers. Thus, ion mobility spectrometry (IMS) is used together with ESI-MS to confirm the targets. As shown in MS spectra (Figure 2A,A1), (Figure 2B,B1) of glycosides (Lg2 and Lg4) interacted with the P1-P3 mixture, and complex ions with different charges were found, such as [Di-L]11+, [Di-L]12+ and [Di-2L]12+ or [Mo-L]6+, etc. It is found that the intensity of all P3-L complex ions is far less than that of those complexes of P1-L or P2-L. Therefore, P1 and P2 are regarded as the main binding targets of the glycosides, while P3 (Cu2Zn2SOD1) will no longer be concerned in this study. The 12+ charged dimer ([Di]12+) and 6+ charged monomer ([Mo]6+) of P1 or P2 share the same m/z in ESI-MS spectra (m/z 2599 for P1 and 2609 for P2), and can be divided after being extracted into IMS spectra (Figure 2C). According to our previous work, ref. [30] the peak at low drift time corresponds to [Di]12+ and the other one corresponds to [Mo]6+. Such results also occur for P-L complexes, as shown in Figure 2D,E, which show the extracted IMS spectra from the MS peaks of the complexes including P1-Lg2 at m/z 2672, P2-Lg2 at m/z 2682, P1-Lg4 at m/z 2674, and P2-Lg4 at m/z 2684. The IMS spectra profile of the complex ions is similar to that of P1 and P2, which means that their complexes also contain [Di-2Lg]12+and [Mo-Lg]6+ forms. Thus, the two peaks in the IMS spectra of each complex can be classified as [Di-2L]12+ and [Mo-L]6+. Therefore, both dimers and monomers of P1 and P2 can be regarded as the main binding targets of ligands. A series of calculations reflecting the complex generation quantity is listed in Table S2. According to the results, the dimer of P1 seems to more easily bind with the four ligands. P2 complexes also show appreciable percentages. The difference is that the binding rate of the P2 monomer seems slightly higher than its dimer. P3 shows the lowest binding ability, which is the same as the results of the visual observation of the spectra.
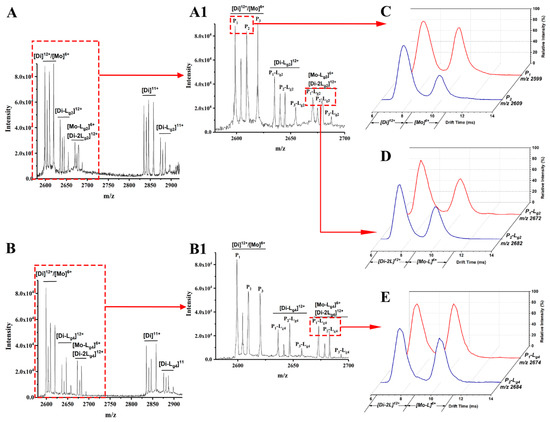
Figure 2.
Mass spectra of sophoricoside (Lg2) with the SOD1 mixture (A) and glycitin (Lg4) with the SOD1 mixture (B). An enlarged view between m/z 2600 and 2700 is shown in (A1,B1). The IMS spectra of ApoSOD1 (P1) and Cu2 SOD1 (P2) (C), P1-Lg2 and P2-Lg2 complexes (D), and P1-Lg4 and P2-Lg4 complexes (E) are extracted from the MS peaks of the m/z labeled beside the IMS curves.
2.2. Binding Affinity of ApoSOD1, Cu2SOD1 with Glycosides
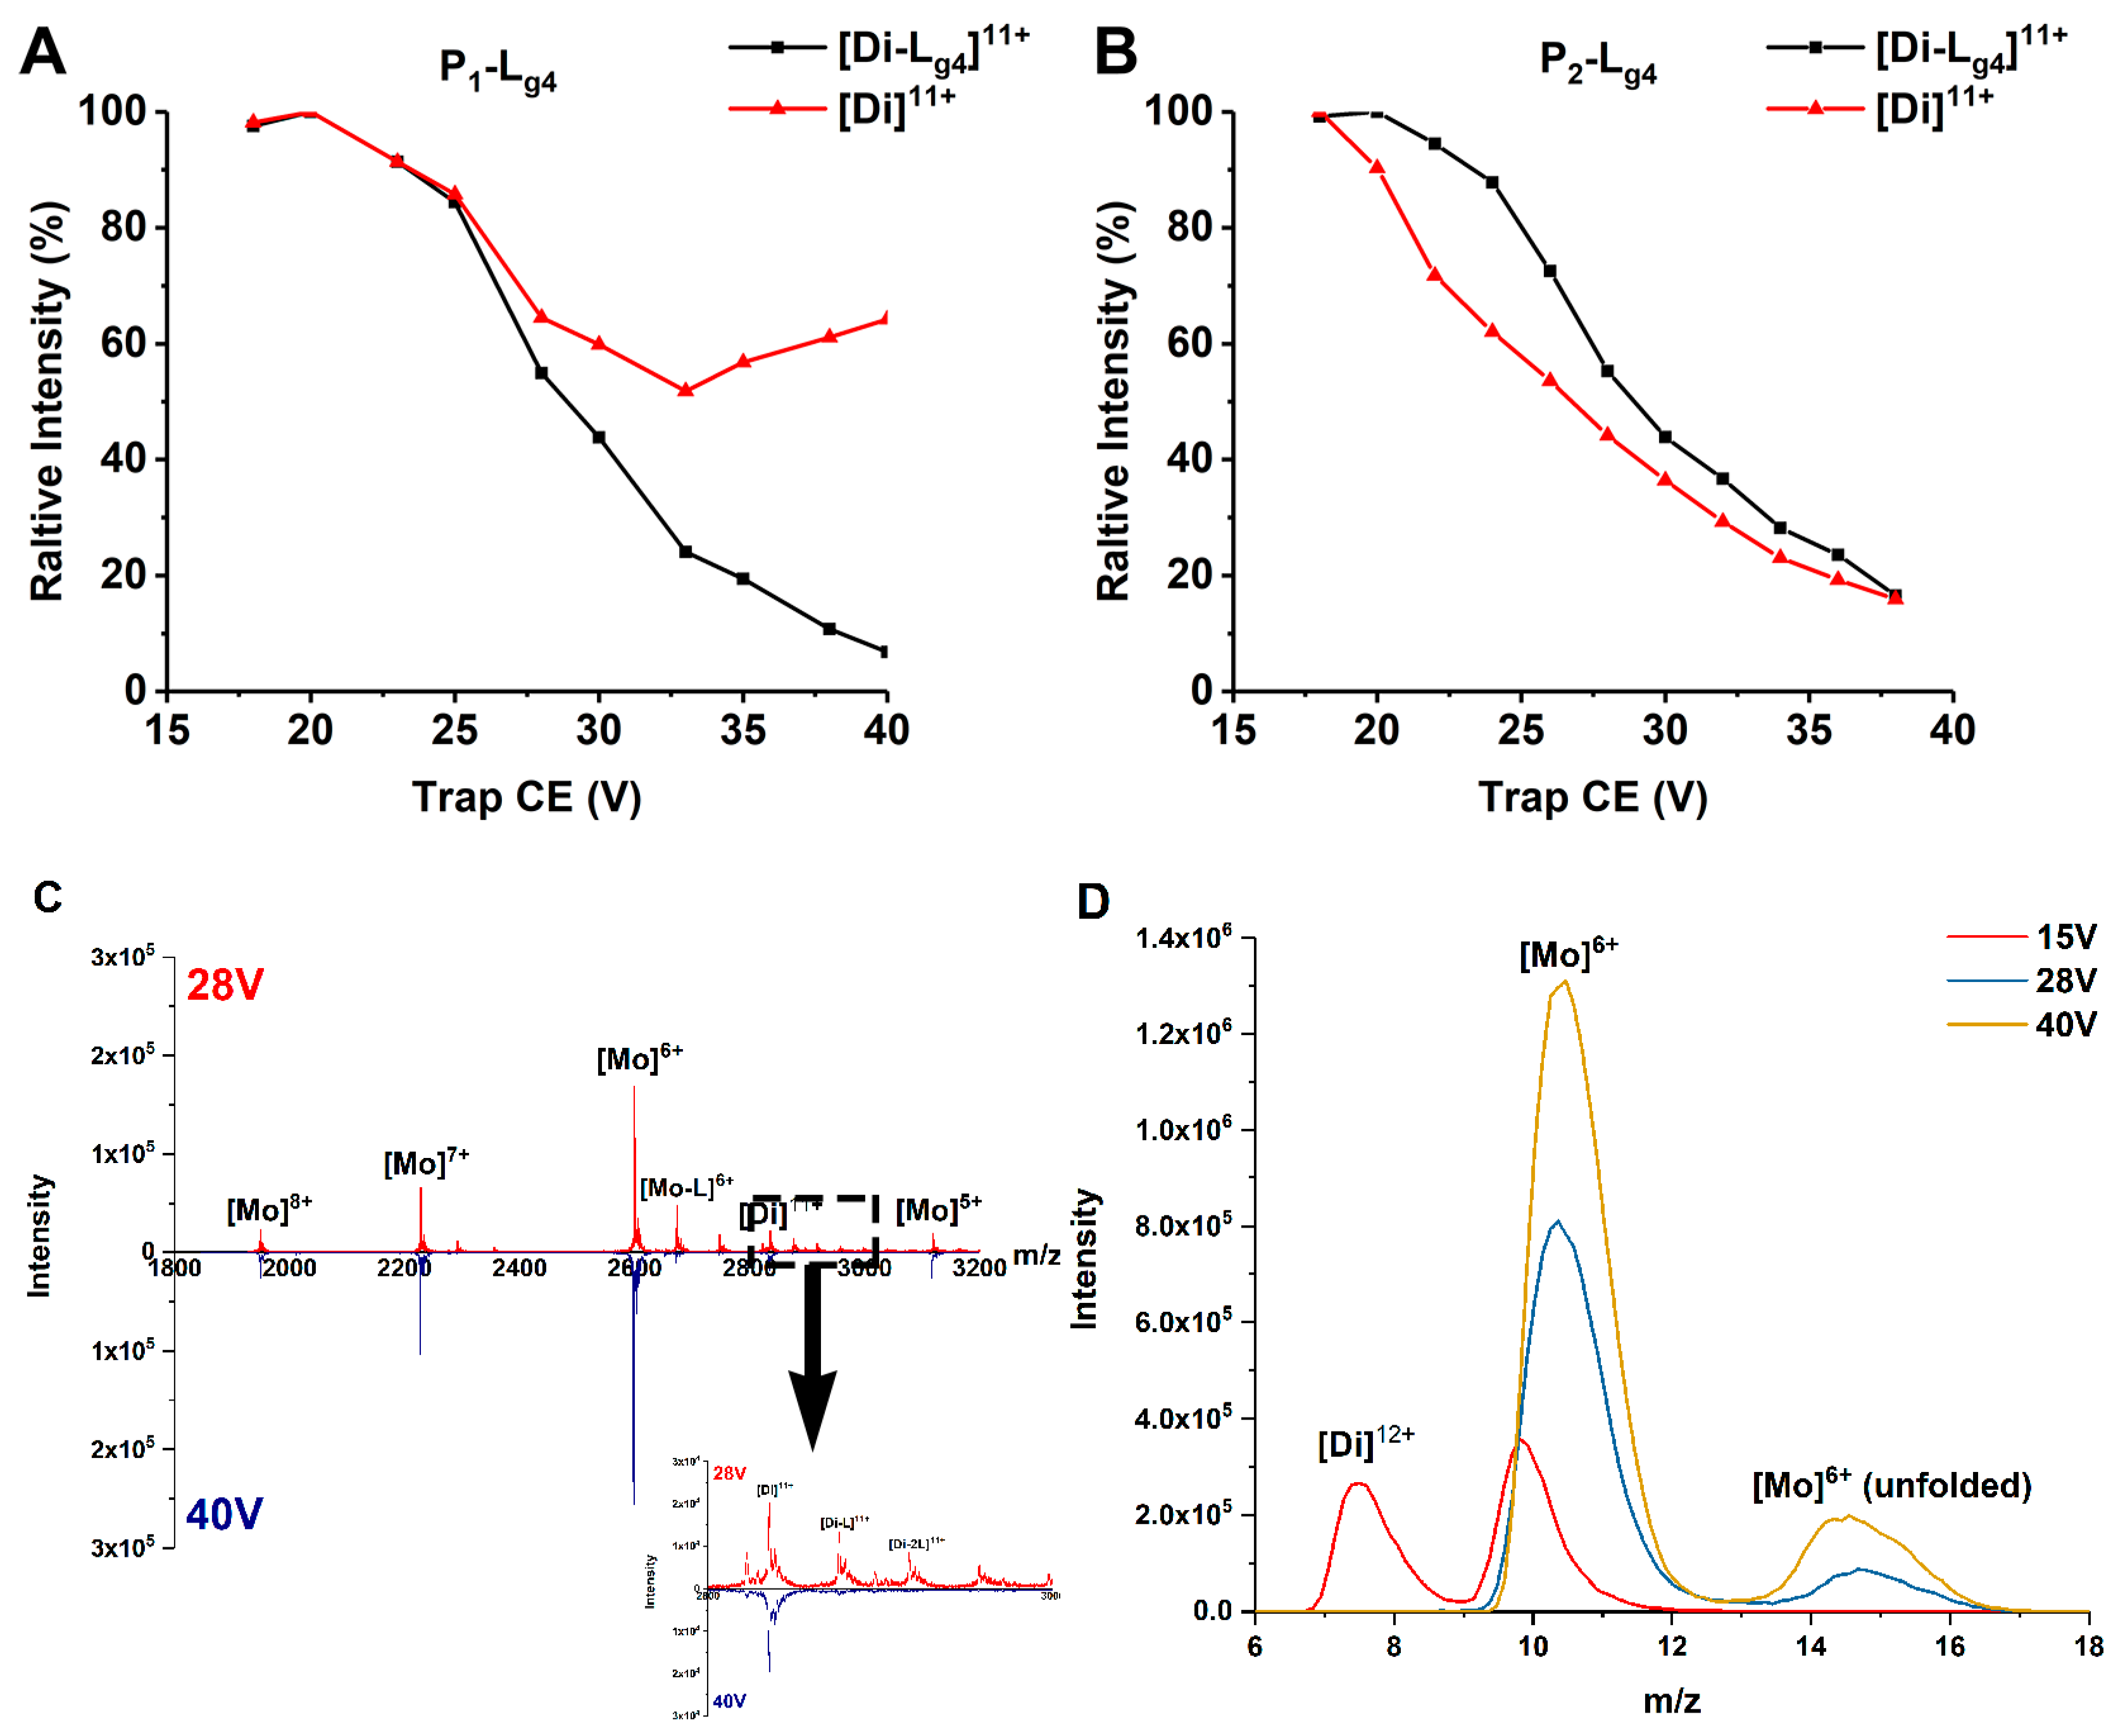
Exerting collision energy has been found to dissociate SOD1 dimer and SOD1-ligand complexes [13,30]. SOD1-ligand complexes may dissociate by losing a ligand or a subunit in CID. A clear dissociation pathway of SOD1 dimer and SOD1-ligand complexes helps explain and compare the binding affinity of ligands and the gas phase stability of different SOD1s and complexes. Thus, we performed CID experiments on the 11+ charged dimer ions of P1, P2, and their complexes with Lg1–Lg4. The ions are given a collision energy between 15 and 40 V in the trap region before being detected. Lg4 is chosen as the representative compound to compare the binding affinities with different SOD1s. The dissociation behavior of complexes differs as CE increases. Figure 3 shows the change of relative intensity of the [Di]11+ and [Di-Lg4]11+ ions of proteins (P1 and P2) and their Di-Lg4 (protein dimer-glycitin) complexes with trap CE. In the P1 group (Figure 3A), the relative intensity of the [Di]11+ ion of P1 dimer is found to decrease as CE grows at a lower CE. This situation is reversed at about 26 V. The relative intensity of [Di]11+ ion of the P1 dimer comes to a minimum value and then increases. This strongly indicates that the complex (P1-Lg4) dissociates into P1 dimer and ligand (Lg4) at high CE because the P1-Lg4 complex is the only source of the P1 dimer that is increasing. If we take the MS spectra of 28 V and 40 V of Trap CE, for example, it can be found that the peaks of the complexes nearly disappear under 40 V but the intensity of [Di]11+ is similar as that under 28 V. The IM peaks extracted from the MS peak of the protein (Figure 3D) show that the main products under 28 V or higher CE are mostly at the monomer state. That is to say, the complexes under high Trap CE dissociate into separated proteins and ligands and the protein dimers keep the same charge state as the complexes ([Di]11+ for example) or dissociate to monomer ([Di-L]12+ to [Mo]6+ and L). However, copper recombinant SOD1 provides very different results (Figure 3B). The downtrend of the dimer only becomes slighter at about 30V for P2-Lg4. The convergence of intensity tendency of protein dimer and protein dimer-ligand complexes means that the ligand may interact more strongly with P2 than P1.
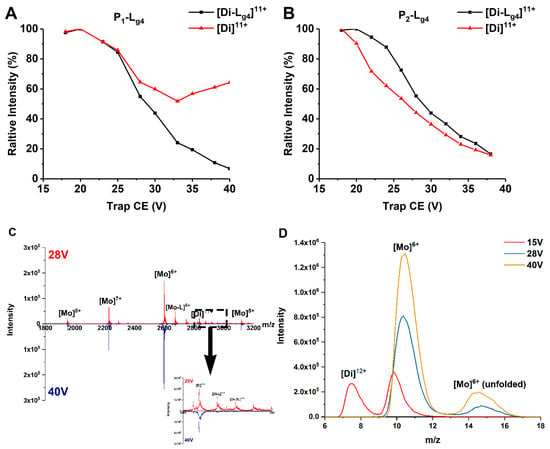
Figure 3.
(A,B) Relative intensity changes of ApoSOD1 and Cu2SOD1 (P1 and P2) and their Di-Lg4 (protein dimer-glycitin) complexes as trap CE increases. (C) The mass spectra of P1 at 28 V and 40 V of Trap CE with an enlarged view of the mass range between m/z 2800 and 3000. (D) The IM spectra of m/z 2600 extracted from (C) with an additional comparison of the same peak under 15 V of Trap CE.
MS/MS experiments of the complexes including P1-Lg4 and P2-Lg4 provide another comparison of these complexes (Figure S2). Given 30 V of Trap CE, the intensity of the P1-Lg4 ion ([Di-Lg4]11+) becomes very weak while the P1 dimer ion ([Di]11+) maintains the strongest peak. In the P2 group, the intensity of the [Di-Lg4]11+ ion stays at a high level. The appearance of the [Di]11+ ion of the dimer indicates that losing the ligand from the complex is still the main way of dissociation but at a lower extent than P1-Lg4. This result further indicates that the binding of ligands to P2 is stronger than that to P1. At the same time, the small intensity of [Mo-Lg4]6+ is also found in the P2-Lg4 group, indicating that a small part of the [Di-Lg4]11+ ion of the P2-Lg4 loses one of the subunits before losing a ligand.
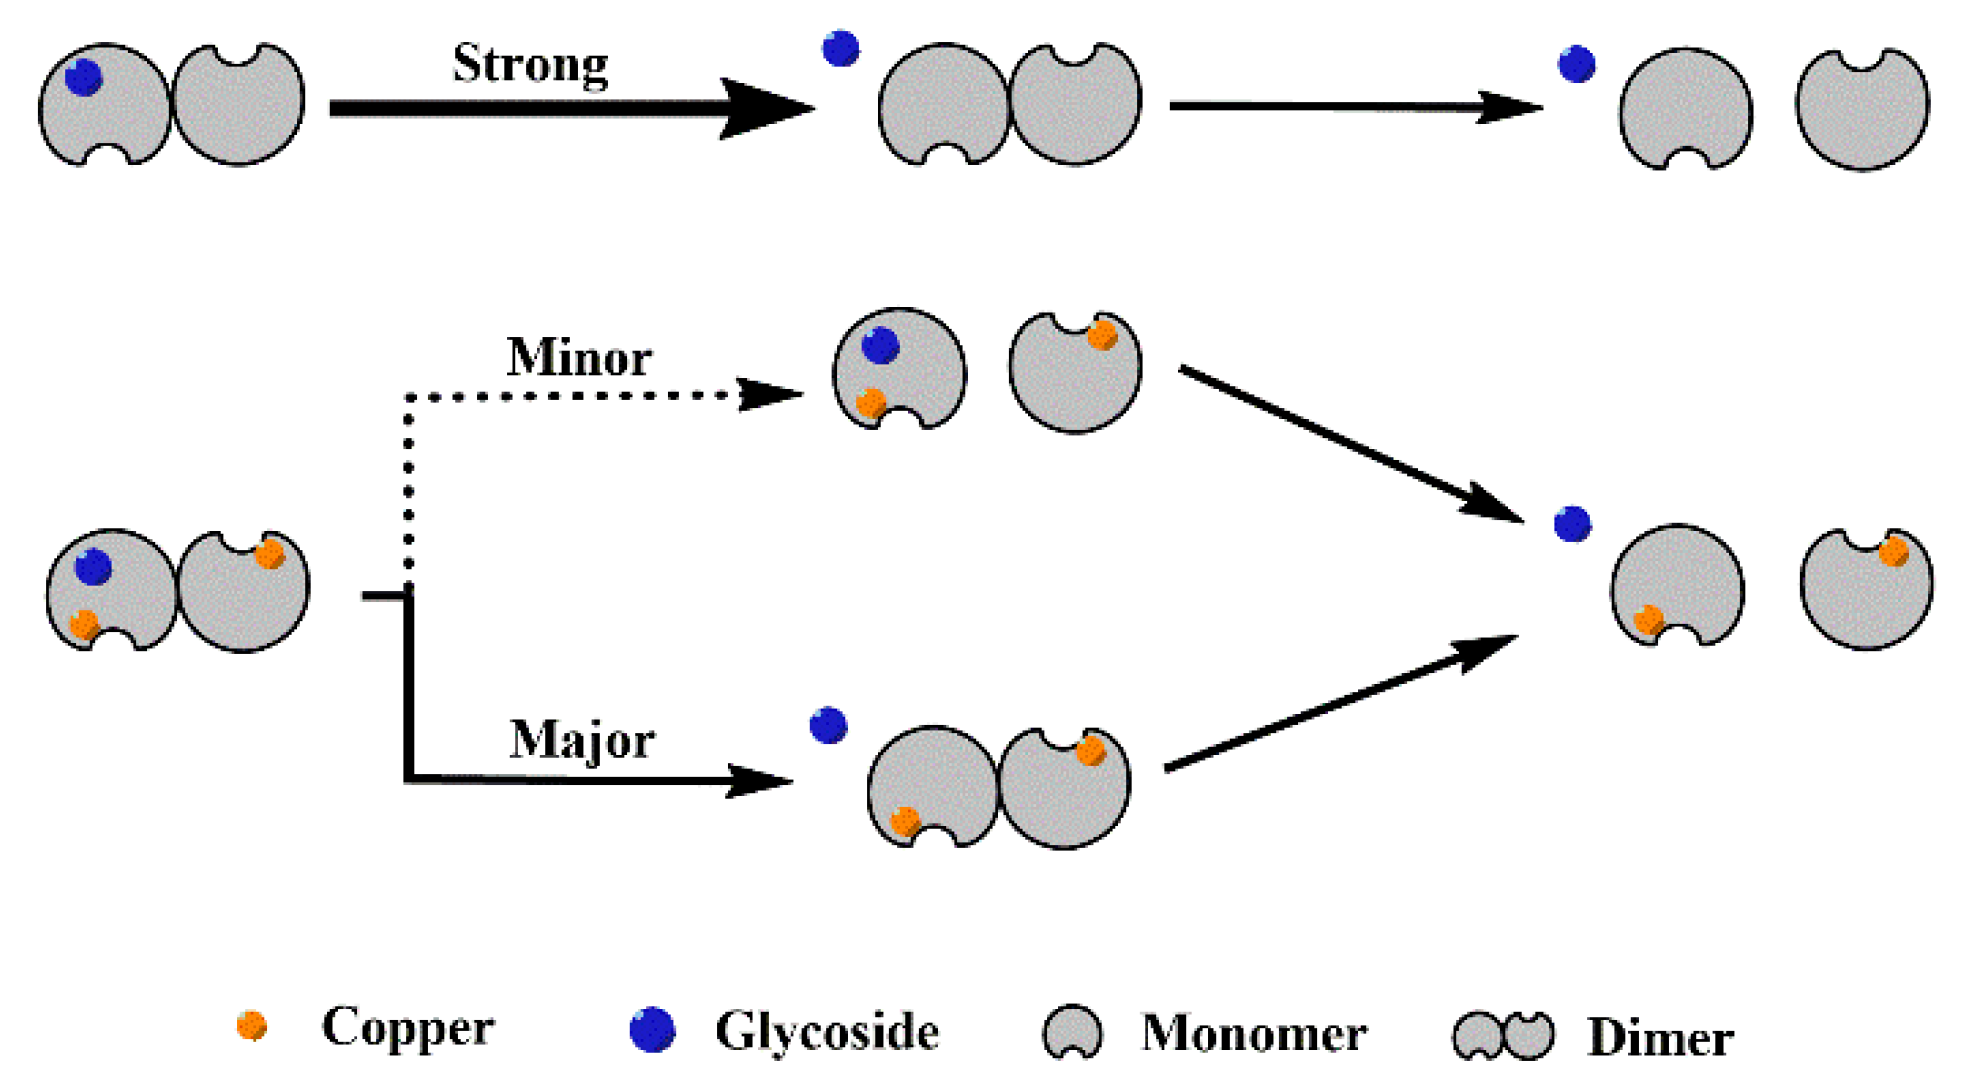
Based on the behavior of different SOD1s and their complexes in CID (Figure 3 and Figure S2), it is clear that all the complexes dissociate in the way of losing a ligand, and the recombination of copper considerably enhances the interaction between the four glycosides and SOD1s. With the increasing collision energy, P1-Lg loses a ligand so easily that the abundance of the free P1 dimer can even be increased, as shown in Figure 3A. More affinity of ligand binding taken by copper recombination makes the dissociation slower. As a result, the abundance of the [Di-Lg4]11+ ion of P2-Lg4 can show parallel reduction with the free P2 dimer. Figure 4 shows the possible dissociation pathway of the complex ions of different SOD1s (ApoSOD1, Cu2SOD1) with glycoside in CID.
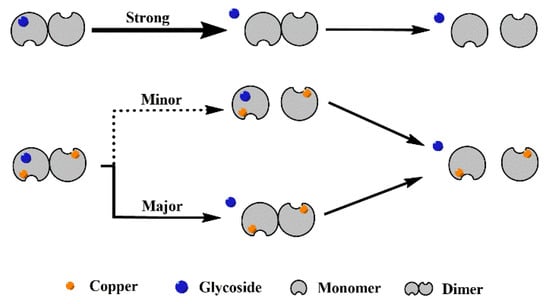
Figure 4.
Possible dissociation pathway of the complex ions of different SOD1 (ApoSOD1, Cu2SOD1) with glycoside in CID.
2.3. Conformation Stability of the Complexes of ApoSOD1 and Cu2SOD1 (P1 and P2) with Glycosides
Collision energy not only dissociates SOD1 dimer or bound ligands but also makes SOD1 unfold [30]. Here we performed a collision-induced unfolding (CIU) experiment by IMS-MS to simulate the unfolding process of abnormal SOD1s and evaluate how the binding of soybean isoflavone glycosides influences the conformation stability of ApoSOD1 and Cu2SOD1 (P1 and P2). As the 6+ charged monomer ion in IMS shows the same drift time as partly unfolded 12+ charged dimer ion, we chose the 11+ charged species as our analysis objects.
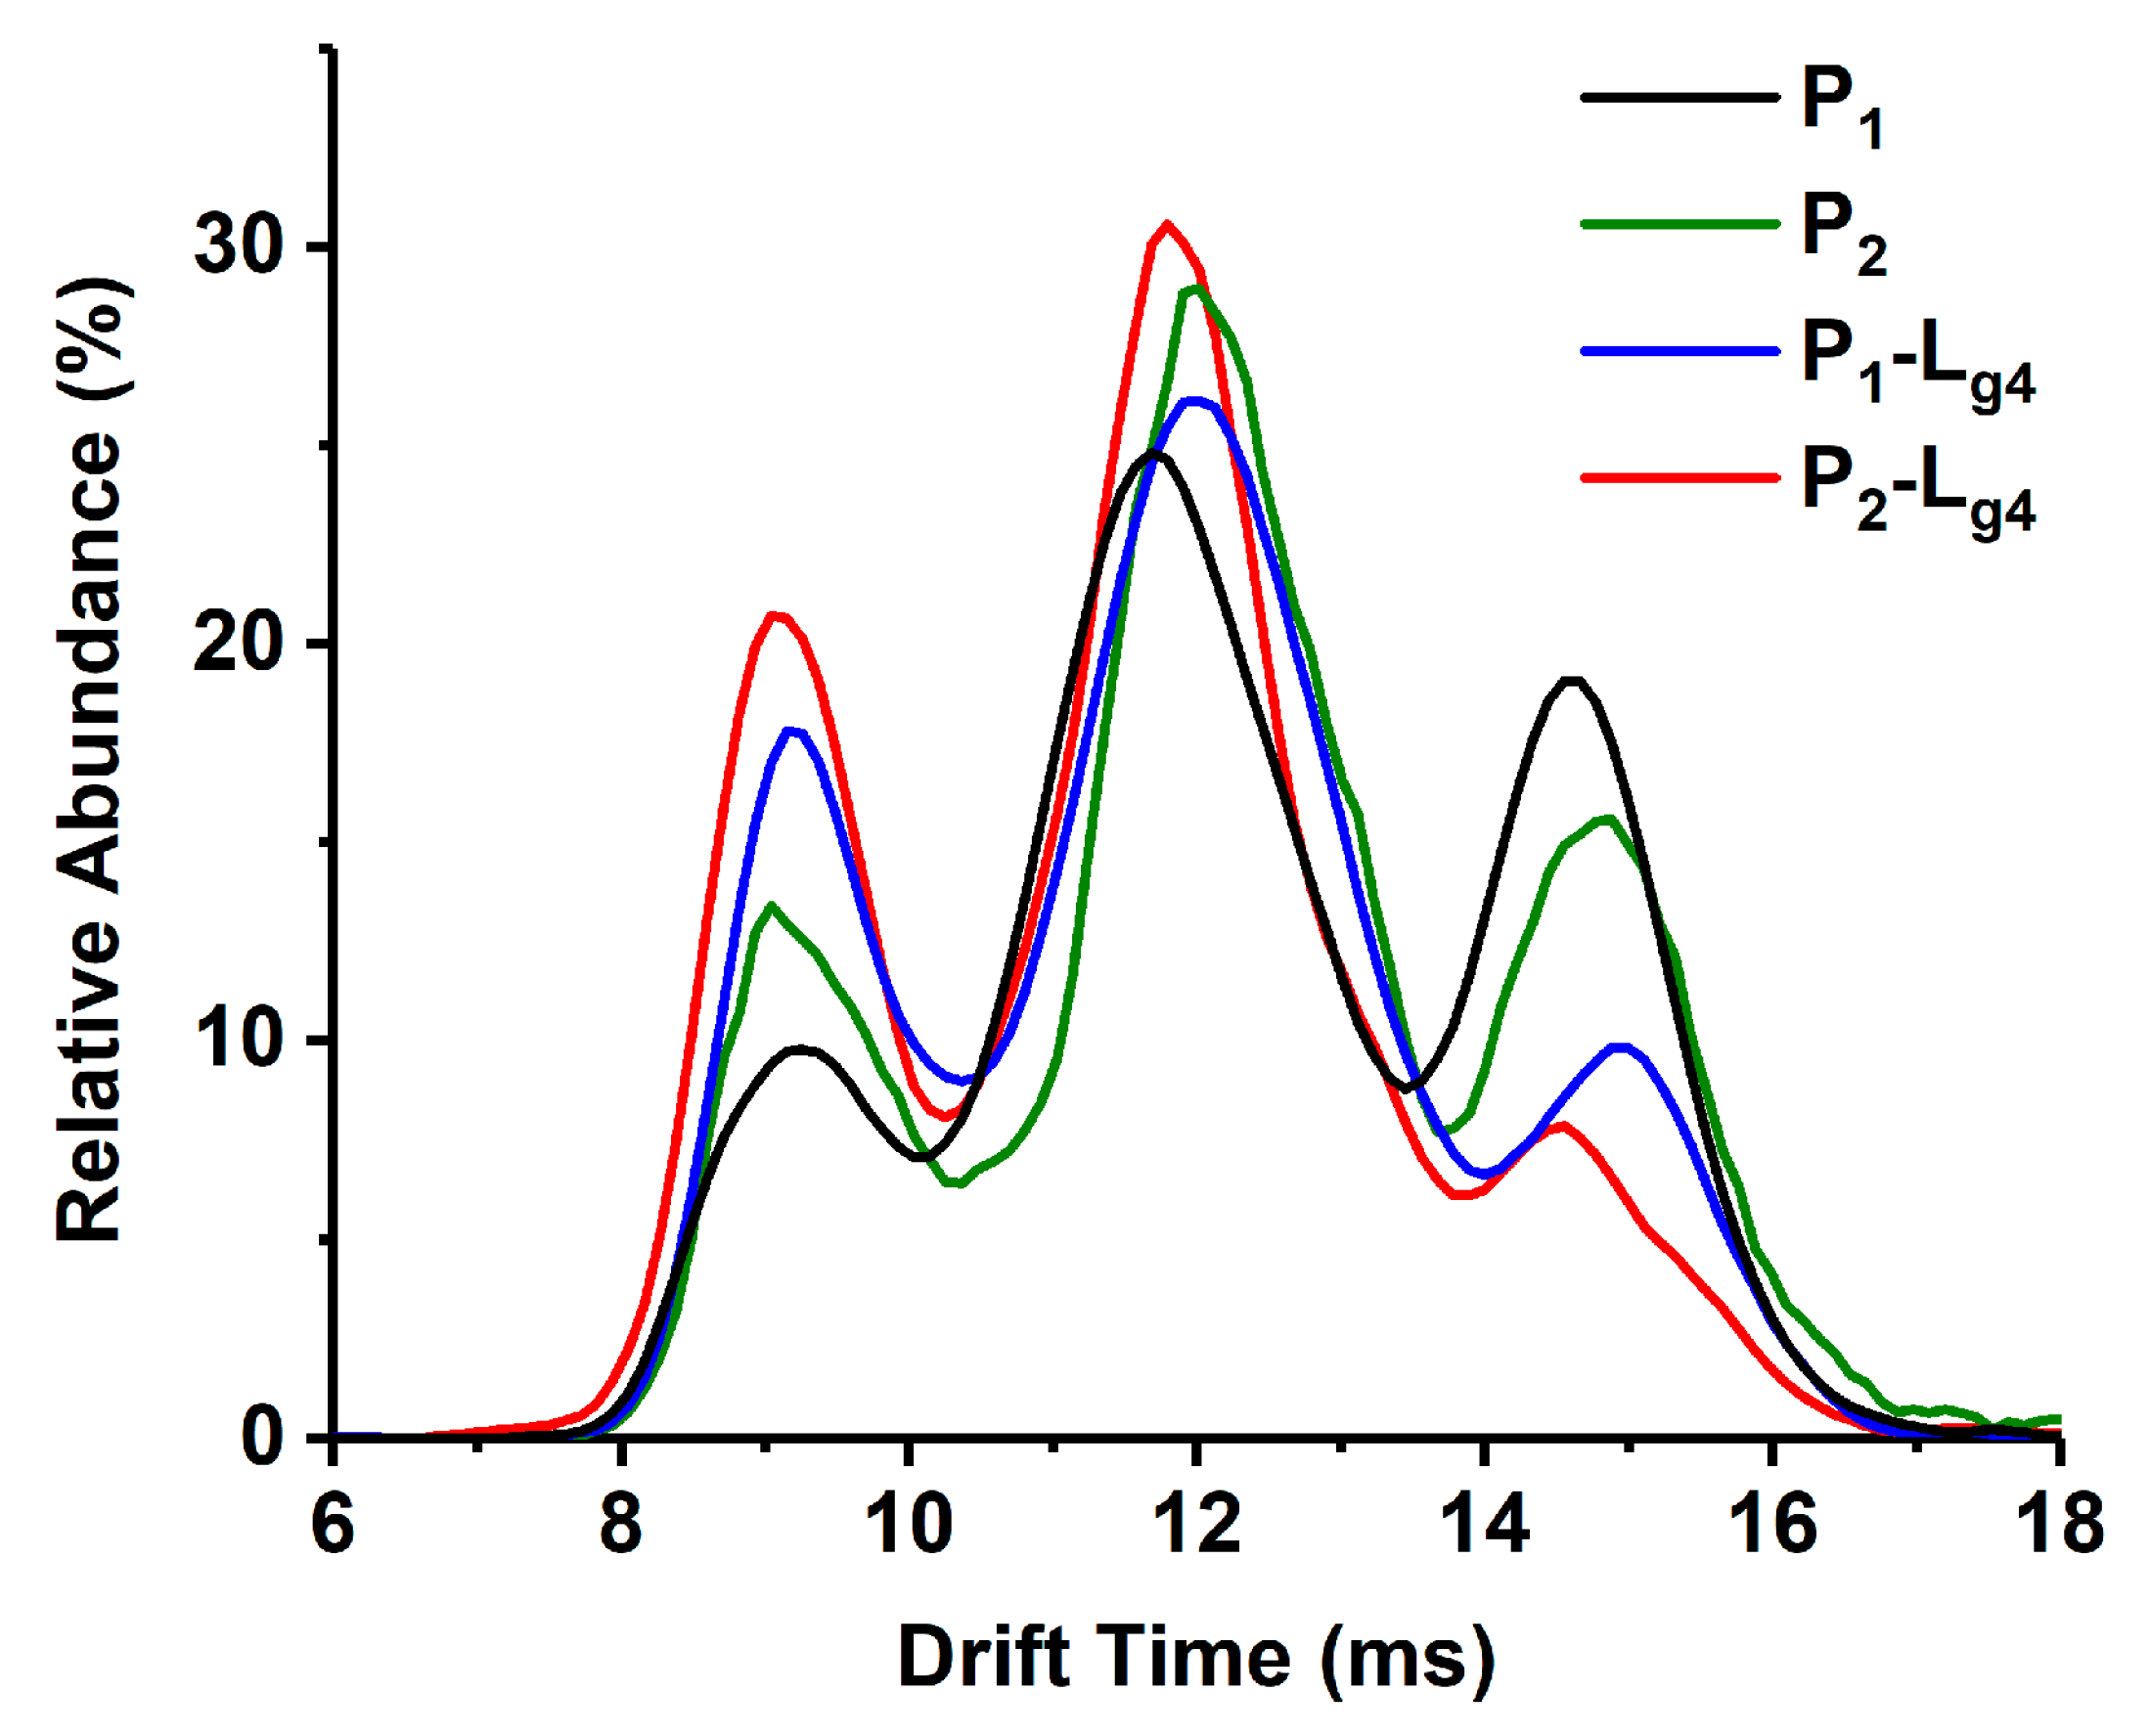
The unfolding of the SOD1 dimer contains three different states: native state (conformation A or Di-A) at low CE, partially unfolded state (conformation B or Di-B), and wholly unfolded state (conformation C or Di-C) [30]. The unfolded state of protein means more risk of aggregation. The unfolded conformation of protein brings a significant growth in collision cross section (CCS). This means higher drift time in IMS if the charge state does not change. Figure 5 shows the relative contents of three conformations of P1, P2, and P1/P2-Lg4 at the CE of 30 V. The binding of the ligand does not bring conformation changes of the three states but rather brings abundance differences. The abundance of compact conformation of the P-L complexes is higher than P and, in turn, P-L complexes unfold less than P. To show the effect on protein conformation from different ligands, the relative abundance of conformation A is read from the IMS spectra and is listed in Table S3. It is found from the P1 complexes that Lg4 as a ligand increases the relative abundance of conformation A by about 5%. Lg2 and Lg3 behave less effectively in protecting conformation A. Lg1 is the least effective in preventing the unfolding of P1. For P2 complexes, Lg4 also shows the best in stabilizing the folding structure. Lg1 still affects little in conformation A.
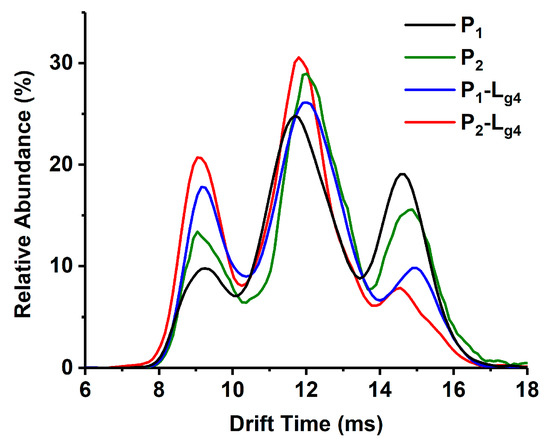
Figure 5.
IMS spectra of Apo/Cu2SOD1 (P1/P2) and their complex with glycitin (P1/P2-Lg4) at a collision energy of 30 V.
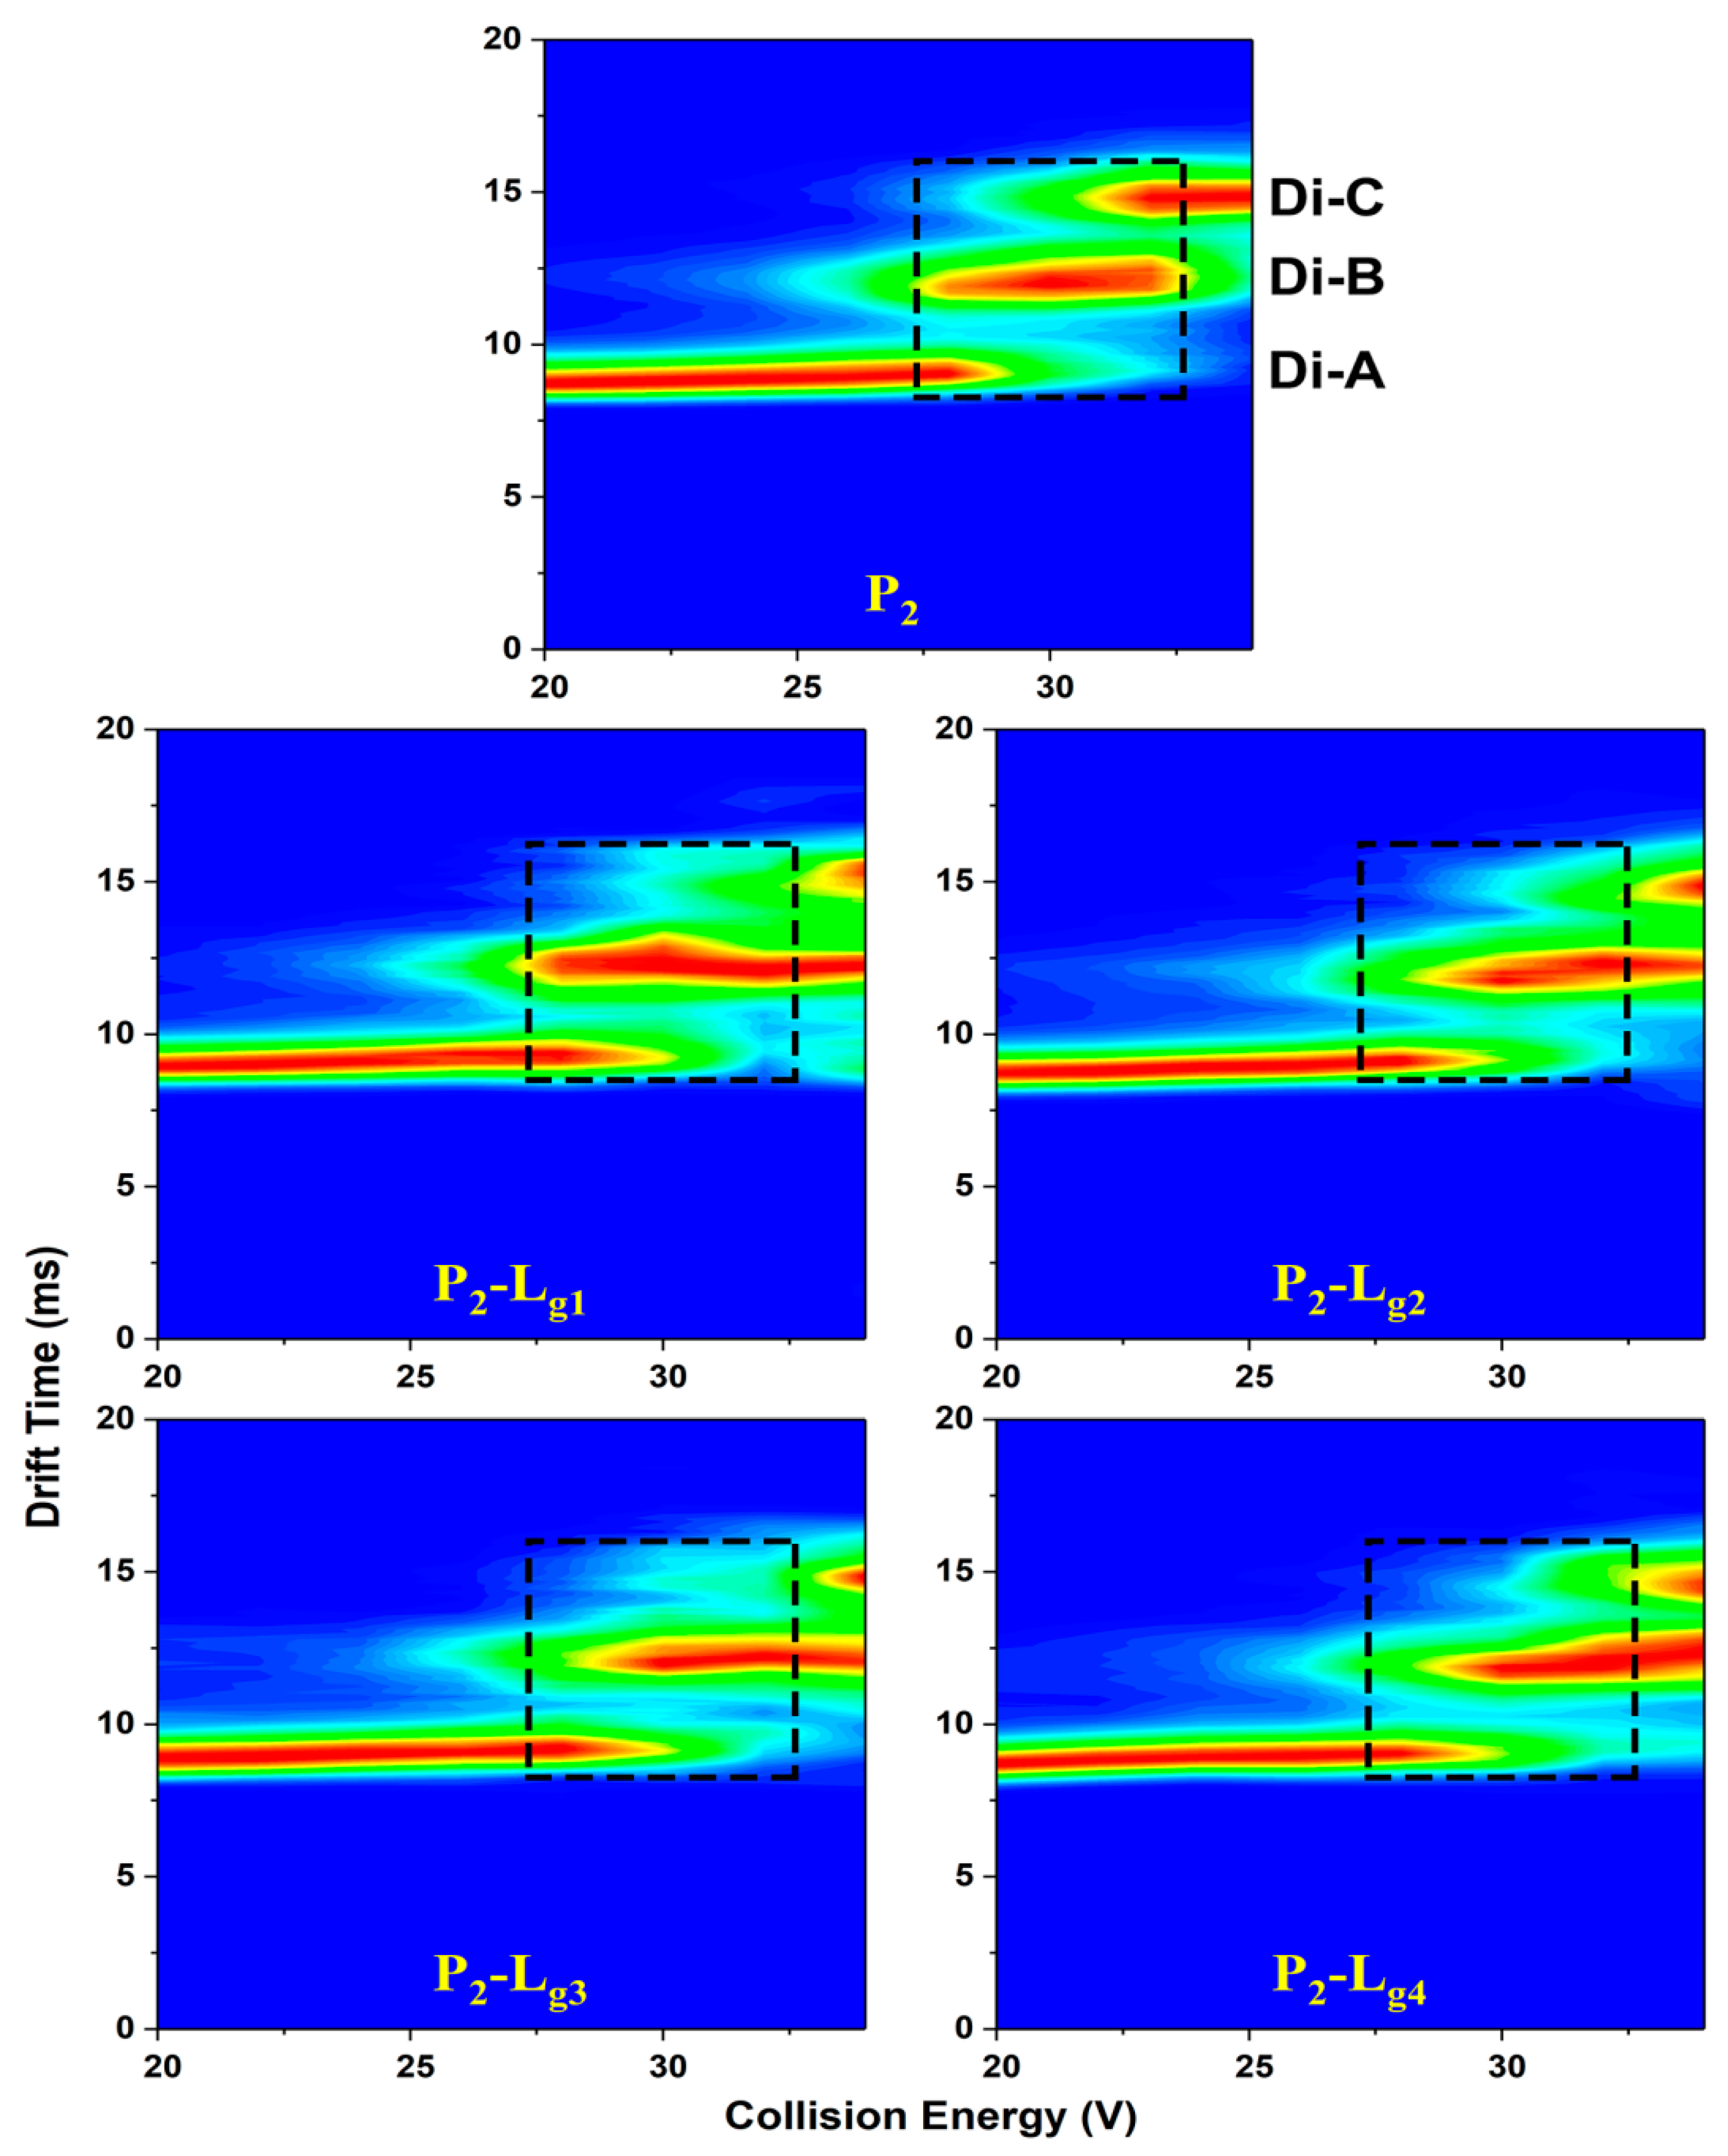
CIU (collision-induced unfolding) heat maps (Figure 6, Figure S3), matching drift time (DT), collision energy (CE), and relative intensity are plotted to give a comprehensive analysis of the unfolding difference taken by glycosides. The three independent areas represent the DT-CE distribution of the three conformations. The CE region of high intensity (red area) reflects the folding stability from another aspect. It is found that P2-Lg needs higher CE to convert conformation A into B or B into C (Table S4), which means the glycosides can stabilize the conformation of P2 at all unfolding stages. The P1-Lg only shows a little difference with P1.
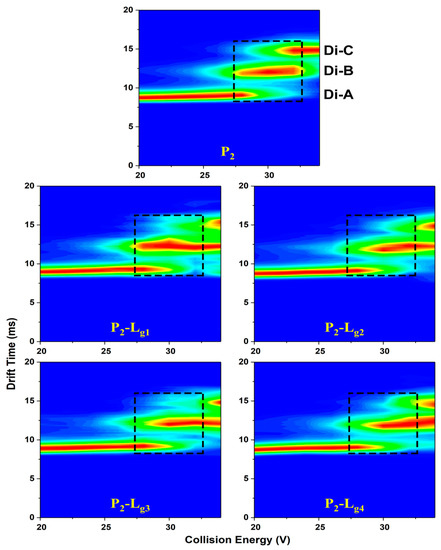
Figure 6.
CIU heat maps of Cu2SOD1 (P2) and its complexes with four glycosides, respectively (P1-Lg1, P1-Lg2, P1-Lg3, and P1-Lg4). The three conformations are marked at the corresponding drift time. The dashed areas of trap collision voltages (27 V to 32 V) show a comparison between protein and complexes on the boundary voltage of conformation conversion.
The results from the heat maps and IMS spectra at the CE of 30 V are unified. It is indicated from both the content of unfolded proteins and conformation conversion CE that the action of Lg2, Lg3, and Lg4 are effective in inhibiting unfolding but different in some aspects. Specifically, the totally unfolded form of the proteins can surely be reduced in varying degrees, decided mainly by the ratio of P-L. Lg4 shows the strongest ability to keep compact conformation.
2.4. The Effects of Soybean Isoflavone Glycosides on the Aggregation of Different SOD1s
ApoSOD1 can form toxic amyloid-like aggregates rapidly while being induced by TFE [31,32]. Under the induction of TFE, ApoSOD1 can partly unfold (which occurs at structures such as β-5, β-6) and quickly self-assemble. ThT is a fluorescent indicator which can specifically bind with aggregated β sheets. In this work, the ThT fluorescence intensity of TFE-induced samples was measured continuously to show the kinetics of aggregation. The influence of ligands and copper ions could be evaluated by the change in the aggregation process. The kinetics of P1, P2, and P3 are shown in Figure S4. It can be found that the aggregating speed and extent of P1 (ApoSOD1) are much higher than copper recombined SOD1 (Cu2SOD1). The results shown in Figure 7 indicate that the four glycosides can inhibit the aggregation of P1 and P2. Considering the stochastic formation of aggregation [33], Lg2, Lg3, and Lg4 show similar inhibition effects on aggregation and the effects are better than Lg1. This is reasonable because Lg2, Lg3, and Lg4 were found more effective in stabilizing the folding structure of the target SOD1s than Lg1 in the CIU results.

Figure 7.
Aggregation kinetics of (A) ApoSOD1 (P1) and (B) Cu2SOD1 (P2) and their P-Lg complexes. The control groups contain all compounds except for proteins.
2.5. Binding Competition of Glycitin and Two Other Small Molecules to Cu2SOD1 (P2)
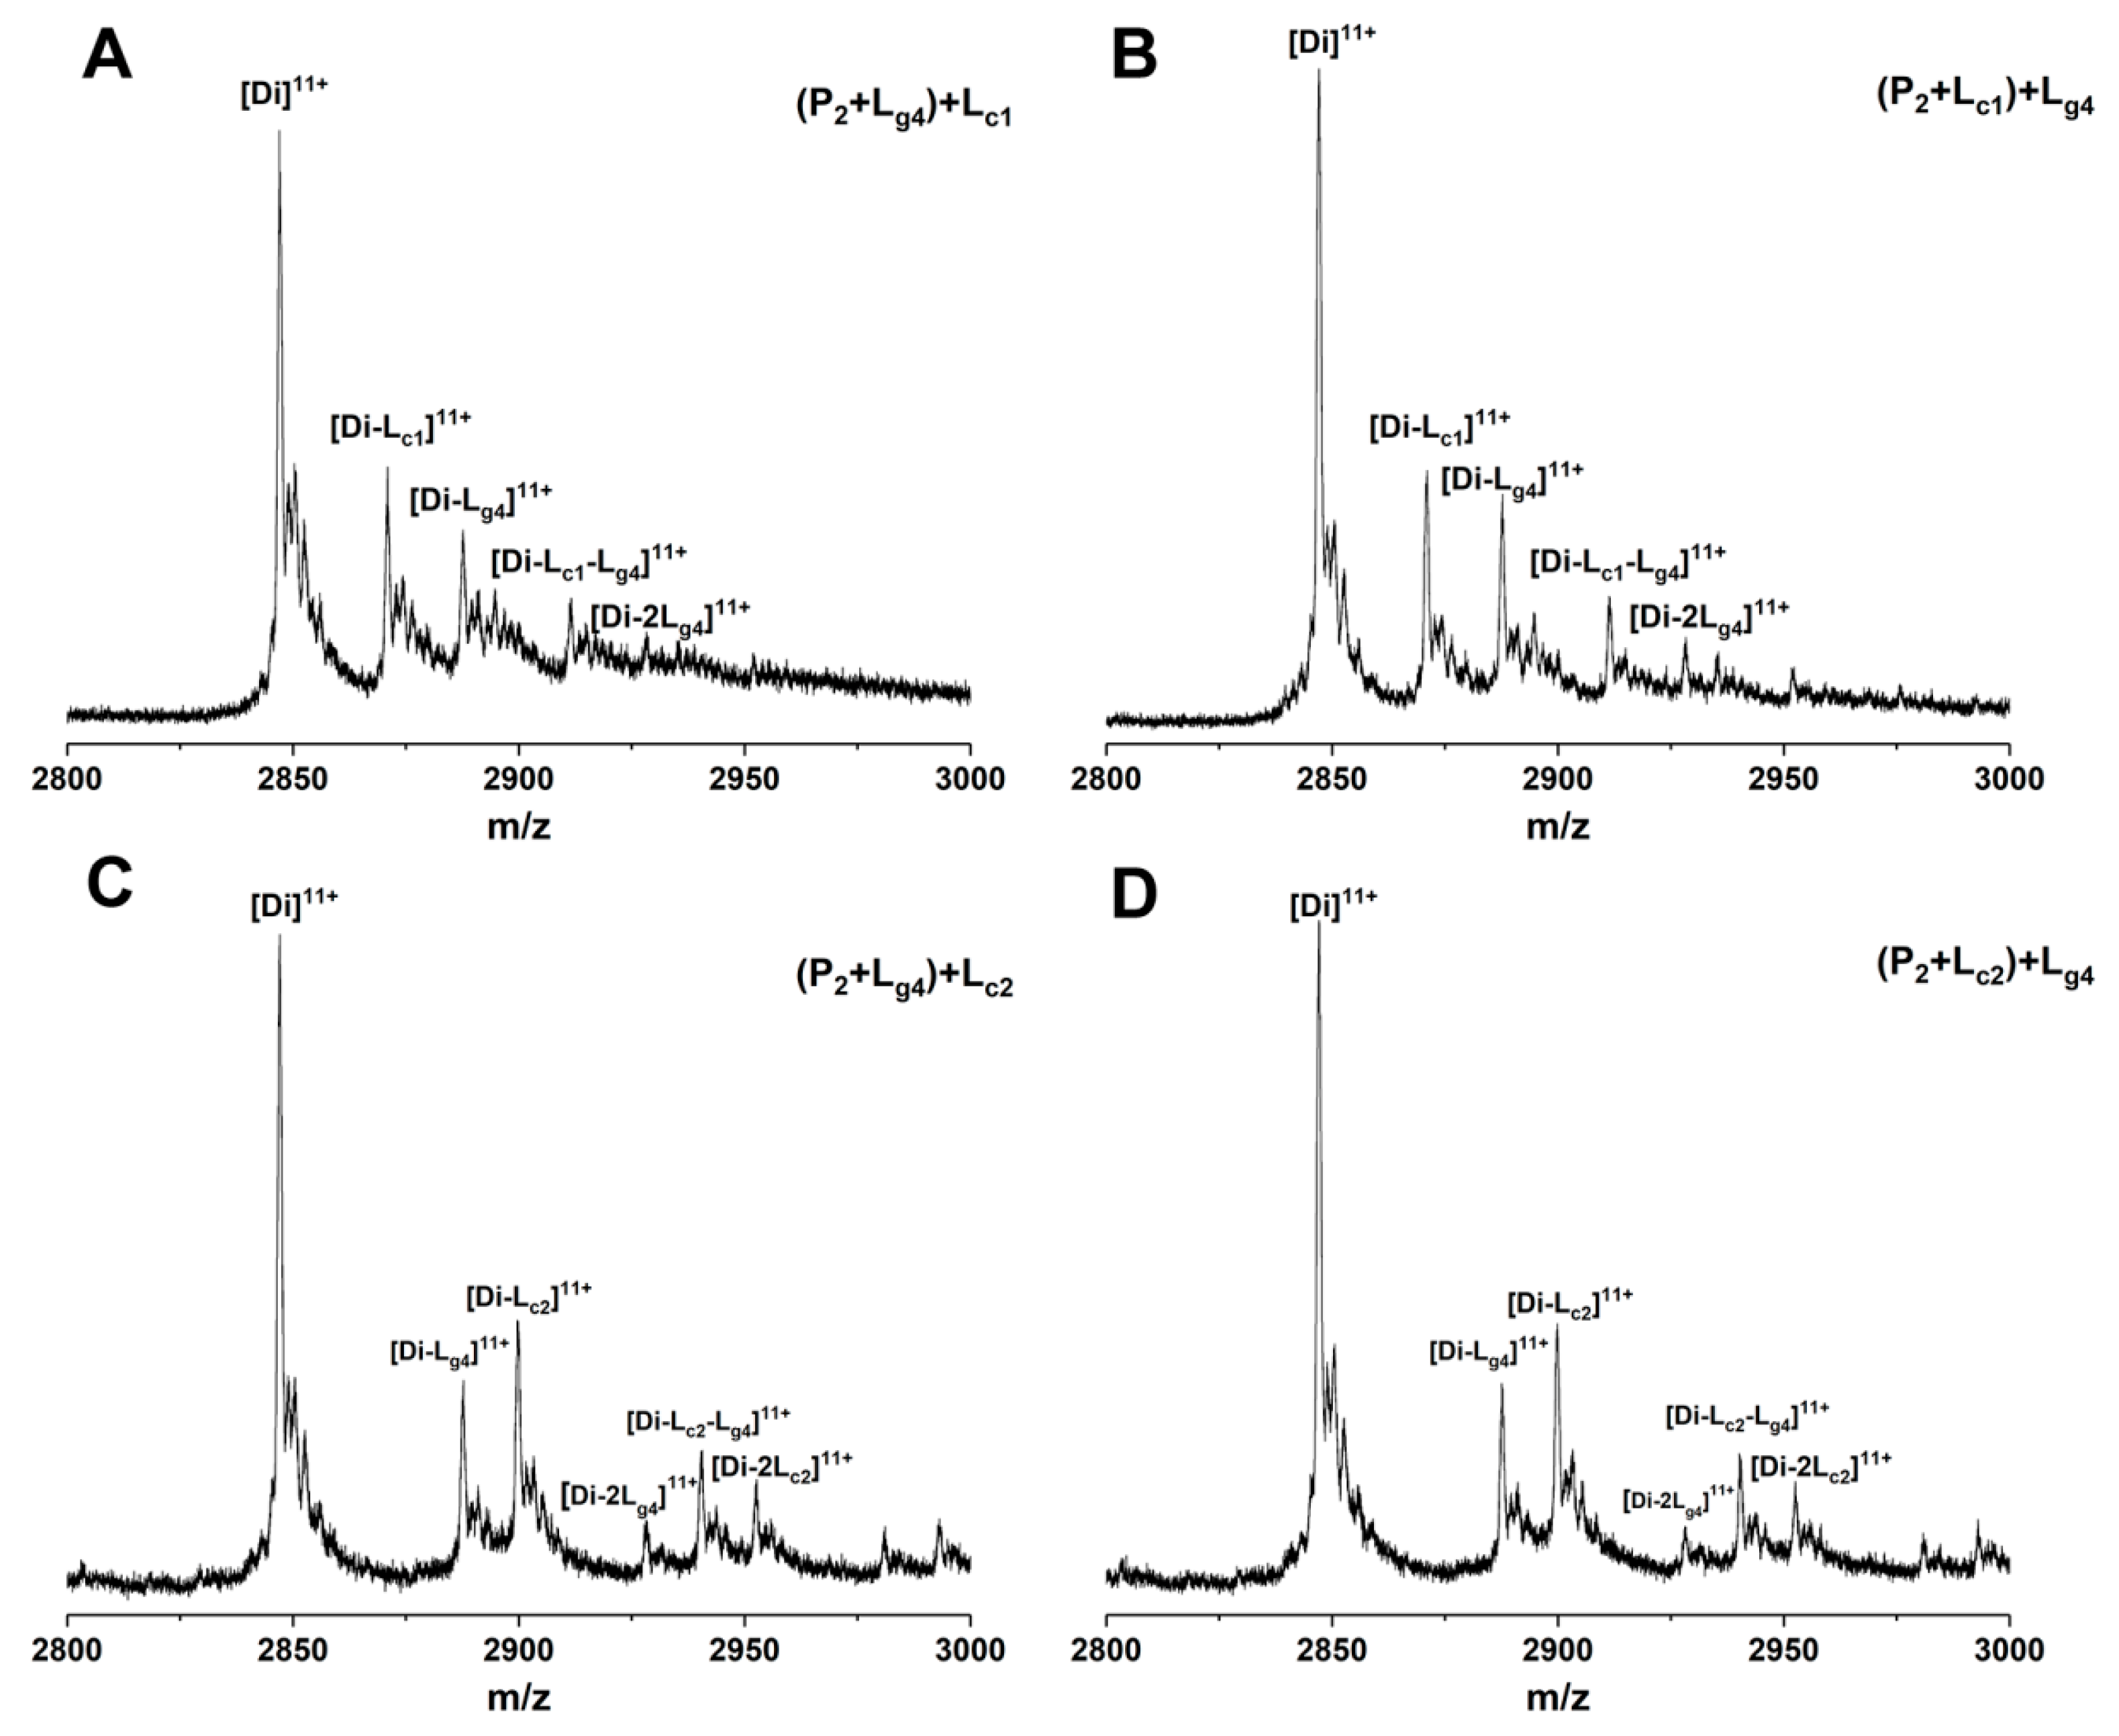
The binding sites of some small molecules such as isoproterenol and hesperidin on SOD1 have been predicted experimentally or theoretically [34,35]. Competitive binding between such molecules and other molecules showing binding affinity with unknown sites helps in judging the binding sites [14,36]. 5-Furd (Lc1) and naringin (Lc2) were reported as two stabilizers of SOD1 previously [8,13]. Lc1 was found to bind with SOD1 on the surface of the β-barrel by XRD measurement, which contributes a lot to fibrous aggregation. The results of molecular docking and molecular dynamics simulation in our previous study showed that Lc2 combines with SOD1 at the dimer interface. In this work, to study whether the soybean isoflavone glycosides would competitively bind with SOD1 against other ligands due to similar binding sites, we used Lc1 and Lc2 as control compounds to investigate the competitive binding of glycitin (Lg4) and control compounds to P2. Different ligands were added into samples containing P2 in a different order and then analyzed by ESI-MS. Figure 8 shows the ESI-MS spectra of competitive binding of Lg4 with control compounds (Lc1 or Lc2) to P2. In the experiments, Lc1 or Lg4 was first incubated with P2 for 1 h followed by the addition of the other ligand and incubation for another 1 h. Then the samples were subjected to MS measurement. Figure 8A,B shows that the addition of Lg4 in a different order does not affect the intensity of [Di-Lc1]11+ and [Di-Lg4]11+, while a complex ([Di-Lc1-Lg4]11+) of two ligands (Lc1 and Lg4) bound to P2 is found in similar intensity. This result implies that Lg4 may not bind at the same site as Lc1. The results of Lc2 as a control compound are similar to that of Lc1 above. The spectra of Lg4 added respectively as the first or second ligand are shown in Figure 8C,D. The intensities of the complexes in Figure 8C,D are similar, including [Di-Lc1]11+, [Di-Lg4]11+, and [Di-Lc1-Lg4]11+. The result suggests that Lg4 and Lc2 may bond at different sites on P2. These results indicate that the competition ligands at least do not completely replace the site of the ligand that is added first. Thus, it can be predicted that Lg4 does not share identical binding sites with either Lc1 or Lc2.
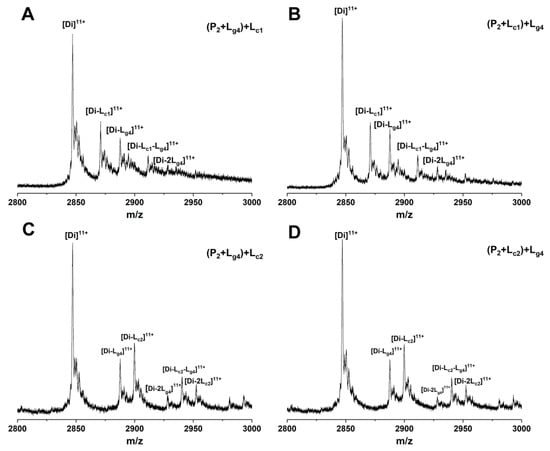
Figure 8.
ESI-MS spectra of competition binding of glycitin (Lg4) with control compound (Lc1:5-Furd or Lc2: naringin) to Cu2SOD1 (P2). The compounds in the bracket are mixed and incubated for 1 h followed by adding the second ligand. Using 5-Furd (Lc1) as the control compound, the spectra of glycitin (Lg4) were added, respectively, as the first ligand (A) or second ligand (B). Using naringin (Lc2) as the control compound, the spectra of glycitin (Lg4) were added respectively as the first ligand (C) or second ligand (D).
2.6. Binding Sites of Glycitin Analyzed by Molecular Docking
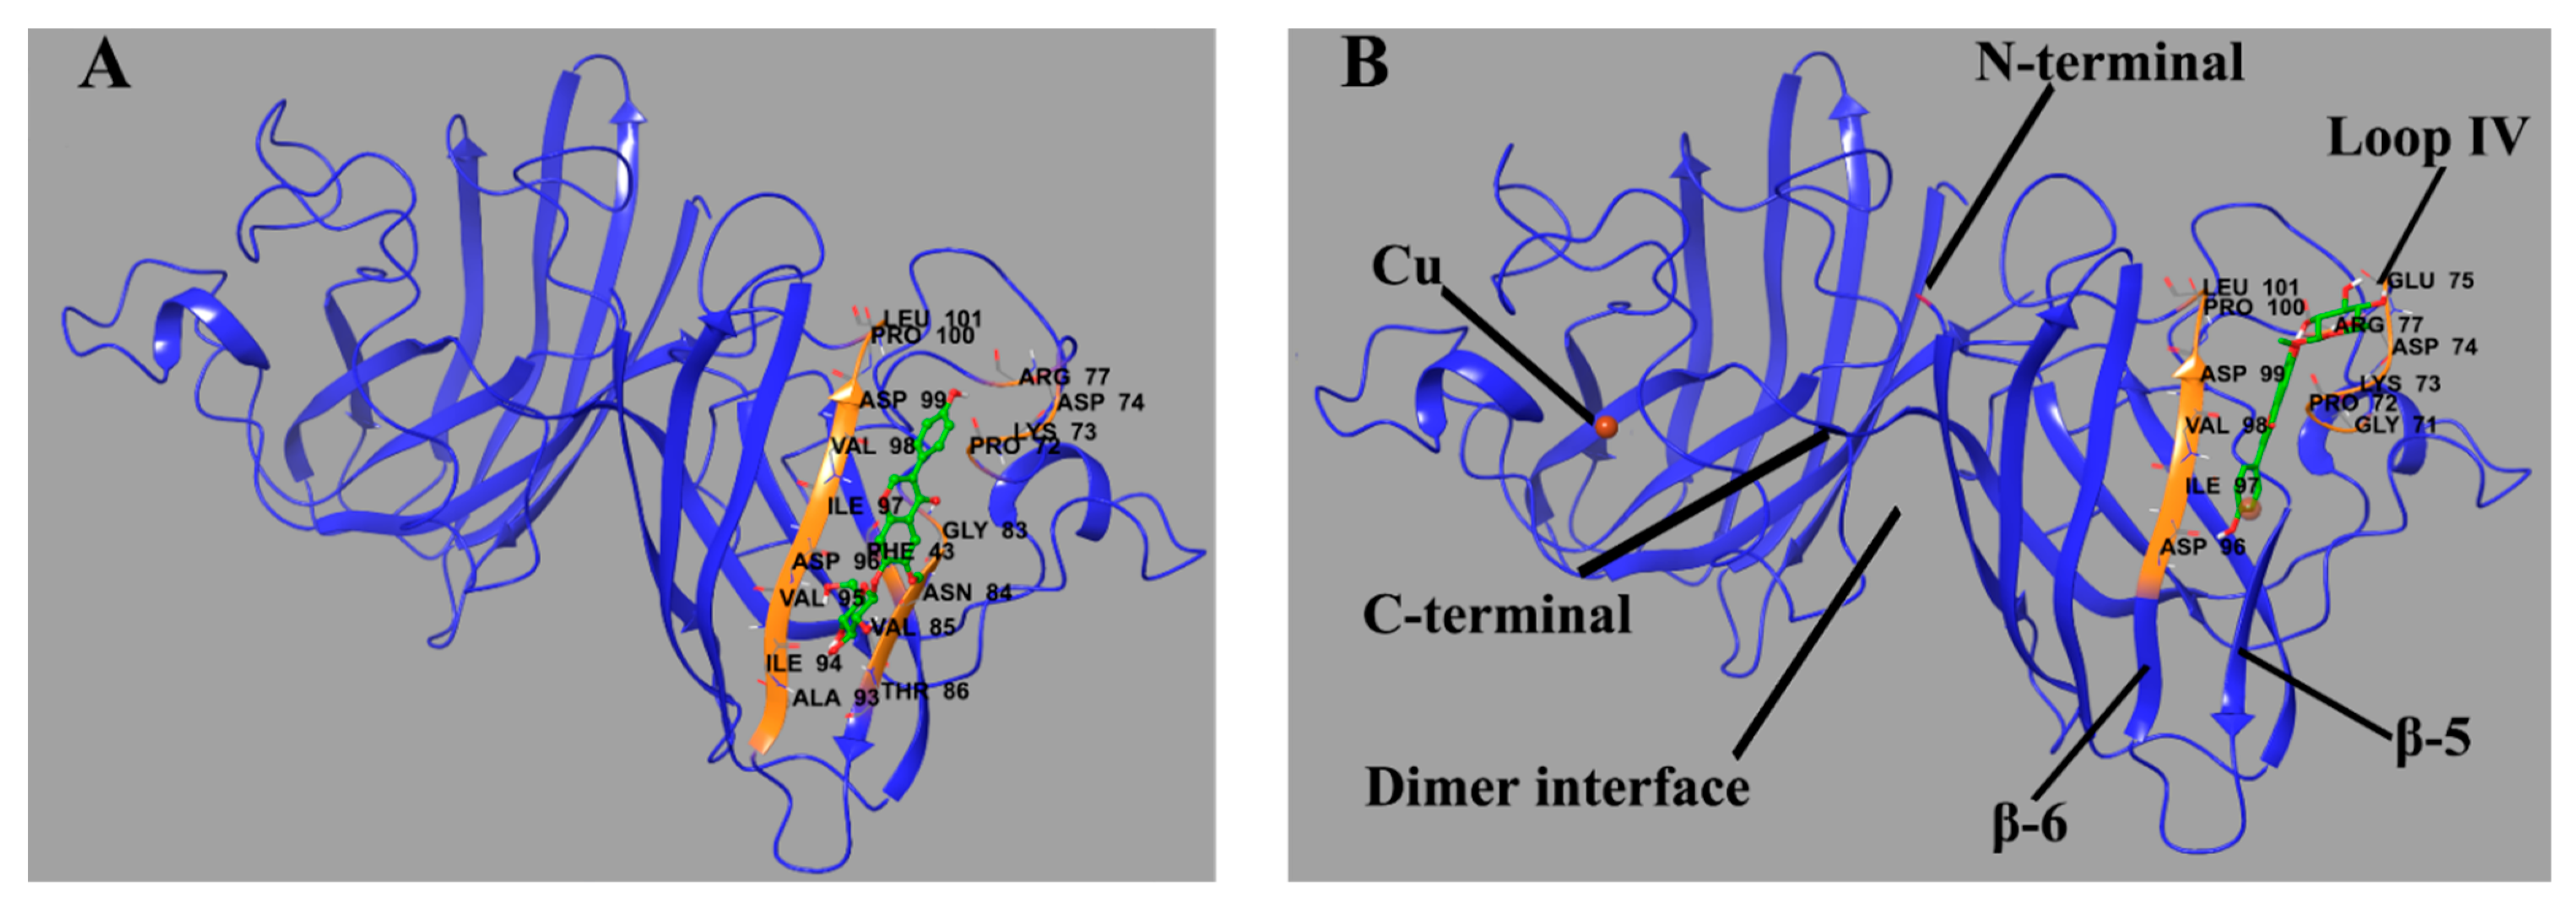
Molecular docking was performed to predict the binding sites of Lg4. The sites (Figure 9) in P1 and P2 with low binding energy are placed at similar residues. Specifically, Lg4 binds between β-sheet 6 (residue 94–100) and part of loop IV (residue 72–77). The ligand is oriented along the β-sheet and builds a connection between the β-sheet and loop IV through H-bonds. As reported, β-sheet 6 is the core region of aggregation in SOD1 [37,38,39]. Loop IV builds a link between the edge β-sheets and the whole structure and contributes a lot to dimerization and the enzymatic activity of SOD1 [40]. It is quite rigid in Cu2Zn2SOD1 but highly flexible in some SOD1 mutants. These fragments in some SOD1 mutants can be more unstable and easily unfold while being induced. Therefore, the binding of glycitin provides additional intermolecular interaction to stabilize the conformation of SOD1 as well as prevent aggregation.
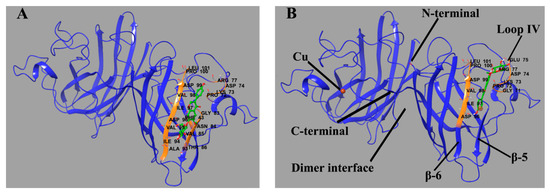
Figure 9.
Predicted binding site of glycitin in ApoSOD1 (A) (binding energy = −6.33 kcal/mol) and Cu2 SOD1 (B) (binding energy = −5.41 kcal/mol). The residues that interact with glycitin are labeled and shown as secondary structures (colored) as well as primary structures in the form of sticks. Glycitin is also shown in the form of sticks. The H-bonds between the ligand and residues are shown as green spherical dotted lines.
2.7. Calculation and Comparison of Collision Cross Section
Collision cross section (CCS) is usually used to evaluate the stretch degree of proteins. It can be measured by IMS and calculated through a theoretical model. In this study, the CCS of P1 and P2 and their Lg4-bound complexes are given by two methods: measured CCS from standard lines (Figure S5) and drift times of target components and theoretical CCS calculated through the computational method [41]. All results are listed in Table 1 and Table 2. As the CCS of all species has little difference, the recombination of metal ions and glycitin makes little effect on the size of the overall structure of SOD1. It can be inferred from these results that losing metal ions or other stabilizers may not make SOD1 unfold immediately. However, SOD1 without metal ions or stabilizers can hardly stay stable in dynamic processes or external induction such as the collision energy in MS or TFE-induced aggregation.

Table 1.
IMS measured CCS (nm2) of ApoSOD1 and Cu2 SOD1 (P1, P2) and complexes with glycitin (P1-Lg4, P2-Lg4) under six IM wave velocities (WV) and wave heights (WH).

Table 2.
Average measured CCS (nm2) and theoretically calculated CCS (nm2) of ApoSOD1(P1) and Cu2SOD1(P2) and their complexes (P1-Lg4, P2-Lg4). The error of measured CCS is the standard deviation of the CCS measured under six parameters (see Table 1). The error of calculated CCS is the standard deviation of the CCS calculated under different energy states (n = 4).
3. Materials and Methods
3.1. Materials
Cu2Zn2SOD1 from bovine erythrocytes was purchased from Beyotime Biotechnology (Shanghai, China). Daidzein, genistein, sophricoside, genistin, and (purity ≥98% for all) were provided from Nature Institutes for Food and Drug Control(Beijing, China). Glycitein, daidzin, and flycitin were purchased from Chengdu Herbpurify Co., LTD (Chengdu, China). Horse cytochrome c, horse myoglobin, naringin, Thioflavin-T (ThT), ammonium acetate, and 5-furd were obtained from Sigma-Aldrich (St. Louis, MO, USA). Trifluoroethanol (TFE) was purchased from J&K Scientific Ltd. (Beijing, China). Ethylenediaminetetraacetic acid (EDTA) and copric chloride dihydrate (CuCl2.2H2O) were obtained from Beijing Chemical Works (Beijing, China). Methanol and formic acid were supplied by TEDIA Company (Fairfield, OH, USA). The ultrapure water used in all experiments was prepared by a Milli-Q water purification system (Milford, MA, USA). The dialysis devices (Micro Float-A-Lyzer, MW-cut: 10 kDa) were bought from Spectrum Laboratories (Rancho Dominguez, CA, USA). The isoflavones, 5-furd, and naringin were dissolved at 1 mM in methanol as stock solutions and stored at 4 °C before experiments.
3.2. Preparation of ApoSOD1 and Cu Recombined SOD1
Step 1: Cu2Zn2SOD1 was first dialyzed by Float-A-Lyzer G2 (10-kDa MW-cut) in a 20 mM ammonium acetate buffer (pH = 3.2) containing 5 mM EDTA for 24 h.
Step 2: The buffer was changed into 20 mM ammonium acetate (pH = 3.2) to remove EDTA.
Step 3: The buffer differs for ApoSOD1 and Cu2SOD1. A 20 mM ammonium acetate buffer (pH = 6.8) was used to refold ApoSOD1 while a 20 mM ammonium acetate buffer (pH = 3.2) containing 5 mM CuCl2 for Cu2SOD1. ApoSOD1 was prepared and collected after 24 h of dialysis followed by ultrafiltration. For Cu2SOD1, the time of dialysis was usually about 4–6 h.
Steps 4 and 5 are only for Cu2SOD1.
Step 4: The buffer was changed into 20 mM ammonium acetate (pH = 3.2). The dialysis lasted for 6 h.
Step 5: The buffer was changed into 20 mM ammonium acetate (pH = 6.8). The dialysis lasted for more than 12 h followed by ultrafiltration and product collection.
Step 6: For both products, 10 μL of the product was diluted at 10 mM ammonium acetate (pH = 6.8) to 200 μL. Then the samples were analyzed by ESI-MS after ultrafiltration to confirm the metal content. The products with unexpected metal content would be re-dialyzed from the first step.
The mass spectra of products suitable for other experiments are shown in Figure S6.
3.3. Mass Spectrometry Experiments
For all MS samples, the proteins and ligands were mixed and diluted into 5 μM and 30 μM by 10 mM ammonium acetate (pH = 6.8). The samples were incubated at 37 °C for 1 h before analysis.
The MS experiments were all performed on a quadrupole ion-mobility time-of-flight (Q-IM-TOF) mass spectrometer (Synapt G2-S, Waters Corp., Manchester, UK). Samples were directly infused at a flow rate of 10 μL/min and detected under positive-ion mode. If not mentioned specifically, all the conditions were set at optimized values. The capillary voltage was set at 2.40 kV and the cone voltage at 40 V. The source temperature was kept at 80 °C. As the desolvation gas, we used nitrogen at a flow rate of 400 L/h under 150 °C. Nitrogen was also the IMS gas in the IMS experiments and its flow rate was 90.00 mL/min. At the same time, manual control of IMS parameters was switched on for optimization. As a result, IMS wave velocity was set to 600 m/s and IMS wave height to 33.0 V. All data were acquired and analyzed by Masslynx 4.1 software (Waters Corp., Manchester, UK).
3.4. Analysis of Aggregation Kinetics
To prepare the samples of ThT fluorescence assays, the protein with or without a ligand was diluted with an ammonium acetate buffer (pH = 6.8) at 50 mM. The concentration of protein and ligand was 15 μM and 150 μM. ThT was added to be 25 μM at the same time. After incubating the samples at 37 °C for 1 h, TFE was added to induce the aggregation at the final concentration of 12%. The samples were quickly mixed well by vortex and transferred into a black 96-well plate. The fluorescence was measured every 2 min by a Molecular Devices Spectra Max i3x instrument. The excitation and emission wavelengths were set at 440 and 485 nm.
3.5. Competition Binding Experiments of Glycitin with Control Compounds to Cu2SOD1
The protein and the first ligand were mixed and diluted into 5 μM and 30 μM by 10 mM ammonium acetate (pH = 6.8) and incubated at 37 °C for 1 h. Then the second ligand was added, and the concentration was also 30 μM. After incubation for another 1 h, the samples were analyzed by ESI-MS. The method and instrument parameters are the same as in other ESI-MS experiments.
3.6. Molecular Docking
The structure of bovine SOD1 (PDB code 1SXA [42,43]) was prepared using Autodock 4.2.6 program [44]. Water and metal ions (all ions for ApoSOD1 and zinc ions for Cu2 SOD1) were removed from the models and saved as rigid macromolecules for docking. The force field parameters of copper ions were manually into the configuration files of the program for distinguishing the copper ions in Cu2SOD1. The 3D structure of glycitin was downloaded from the PubChem website and optimized in the Autodock program. For docking parameters, glycitin was set as a flexible ligand for semiflexible docking. The grid box was set as 80 × 108 × 70 and was centered in one of the subunits of SOD1 to include the whole subunit and dimer interface. The binding models were output using the Lamarckian Genetic Algorithm and sorted by binding energy. Reasonable docked structures with the lowest binding energy were chosen as the final results.
3.7. Measurements and Calculation of Collision Cross Section
Theoretically, the calibration drift time (t’d) and CCS (Ωc) have a relationship, as Formula (1) shows. The calibration drift time and CCS can be calculated by Formulas (2) and (3) [45,46,47]. Here, td represents IMS measured drift time and Ω means the actual CCS. MG means the relative molecular mass of IMS gas. The drift time (td) of cytochrome c and myoglobin under six different IMS parameters was measured first. The CCS (Ω) of these two standard proteins was provided by the CCS database. Then, linear fitted curves were plotted according to Formula (1). The drift time of SOD1-involved samples was measured under the same IMS parameters. The results were substituted into the formulas to get the measured CCS.
ln(Ωc) = Xln(t’d) + A
t’d = td − 1.57 × 10⁻³ × (m/z)0.5
Ωc = Ω/z[(m + MG)/mMG]0.5
For the calculation of theoretical CCS, Collidoscope [41], an open source program, was employed to calculate the CCS of SOD1 or ligand-bound SOD1. Necessary modification for molecule models was performed before calculation. The calculation was processed using a charge placement algorithm. The net charge was set to be 11 and the collision gas was set as spherical N2. As there is a lack of Lennard-Jones parameters of Cu in the default files, all Cu atoms in Cu2SOD1-involved molecules were deleted as the last modification step for the models.
4. Conclusions
In summary, we screened four glycosides from seven soybean isoflavones showing stable non-covalent binding affinity with SOD1 at three different metallization states. The results of CID-MS and MS/MS indicated that the recombination of copper played an important role in increasing the binding affinity of the four glycosides. This may be the result from the stabilization effect of copper according to other experiments and calculations. CIU-IMS-MS showed that ApoSOD1 and Cu2SOD1 need higher collision energy to unfold after binding with the glycosides. TFE-induced aggregation kinetics experiments showed that both Cu2+ and the four glycosides had significant effects on the formation of aggregates. As seen from the results of MS and aggregation kinetics, glycitin showed the best effect in stabilizing the SOD1 structure and inhibiting its aggregation, followed by sophoricoside and genistin. Competitive interaction experiments between two small molecules whose binding sites in SOD1 were known and glycitin were performed, and we made sure that these ligands shared different binding sites. Molecular docking also supported this result and showed that glycitin interacts with SOD1 at β-sheet 6 and loop IV. In conclusion, soybean isoflavone glycosides were hopeful small molecules in inhibiting the aggregation of abnormal metalized SOD1.
Supplementary Materials
The following supporting information is available online on the following link https://www.mdpi.com/article/10.3390/molecules27217303/s1, Table S1: The intensity and fading rate of MS peaks of isoflavone aglycones (La1–La3) and glycosides (Lg1–Lg5) before (I) and after (I’) adding SOD1 mixture. All compounds were analyzed under ESI negative mode. Figure S1: Intensity fading mass spectra of seven soybean isoflavones before (A) and after (B) adding P1, P2, and P3 mixture. All peaks represent [M-H]- ions of corresponded compounds. Table S2: The relative abundance of complexes compared with the protein species at the same charge state. The percentages (P) of dimer (Di)-ligand complexes were calculated directly through MS intensity (I) of +11 charged complexes and proteins. The formula is P = I (complex)/I(protein). The percentages (P) of monomer (Mo)-ligand complexes were calculated by the integrated IM peak area (A) of +6 charged monomers. The formula is P = A (complex)/A(protein). Figure S2: MS/MS spectra of Apo/ Cu2 SOD1-glycitin (P1-Lg4 and P2-Lg4) complexes. The Trap collision energy is set as 30 V. The precursor ions are the 11+ charged ions of dimer of the complexes ([Di-Lg4]11+). Table S3. The relative abundance (%) of conformation A of different SOD1s and complexes. Figure S3: CIU heat maps of ApoSOD1 (P1) and complexes with four glycosides (Lg1-Lg 4). The three conformations are marked at corresponding drift time. Dashed areas of trap collision voltages (26 V to 32 V) show comparison between protein and complexes on the boundary voltage of conformation conversion. Table S4. Conversion CE (V) of Apo and Cu2SOD1(P1, P2) and their complexes with four glycosides (Lg1–Lg4). Figure S4. ThT fluorescence of ApoSOD1 (P1, red), Cu2SOD1 (P2, black), and Cu2Zn2SOD1 (P3, blue) induced by TFE. Figure S5: The linear fitted curves under six IM parameters (wave velocity and wave height) according to Formulas (1), standard CCS and measured drift time of cytochrome c and myoglobin. Figure S6: The MS spectra of ApoSOD1 (left) and Cu2SOD1 (right) products after dialysis.
Author Contributions
Conceptualization, X.B. and F.S.; methodology, X.B., X.Z. and F.S.; validation, X.B. and F.S.; formal analysis, X.B.; investigation, X.B. and X.Z.; resources, J.X.; data curation, X.B. and J.X.; writing—original draft preparation, X.B.; writing—review and editing, F.S. and S.L.; visualization, X.B. and F.S.; supervision, Z.L. and S.L.; project administration, S.L. and F.S.; funding acquisition, F.S. and X.Z. All authors have read and agreed to the published version of the manuscript.
Funding
This research was funded by National Natural Science Foundation of China [number 81873193, 82173965 and 21904022].
Institutional Review Board Statement
Not applicable.
Informed Consent Statement
Not applicable.
Data Availability Statement
The data presented in this study are available in this article and Supplementary Materials.
Conflicts of Interest
The authors declare no conflict of interest.
Sample Availability
Not available.
References
- Rosen, D.R.; Siddique, T.; Patterson, D.; Figlewicz, D.A.; Sapp, P.; Hentati, A.; Donaldson, D.; Goto, J.; Oregan, J.P.; Deng, H.X.; et al. Mutations in CU/ZN Superoxide-Dismutase Gene Are Associated with Familial Amyotrophic-Lateral-Sclerosis. Nature 1993, 362, 59–62. [Google Scholar] [CrossRef]
- Gruzman, A.; Wood, W.L.; Alpert, E.; Prasad, M.D.; Miller, R.G.; Rothstein, J.D.; Bowser, R.; Hamilton, R.; Wood, T.D.; Cleveland, D.W.; et al. Common molecular signature in SOD1 for both sporadic and familial amyotrophic lateral sclerosis. Proc. Natl. Acad. Sci. USA 2007, 104, 12524–12529. [Google Scholar] [CrossRef]
- Soto, C.; Pritzkow, S. Protein misfolding, aggregation, and conformational strains in neurodegenerative diseases. Nat. Neurosci. 2018, 21, 1332–1340. [Google Scholar] [CrossRef]
- Trist, B.G.; Hilton, J.B.; Hare, D.J.; Crouch, P.J.; Double, K.L. Superoxide Dismutase 1 in Health and Disease: How a Frontline Antioxidant Becomes Neurotoxic. Angew. Chem. Int. Ed. Engl. 2021, 60, 9215–9246. [Google Scholar] [CrossRef] [PubMed]
- Hilton, J.B.; White, A.R.; Crouch, P.J. Metal-deficient SOD1 in amyotrophic lateral sclerosis. J. Mol. Med.-Jmm 2015, 93, 481–487. [Google Scholar] [CrossRef]
- Auclair, J.R.; Boggio, K.J.; Petsko, G.A.; Ringe, D.; Agar, J.N. Strategies for stabilizing superoxide dismutase (SOD1), the protein destabilized in the most common form of familial amyotrophic lateral sclerosis. Proc. Natl. Acad. Sci. USA 2010, 107, 21394–21399. [Google Scholar] [CrossRef] [PubMed]
- Ray, S.S.; Nowak, R.J.; Brown, R.H.; Lansbury, P.T. Small-molecule-mediated stabilization of familial amyotrophic lateral sclerosis-linked superoxide dismutase mutants against unfolding and aggregation. Proc. Natl. Acad. Sci. USA 2005, 102, 3639–3644. [Google Scholar] [CrossRef] [PubMed]
- Wright, G.S.; Antonyuk, S.V.; Kershaw, N.M.; Strange, R.W.; Samar Hasnain, S. Ligand binding and aggregation of pathogenic SOD1. Nat. Commun. 2013, 4, 1758. [Google Scholar] [CrossRef]
- Goyal, D.; Shuaib, S.; Mann, S.; Goyal, B. Rationally Designed Peptides and Peptidomimetics as Inhibitors of Amyloid-beta (A beta) Aggregation: Potential Therapeutics of Alzheimer’s Disease. ACS Comb. Sci. 2017, 19, 55–80. [Google Scholar] [CrossRef]
- Sgarbossa, A. Natural Biomolecules and Protein Aggregation: Emerging Strategies against Amyloidogenesis. Int. J. Mol. Sci. 2012, 13, 17121–17137. [Google Scholar] [CrossRef]
- Bhatia, N.K.; Srivastava, A.; Katyal, N.; Jain, N.; Khan, M.A.I.; Kundu, B.; Deep, S. Curcumin binds to the pre-fibrillar aggregates of Cu/Zn superoxide dismutase (SOD1) and alters its amyloidogenic pathway resulting in reduced cytotoxicity. Biochim. Biophys. Acta (BBA)-Proteins Proteom. 2015, 1854, 426–436. [Google Scholar] [CrossRef] [PubMed]
- Bhatia, N.K.; Modi, P.; Sharma, S.; Deep, S. Quercetin and Baicalein Act as Potent Antiamyloidogenic and Fibril Destabilizing Agents for SOD1 Fibrils. ACS Chem. Neurosci. 2020, 11, 1129–1138. [Google Scholar] [CrossRef]
- Zhuang, X.; Zhao, B.; Liu, S.; Song, F.; Cui, F.; Liu, Z.; Li, Y. Noncovalent Interactions between Superoxide Dismutase and Flavonoids Studied by Native Mass Spectrometry Combined with Molecular Simulations. Anal. Chem. 2016, 88, 11720–11726. [Google Scholar] [CrossRef]
- Zhuang, X.; Li, X.; Zhao, B.; Liu, Z.; Song, F.; Lu, J. Native Mass Spectrometry Based Method for Studying the Interactions between Superoxide Dismutase 1 and Stilbenoids. ACS Chem. Neurosci. 2020, 11, 184–190. [Google Scholar] [CrossRef]
- Zhao, B.; Zhuang, X.; Pi, Z.; Liu, S.; Liu, Z.; Song, F. Determining the Effect of Catechins on SOD1 Conformation and Aggregation by Ion Mobility Mass Spectrometry Combined with Optical Spectroscopy. J. Am. Soc. Mass Spectrom. 2018, 29, 734–741. [Google Scholar] [CrossRef]
- Zhao, B.; Zhuang, X.Y.; Liu, S.; Liu, Z.Q.; Song, F.R.; Liu, S.Y. Investigation of the interaction between superoxide dismutase and caffeoylquinic acids by alkali metal assisted cationization-ion mobility mass spectrometry. Int. J. Mass Spectrom. 2018, 434, 151–157. [Google Scholar] [CrossRef]
- Krizova, L.; Dadakova, K.; Kasparovska, J.; Kasparovsky, T. Isoflavones. Molecules 2019, 24, 1076. [Google Scholar] [CrossRef] [PubMed]
- Liu, X.X.; Li, S.H.; Chen, J.Z.; Sun, K.; Wang, X.J.; Wang, X.G.; Hui, R.T. Effect of soy isoflavones on blood pressure: A meta-analysis of randomized controlled trials. Nutr. Metab. Cardiovasc. Dis. 2012, 22, 463–470. [Google Scholar] [CrossRef]
- Nirmala, F.S.; Lee, H.; Kim, J.S.; Jung, C.H.; Ha, T.Y.; Jang, Y.J.; Ahn, J. Fermentation Improves the Preventive Effect of Soybean Against Bone Loss in Senescence-Accelerated Mouse Prone 6. J. Food Sci. 2019, 84, 349–357. [Google Scholar] [CrossRef]
- Mezei, O.; Banz, W.J.; Steger, R.W.; Peluso, M.R.; Winters, T.A.; Shay, N. Soy isoflavones exert antidiabetic and hypolipidemic effects through the PPAR pathways in obese Zucker rats and murine RAW 264.7 cells. J. Nutr. 2003, 133, 1238–1243. [Google Scholar] [CrossRef]
- Shu, X.O.; Zheng, Y.; Cai, H.; Gu, K.; Chen, Z.; Zheng, W.; Lu, W. Soy Food Intake and Breast Cancer Survival. JAMA-J. Am. Med. Assoc. 2009, 302, 2437–2443. [Google Scholar] [CrossRef]
- Rizzo, G. The Antioxidant Role of Soy and Soy Foods in Human Health. Antioxidants 2020, 9, 635. [Google Scholar] [CrossRef]
- Husain, D.; Khanna, K.; Puri, S.; Haghighizadeh, M. Supplementation of Soy Isoflavones Improved Sex Hormones, Blood Pressure, and Postmenopausal Symptoms. J. Am. Coll. Nutr. 2015, 34, 42–48. [Google Scholar] [CrossRef]
- Sharon, M.; Robinson, C.V. The role of mass Spectrometry in structure elucidation of dynamic protein complexes. Annu. Rev. Biochem. 2007, 76, 167–193. [Google Scholar] [CrossRef]
- Pacholarz, K.J.; Garlish, R.A.; Taylor, R.J.; Barran, P.E. Mass spectrometry based tools to investigate protein-ligand interactions for drug discovery. Chem. Soc. Rev. 2012, 41, 4335–4355. [Google Scholar] [CrossRef]
- Stojko, J.; Fieulaine, S.; Petiot-Becard, S.; Van Dorsselaer, A.; Meinnel, T.; Giglione, C.; Cianferani, S. Ion mobility coupled to native mass spectrometry as a relevant tool to investigate extremely small ligand-induced conformational changes. Analyst 2015, 140, 7234–7245. [Google Scholar] [CrossRef] [PubMed]
- Dupuis, N.F.; Wu, C.; Shea, J.E.; Bowers, M.T. The Amyloid Formation Mechanism in Human IAPP: Dimers Have beta-Strand Monomer-Monomer Interfaces. J. Am. Chem. Soc. 2011, 133, 7240–7243. [Google Scholar] [CrossRef] [PubMed]
- Sahawneh, M.A.; Ricart, K.C.; Roberts, B.R.; Bomben, V.C.; Basso, M.; Ye, Y.; Sahawneh, J.; Franco, M.C.; Beckman, J.S.; Estevez, A.G. Cu,Zn-superoxide dismutase increases toxicity of mutant and zinc-deficient superoxide dismutase by enhancing protein stability. J. Biol. Chem. 2010, 285, 33885–33897. [Google Scholar] [CrossRef]
- Downard, K.M. Indirect study of non-covalent protein complexes by MALDI mass spectrometry: Origins, advantages, and applications of the "intensity-fading" approach. Mass Spectrom. Rev. 2016, 35, 559–573. [Google Scholar] [CrossRef] [PubMed]
- Zhuang, X.; Liu, S.; Zhang, R.; Song, F.; Liu, Z.; Liu, S. Identification of unfolding and dissociation pathways of superoxide dismutase in the gas phase by ion-mobility separation and tandem mass spectrometry. Anal. Chem. 2014, 86, 11599–11605. [Google Scholar] [CrossRef]
- Stathopulos, P.B.; Rumfeldt, J.A.O.; Scholz, G.A.; Irani, R.A.; Frey, H.E.; Hallewell, R.A.; Lepock, J.R.; Meiering, E.M. Cu/Zn superoxide dismutase mutants associated with amyotrophic lateral sclerosis show enhanced formation of aggregates in vitro. Proc. Natl. Acad. Sci. USA 2003, 100, 7021–7026. [Google Scholar] [CrossRef]
- Kumar, V.; Prakash, A.; Pandey, P.; Lynn, A.M.; Hassan, M.I. TFE-induced local unfolding and fibrillation of SOD1: Bridging the experiment and simulation studies. Biochem. J. 2018, 475, 1701–1719. [Google Scholar] [CrossRef]
- Abdolvahabi, A.; Shi, Y.; Chuprin, A.; Rasouli, S.; Shaw, B.F. Stochastic Formation of Fibrillar and Amorphous Superoxide Dismutase Oligomers Linked to Amyotrophic Lateral Sclerosis. ACS Chem. Neurosci. 2016, 7, 799–810. [Google Scholar] [CrossRef]
- Manjula, R.; Wright, G.S.A.; Strange, R.W.; Padmanabhan, B. Assessment of ligand binding at a site relevant to SOD1 oxidation and aggregation. FEBS Lett. 2018, 592, 1725–1737. [Google Scholar] [CrossRef] [PubMed]
- Huang, H.J.; Chang, T.T.; Chen, H.Y.; Chen, C.Y. Finding inhibitors of mutant superoxide dismutase-1 for amyotrophic lateral sclerosis therapy from traditional chinese medicine. Evid. Based Complement Altern. Med. 2014, 2014, 156276. [Google Scholar] [CrossRef]
- Hashempour, S.; Shahabadi, N.; Adewoye, A.; Murphy, B.; Rouse, C.; Salvatore, B.A.; Stratton, C.; Mahdavian, E. Binding Studies of AICAR and Human Serum Albumin by Spectroscopic, Theoretical, and Computational Methodologies. Molecules 2020, 25, 5410. [Google Scholar] [CrossRef]
- Richardson, J.S.; Richardson, D.C. Natural beta-sheet proteins use negative design to avoid edge-to-edge aggregation. Proc. Natl. Acad. Sci. USA 2002, 99, 2754–2759. [Google Scholar] [CrossRef]
- Elam, J.S.; Taylor, A.B.; Strange, R.; Antonyuk, S.; Doucette, P.A.; Rodriguez, J.A.; Hasnain, S.S.; Hayward, L.J.; Valentine, J.S.; Yeates, T.O.; et al. Amyloid-like filaments and water-filled nanotubes formed by SOD1 mutant proteins linked to familial ALS. Nat. Struct. Biol. 2003, 10, 461–467. [Google Scholar] [CrossRef] [PubMed]
- Khare, S.D.; Dokholyan, N.V. Common dynamical signatures of familial amyotrophic lateral sclerosis-associated structurally diverse Cu, Zn superoxide dismutase mutants. Proc. Natl. Acad. Sci. USA 2006, 103, 3147–3152. [Google Scholar] [CrossRef]
- Hornberg, A.; Logan, D.T.; Marklund, S.L.; Oliveberg, M. The coupling between disulphide status, metallation and dimer interface strength in Cu/Zn superoxide dismutase. J. Mol. Biol. 2007, 365, 333–342. [Google Scholar] [CrossRef] [PubMed]
- Ewing, S.A.; Donor, M.T.; Wilson, J.W.; Prell, J.S. Collidoscope: An Improved Tool for Computing Collisional Cross-Sections with the Trajectory Method. J. Am. Soc. Mass Spectrom. 2017, 28, 587–596. [Google Scholar] [CrossRef] [PubMed]
- Berman, H.M.; Westbrook, J.; Feng, Z.; Gilliland, G.; Bhat, T.N.; Weissig, H.; Shindyalov, I.N.; Bourne, P.E. The Protein Data Bank. Nucleic Acids Res. 2000, 28, 235–242. [Google Scholar] [CrossRef]
- Rypniewski, W.R.; Mangani, S.; Bruni, B.; Orioli, P.L.; Casati, M.; Wilson, K.S. Crystal-Structure of Reduced Bovine Erythrocyte Superoxide-Dismutase at 1.9 Angstrom Resolution. J. Mol. Biol. 1995, 251, 282–296. [Google Scholar] [CrossRef] [PubMed]
- Morris, G.M.; Huey, R.; Lindstrom, W.; Sanner, M.F.; Belew, R.K.; Goodsell, D.S.; Olson, A.J. AutoDock4 and AutoDockTools4: Automated Docking with Selective Receptor Flexibility. J. Comput. Chem. 2009, 30, 2785–2791. [Google Scholar] [CrossRef]
- Ruotolo, B.T.; Benesch, J.L.P.; Sandercock, A.M.; Hyung, S.-J.; Robinson, C.V. Ion mobility-mass spectrometry analysis of large protein complexes. Nat. Protoc. 2008, 3, 1139–1152. [Google Scholar] [CrossRef] [PubMed]
- Valentine, S.J.; Counterman, A.E.; Clemmer, D.E. A database of 660 peptide ion cross sections: Use of intrinsic size parameters for bona fide predictions of cross sections. J. Am. Soc. Mass Spectrom. 1999, 10, 1188–1211. [Google Scholar] [CrossRef]
- Bush, M.F.; Hall, Z.; Giles, K.; Hoyes, J.; Robinson, C.V.; Ruotolo, B.T. Collision Cross Sections of Proteins and Their Complexes: A Calibration Framework and Database for Gas-Phase Structural Biology. Anal. Chem. 2010, 82, 9557–9565. [Google Scholar] [CrossRef]
Publisher’s Note: MDPI stays neutral with regard to jurisdictional claims in published maps and institutional affiliations. |
© 2022 by the authors. Licensee MDPI, Basel, Switzerland. This article is an open access article distributed under the terms and conditions of the Creative Commons Attribution (CC BY) license (https://creativecommons.org/licenses/by/4.0/).

