Abstract
The current study examines the desiccation-resistant Ramlibacter tataouinensis TTB310T as a model organism for the production of novel exopolysaccharides and their structural features. This bacterium is able to produce dividing forms of cysts which synthesize cell-bound exopolysaccharide. Initial experiments were conducted on the enrichment of cyst biomass for exopolysaccharide production under batch-fed conditions in a pilot-scale bioreactor, with lactate as the source of carbon and energy. The optimized medium produced significant quantities of exopolysaccharide in a single growth phase, since the production of exopolysaccharide took place during the division of the cysts. The exopolysaccharide layer was extracted from the cysts using a modified trichloroacetic acid method. The biochemical characterization of purified exopolysaccharide was performed by gas chromatography, ultrahigh-resolution mass spectrometry, nuclear magnetic resonance, and Fourier-transform infrared spectrometry. The repeating unit of exopolysaccharide was a decasaccharide consisting of ribose, glucose, rhamnose, galactose, mannose, and glucuronic acid with the ratio 3:2:2:1:1:1, and additional substituents such as acetyl, succinyl, and methyl moieties were also observed as a part of the exopolysaccharide structure. This study contributes to a fundamental understanding of the novel structural features of exopolysaccharide from a dividing form of cysts, and, further, results can be used to study its rheological properties for various industrial applications.
Keywords:
Ramlibacter tataouinensis; exopolysaccharide; biosynthesis; optimization; bioreactor; characterization; GC; NMR; FT-ICR-MS; FTIR 1. Introduction
The high demand for natural polysaccharides in different industrial sectors has focused attention on microbial exopolysaccharides (EPSs). EPSs are long-chain biopolymers composed of branched and repeating units of monosaccharides, which are mainly produced by various microorganisms when excess carbon is available in the growth environment and in case of environmental stresses [1]. EPSs are synthesized by bacteria and secreted out of the cells as a capsule or slime, which is loosely associated to the bacterial cell surface [2]. These EPS molecules are mainly responsible for biofilm formation and are also involved in, e.g., cell defense mechanisms to cope with osmotic, saline, and low/high temperature stress, desiccation, antibiotics, and antibodies [3]. Due to their excellent physicochemical and material properties, EPSs are broadly used in, e.g., the food, pharmaceutical, petroleum, cosmetic, and medical industries as emulsifiers, biosurfactants, gelling agents, ion exchange resins, viscofiers, bioflocculants, stabilizers, and drug carries [4]. In addition, EPS molecules have also been screened for their antibacterial, antitumor, antiviral, and anti-inflammatory properties [5]. EPSs are currently being exploited as additional commercial products such as bacterial cellulose, succinoglycan, curdlan, dextran, pullulan, xanthan, gellan, alginates, and hyaluronic acid from different bacterial and fungal strains [4].
The biosynthesis of EPS is a special metabolic process in which diverse polysaccharides with distinctive features can be synthesized by unrelated strains of the same species [6]. Nowadays, there is considerable interest amongst scientists toward finding novel EPS structures with unique properties. As a result of screening efforts, many bacteria from various extreme environments have been sourced for novel EPSs that can be exploited for different biotechnological applications [7]. However, arid and semi-arid environments and their microorganisms have scarcely been subjected to the biosynthesis and characterization of novel EPS structures. One such example is Ramlibacter tataouinensis TTB310, a slow-growing betaproteobacterium isolated from sand particles from a semi-arid region of South Tunisia (Tataouine) [8]. This bacterium possesses the unusual characteristic of coexistence in two morphological forms that are able to divide into spherical cysts and rod-shaped cells [8,9,10]. This unique cell cycle allows this strain to adapt to the desert environment, and this strain is tolerant to desiccation due the formation of cysts [10,11]. It is believed that the major reason for cysts’ long-term tolerance to desiccation is the fact that they are embedded within a thick layer of EPS, which is not present in the rods [8,11]. The complete genome sequence is available for this strain of R. tataouinensis, which confirms the presence of 40 chromosomal glycosyl-transferases (GTs), and these GTs are supposedly responsible for the formation of α-, β-linked D-gluco configurations in the glycosidic bonds of the EPSs [11].
Transmission electron microscopy studies have shown that the EPSs of cysts, appearing as a dark halo, were arranged in a thin and compact layer firmly attached to the cellular surface [8,9]. These features are different from many of the commercialized bacterial EPSs like cellulose and xanthan, produced in high quantity and excreted in the culture medium [6,12]. Another peculiarity is that, unlike the bacteria used industrially (e.g., Xanthomonas, Rhizobium) [13,14], the EPS of R. tataouinensis is produced during the logarithmic growth phase with cyst divisions rather than only during the stationary phase [11]. Therefore, the optimization of the culture medium for better EPS production by R. tataouinensis and the extraction procedure should be conceived differently compared to classical industrially produced EPS. To our knowledge, however, no information is available either on the biosynthesis of the EPSs from R. tataouinensis or on their structure. Therefore, this study aimed to optimize cyst production for the biosynthesis of EPS by R. tataouinensis TTB310T (=DSM 14655T =ATCC BAA-407T =LMG 21543T) and to determine the structural information of synthesized EPS including monosaccharide composition, using FT-ICR-MS, NMR, and FTIR.
2. Results and Discussion
2.1. Optimization of Cyst Formation in Batch Fermentation
Usually, optimization of EPS production is performed by two-step processes such as optimization of cell growth and EPS production from biomass while increasing the carbon/nitrogen (C/N) ratio [4]. The main difficulty we have had to face for the optimization of EPS production by R. tataouinensis TTB310 was related to the fact that only cysts of strain TTB310 were able to produce EPS (8,10,11). In this study, strain TTB310 grown in TSB 1/10 also exhibited both cysts and rods (Figure S1), and it was difficult to induce the differentiation of dividing rods into cysts in order to use the two-step strategy in a controlled manner. Therefore, we decided to take advantage of one main peculiarity of this bacterium, which is the ability of cysts to divide and so to optimize simultaneously the cell division of strain TTB310 cysts and their EPS production.
In batch culture (TSB 1/10), the growth of strain TTB310 was significantly increased in a reproducible way in the presence of lactate (OD 0.19). Stimulation of growth was maximal at 10 mM lactate (108 to 109 cfu/mL−1) and remained significant at higher concentrations (20 and 40 mM). A yellow-orange color and highly mucous colonies were obtained with a high proportion of cysts when the medium was supplemented with 10 mM lactate (Figure S2). With respect to biomass, cultures of strain TTB310 in TSB 1/10 medium had an average dry biomass of about 4.8 mg from 150 mL of medium broth, whereas cultures in 10 mM lactate-supplemented medium had an average of 10.8 mg biomass. Therefore, bacterial growth was approximately two times higher in cultures supplemented with 10 mM lactate when compared to lactate-free control. Although in previous studies R. tataouinensis was shown to assimilate acetate, lactate, and β-hydroxybutyrate as carbon and energy sources [8,11], we did not observe such an important stimulation of growth in the presence of acetate, hydroxybutyrate, and succinate, probably because only lactate can regulate pH medium (see Section 2.2).
2.2. Optimization of Cyst Formation in Fed-Batch Fermentation
Two different fed-batch experiments were executed based on the pH. First, the experimental (TSB 1/10) medium was supplemented with 10 mM of lactate with an initial pH of 7.4, and the lactate was fed into the bioreactor by two consecutive additions (2.5 and 4th day of incubation). In a second experiment, pH was regulated continuously by adding lactic acid as a pH regulator and carbon source. The initial dissolved oxygen (DO) level (100%) had gradually decreased to 50% at the end of the first experiment (Figure S3A). In addition, the DO level did not fall below the threshold of 20% which would trigger a cascade of regulations. Therefore, oxygenation did not seem to be the limiting factor for cyst formation and subsequent EPS synthesis during the first experiment. In contrast, during the second bioreactor culture, especially after three days of fermentation, the culture was enriched with aggregates of cysts. On the other hand, the medium became alkaline (pH 8.7) at the end of the first experiment (Figure S3A). After each addition of lactic acid (final concentration: 2.2 mM), the pH dropped sharply but became alkaline again in less than 24 h (Figure S3A). Two lactic acid doses did not seem to affect the growth kinetics of strain TTB310 (Figure S4). Stopping the lactic acid supply beyond the 7th day of culture resulted in an immediate rise in pH 8.4 in the second experiment (Figure S3B) and also arrested the growth of strain TTB310 or even induced the bacterial cell lysis (Figure S4B). This observation confirms the sensitivity of R. tataouinensis to alkalinity, and high pH is one of the significant limiting factors for cysts and EPS synthesis.
In terms of strain TTB310 growth, TSB 1/10 with 10 mM lactate medium without pH regulation had shown an OD of 0.16 (Figure S4A). pH regulation led to a significant improvement in growth (OD 0.25) while maintaining the same nutritive conditions after 7 days of fermentation (Figure S4B). When using starting medium with tryptone 1g/L and yeast extract 0.3 g/L, a drastic increase in the growth (OD 0.60) under fed-batch condition resulted, higher than that of all of the results obtained before (Figure S4C). Finally, a rich starting medium (10 mM lactate, 4 g/L tryptone, 1.3 g/L yeast extract, 0.25 g/L K2HPO4, and 0.5 g/L NaCl) with continuous pH regulation produced an OD of about 0.58. At this point, strain TTB310 culture was highly enriched with cysts. Adding a supplement (tryptone 1g/L, yeast extract 0.3 g/L) on the 4th day of fermentation resulted in further enhanced growth, with OD reaching 0.76. However, an increased proportion of rods and a decrease in cysts’ aggregates was noticed during this second phase of growth. Therefore, we concluded that stopping the culture at days 3 to 4 would optimize the mass production of strain TTB310 cysts and subsequent EPS extraction for chemical characterization.
2.3. Extraction, Solubility, and Chemical Analysis of EPS
The modified extraction method using PBS with TCA has significantly increased the yield of EPS, since TCA particularly denatures and precipitates the proteins. This modified extraction method was devised based on literature [15,16] and the peculiarities of R. tataouinensis TTB310. Calcofluor white stain revealed that the EPS had detached from the surface of the cysts, because the fluorescent halo around the cysts was no longer present. Only filamentous fluorescent residues were observed under optical microscopy, confirming the EPS separation from cysts (Figure 1). Despite the elimination of TCA and lipids, the EPS of strain TTB310 remained insoluble in 0.1% final concentration in 0.1 M NaCl, even after pH adjustment, stirring, and progressive heating from 40 °C to 90 °C. However, EPS readily dissolved in DMSO. This solution was subsequently dialyzed.
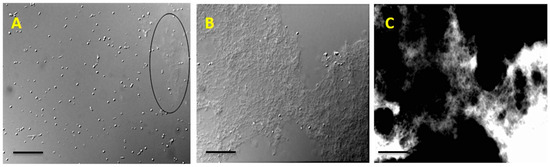
Figure 1.
Detachment of EPS from the surface of R. tataouinensis TTB310 cells after suspending in modified PBS and 4% TCA treatment. (A) Optical microscopy image in which calcofluor white staining reveals a filamentous fluorescent part (cut-off area). (B) Optical microscopy image of a large fragment of EPS taken off. (C) The fluorescence image after staining with calcofluor white corresponding to image B, which shows the fluorescence of the peeled polymer. Scale bar: 20 μm.
Mass elemental compositions such as C, H, N, and O were determined to be 41.3 ± 2.0%, 7.4 ± 0.4%, 5.7 ± 1.3%, and 49.4 ± 4.0%, respectively (three independent samples from the same EPS extraction). These values were computed after the subtraction of the TCA mass, since it had been used for the purification of the EPS. Uronic acids and RNA traces were not detected. The total monosaccharide content in purified EPS following resuspension in DMSO showed an average of 42% attenuation in monosaccharides. Elemental analysis also detected nitrogen in the samples, possibly resulting from peptides or membrane proteins solubilized during the extraction. A second hypothesis is that the EPS of strain TTB310 carries amine or amide groups as substituents of monosaccharides or amino acids in its repeating unit. Chemical analysis indicates that the extracted EPS was composed of repeating units of a saccharide nature with possible substitutions, for example with acetyl groups.
HPLC analysis shows that only about 1.5% of lipids were present in the total EPS samples, and the HPLC profile also confirms the presence of outer membrane polar lipids. This might arise from the extraction process, since the EPS of strain TTB310 was tightly bound to the outer membranes of the bacterial cells.
2.4. Monosaccharide Composition and Quantification by GC Analysis
Two different GC analyses of the EPS samples of strain TTB310 were performed after hydrolysis with sulfuric acid (13 M H2SO4, then 1 M) and methanolysis. Hydrolysis with H2SO4 detected five hexoses, two of them were predominant—glucose (Glc) and galactose (Gal)—and three were minor, such as mannose (Man), xylose (Xyl), arabinose (Ara), and the pentose ribose (Rib) (Figure 2).
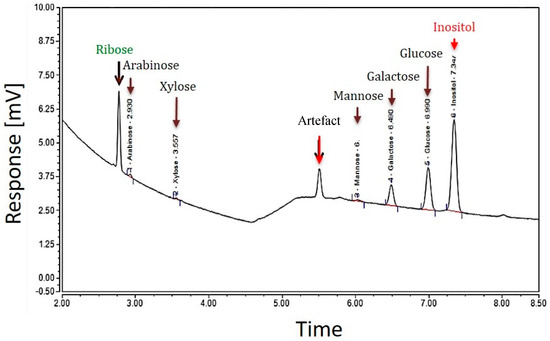
Figure 2.
GC profile of the EPS of R. tataouinensis TTB310 which were pre-treated by acid hydrolysis (13 M H2SO4): The major peaks detected correspond to the monosaccharides: ribose, glucose, and galactose, and the minor peaks are those of xylose, arabinose, mannose. The internal standard was inositol.
The presence of ribose in the EPS requires verification by other methods, since this pentose is rarely present in bacterial EPSs described in the literature [17]. From the GC analysis of EPS after hydrolysis with H2SO4, the monosaccharide composition was estimated as follows: 7.7%, 3.0%, 0.4%, 0.2%, and 0.3% representing glucose, galactose, mannose, arabinose, and xylose, respectively. The total mass percentage of all monosaccharides was about 12%. Therefore, the rest of the monosaccharides (according to elemental analysis 38.5% or 42% via colorimetric test) was not identified by this method. The difference between these values may come from a low yield of hydrolysis and derivatization (about 50%) or from incomplete identification of the constituents of the repeating unit (e.g., oxidized sugar moieties).
The GC analysis of methanolized EPS revealed the presence of ribose, glucose, galactose, and mannose. Interestingly, certain monosaccharides (e.g., arabinose and xylose) were absent (Figure 3).
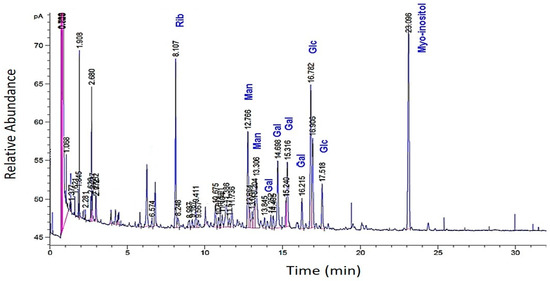
Figure 3.
GC profiles of the EPS of R. tataouinensis hydrolyzed by methanolysis (MeOH/HCl 3 N). The relative abundance of the monosaccharides: ribose, glucose, galactose, and mannose referred to the internal standard myo-inositol.
The presence of these peaks may indicate monosaccharides different from the “standard” molecules used or those linked to substituents that have not been released after methanolysis. These can be non-glycosidic molecules bearing hydroxyls, which allowed for their silylation and subsequently their volatilization. According to this second GC analysis, the total percentage of the major monosaccharides amounted to 12–14%, distributing across ribose (5.2%), glucose (4.0%), galactose (2.8%), and mannose (1.7%). The ratio of the four species (Rib:Glc:Gal:Man) from an average of two methanolyses was as follows: 1.5:1.0:0.7:0.4, or 3/2/1/1. In our hands, methanolysis was found to be a less efficient hydrolysis method for this EPS compared to sulfuric acid hydrolysis.
2.5. EPS Polymer Composition and Structural Evaluation by FT-ICR-MS
The ultrahigh-resolution mass spectrometry (FT-ICR-MS) of the EPS of R. tataouinensis TTB310 between 100 and 1500 m/z is depicted in Figure 4A. The elementary raw formulas were calculated using an in-house written script, with a tolerance of 0.5 ppm between the detected mass and the theoretical mass. The theoretical mass was computed on the basis of the gross formula of the ion, and the theoretical mass of the ion is labelled “experimental monoisotopic mass” with m/z accounting for the negative charge [18]. Figure 4 shows the visualization of a van Krevelen diagram (Figure 4B) and mass edited H/C ratios plot of 32 compounds characteristic of CHO-containing compounds (Figure 4C), corresponding only to the detected carbohydrate compounds (i.e., mono- and oligosaccharides). For each of these compounds, we searched databases (ChemSpider, PubChem) for potential structural candidates corresponding to mono- and oligosaccharides, considering that these raw formulas originated from different cases:
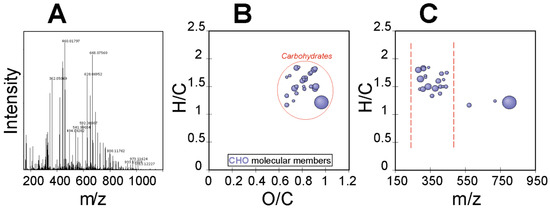
Figure 4.
Detected carbohydrates in the R. tataouinensis EPS sample as detected by FT-ICR-MS: (A) Full mass spectrum, (B) van Krevelen diagram, and (C) mass-edited H/C ratios plot.
- Loss of a proton and formation of (M-H)−
- Loss of a proton, dehydration and formation of (M-H2O-H)−
- Loss of a proton, 0.2A fragmentation and formation of (M-C2H4O2-H)−
- Loss of a proton, 0.2A fragmentation, dehydration and formation of (M-C2H4O2-H2O-H)−
A table of 120 potential compounds was generated with possible structures generated by a Metlin m/z match search in negative mode on the basis of (M-H)− and (M-H2O-H)− ions, and a list of gross formulae corresponding to neutral mass losses (M-H2O) was also computed. This database was completed by adding the most characteristic motifs/substituents of monosaccharides (Table S2) and typical mass losses corresponding to classical fragmentations of monosaccharides (Table S3). Some fragmentation patterns revealed the type of linkage of monosaccharides (1.2, 1.3, 1.4, 1.6) [19].
In total, a table of 180 neutral mass-loss patterns was generated, and a list of 32 m/z reflecting these mass losses was used to construct a distance matrix among these m/z values. Then the list of mass losses (neutral patterns) was used to search for patterns in the distance matrix with a precision of 5 decimal places; Table S4 shows an example of such a pattern search in the distance matrix. The neutral mass loss patterns and potential structures assigned to the m/z list allowed for the reconstruction of the structure of potential fragments; an example is shown in Figure S6. On the same principle, we generated the interpretation Table S5. The tolerance ∆/M between the experimental and theoretical mass for m/z was ±0.7 ppm. The evidence presented in Table S6 leads to the following plausible units:
(UA)-(Tri-Pentose)-(Hexose)-(Hexose-di-OAc)-(Hexose-Succ)-(Hexose-OMe-(6-Deoxyhexose)-(6-Deoxyhexose)→
This oligosaccharide contained four hexoses, three pentoses, two deoxyhexoses, one uronic acid, two acetyls, an O-methyl, and a succinyl, and its formula (C66H100O51) can be detected on the global spectrum as a fragment 0.2A (M-C2H4O2-H)-, C64H95O40)- at m/z 1647.49429 (intensity 2.08 × 10⁶, theoretical mass 1647.49474, ∆/M= −0.27314 ppm). Using the indices given by fragmentation, the mass spectrum appears to represent the following plausible repeated units:
(UA)-(Tri-Pentose)-1→6-(Hexose)-1→6-(Hexose-3,4-di-OAc)-(Hexose-Succ)-(Hexose-OMe)-(6-Deoxyhexose)-(6-Deoxyhexose)→
Apart from the list of m/z selected by the ratio H/C vs O/C, the spectrum showed very intense mass peaks, corresponding to adducts (M+Cl3COO)− and (M+HSO4)−, with characteristic isotopic patterns.
2.6. EPS Polymer Composition and Structural Evaluation by FT-ICR-MS
Several NMR spectra were acquired on the supernatant of a suspension after 5 h of sonication with D2O. Spectral analysis revealed that the anomeric protons (O2CH units) resonated generally from 4.4–5.8 ppm, with alpha protons between 4.8 and 5.8 ppm and beta protons between 4.2 and 4.8 ppm (Figure 5 and Figures S6–S9).
Figure 5.
1H NMR spectrum (800 MHz, D2O) of R. tataouinensis EPS reveals a considerable structural complexity, with the key substructures (CarH, purple, =CH and O2CH, blue, OCH, green, NCH and OCCH, orange, and CCCH, red) and relative abundance (% of 1H NMR section integral) indicated. A stronger green shade denotes carbohydrate-related OCH and O2CH units, a red shade probably indicates peptide CONHCαH units, a blue shade denotes olefinic =CH units, and a purple shade denotes aromatic CarH units; asterisk denotes an extended aliphatic spin system, cf. Figures S6 and S7.
Anomeric carbon (O2CH units) resonated from 95–110 ppm, with alpha carbon resonances from 98–103 ppm and beta carbon resonances from 103–106 ppm. Hydrogen and carbon, connected by scalar coupling constants 1JCH in HSQC (heteronuclear single quantum coherence) and 3JH1H2 in TOCSY NMR spectra (total correlation spectroscopy), provided information about the saccharide configuration. OCH units in the saccharide ring generally resonated from 3.2–4.5 ppm. The methyl groups of 6-deoxy saccharides and O- and N-acetyl groups were in the range of 1.2 to 2.3 ppm. The carbon atoms in rings (OCH units) resonated from 62–85 ppm and appeared in the case of attached nitrogen functional groups near 50–60 ppm, and in the case of common, simple oxygenated carbon (OCH units) in the 65–75 ppm range. The carbon atoms involved in glycosylation showed a significant low field displacement of about 5–10 ppm. Unsubstituted C6 carbons (HOCH2 units) resonated from 60–63 ppm, and C6 carbons bound to another saccharide residue appeared around 65–70 ppm. The carbon signals of methyl groups were in the range of 15 to 30 ppm, and carbonyl carbons were in the range of 165 to 185 ppm [20].
The 1D 1H NMR spectrum showed the presence of several substructures indicative of polysaccharides according to chemical shift δH (cf. above). At δH 1.2–2.3 ppm, 1H, 13C DEPT HSQC NMR spectra showed multiple cross peaks indicative of methyl groups (δH: 1.28, 1.30, 1.31, 1.38, 1.39, 1.45, 1.47, and 1.5 ppm) (Figure S7C). A 1H, 1H TOCSY NMR spectrum provided a contiguous spin system connecting the following 1H NMR resonances (Figure S7B) δH 1.28, 2.43, and 2.48 ppm, and δH 1.46, 1.52, 1.76, 1.82, 1.91, and 3.06 ppm, some of which were correlated to 13C signals of type CH3 on the HSQC spectrum and to very complex proton resonances in the 1H, 1H TOCSY NMR spectrum: δH1: 1.28, 1.30, 1.31, 1.38, 1.39, 1.45, 1.47, and 1.5 ppm (Figure S7B). In addition, 1.27/19 ppm (CH3) coupled to 4.28, 4.35, 4.45, and 4.48 ppm; 1.29 /19 ppm (CH3) coupled to 4.28 (3J(H6-H5): 8 Hz), 4.35, and 4.44 ppm; 1.30–1.31/22 ppm (CH3) (3J ~ 8 Hz) coupled to 2.47, 4.28 ppm, 1.32/22 ppm (low signal strength); (CH3) coupled (3J ~ 8 Hz) 2.48 ppm, 1.38/17.2 ppm coupled to 3.52, 3.76 ppm, 1.42/15.8 ppm (CH3) coupled to 4.68 ppm (3J ~ 8 Hz), 1.46/16.5 ppm (CH3) (3J ~ 8Hz) coupled to 4.38 ppm. The values in between 3.2 to 4.5 ppm correspond to the chemical movement of protons in a saccharide cycle. Resonance signals at 1.27, 1.29, 1.38, and 1.42 ppm indicate the distinctive chemical displacements of methyl 6-deoxysaccharides [21].
The positioning of cross peaks (δH/C) of methyl from 6-deoxy-rhamnose in 1H, 13C DEPT HSQC NMR spectra is conspicuous and very sensitive to its environment. For example, methyl (C/H) resonates at 1.34–1.32/17.7–17.9 for one 4)-α-L-Rhap-(1→) [22] and 1.28/19.2 ppm [23] for another 4)-α-L-Rhap-(1→). δH/C indicated that the two methyl resonances at δH 1.27 and 1.29 connected with δC at 19 ppm could represent methyl in a →2-α-Rhap-1→ (1.28/19.2 ppm) [21]. The 1.38/17.2 ppm (δH/C) de-shielded CH3 cross peak would represent binding of a α-rhamnose to a uronic acid [21,24]. The de-shielded proton signal and the shielded methyl carbon signal at 1.42/15.8 ppm (δH/C, Figure S7C) may indicate the presence of an adjacent nitrogen heteroatom. Signals resonating at 1.28, 1.30, 1.32, 1.41, 1.46, and 1.48 ppm could correspond to CH3 of amino acids such as, e.g., alanine, threonine, and valine.
A complex multiplet at 2.05 ppm and a broad massif at 1.94 ppm (CH2, 27.5 ppm and CH2, 28 ppm, respectively) indicated that these two signals are coupled (3J ~ 7 Hz), characteristic of a succinyl, substituting a saccharide via an ester bond [23]. A singlet at 2.10 ppm (CH3, 22.4 ppm) and an intense singlet at 2.17 ppm (CH3, 22.4) corresponded to acetate- or amide-type CH3. This assessment is corroborated by the presence of a 5.60 ppm (CH, 92.5 ppm) doublet (3J ~ 8 Hz) characteristic of a proton NMR resonance present on the carbon of an O-acyl glycosidic ring [25,26]. The highly dubbed chemical displacement excluded that this O-acetyl group could be carried by the C6 carbon of a hexose residue. In addition, the 8 Hz coupling constant reflected the axial–axial coupling of these protons, a 2.76 ppm Me (CH, 33 ppm) singlet, potentially H2 from a glucosamine. For example, a 3-O-Me on a galactose resonated at 3.46 ppm [27], and 3.45 and 3.42 ppm for a 2-OMe and 3-OMe on a 6-deoxyhexose [28]. Several signals correlated according to the 1H, 1H TOCSY NMR spectrum at 1.55 (CH2, 22 ppm), 1.75 (CH2, 26 ppm), 1.85 and 1.93 (CH2, 30.5 ppm), 3.06 (CH2, 39 ppm), and 4.37 (CH, 50 ppm) (Figure S7B) indicated that a lysine was engaged in an amide bond, and similar properties were also observed in the LPS of Proteus mirabilis [29,30].
The 1H, 13C DEPT-HSQC cross peaks spectrum revealed directly connected carbon–proton pairs (1JCH) and differentiated CH/CH3 groups with positive signals (shown in red) from CH2 groups with negative signals (shown in blue) (Figure S8C). Quaternary carbon, with no directly attached protons, was not visible in this spectrum [20]. The presence of cross peaks from δC 50–60 ppm (4.33/54, 4.52/55.5, 4.50/56, 4.36/58.5, 4.48/59 ppm, δH/C) probably represented the presence of carbon bound to nitrogen. Several cross peaks from δH/C 80–85 ppm (4.18/81, 4.1/82.5, 4.08/82.5, 3.63/82, and 3.66/82 ppm, δH/C) indicated the presence of furanose cyclic C [31]. The C1 of these furanoses resonated at 5.13/107 ppm (denoted l2), 5.15/107 ppm (denoted l1) and 5.098/107.5 (denoted l3) (Figure S9). All other signals in the range of cyclic CH chemical displacements corresponded to pyranoses.
In the area of the anomeric 1H and 13C resonances (4.506–5.278 ppm and 95.39–108.22 ppm), several types of anomeric carbons were identified from the most to the least unshielded displacement (Figure S9B). The chemical shifts δH/C of respective HSQC cross peaks are summarized in Table S6.
The joint analysis of several complementary NMR spectra led us to propose the following attributions. Resonances δH/C were unshielded resonances reflecting monosaccharide grafting or substitution. Resonance δH/C l2 (Figure S9): H1 5.13/107 ppm (JH1,H2 <2 Hz), H2 4.18/81 (JH2,H3 16 Hz), H3 4.28/71 (JH3,H4 12 Hz), H4 4.08/82.5 (JH4,H5 10 Hz), H5 3.88, and 3.705/62.5 ppm represented the -2)-β-Ribofuranosyl-(1→ (H1-H5 correlation identified from TOCSY, HSQC NMR spectra). Resonances δH/C l1 (Figure S9): H1 5.15/107 (JH1,H2 8 Hz), H2 3.84/75 (JH2,H3 15 Hz), H3 3.56/76 (JH3,H4 7.2 Hz), H4 4.10/82.5 (JH4,H5 8 Hz), H5 3.58, and 3.64/62 represented the β-Ribofuranosyl-(1→ (identified from TOCSY, HSQC NMR spectra) [32]. Resonance δH/C l3 (Figure S9): 5.09/107.5, H2 4.19/81 (JH1,H2 10 Hz), H3 4.27/71(JH2,H3 8 Hz), H4 4.1/83 (JH3,H4 10 Hz), H5 3.63, and 3.66 (JH4,H5 12 Hz)/82 ppm represented -5)-β-Ribofuranosyl-(1→. The compilation of these NMR data gave a motif of type →5-(β-Ribp-2-β-Ribp)-1→2-β-Ribp-1→ which confirms the FT-ICR-MS data on the presence of tri-pentoses. Resonance δH/C j1 (Figure S9): the monosaccharide corresponding to H/C anomeric position j1 (Figure S9) presents the chemical displacements and coupling constants. The coupling constant 3JH1,H2 was lower than 5 Hz while the coupling constants 3JH2,H3, 3JH3,H4, and 3JH4,H5 were higher than 5 Hz, which evoked an α-Glcp. The chemical displacement of C1 (95 ppm) and the de-shielding of C2 (78 ppm) and C4 (76 ppm) led to the proposition of a -2,4)-α-Glcp-(1→ motif for proton j1 (Figure S9). Resonance δH/C j2 (Figure S9): proton j2 at 5.15/95 ppm correlated with H2 4.185/ (74 or 81 ppm) (3J < 5 Hz) and 4.29/71 ppm. For analogous reasons as those mentioned above, the proton j2 indicated a galacto-configuration. The chemical shift of j2 is potentially unshielded with the possibility of methoxy substitution in position 2. The coupling constants and the chemical displacement of the H1 and H4 protons suggest a →4)-α-Galp-2-OMe-(1→. Resonance δH/C b1 (Figure S9): The H1 b1 (Figure S9) cross peak indicated a gluco- configuration, all the H of the ring showed TOCSY cross peaks with H1 and the coupling constants 3J were higher than 5 Hz. δH/C at position 1 (4.61/101 ppm) evoked a β-Glcp. δC of CH2 in position 6 was potentially unshielded (71 ppm), which suggested a sequence 6)-β-Glcp-(1→. The de-shielding of C3 and C4 carbon atoms (83 ppm) likely indicated a substitution of positions 3 and 4 by OAc. Glycoside b1 (Figure S9) could be a 6)-3,4-Di-OAc-β-Glcp-(1→, confirming the mass spectrometry hypothesis of a di-O-acetylated monosaccharide in 3,4 and bound in position 6. The proton h1 (Figure S9) could be a 3)-Rhap-(1→. Resonance e1 (Figure S9) was assigned, based on the H-indexed proton at δH 4.62 ppm, the correlation of H1 with H5 in the TOCSY NMR spectrum, the absence of a C6 resonance and the de-shielding of C4 and C5 carbons all together suggested an acid beta-glucuronic unit bound in 1 and 4 positions. This monosaccharide could be the unit linked to the amino acid lysine, previously identified in mass spectrometry. The NMR chemical shift of GlcA was similar to those of the pattern →4-β-D-GlcpA-6Lys-(1→ identified by Shashkov et al. in Proteus mirabilis LPS [33]. Based on these findings, we propose the following identification: -4)-β-D-GlcpA-6Lys-(1→. Overall NMR analysis confirmed the presence of OAc, methoxy substituents and the presence of succinate, of two deoxyhexoses (rhamnoses) and an amino acid-bound to uronic acid. This compound has the gross formula C72H112O52N2 and a partial putative structure of the R. tataouinensis TTB310 EPS has also been proposed (Figure 6).
Figure 6.
Partial putative structure of the purified EPS obtained from the cysts of R. tataouinensis TTB310. The C*s are those for which it is necessary to check that they are well engaged in the link. Lys: Lysine; OAc: O-acetyl group; Succ: succinate; OMe: O-methyl group.
2.7. Analysis of EPS Substituents by FTIR
FTIR analysis was performed to explore the substituted moieties along with monosaccharides. The standard infrared absorption peaks were observed in the range from 4000–400 cm−1 (Figure 7).
Figure 7.
FTIR spectrum of the extracted EPS from R. tataouinensis TTB310 cysts. The spectrum was recorded in the 3900–400 cm−1 range with a 4 cm−1 resolution using an ATR device (SensIR technologies, CT) equipped with a 9-bounce diamond microprism and ZnSe optics. The 2400–1900 cm−1 region cannot be exploited due to the absorption of CO2 and the strong absorption of the diamond material.
A broad peak at 3342 cm−1 corresponded to the hydroxyl groups (-OH) of the monosaccharides and possibly to the ν(OH) mode of residual water in the sample. The peak at 2927 cm−1 corresponded to the ν(CH) stretching modes of methyl and methylene reported for polysaccharides [32,33]. The two intense and broad bands at 1025 cm−1 and 1066 cm−1 corresponded to C-O-C and C-O bonds, typical of monosaccharides and therefore strongly corroborated that the polymer is a polysaccharide [32,33]. The presence of lipids was not totally excluded, since the peak at 1751 cm−1 is characteristic of the ν(C=O) mode of ester bonds (C=OOR) [34]. However, there was no significant contribution of aliphatic groups, and the peak at 2927 cm−1 typical for the C-H bond is rather small. A better explanation for this band at 1751 cm−1 is the presence of O-acetylated sugar moieties. Bands at 1751–1735, 1248–1235, and 1377–1371 cm−1 have been convincingly assigned to ester groups -CH2-OCOCH3 resulting from the-acetylation of hydroxyl groups of polysaccharides [35,36]. In particular, bands at 1751, 1371, 1235, and 1047 cm−1 were assigned to the acetylation of glucose units in konjac glucomannan [36]. The bands observed at 1751, 1371, and 1236 cm−1 in the FTIR spectrum are thus in line with the acetylation of sugar moieties. A band may also contribute at 1047 cm−1, but probably superimposes with the dominating contributions from the sugar ring modes at 1066–1026 cm−1. The FTIR data corroborate the presence of OAc moieties in the EPS structure, as suggested by NMR and FT-ICR-MS analyses. The FTIR data are also in line with the presence of glucuronic acid, since β-D-glucuronic acid is characterized by intense bands at 1729 cm−1 (νC=O), 1089–1065 cm−1 (δCO + νCC), and 1024 cm−1 (τCO + νCO), which correspond to bands present in the FTIR spectrum of the sample [37]. The ν(C=O) mode of glucuronic acid as well as contributions from succinyl carboxylic groups could contribute to the infrared absorption observed at 1678–1720 cm−1. Infrared signatures from methoxy groups resulting from sugar methylation are expected at 1290–1270 and 1050–1010 cm−1 [38]. These bands are not expected to be intense. They cannot be assigned unambiguously in the FTIR spectrum, since contributions for the sugar moieties are also observed at these frequencies.
The typical band of peptide amide II mode ν(CN) + δ(N-H) was not present, in the spectrum, which indicated the absence of amide groups and peptides in the purified compound.
Although systematic studies have identified characteristic bands of some pentoses or (deoxy)hexoses in polysaccharides [39,40], superposition of contributions of the different sugars in the 1100–1000 cm−1 region makes it impossible to identify them in the sample. Glucose and galactose have specific contributions at 840 cm−1 [39]. Rhamnose disaccharide has an absorption maximum in this region at 1006 cm−1 [41]. Bands at 813–806 cm−1 have been associated with the presence of mannose in polysaccharides [39].
According to the literature, the absence of bands at ≈890 cm−1 and the bands at circa 840 cm−1 indicated the absence of β-glycosidic bonds and supported the presence of α-linked glycosidic units [42]. The strong band at 677 cm−1, however, could indicate the presence of a β(1-2)- bond linkage, as it was selectively observed in a (1-2)-linked-β-D-xylopyranoside in the crystalline (dry) state [43].
Overall, FTIR analysis of the EPS of R. tataouinensis TTB310 corroborated the presence of monosaccharides with O-acetyl and uronic acid type substitutions and suggested mainly the presence of α-glycosidic linkages.
3. Conclusions
In this study, optimization of culture conditions (composition of the medium, pH regulation) for the enrichment of the cyst biomass of R. tataouinensis TTB310 was successfully developed. The EPS, firmly attached to the bacterial surface, was productively extracted using TCA. According to elemental analysis and FTIR, the extracted EPS consists of saccharide units with the possible presence of amino acids. The monosaccharides involved in its structure, according to GC analyses, are ribose, glucose, galactose, and mannose. While glucose and galactose are the most common monomers among bacterial polysaccharides, ribose is rarely described as a component of repeated units of bacterial EPS. The FT-ICR-MS and NMR analyses also confirm the presence of ribose, which is the unique feature of the extracted EPS. Biochemical analysis confirms the EPS of R. tataouinensis TTB310 consisting of ten saccharide units (decasaccharide), which includes rare monosaccharides such as ribose and rhamnose, the amino acid lysine, and acetyl, succinyl, and methyl substitutions. The EPS of R. tataouinensis TTB310 constitutes the outer layer of the cyst. It is therefore responsible for cell defense mechanisms in general and in particular, in the context of the semi-arid conditions in which this bacterial strain was isolated, this EPS allows it to adapt to desiccation. Its structure is unique and completely different from that of other bacterial cysts such as Azotobacter, which is an alginate [44], and also different from the well-known succinoglycan, xanthan, gellan, pullulan, hyaluronan, and cellulose produced by soil bacterial species [45]. Some details remain to be confirmed with 1D 13C NMR, NOESY, and HMBC NMR spectra that would identify the sequence and assembly of the identified units in the spectrum. The purified polymer was insoluble in water or saline even after multiple treatments. However, it can be easily solubilized in DMSO. This insolubility in water is probably due to the presence of acetyl groups in the EPS structure. The obtained results encourage further studies on the deacetylation of the EPS of R. tataouinensis TTB310 which would possibly initiate structural changes allowing for its solubilization, thereby enhancing its rheological properties for industrial applications.
4. Materials and Methods
4.1. Bacterial Strain and Culture Conditions
Ramlibacter tataouinensis TTB310T (=DSM 14655T =ATCC BAA-407T =LMG 21543T), a β-proteobacterium isolated from weathered particles of “Tataouine meteorite” embedded by sand particles was used in this study [8]. This strain was grown on Tryptic Soy Agar (TSA 1/10) medium (10 times diluted Bacto™ Tryptic Soy Broth, agar, 15 g/L) at 30 °C with optimal pH about 7.5. The strain TTB310 was maintained in TSA 1/10 plates at 4 °C and used for further EPS production.
4.2. Optimization of Cyst Formation by R. tataouinensis TTB310
The cyst formation was optimized by batch and fed-batch conditions. Initially, carbon sources were tested under batch conditions (500 mL Erlenmeyer flasks containing 100 mL of culture medium) using TSB 1/10 medium in the presence of acetate, succinate, β-hydroxybutyrate, and lactate (10, 20, 40 mM) as a sole carbon source, and the cultures were incubated at 30 °C for 3 days under 150 rpm agitation. The bacterial growth was estimated by counting the colony-forming units (cfu/mL), and colony morphology was also studied. Further optimization was performed in 30 L-bioreactor containing 9 L of culture medium in fed-batch condition. In order to control the pH increase and to limit the osmotic stress, lactic acid (10%) was used with a set point value of pH 7.4. The optimized medium was composed of TSB 1/10 + lactate (10 mM), tryptone (3.0 g/L), yeast extract (1.3 g/L), K2HPO4 (0.25 g/L), and NaCl (0.5 g/L). After 4 days of cultivation at 30 °C, the medium was further supplemented with 1.0 g/L of tryptone and 0.3 g/L of yeast extract. The sterile air supply set point was 0.2 vvm, and an agitation rate of about 1.98 m/s was maintained during the overall period of fermentation.
4.3. Production, Extraction and Purification of EPS from Cysts
The initial seed culture (inoculums) was prepared by inoculating 5 mL of sterile TSB 1/10 using a single colony of R. tataouinensis TTB310, and it was grown for 3 days under shaking with a speed of 150 rpm at 30 °C. About 1% (v/v) of inoculum was seeded into a 2 L Erlenmeyer shake flask containing 500 mL of sterile EPS production medium, which is comprised of TSB 1/10, lactate (10 mM), tryptone (3.0 g/L), yeast extract (1.3 g/L), K2HPO4 (0.25 g/L), and NaCl (0.5 g/L). The pH of the medium was fixed to 7 ± 0.2 and the strain TTB310 was cultured under growth conditions at about 30 °C and at a shaking speed of 150 rpm for 4 days. About 1 mL of fermented culture was intermittently collected to check the cyst formation and EPS synthesis during the fermentation process.
After 4 days of cultivation, the spent culture was centrifuged at 6000× g for 15 min at room temperature and the resulting bacterial pellet was liquefied in 25 mL of modified phosphate-buffered saline (PBS: KCl 5.0 g/L, Na2HPO4 1.44 g/L, KH2PO4 0.24 g/L) supplemented with 4% trichloroacetic acid (TCA). The mixture was kept under magnetic stirring for 12 h at room temperature. The solution was then centrifuged at 6000× g for 15 min at room temperature. The supernatant was collected and filtered using a 0.45 µm Sartorius Minisart high flow syringe filter. The filtrate was neutralized (pH 7.0) with 1 M KOH, and 10 volume of pre-chilled absolute ethanol was added into neutralized filtrate, and this mixture was incubated at 4 °C for 12 h. A white polymer precipitate was then observed, and the whole blend was centrifuged at 6000× g for 20 min at 4 °C. To know the efficiency of this modified extraction, cells were also stained by calcofluor white and observed under optical microscopy. The EPS polymer was then washed with different concentrations of ethanol (70%, 80%, 90%, and 100%) and the polymer was further purified by overnight dialysis using MWCO 1 kDa Spectra/Por 7 dialysis section. Dialyzed EPS (0.1%) samples were prepared with 0.1 M NaCl and ultrapure water, and the pH was adjusted to 7.0 or 10.7. All the samples were shaken at 40 °C, and the temperature was raised to 60 °C after 30 min or 24 h. Further, the EPS samples were subjected to several sonications at 40 °C to 90 °C for 30 s and 15 min. The concentration of EPS was made about 0.1% in dimethyl sulfoxide (DMSO) and stirred and subsequently heated at 60 °C in order to solubilize the EPS. The final concentration was adjusted to 4%.
4.4. Chemical and Structural Characterizations of the EPS
4.4.1. Chemical Analysis
Elemental analysis for the determination of C, H, N, and O in the extracted EPS was performed according to the modified protocol with an organic element analyzer (Thermo Scientific FLASH ™ 2000 CHNS/O, Thermo Fisher Scientific, Massachusetts, USA). The determination of the amount of C, H, and N was carried out by total pyrolysis of the analytical sample at 1800 °C in the presence of oxygen. The oxygen content was detected by total pyrolysis of the EPS sample at 1080 °C under a stream of nitrogen. The total chlorine was quantified by using high-pressure ion chromatography (HPIC, Waters). Total monosaccharide content was assayed by phenol-sulfuric acid methods with glucose as standard [46]. Uronic acids were quantified using the colorimetric method of meta-hydroxydiphenyl [47]. RNA detection was performed using the Nanovue spectrophotometer (GE Healthcare) and also verified with the “Quant-it™ RiboGreen®” kit (Invitrogen, Waltham/ Massachusetts, USA).
4.4.2. Fourier-Transform Infrared Spectroscopy (FTIR)
FTIR Spectroscopy (IFS 66 SX, Bruker Corporation, Ettlingen, Germany) was used to analyze the main functional groups in the purified, freeze-dried EPS of R. tataouinensis TTB310. FTIR spectra were recorded in the in 4000–400 cm−1 region with a resolution of 4 cm−1 using a SensIR technologies ATR device equipped with a 9-bounce diamond microprism and ZnSe optics.
4.4.3. High-Performance Liquid Chromatography (HPLC) Analysis
Neutral lipid moieties that are associated with the EPS were detected and fractionated by HPLC system (UltiMate 3000 RS, Dionex, France) coupled with a Sedex 85 evaporative light scattering detector (Sedere S.A., Alfortville, France) with eluent A (chloroform) and eluent B (CH3OH/CHCl3/NH4OH). The lipid classes were detected and quantified by an evaporation light scattering detector (ELSD, SEDEX Model 85 LT-ELSDTM, Sedere, Alfortville, France). Comparing their retention time with those of pure standards was performed in order to identify the lipid classes.
4.4.4. Gas Chromatography (GC) Analysis of EPS
Gas chromatography analysis was performed after methanolysis. The EPS sample (3.2 mg) and 50 μg of myo-inositol (internal reference) were added into 500 μL of a mixture of methanol/hydrochloric acid and incubated in a dry bath for 4 h at 110 °C. After cooling to room temperature, the methanolysate was neutralized with silver carbonate, and the samples were centrifuged at 3000 rpm for 15 min at 4 °C. The supernatant was evaporated under nitrogen gas. The compounds were then dissolved in 100 μL of pyridine and incubated overnight at room temperature with 100 μL Cylon (BSTFA: TMCS. 99:1. Supelco). After gentle evaporation of the excess of reagents under nitrogen gas, the trimethyl-silylated methyl glycosides were taken up in 700 μL dichloromethane, then injected into gas chromatography (GC-6850 AGILENT System, in-column injection, FID detector: flame ionization) with hydrogen as carrier gas. The temperature profile was as follows: 120 °C maintained for 1 min, then a gradient of 1.5 °C/min up to 180 °C, followed by a gradient of 2 °C/min up to 200 °C. Each monosaccharide was identified by comparison with the retention times of the internal standards treated under the same conditions. A response coefficient was calculated for each monosaccharide relative to the internal standard to define their proportion within the polysaccharide.
4.4.5. Fourier Transform Ion Cyclotron Resonance Mass Spectrometry (FT-ICR-MS)
Sample duplicates were dissolved in 2 mL H2SO4 5% (Merck, Germany) and sonicated for 3 min at room temperature. Then the samples were passed through SPE-C18 cartridges for FT-ICR-MS measurements. Negative electrospray (-)ESI FT-ICR MS were acquired using a mass spectrometer (Bruker Solarix 12T model, Bruker Daltonics, Bremen, Germany). The samples diluted in methanol were injected into the electrospray source using a pump with a flow rate of 120 μL/h, a nebulizer gas pressure of 138 kPa and a drying gas pressure of 103 kPa. Heating at 200 °C was maintained to ensure rapid desolvation of the ionized droplets. Each acquisition was taken in the time domain of 4 MW, with 500 scans being accumulated for a single mass spectrum. All spectra were internally calibrated using an appropriate reference mass list in order to obtain a mass accuracy of less than 0.2 ppm. Data processing was conducted using Compass Data Analysis 4.1 (Bruker, Bremen, Germany) and formula assignments were processed by in-house software. The generated formulae were validated by setting sensible chemical constraints [O/C ratio ≤ 1, H/C ratio ≤ 2n + 2 (CnH2n+2)], element counts (C ≤ 100, H ≤ 200, O ≤ 80, N = 0, S = 0) and mass accuracy windows (set at 500 ppb). Final formulae were generated and categorized into CHO-containing molecular compositions which were used for the evaluation.
4.4.6. Nuclear Magnetic Resonance (NMR)
The EPS sample was subjected to liquid-state NMR spectroscopy. About 4 mg of dry sample was diluted in 750 μL of D2O (99.95%) under ultrasonic bath with external heating about ~ 45 °C. After centrifugation, the supernatant was subjected to 800 MHz 1H NMR spectroscopy at 310 K. Homo-nuclear J-resolved spectroscopy (JRES), hetero-nuclear single-quantum correlation (HSQC), correlation spectroscopy (COSY), and total correlated spectroscopy (TOCSY) were acquired for the detailed analysis of the structure of the EPS.
A Bruker Avance III spectrometer and TopSpin 3.5/PL7 software were used to acquire nuclear magnetic resonance (NMR) spectra of aqueous extracts of a white, semitransparent, and potentially hygroscopic (by appearance) pellet of polymer. About 4 mg of white, semitransparent, and potentially hygroscopic (by appearance) pellet were subjected with 750 µL D2O (99.95%, Aldrich) to ultrasonic bath, with external warming to ~45 °C. After 5 h of treatment, the sample was centrifuged, and the supernatant was put into a 3.0 mm MATCH tube and sealed.
A cryogenic inverse geometry 5 mm z-gradient 1H/13C/15N/31P QCI probe (B0 = 18.8 T) was used for 1D 1H NMR and proton-detected 2D NMR spectra. Transmitter pulses were at ~10 µs for 1H and 13C. The one-bond coupling constant 1J(CH) used in 2D 1H,13C DEPT-HSQC spectra (hsqcedetgpsisp2.2) was set to 145 Hz. Other conditions: 13C 90 deg decoupling pulse, GARP (70 µs), 50 kHz WURST 180-degree 13C inversion pulse (Wideband, Uniform, Rate, and Smooth Truncation, 1.2 ms), F2 (1H): spectral width of 11160.7 Hz (13.95 ppm), 1.25 s relaxation delay, F1 (13C): SW = 36052 Hz (180 ppm). HSQC-derived NMR spectra were computed to an 8192 × 1024 matrix. Gradient (1 ms length, 450 µs recovery) and sensitivity enhanced sequences were used for all 2D NMR spectra. The absolute value COSY and phase-sensitive echo-antiecho TOCSY spectra (cosygpmfppqf, dipsi2etgpsi) used a spectral width of 9615.4 Hz and were computed to a 16384 × 2048 matrix; other NMR acquisition conditions are given in Table S1.
Supplementary Materials
The following supporting information can be downloaded at: https://www.mdpi.com/article/10.3390/molecules27217172/s1. Figure S1. Cellular morphology of R. tataouinensis. Figure S2. Estimation of the growth of R. tataouinensis TTB310 in presence of lactate. Figure S3. Optimization of R. tataouinensis TTB310 cysts formation by fed-batch fermentation in bioreactor. Figure S4. Growth of R. tataouinensis TTB310 in TSB 1/10 medium supplemented with lactate under fed-batch fermentation. Figure S5. Example of interpretation of m/z and mass loss between m/z for a ‘pen-tose-pentose-hexose’ oligosaccharide. Figure S6. 1H, 1H TOCSY NMR spectrum (800 MHz, D2O, 310 K, mixing time = 70 ms) of R. tataouinensis TTB310 EPS. Figure S7. (A) 1H, 1H COSY NMR spectrum (800 MHz, D2O, 310 K, mixing time = 70 ms), (B) 1H, 1H TOCSY NMR spectrum, and (C) CH2-selective 1H, 13C DEPT HSQC NMR spectrum of the EPS of R. tataouinensis TTB310. Figure S8. (A) 1H, 1H COSY NMR spectrum (800 MHz, D2O, 310 K, mixing time = 70 ms), (B) 1H, 1H TOCSY NMR spectrum, and (C) CH2-selective 1H, 13C DEPT HSQC NMR spectrum of the EPS of R. tataouinensis TTB310. Figure S9. (A) 1H, 1H TOCSY NMR spectrum, and (B) CH2-selective 1H, 13C DEPT HSQC NMR spectrum of the EPS of R. tataouinensis TTB310: section of anomeric units O2CH within carbohydrates. Table S1. Acquisition parameters of NMR spectra, shown according to figures. Table S2. Ions characteristic of monosaccharides. Table S3. Loss of mass corresponding to fragmentations of monosaccharides. Table S4. Use of an m/z distance matrix to search for characteristic mass losses of mono- and oligosaccharides. Table S5. Attribution of potential structures corresponding to m/z and loss of mass between signals. Table S6. Summary of potential structures and number of fragments indicative of these structures. Table S7. 1H and 13C NMR chemical shifts δH/C of major 1H, 13C HSQC cross peaks of the EPS of R. tataouinensis TTB310.
Author Contributions
T.H., D.J., C.S. and W.A. conceived and designed the experiments. D.J., M.H., N.H., G.S. (Ghislain Sanhaji), S.F., C.B., A.H., C.S. and T.H. carried out the experiments and analyzed the data. All of the authors assisted in writing the manuscript, discussed the results, and commented on the manuscript. All authors have read and agreed to the published version of the manuscript.
Funding
D.J. has research fellowship from the ANRT (National Agency of Research and Technology) (CIFRE N° 2013/1063) and the ARD company.
Institutional Review Board Statement
Not applicable.
Informed Consent Statement
Written informed consent has been obtained from the patient(s) to publish this paper.
Data Availability Statement
Not applicable.
Conflicts of Interest
The authors declare no conflict of interest.
Sample Availability
Samples of TTB310 EPS are available from the authors.
References
- Rehm, B.H.A. Bacterial polymers: Biosynthesis, modifications and applications. Nat. Rev. Microbiol. 2010, 8, 578–592. [Google Scholar] [CrossRef]
- Suresh Kumar, A.; Mody, K.; Jha, B. Bacterial exopolysaccharides–a perception. J. Basic Microbiol. 2007, 47, 103–117. [Google Scholar] [CrossRef] [PubMed]
- Nwodo, U.; Green, E.; Okoh, A. Bacterial Exopolysaccharides: Functionality and Prospects. Int. J. Mol. Sci. 2012, 13, 14002–14015. [Google Scholar] [CrossRef]
- Freitas, F.; Alves, V.D.; Reis, M.A.M. Advances in bacterial exopolysaccharides: From production to biotechnological applications. Trends Biotechnol. 2011, 29, 388–398. [Google Scholar] [CrossRef] [PubMed]
- Moscovici, M. Present and future medical applications of microbial exopolysaccharides. Front. Microbiol. 2015, 6, 1012. [Google Scholar] [CrossRef] [PubMed]
- Donot, F.; Fontana, A.; Baccou, J.C.; Schorr-Galindo, S. Microbial exopolysaccharides: Main examples of synthesis, excretion, genetics and extraction. Carbohydr. Polym. 2012, 87, 951–962. [Google Scholar] [CrossRef]
- Nicolaus, B.; Kambourova, M.; Oner, E.T. Exopolysaccharides from extremophiles: From fundamentals to biotechnology. Environ. Technol. 2010, 31, 1145–1158. [Google Scholar] [CrossRef] [PubMed]
- Heulin, T.; Barakat, M.; Christen, R.; Lesourd, M.; Sutra, L.; De Luca, G.; Achouak, W. Ramlibacter tataouinensis gen. nov., sp. nov., and Ramlibacter henchirensis sp. nov., cyst-producing bacteria isolated from subdesert soil in Tunisia. Int. J. Syst. Evol. Microbiol. 2003, 53, 589–594. [Google Scholar] [CrossRef]
- Benzerara, K.; Barakat, M.; Menguy, N.; Guyot, F.; De Luca, G.; Audrain, C.; Heulin, T. Experimental colonization and alteration of orthopyroxene by the pleomorphic bacteria Ramlibacter tataouinensis. Geomicrobiol. J. 2004, 21, 341–349. [Google Scholar] [CrossRef]
- Gommeaux, M.; Barakat, M.; Lesourd, M.; Thiéry, J.; Heulin, T. A morphological transition in the pleomorphic bacterium Ramlibacter tataouinensis TTB310. Res. Microbiol. 2005, 156, 1026–1030. [Google Scholar] [CrossRef] [PubMed]
- De Luca, G.; Barakat, M.; Ortet, P.; Fochesato, S.; Jourlin-Castelli, C.; Ansaldi, M.; Py, B.; Fichant, G.; Coutinho, P.M.; Voulhoux, R.; et al. The cyst-dividing bacterium Ramlibacter tataouinensis TTB310 genome reveals a well-stocked toolbox for adaptation to a desert environment. PLoS ONE 2011, 6, e23784. [Google Scholar] [CrossRef] [PubMed]
- Chawla, P.R.; Bajaj, I.B.; Survase, S.A.; Singhal, R.S. Microbial cellulose: Fermentative production and applications. Food Technol. Biotechnol. 2009, 47, 107–124. [Google Scholar]
- Davidson, I.W. Production of polysaccharide by Xanthomonas campestris in continuous culture. FEMS Microbiol. Lett. 1978, 3, 347–349. [Google Scholar] [CrossRef]
- Marczak, M.; Mazur, A.; Koper, P.; Żebracki, K.; Skorupska, A. Synthesis of rhizobial exopolysaccharides and their importance for symbiosis with legume plants. Genes 2017, 8, 360. [Google Scholar] [CrossRef] [PubMed]
- Ozturk, S.; Aslim, B. Modification of exopolysaccharide composition and production by three cyanobacterial isolates under salt stress. Environ. Sci. Pollut. Res. 2010, 17, 595–602. [Google Scholar] [CrossRef]
- Górska-Frączek, S.; Sandström, C.; Kenne, L.; Rybka, J.; Strus, M.; Heczko, P.; Gamian, A. Structural studies of the exopolysaccharide consisting of a nonasaccharide repeating unit isolated from Lactobacillus rhamnosus KL37B. Carbohydr. Res. 2011, 346, 2926–2932. [Google Scholar] [CrossRef] [PubMed]
- Roca, C.; Alves, V.D.; Freitas, F.; Reis, M.A.M. Exopolysaccharides enriched in rare sugars: Bacterial sources, production, and applications. Front. Microbiol. 2015, 6, 288. [Google Scholar] [CrossRef]
- Fraysse, N.; Lindner, B.; Kacynski, Z.; Sharypova, L.; Holst, O.; Niehaus, K.; Poinsot, V. Sinorhizobium meliloti strain 1021 produces a low-molecular-mass capsular polysaccharide that is a homopolymer of 3-deoxy-D-manno-oct-2-ulosonic acid harboring a phospholipid anchor. Glycobiology 2004, 15, 101–108. [Google Scholar] [CrossRef]
- Garozzo, D.; Giuffrida, M.; Impallomeni, G.; Ballistreri, A.; Montaudo, G. Determination of linkage position and identification of the reducing end in linear oligosaccharides by negative-ion fast atom bombardment mass-spectrometry. Anal. Chem. 1990, 62, 279–286. [Google Scholar] [CrossRef]
- Lundqvist, L. Structural and Interaction Studies of Polysaccharides by NMR Spectroscopy; Diss. (sammanfattning/summary); Sveriges lantbruksuniv; Acta Universitatis Agriculturae Sueciae: Uppsala, Sweden, 2015. [Google Scholar]
- Glushka, J.N.; Terrell, M.; York, W.S.; O’Neill, M.A.; Gucwa, A.; Darvill, A.G.; Albersheim, P.; Prestegard, J.H. Primary structure of the 2-O-methyl-α-l-fucose-containing side chain of the pectic polysaccharide, rhamnogalacturonan II. Carbohydr. Res. 2003, 338, 341–352. [Google Scholar] [CrossRef]
- Ravenscroft, N.; Cescutti, P.; Gavini, M.; Stefanetti, G.; MacLennan, C.A.; Martin, L.B.; Micoli, F. Structural analysis of the O-acetylated O-polysaccharide isolated from Salmonella paratyphi A and used for vaccine preparation. Carbohydr. Res. 2015, 404, 108–116. [Google Scholar] [CrossRef] [PubMed]
- van den Bulk, R.W.; Zevenhuizen, L.P.T.M.; Cordewener, J.H.G.; Dons, J.J.M. Characterization of the extracellular polysaccharide produced by Clavibacter michiganensis supsp. michiganensis. Phytopathology 1991, 81, 619–623. [Google Scholar] [CrossRef]
- Lahaye, M.; Ray, B. Cell-wall polysaccharides from the marine green alga Ulva “rigida” (Ulvales, Chlorophyta)-NMR analysis of ulvan oligosaccharides. Carbohydr. Res. 1996, 283, 161–173. [Google Scholar] [CrossRef]
- Haverkamp, J.; Van Halbeek, H.; Dorland, L.; Vliegenthart, J.F.G.; Pfeil, R.; Schauer, R. High-resolution 1H-NMR spectroscopy of free and glycosidically linked O-acetylated sialic acids. Eur. J. Biochem. 1982, 122, 305–311. [Google Scholar] [CrossRef]
- Orgambide, G.G.; Philip-Hollingsworth, S.; Dazzo, F.B.; Tola, E.; Squartini, A.; Nuti, M.P.; Cedergren, R.A.; Hollingsworth, R.I. Glycoconjugate and lipid components of Rhizobium “hedysari” IS123, a root-nodule symbiont of the stress-tolerant legume Hedysarum coronarium. Can. J. Microbiol. 1996, 42, 340–345. [Google Scholar] [CrossRef][Green Version]
- He, Y.; Ye, M.; Du, Z.; Wang, H.; Wu, Y.; Yang, L. Purification, characterization and promoting effect on wound healing of an exopolysaccharide from Lachnum YM405. Carbohydr. Polym. 2014, 105, 169–176. [Google Scholar] [CrossRef]
- Ogawa, K.; Yamaura, M.; Maruyama, I. Isolation and identification of 2-O-methyl-l-rhamnose and 3-O-methyl-l-rhamnose as constituents of an acidic polysaccharide of Chlorella vulgaris. Biosci. Biotechnol. Biochem. 1997, 61, 539–540. [Google Scholar] [CrossRef]
- Gromska, W.; Mayer, H. The linkage of lysine in the O-specific chains of Proteus mirabilis 1959. Eur. J. Biochem. 1976, 62, 391–399. [Google Scholar] [CrossRef]
- Shashkov, A.S.; Toukach, F.V.; Paramonov, N.A.; Ziolkowski, A.; Senchenkova, S.N.; Kaca, W.; Knirel, Y.A. Structures of new acidic O-specific polysaccharides of the bacterium Proteus mirabilis serogroups O26 and O30. FEBS Lett. 1996, 386, 247–251. [Google Scholar] [CrossRef]
- Neszmélyi, A.; Kosma, P.; Christian, R.; Schulz, G.; Unger, F.M. Empirical 13C-n.m.r.-correlations between the Escherichia coli K13 and LP1092 capsular polysaccharides and model oligosaccharides containing D-ribose and 3-deoxy-D-manno-2-octulosonic acid. Carbohydr. Res. 1985, 139, 13–22. [Google Scholar] [CrossRef]
- Sathiyanarayanan, G.; Bhatia, S.K.; Kim, H.J.; Kim, J.H.; Jeon, J.M.; Kim, Y.G.; Park, S.H.; Lee, S.H.; Lee, Y.K.; Yang, Y.H. Metal removal and reduction potential of an exopolysaccharide produced by Arctic psychrotrophic bacterium Pseudomonas sp. PAMC 28620. RSC Adv. 2016, 6, 96870–96881. [Google Scholar] [CrossRef]
- Sathiyanarayanan, G.; Yi, D.H.; Bhatia, S.K.; Kim, J.H.; Seo, H.M.; Kim, Y.G.; Park, S.H.; Jeong, D.; Jung, S.; Jung, J.Y.; et al. Exopolysaccharide from psychrotrophic Arctic glacier soil bacterium Flavobacterium sp. ASB 3-3 and its potential applications. RSC Adv. 2015, 5, 84492–84502. [Google Scholar] [CrossRef]
- Cestelli Guidi, M.; Mirri, C.; Fratini, E.; Licursi, V.; Negri, R.; Marcelli, A.; Amendola, R. In vivo skin leptin modulation after 14 MeV neutron irradiation: A molecular and FT-IR spectroscopic study. Anal. Bioanal. Chem. 2012, 404, 1317–1326. [Google Scholar] [CrossRef] [PubMed]
- Kazy, S.K.; Sar, P.; Singh, S.P.; Sen, A.K.; D’Souza, S.F. Extracellular polysaccharides of a copper-sensitive and a copper-resistant Pseudomonas aeruginosa strain: Synthesis, chemical nature and copper binding. World J. Microbiol. Biotechnol. 2002, 18, 583–588. [Google Scholar] [CrossRef]
- Xiaoyan, L.; Qiang, W.; Xuegang, L.; Feng, L.; Xiaoqing, L.; Pan, H. Effect of degree of acetylation on thermoplastic and melt rheological properties of acetylated konjac glucomannan. Carbohydr. Polym. 2010, 82, 167–172. [Google Scholar] [CrossRef]
- Kovacs, A.; Nyerges, B.; Izvekov, V. Vibrational analysis of N-acetyl-α-D-glucosamine and β-D-glucuronic acid. J. Phys. Chem. B 2008, 112, 5728–5735. [Google Scholar] [CrossRef]
- Burie, J.R.; Boullais, C.; Nonella, M.; Mioskowski, C.; Nabedryk, E.; Breton, J. Importance of the conformation of methoxy groups on the vibrational and electrochemical properties of ubiquinones. J. Phys. Chem. B 1997, 101, 6607–6617. [Google Scholar] [CrossRef]
- Liu, X.; Renard, C.M.G.C.; Bureau, S.; Le Bourvellec, C. Revisiting the contribution of ATR-FTIR spectroscopy to characterize plant cell wall polysaccharides. Carbohydr. Polym. 2021, 262, 117935. [Google Scholar] [CrossRef] [PubMed]
- Copikova, J.; Barros, A.S.; Smidova, I.; Cerna, M.; Texeira, D.H.; Delgadillo, I.; Synytsya, A.; Coimbra, M.A. Influence of hydration of food additive polysaccharides on FT-IR spectra distinction. Carbohydr. Polym. 2006, 63, 355–359. [Google Scholar] [CrossRef]
- Tarek, A.A.; Dalia, M.; Ali, M.I. Isolation and identification of novel disaccharide of κ-L-rhamnose from Penicillium chrysogenum. World Appl.Sci. J. 2008, 3, 476–486. [Google Scholar]
- Barker, S.A.; Bourne, E.J.; Stacey, M.; Whiffen, D.H. Infra-red spectra of carbohydrates. Part I. Some derivatives of D-glucopyranose. J. Chem. Soc. 1954, 171–176. [Google Scholar] [CrossRef]
- Kacurakova, M.; Belton, P.S.; Wilson, R.H.; Hirsch, J.; Ebringerova, A. Hydration properties of xylan-type structures: An FTIR study of xylooligosaccharides. J. Sci. Food Agric. 1998, 77, 38–44. [Google Scholar] [CrossRef]
- Hay, I.D.; Ur Rehman, Z.; Moradali, M.F.; Wang, Y.; Rehm, B.H. Microbial alginate production, modification and its applications. Microb. Biotechnol. 2013, 6, 637–650. [Google Scholar] [CrossRef] [PubMed]
- Jeong, J.P.; Kim, Y.; Hu, Y.; Jung, S. Bacterial succinoglycans: Structure, physical properties, and applications. Polymers 2022, 14, 276. [Google Scholar] [CrossRef]
- Dubois, M.; Gilles, K.A.; Hamilton, J.K.; Rebers, P.A.; Smith, F. Colorimetric method for determination of sugars and related substances. Anal. Chem. 1956, 28, 350–356. [Google Scholar] [CrossRef]
- Blumenkrantz, N.; Asboe-Hansen, G. New method for quantitative determination of uronic acids. Anal. Biochem. 1973, 54, 484–489. [Google Scholar] [CrossRef]


Publisher’s Note: MDPI stays neutral with regard to jurisdictional claims in published maps and institutional affiliations. |
© 2022 by the authors. Licensee MDPI, Basel, Switzerland. This article is an open access article distributed under the terms and conditions of the Creative Commons Attribution (CC BY) license (https://creativecommons.org/licenses/by/4.0/).