

Development, Validation, and Use of 1H-NMR Spectroscopy for Evaluating the Quality of Acerola-Based Food Supplements and Quantifying Ascorbic Acid
 , ,
, ,  and
and 
Abstract
:
1. Introduction
2. Results and Discussion
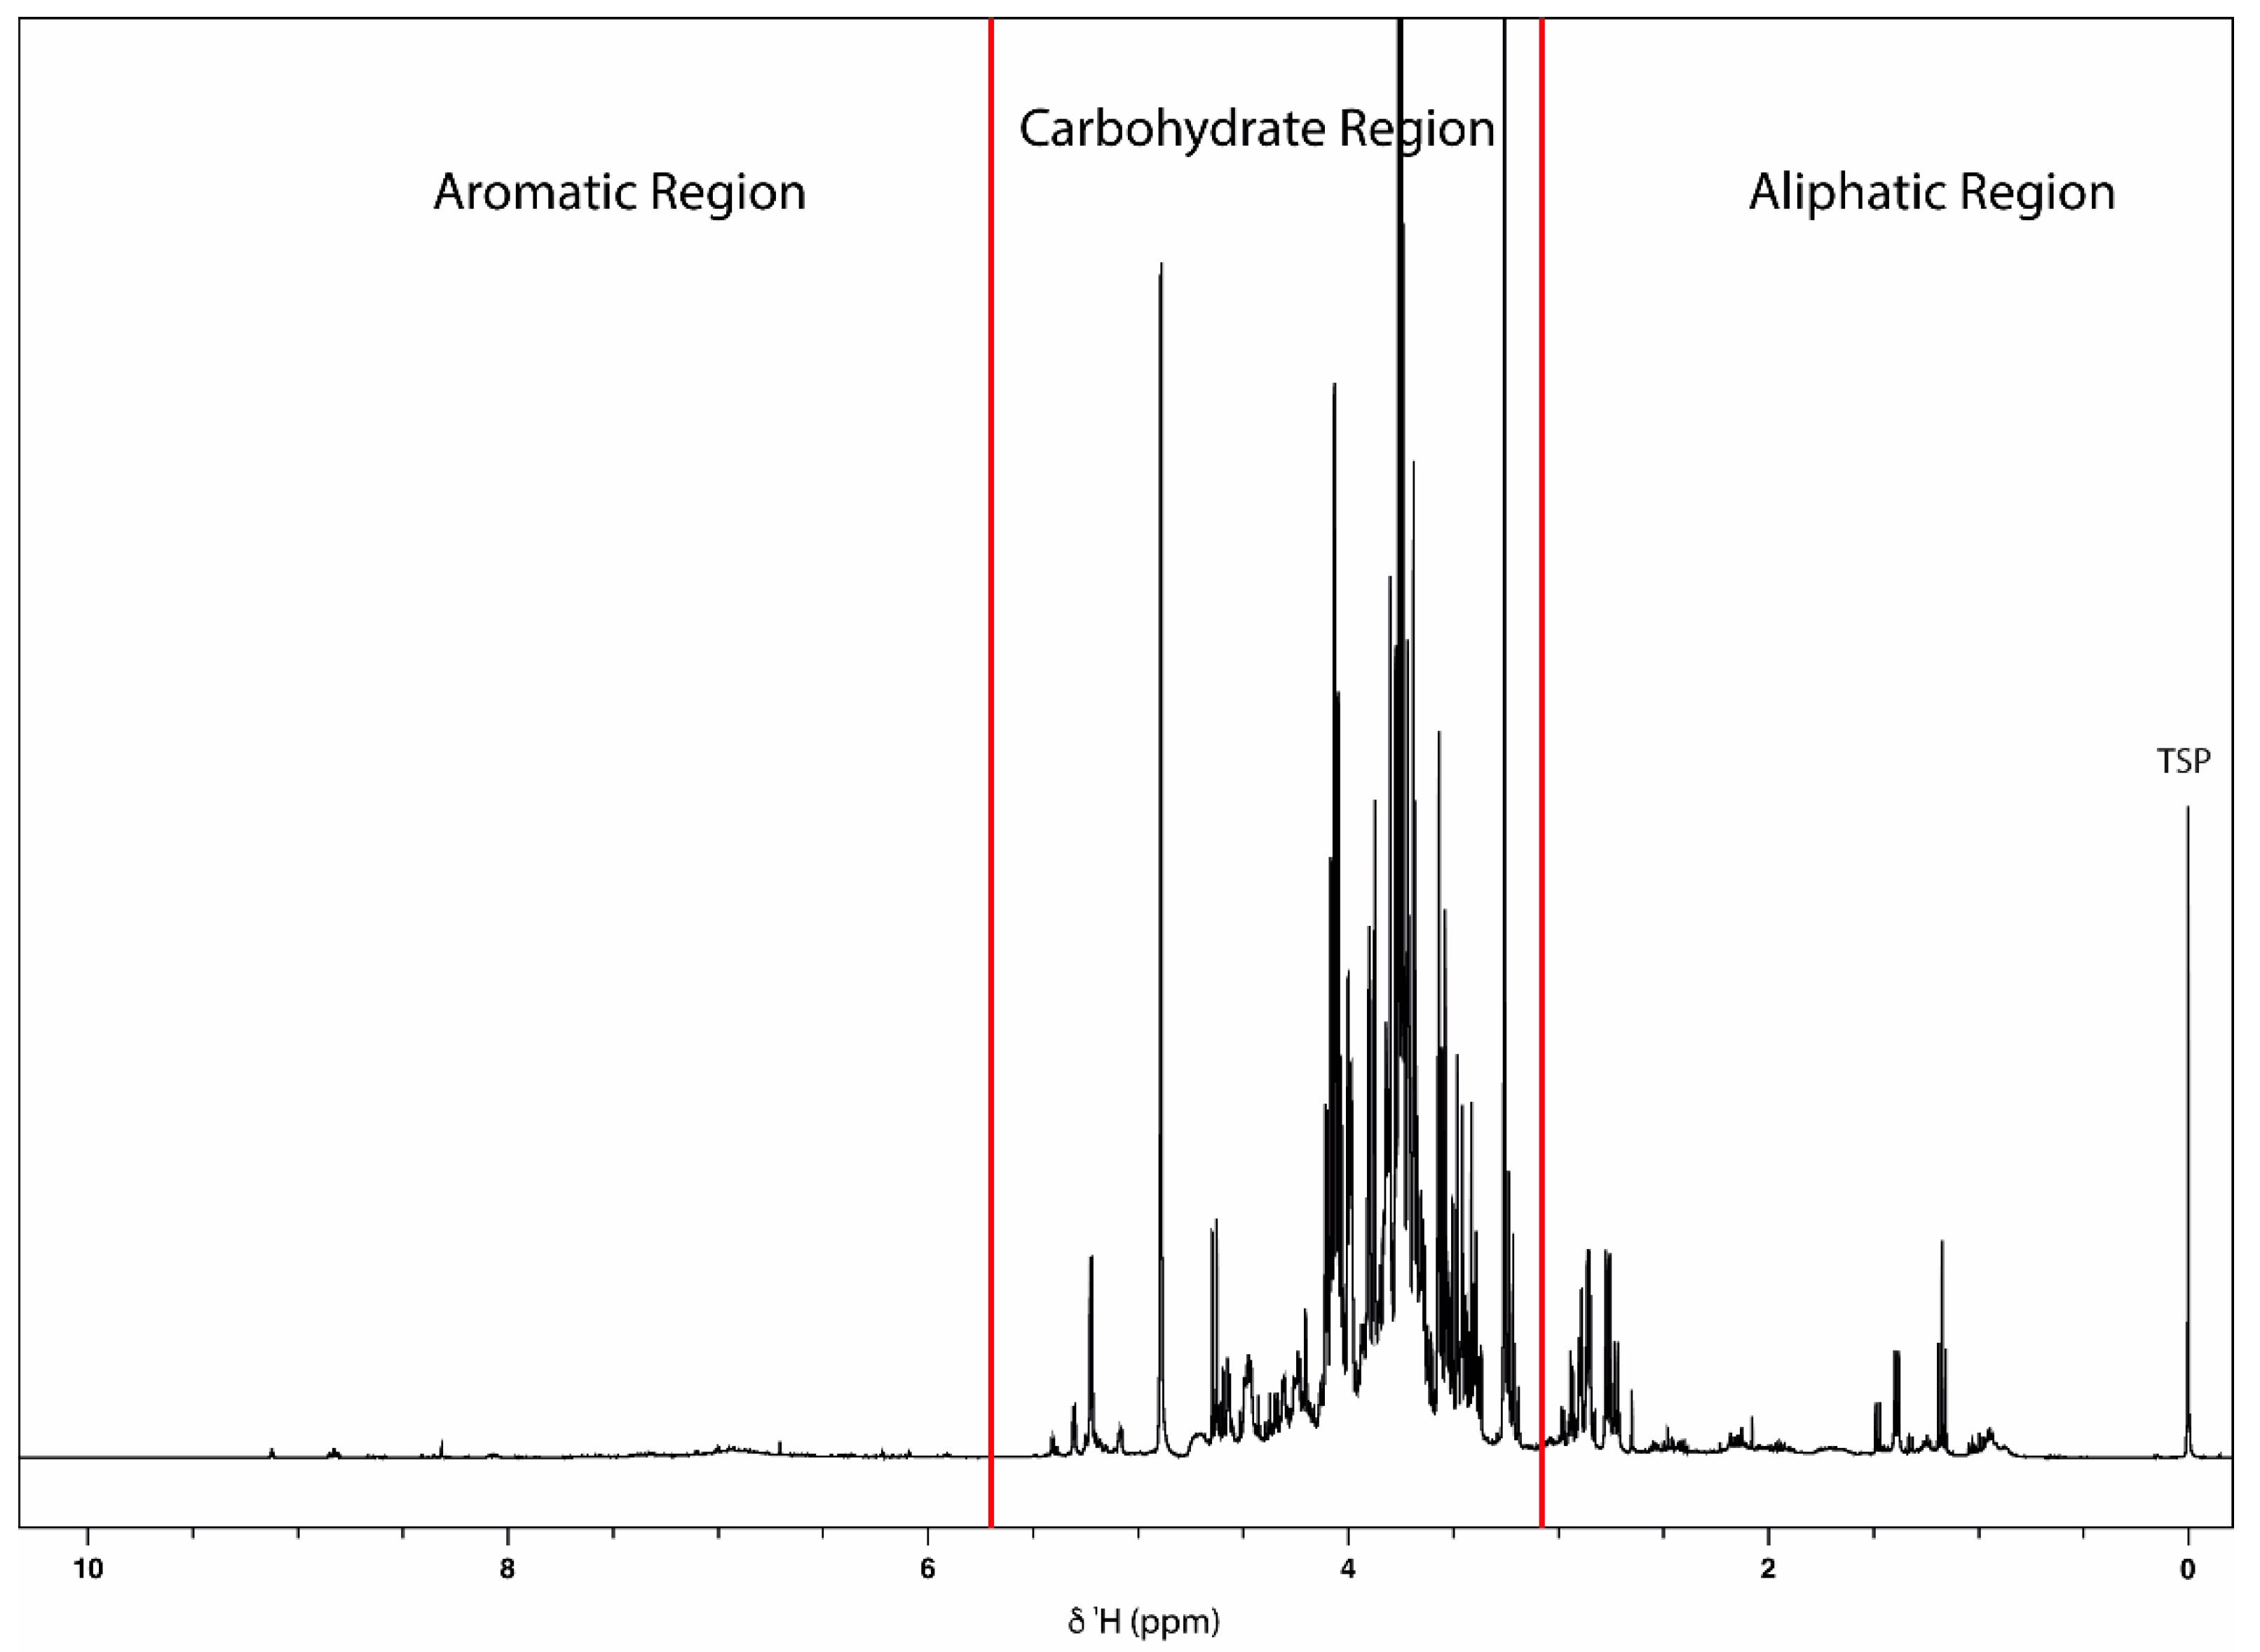
2.1. Qualitative Analysis
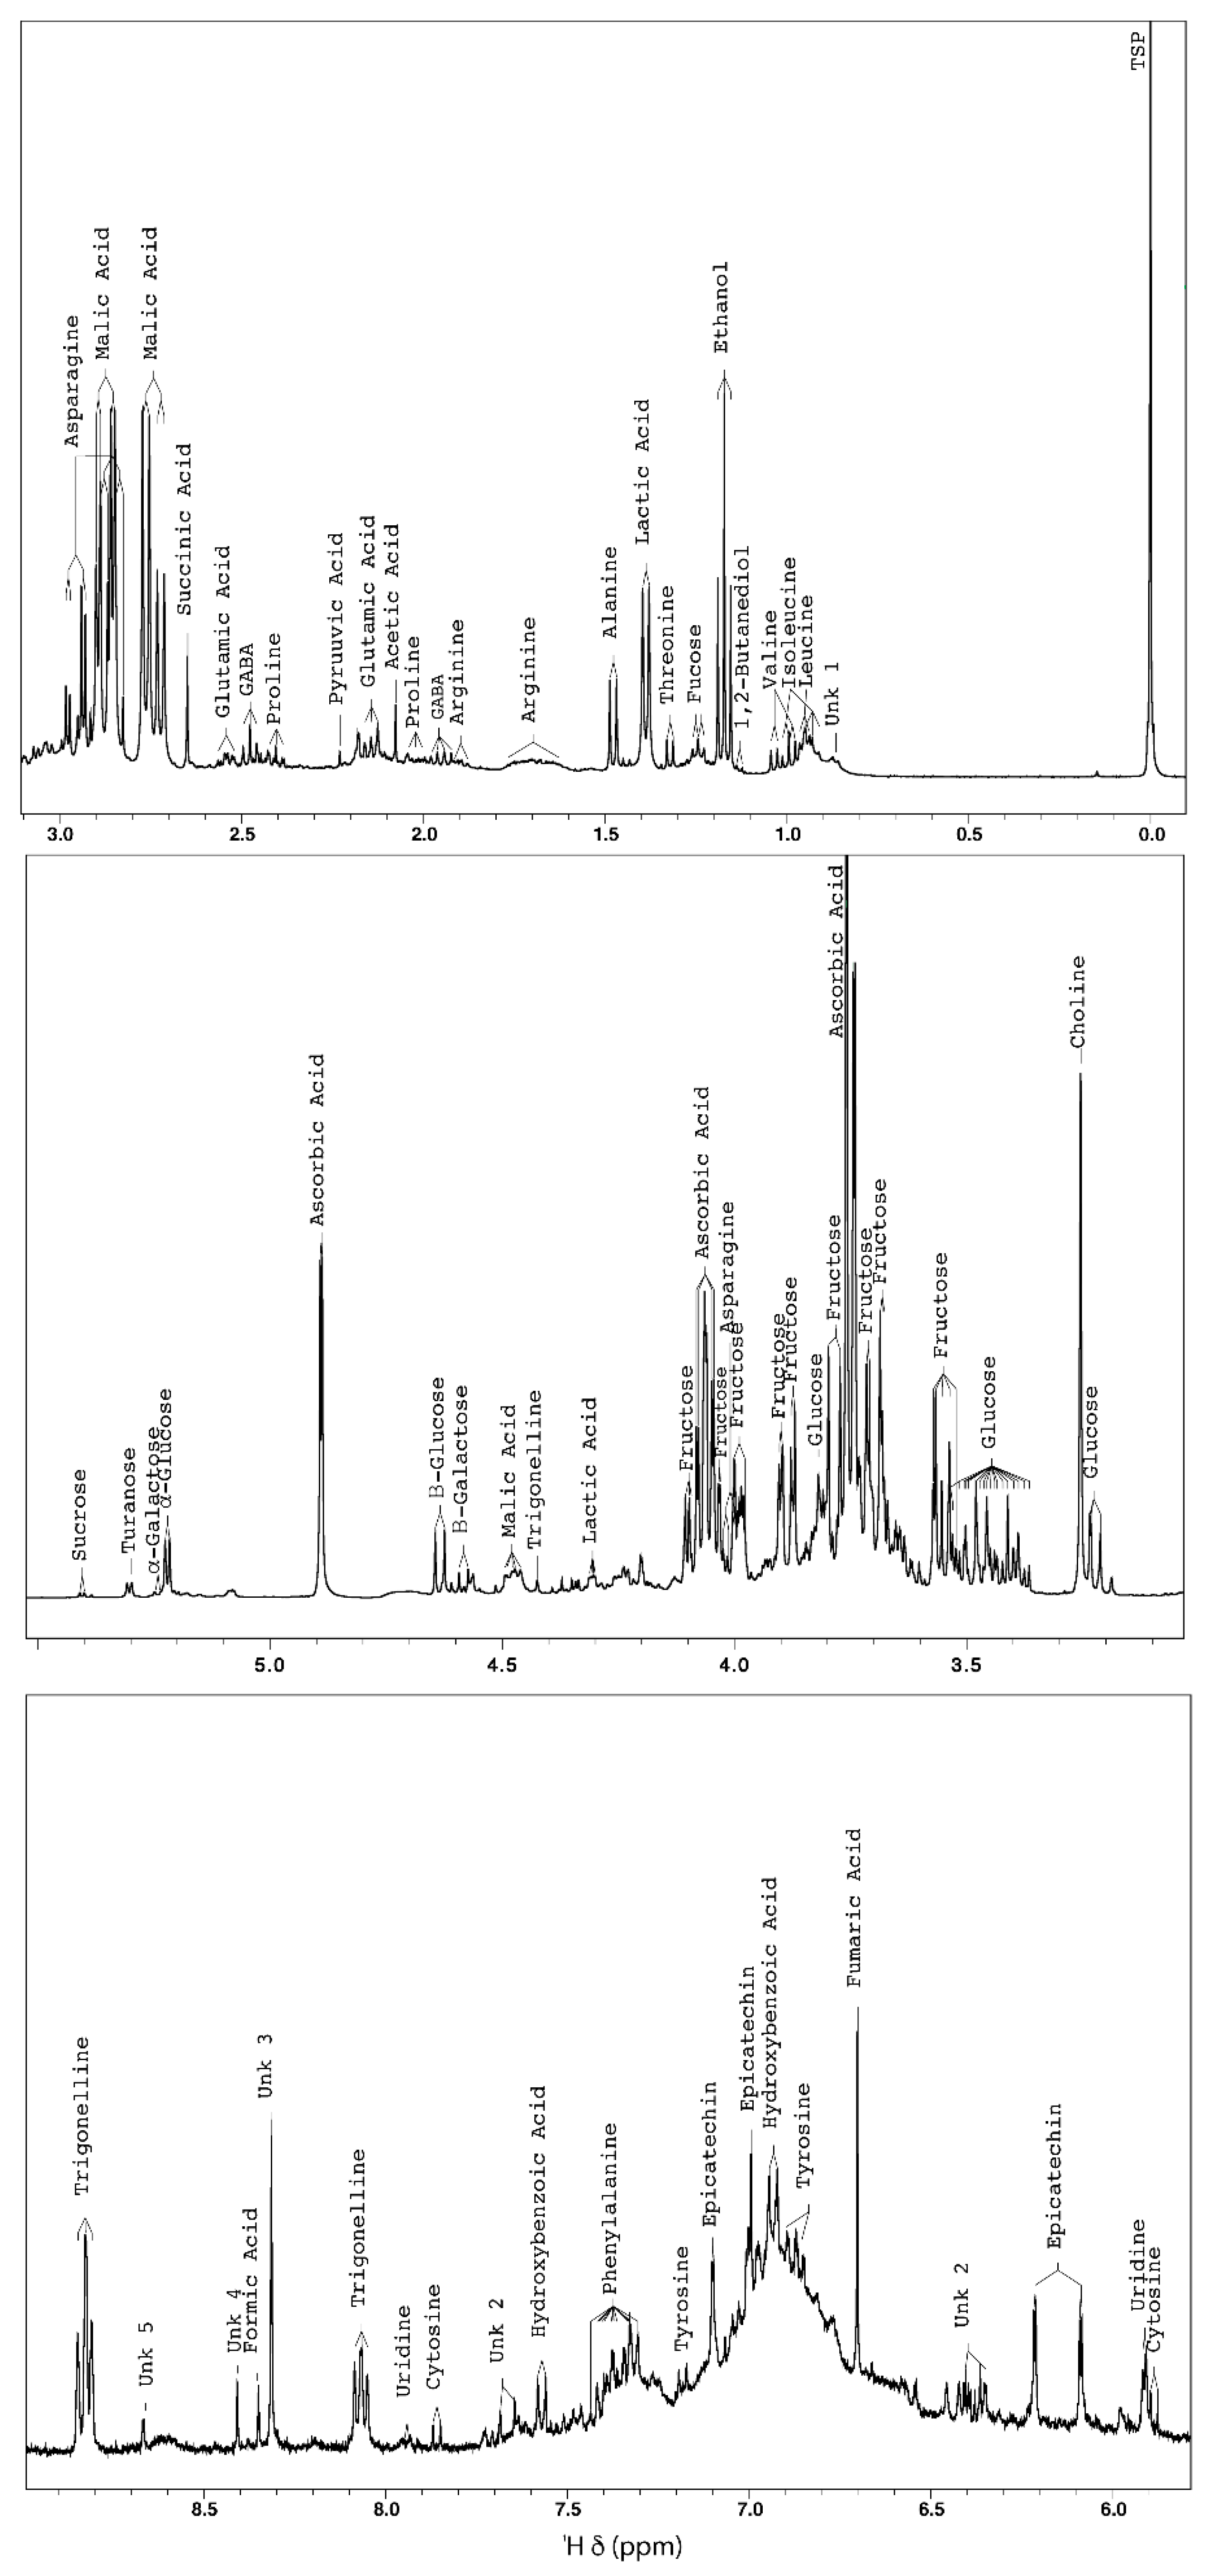
2.1.1. NMR-Based Metabolomic Profiling of Acerola Juice Concentrate
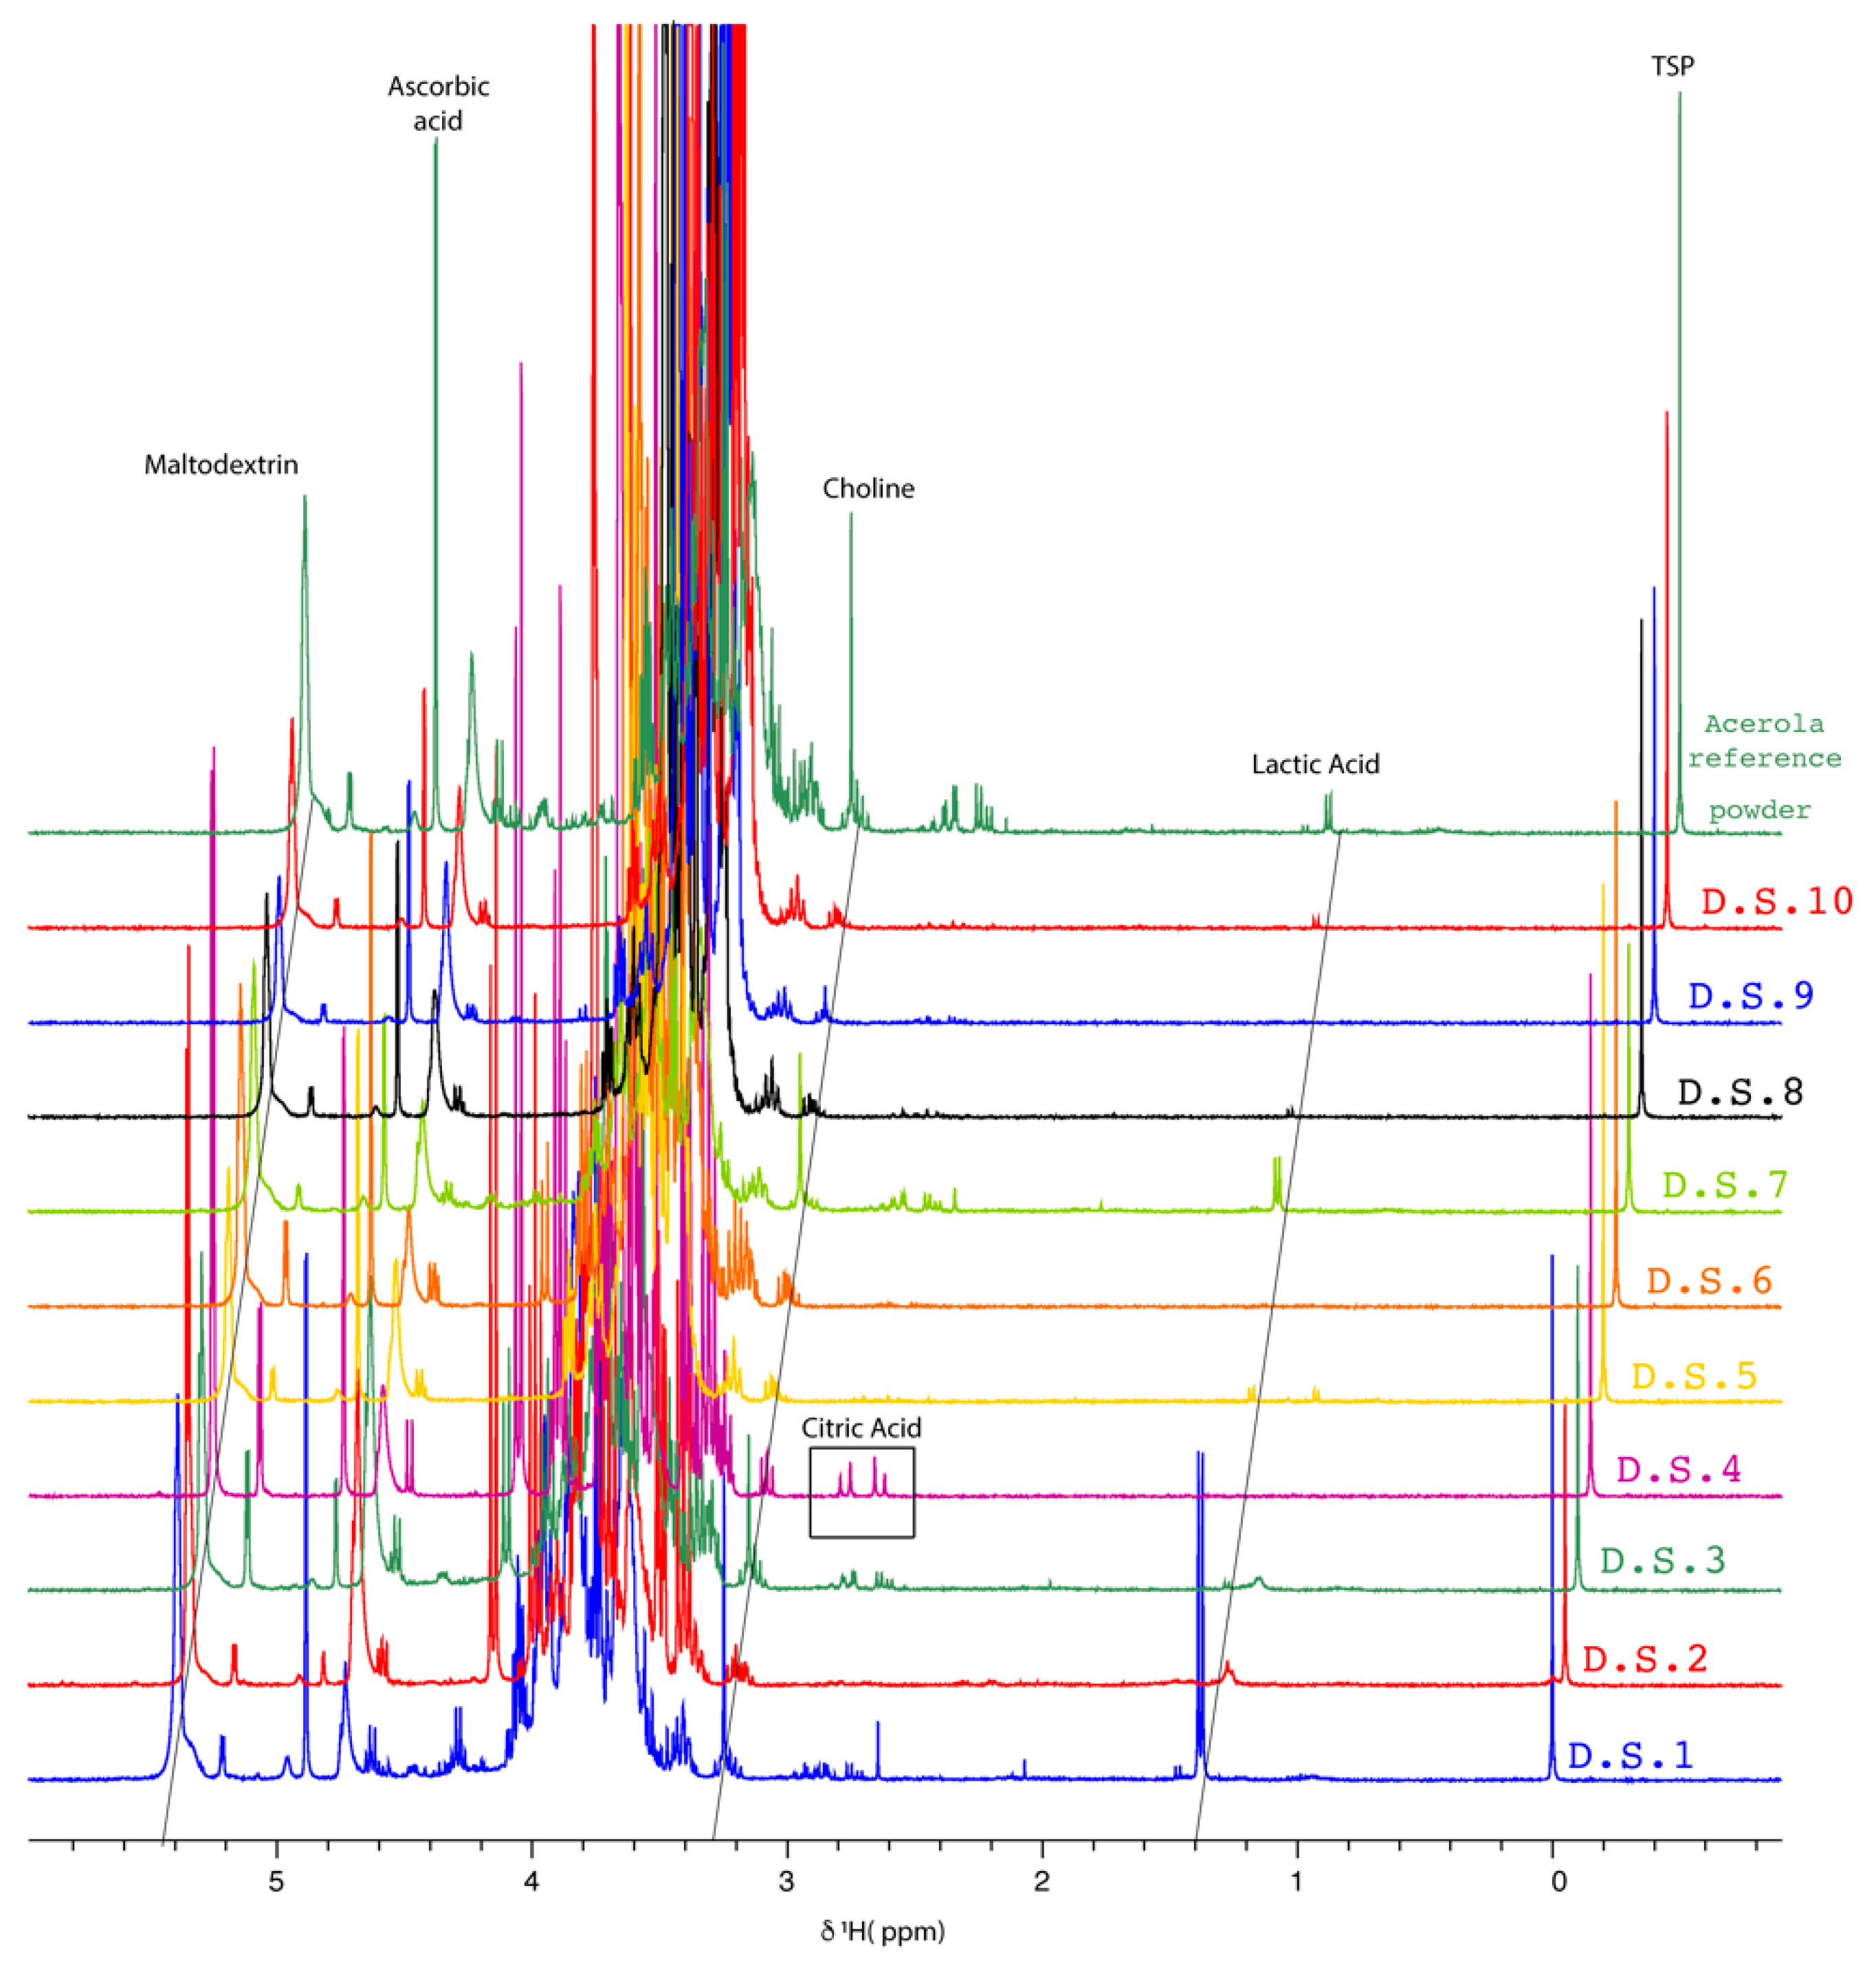
2.1.2. NMR Fingerprinting of Acerola-Based Food Supplements
2.2. Quantitative Analysis of Ascorbic Acid in Acerola Juice by 1H-NMR
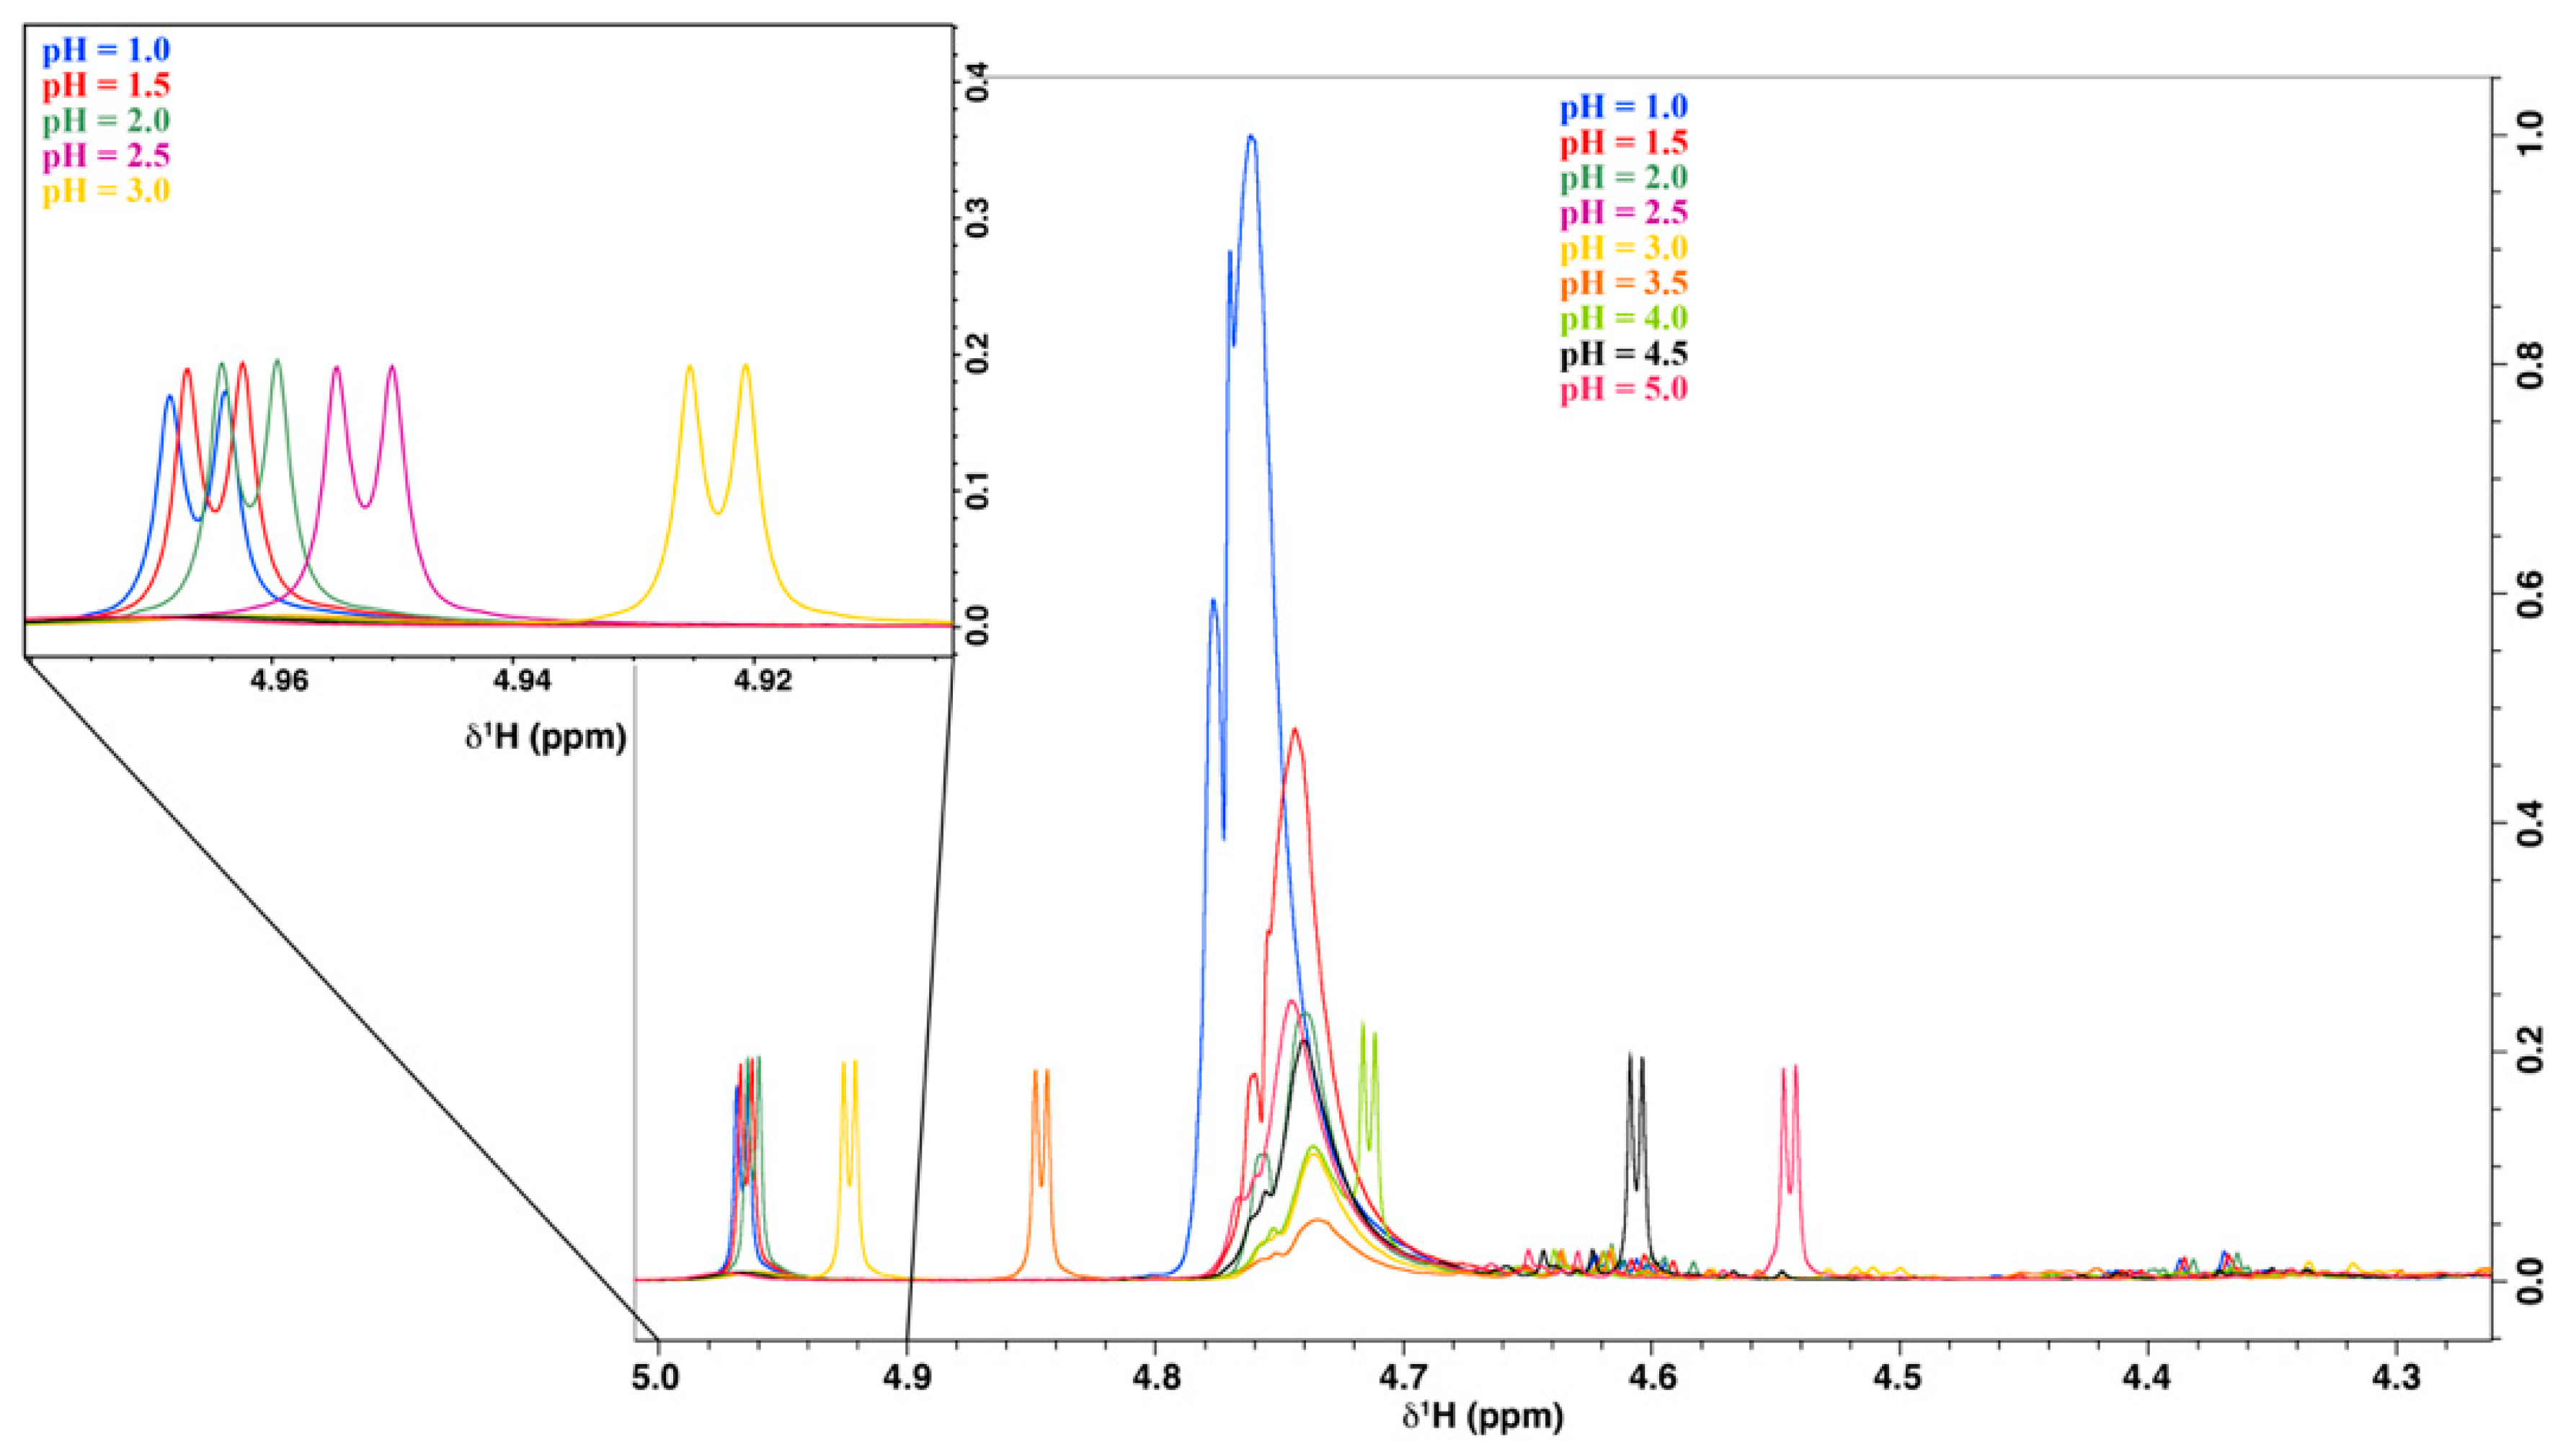
2.2.1. pH Optimization of the Acerola Sample
2.2.2. NMR Acquisition Conditions for Quantitative Analysis of Ascorbic Acid
2.2.3. Method Validation
- Precision
- Specificity
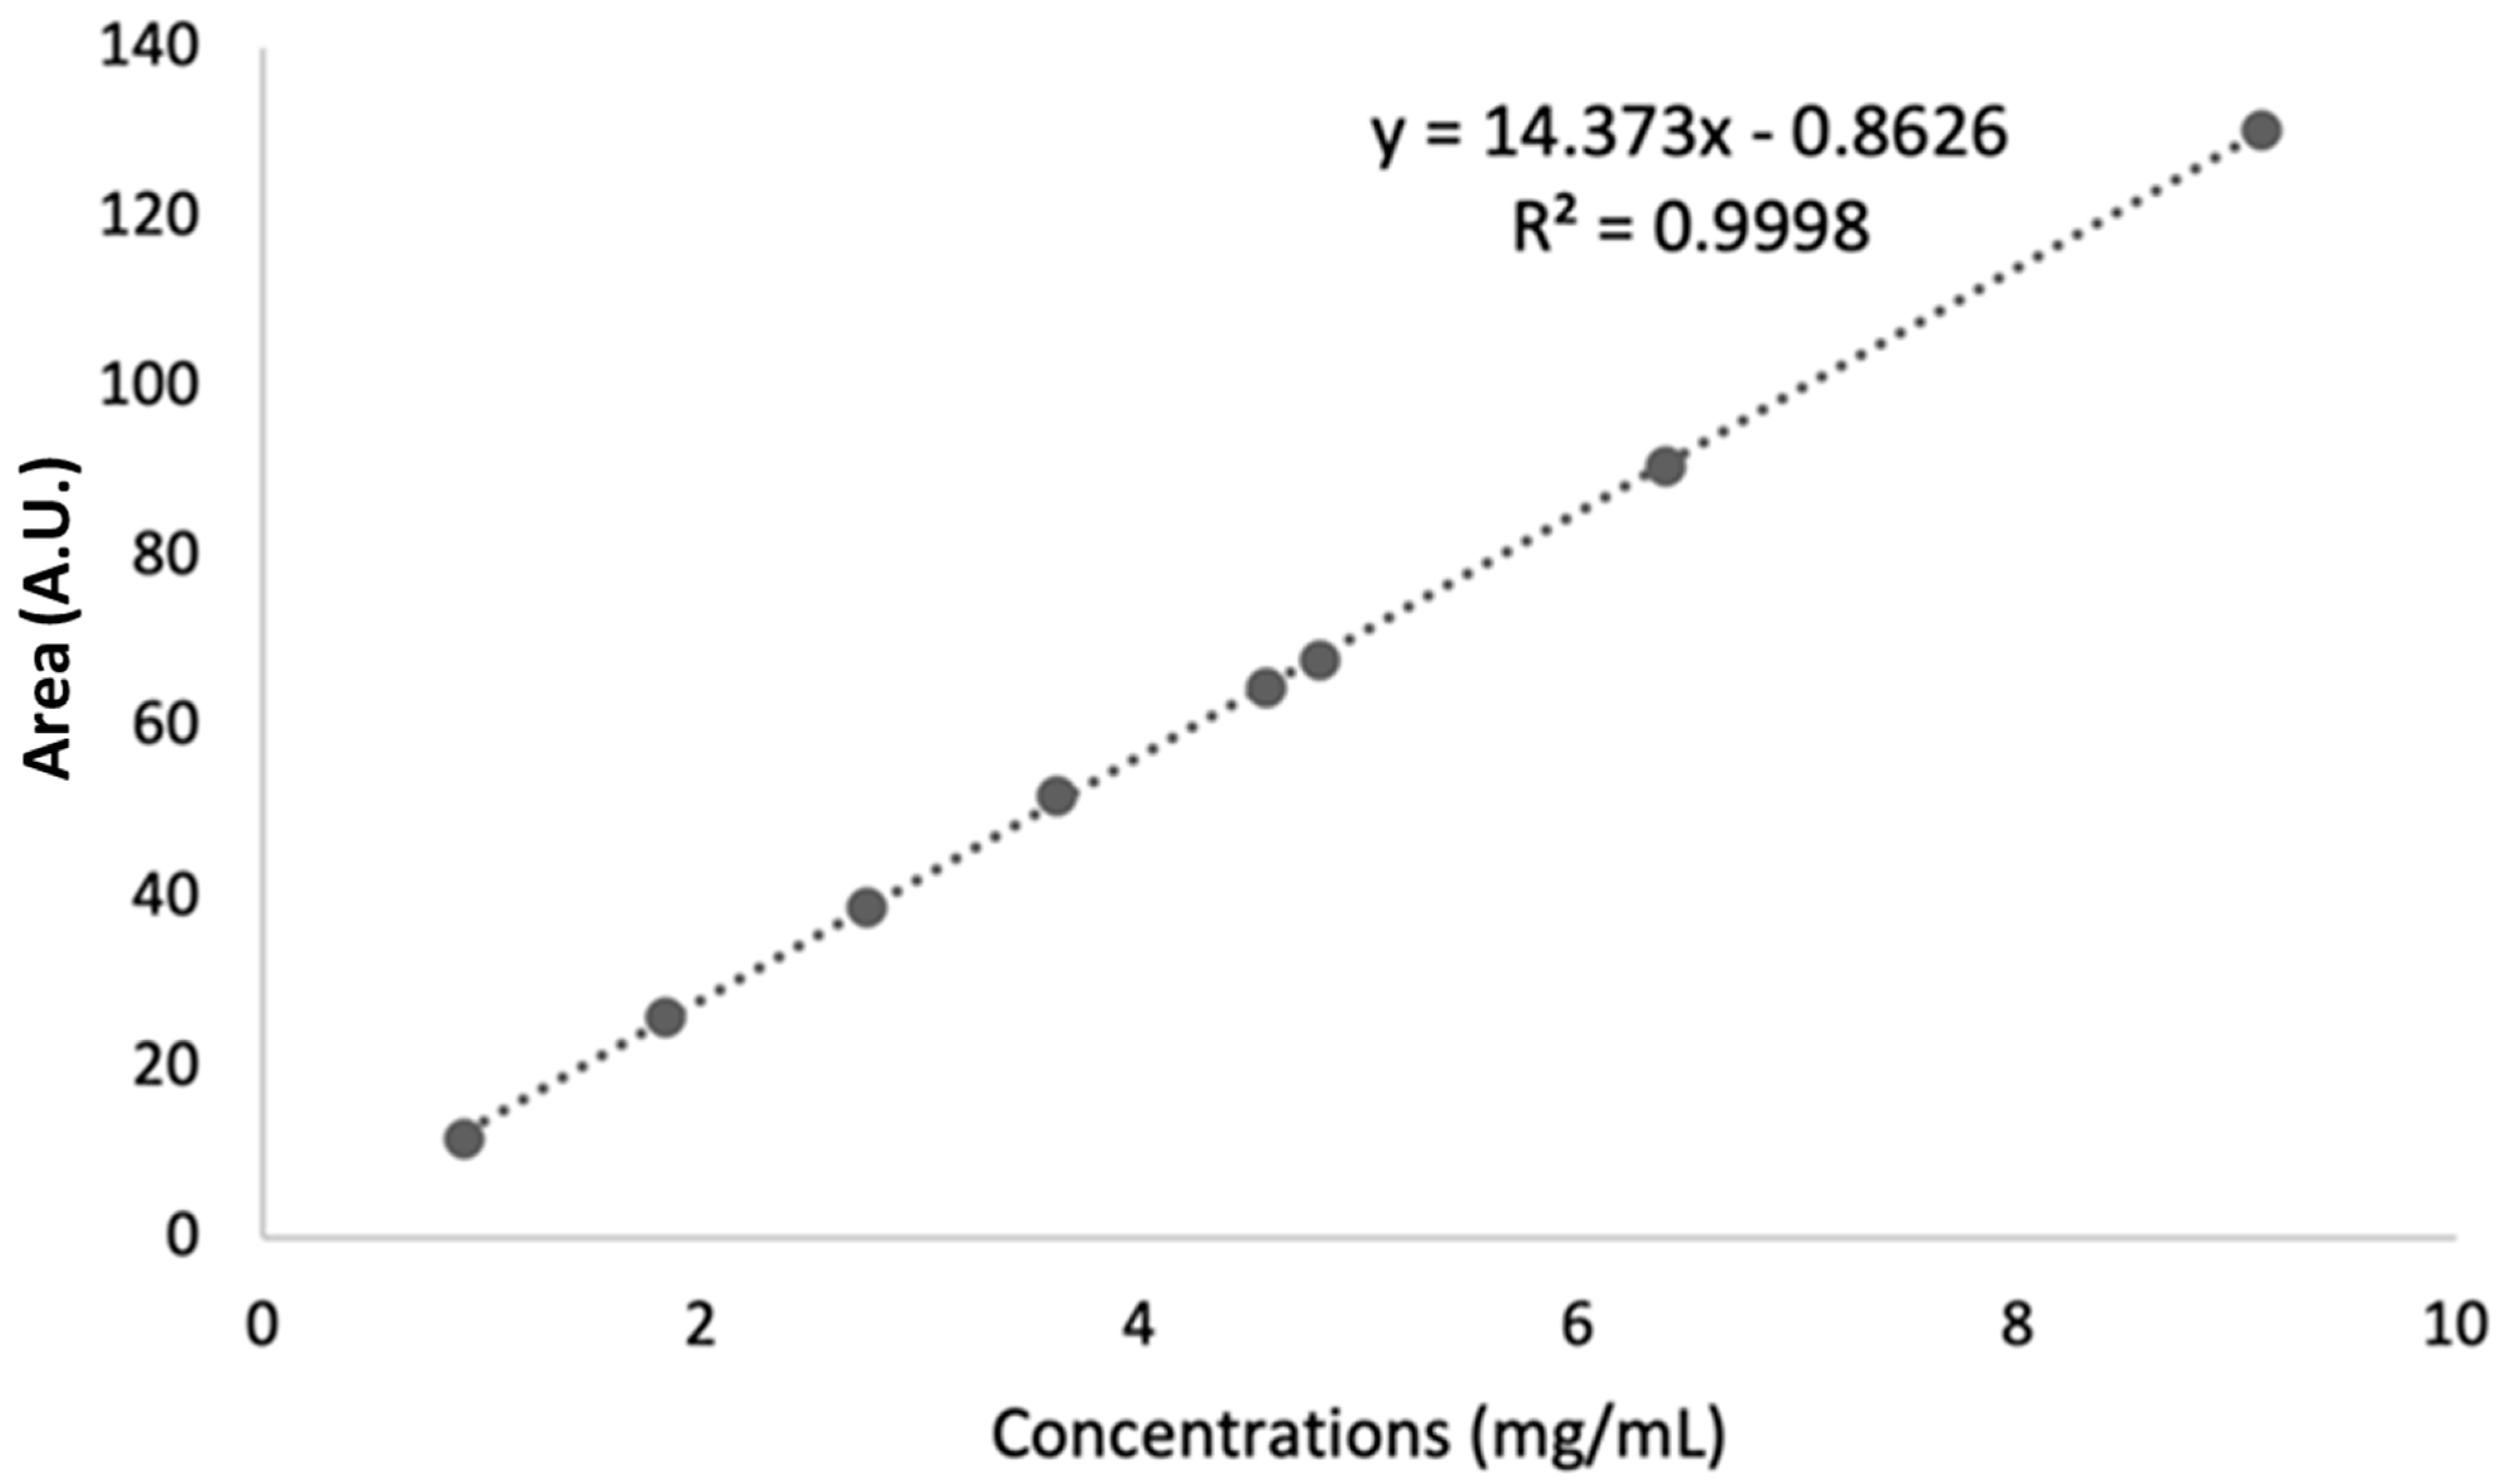
- Linearity
- Analytical Limits of Detection and Quantification
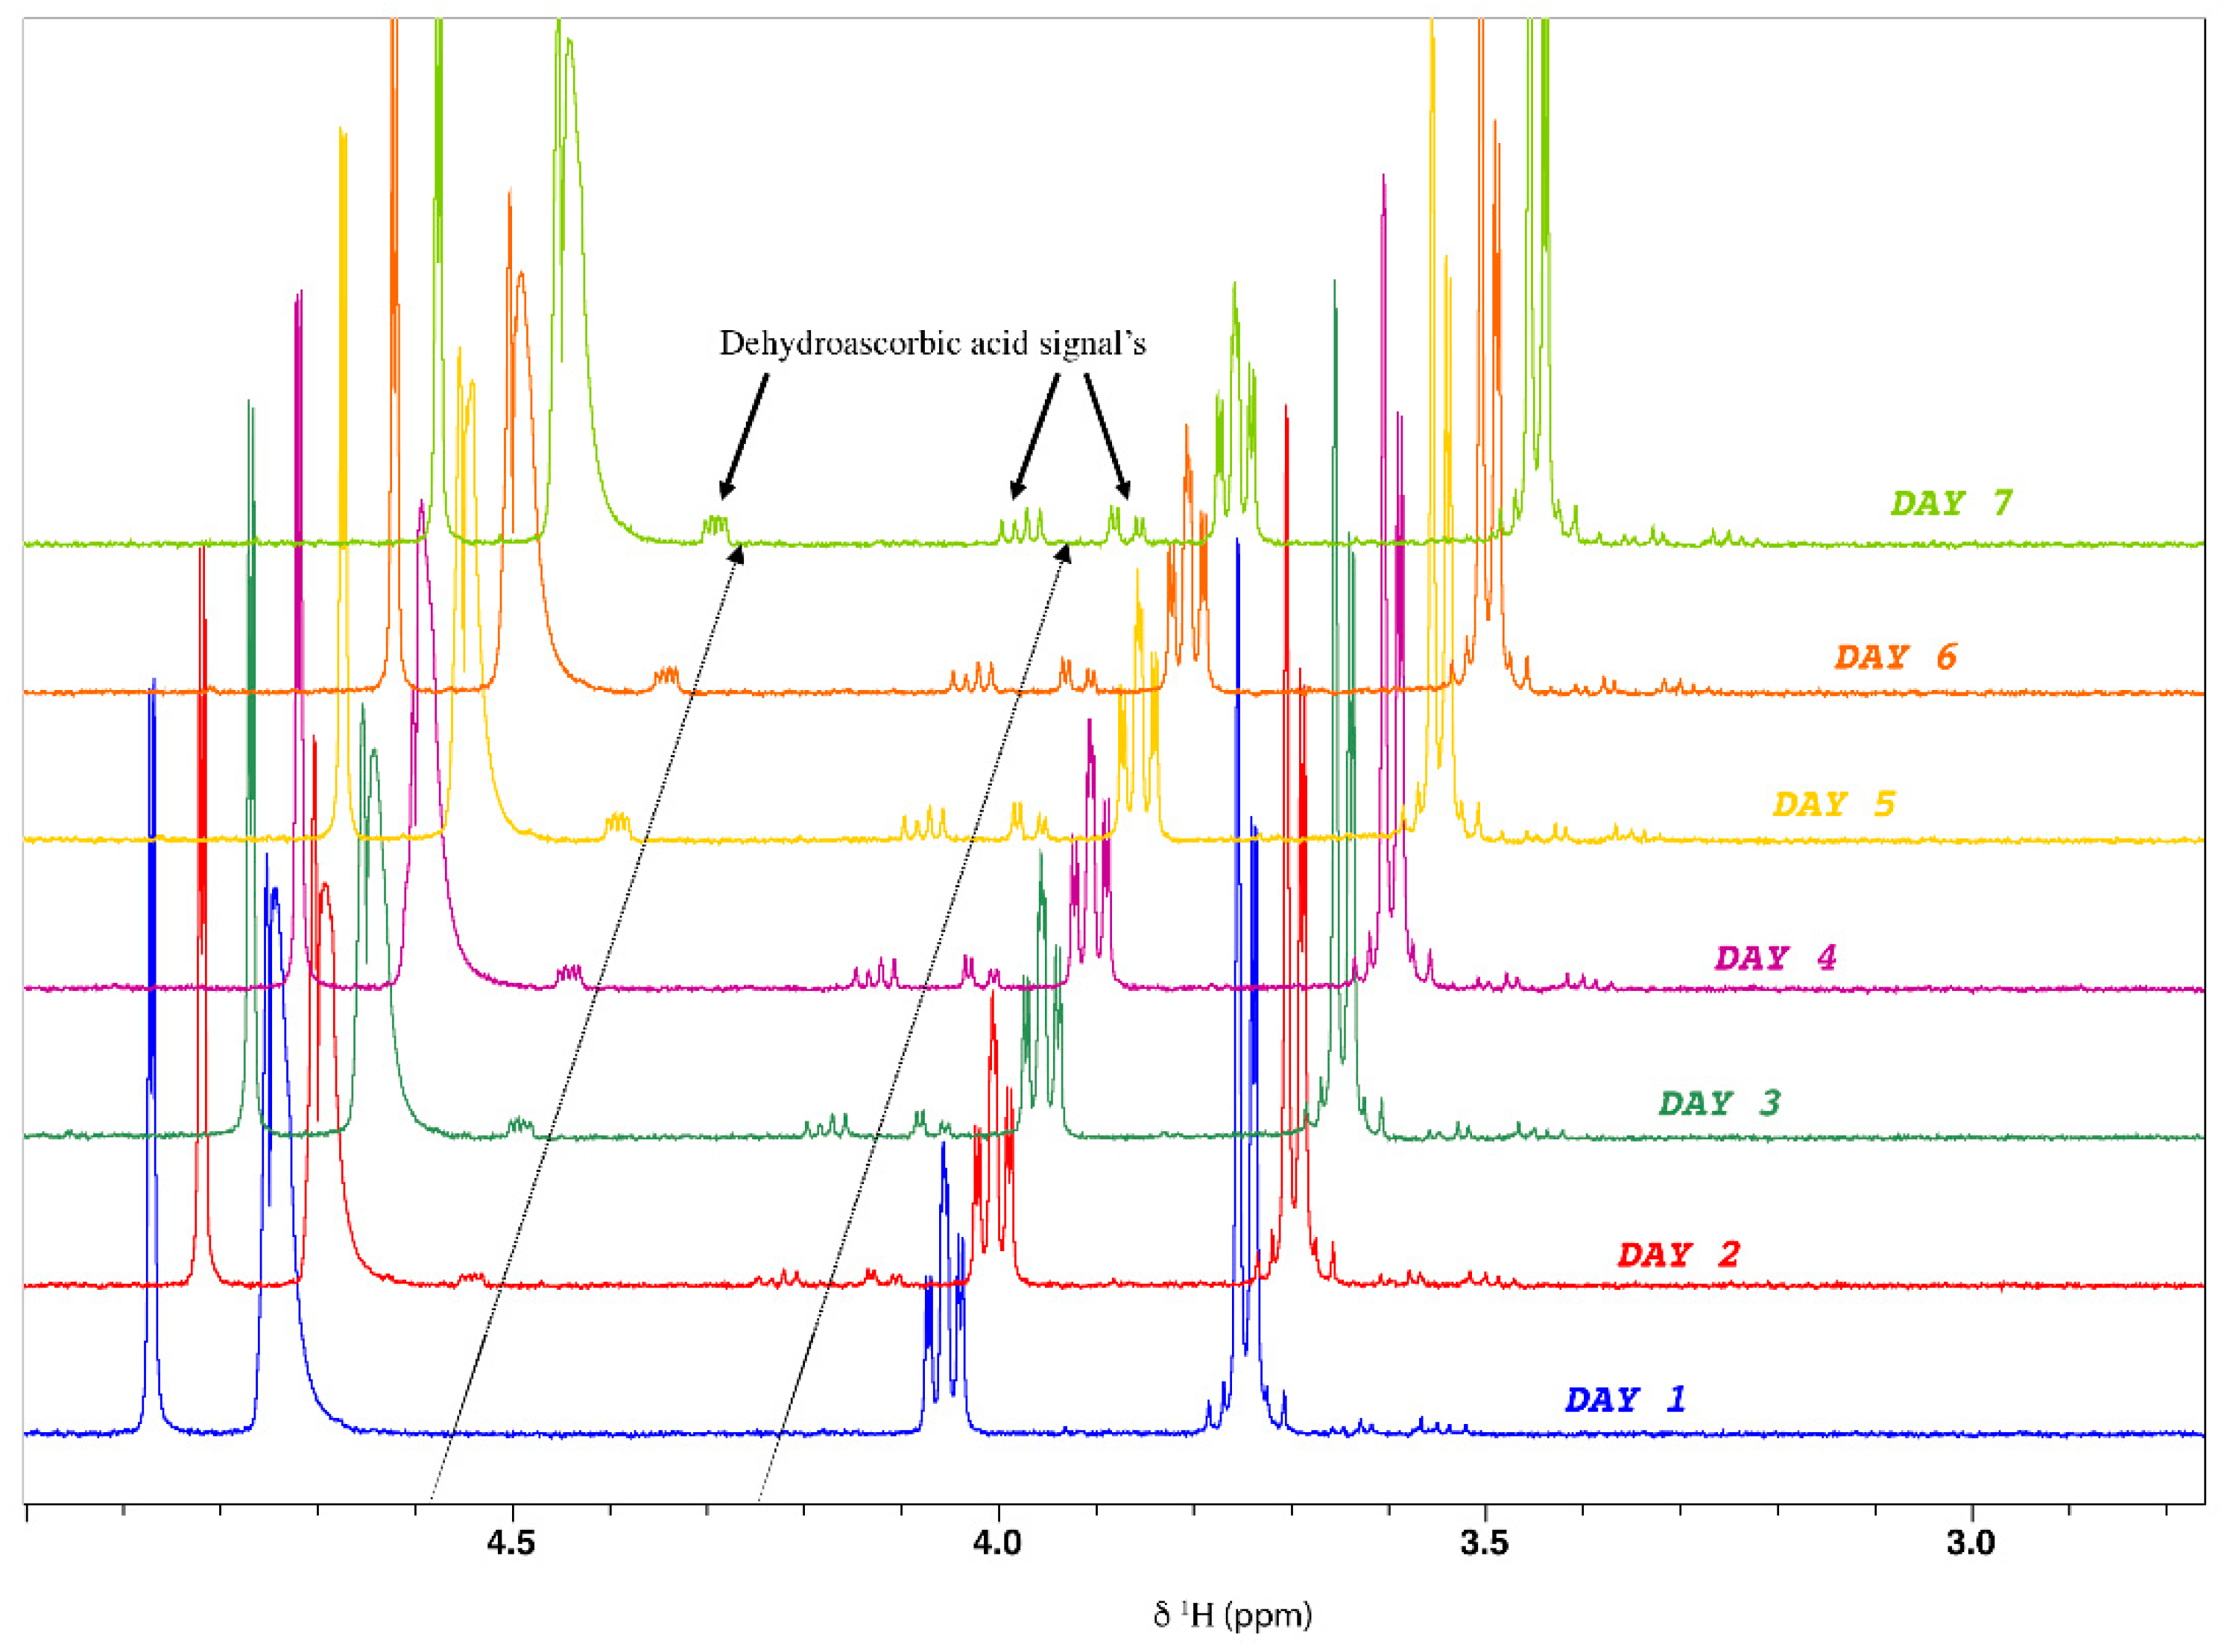
- Ascorbic acid stability
2.2.4. Application: Ascorbic Acid Quantification in Commercial Food Supplements
3. Materials and Methods
3.1. Sample Details
3.2. Reagents and Materials
3.3. Instruments and Software
3.4. General Procedure of 1H-NMR Acquisition and Processing
3.5. Metabolomic Profiling of Acerola Juice Concentrate
3.6. pH Optimization
3.7. T1 Measurement
3.8. Calibration Curve
3.9. NMR Fingerprinting of Acerola-Based Food Supplements and Quantification of Ascorbic Acid
4. Conclusions
Supplementary Materials
Author Contributions
Funding
Institutional Review Board Statement
Informed Consent Statement
Data Availability Statement
Acknowledgments
Conflicts of Interest
Sample Availability
References
- Marques, L.G.; Ferreira, M.C.; Freire, J.T. Freeze-Drying of Acerola (Malpighia Glabra L.). Chem. Eng. Process. Process Intensif. 2007, 46, 451–457. [Google Scholar] [CrossRef]
- Malegori, C.; Nascimento Marques, E.J.; de Freitas, S.T.; Pimentel, M.F.; Pasquini, C.; Casiraghi, E. Comparing the Analytical Performances of Micro-NIR and FT-NIR Spectrometers in the Evaluation of Acerola Fruit Quality, Using PLS and SVM Regression Algorithms. Talanta 2017, 165, 112–116. [Google Scholar] [CrossRef] [PubMed]
- Prakash, A.; Baskaran, R. Acerola, an Untapped Functional Superfruit: A Review on Latest Frontiers. J. Food Sci. Technol. 2018, 55, 3373–3384. [Google Scholar] [CrossRef] [PubMed]
- Fernandes, F.A.N.; Santos, V.O.; Rodrigues, S. Effects of Glow Plasma Technology on Some Bioactive Compounds of Acerola Juice. Food Res. Int. 2019, 115, 16–22. [Google Scholar] [CrossRef]
- Albertino, A.; Barge, A.; Cravotto, G.; Genzini, L.; Gobetto, R.; Vincenti, M. Natural Origin of Ascorbic Acid: Validation by 13C NMR and IRMS. Food Chem. 2009, 112, 715–720. [Google Scholar] [CrossRef]
- da Franca, L.G.; Alves Filho, E.; Ribeiro, L.B.; Evangelista, J.S.B.; Silva, L.M.; de Souza, P.A.; Moura, C.F.H.; Canuto, K.M.; de Aragão, F.A.S. Metabolomic Profiling of Acerola Clones According to the Ripening Stage. J. Food Meas. Charact. 2020, 15, 416–424. [Google Scholar] [CrossRef]
- Mandl, J.; Szarka, A.; Bánhegyi, G. Vitamin C: Update on Physiology and Pharmacology. Br. J. Pharmacol. 2009, 157, 1097–1110. [Google Scholar] [CrossRef]
- Findik, R.B.; İlkaya, F.; Guresci, S.; Guzel, H.; Karabulut, S.; Karakaya, J. Effect of Vitamin C on Collagen Structure of Cardinal and Uterosacral Ligaments during Pregnancy. Eur. J. Obstet. Gynecol. Reprod. Biol. 2016, 201, 31–35. [Google Scholar] [CrossRef]
- Podmore, I.D.; Griffiths, H.R.; Herbert, K.E.; Mistry, N.; Mistry, P.; Lunec, J. Vitamin C Exhibits Pro-Oxidant Properties. Nature 1998, 392, 559. [Google Scholar] [CrossRef]
- Padayatty, S.; Levine, M. Vitamin C: The Known and the Unknown and Goldilocks. Oral Dis. 2016, 22, 463–493. [Google Scholar] [CrossRef] [Green Version]
- Ellingsen, I.; Seljeflot, I.; Arnesen, H.; Tonstad, S. Vitamin C Consumption Is Associated with Less Progression in Carotid Intima Media Thickness in Elderly Men: A 3-Year Intervention Study. Nutr. Metab. Cardiovasc. Dis. 2009, 19, 8–14. [Google Scholar] [CrossRef] [PubMed]
- Cefali, L.C.; de Oliveira Maia, L.; Stahlschimidt, R.; Ataide, J.A.; Tambourgi, E.B.; Rosa, P.C.P.; Mazzola, P.G. Vitamin C in Acerola and Red Plum Extracts: Quantification via HPLC, in Vitro Antioxidant Activity, and Stability of Their Gel and Emulsion Formulations. J. AOAC Int. 2018, 101, 1461–1465. [Google Scholar] [CrossRef] [PubMed]
- dos Garcia, V.A.S.; Borges, J.G.; Vanin, F.M.; de Carvalho, R.A. Vitamin C Stability in Acerola and Camu-Camu Powder Obtained by Spray Drying. Braz. J. Food Technol. 2020, 23, e2019237. [Google Scholar] [CrossRef]
- Stevens, R.; Buret, M.; Garchery, C.; Carretero, Y.; Causse, M. Technique for Rapid, Small-Scale Analysis of Vitamin C Levels in Fruit and Application to a Tomato Mutant Collection. J. Agric. Food Chem. 2006, 54, 6159–6165. [Google Scholar] [CrossRef]
- Sánchez-Mata, M.C.; Cámara-Hurtado, M.; Díez-Marqués, C.; Torija-Isasa, M.E. Comparison of High-Performance Liquid Chromatography and Spectrofluorimetry for Vitamin C Analysis of Green Beans (Phaseolus Vulgaris L.). Eur. Food Res. Technol. 2000, 210, 220–225. [Google Scholar] [CrossRef]
- Marques, L.G.; Prado, M.M.; Freire, J.T. Rehydration Characteristics of Freeze-Dried Tropical Fruits. LWT–Food Sci. Technol. 2009, 42, 1232–1237. [Google Scholar] [CrossRef]
- Jamin, E.; Thomas, F. SNIF-NMR Applications in an Economic Context: Fraud Detection in Food Products. In Modern Magnetic Resonance; Webb, G.A., Ed.; Springer International Publishing: Cham, Switzerland, 2018; pp. 1405–1416. ISBN 978-3-319-28387-6. [Google Scholar]
- Tenailleau, E.J.; Lancelin, P.; Robins, R.J.; Akoka, S. Authentication of the Origin of Vanillin Using Quantitative Natural Abundance 13C NMR. J. Agric. Food Chem. 2004, 52, 7782–7787. [Google Scholar] [CrossRef]
- Sobolev, A.P.; Thomas, F.; Donarski, J.; Ingallina, C.; Circi, S.; Cesare Marincola, F.; Capitani, D.; Mannina, L. Use of NMR Applications to Tackle Future Food Fraud Issues. Trends Food Sci. Technol. 2019, 91, 347–353. [Google Scholar] [CrossRef]
- Hatzakis, E. Nuclear Magnetic Resonance (NMR) Spectroscopy in Food Science: A Comprehensive Review. Compr. Rev. Food Sci. Food Saf. 2019, 18, 189–220. [Google Scholar] [CrossRef]
- Minoja, A.P.; Napoli, C. NMR Screening in the Quality Control of Food and Nutraceuticals. Food Res. Int. 2014, 63, 126–131. [Google Scholar] [CrossRef]
- Pauli, G.F.; Jaki, B.U.; Lankin, D.C. Quantitative 1H NMR: Development and Potential of a Method for Natural Products Analysis. J. Nat. Prod. 2005, 68, 133–149. [Google Scholar] [CrossRef]
- Ward, J.L.; Baker, J.M.; Beale, M.H. Recent Applications of NMR Spectroscopy in Plant Metabolomics: NMR Spectroscopy in Plant Metabolomics. FEBS J. 2007, 274, 1126–1131. [Google Scholar] [CrossRef] [PubMed]
- Smolinska, A.; Blanchet, L.; Buydens, L.M.C.; Wijmenga, S.S. NMR and Pattern Recognition Methods in Metabolomics: From Data Acquisition to Biomarker Discovery: A Review. Anal. Chim. Acta 2012, 750, 82–97. [Google Scholar] [CrossRef] [PubMed]
- Deborde, C.; Moing, A.; Roch, L.; Jacob, D.; Rolin, D.; Giraudeau, P. Plant Metabolism as Studied by NMR Spectroscopy. Prog. Nucl. Magn. Reson. Spectrosc. 2017, 102–103, 61–97. [Google Scholar] [CrossRef] [PubMed]
- Wishart, D.S. NMR Metabolomics: A Look Ahead. J. Magn. Reson. 2019, 306, 155–161. [Google Scholar] [CrossRef] [PubMed]
- dos Santos, C.P.; Batista, M.C.; da Cruz Saraiva, K.D.; Roque, A.L.M.; de Souza Miranda, R.; Alexandre e Silva, L.M.; Moura, C.F.H.; Alves Filho, E.G.; Canuto, K.M.; Costa, J.H. Transcriptome Analysis of Acerola Fruit Ripening: Insights into Ascorbate, Ethylene, Respiration, and Softening Metabolisms. Plant Mol. Biol. 2019, 101, 269–296. [Google Scholar] [CrossRef] [PubMed]
- Wishart, D.S.; Guo, A.; Oler, E.; Wang, F.; Anjum, A.; Peters, H.; Dizon, R.; Sayeeda, Z.; Tian, S.; Lee, B.L.; et al. HMDB 5.0: The Human Metabolome Database for 2022. Nucleic Acids Res. 2022, 50, D622–D631. [Google Scholar] [CrossRef]
- Ulrich, E.L.; Akutsu, H.; Doreleijers, J.F.; Harano, Y.; Ioannidis, Y.E.; Lin, J.; Livny, M.; Mading, S.; Maziuk, D.; Miller, Z.; et al. BioMagResBank. Nucleic Acids Res. 2007, 36, D402–D408. [Google Scholar] [CrossRef]
- Sumner, L.W.; Amberg, A.; Barrett, D.; Beale, M.H.; Beger, R.; Daykin, C.A.; Fan, T.W.-M.; Fiehn, O.; Goodacre, R.; Griffin, J.L.; et al. Proposed Minimum Reporting Standards for Chemical Analysis: Chemical Analysis Working Group (CAWG) Metabolomics Standards Initiative (MSI). Metabolomics 2007, 3, 211–221. [Google Scholar] [CrossRef]
- Wallace, T.C.; Blusztajn, J.K.; Caudill, M.A.; Klatt, K.C.; Natker, E.; Zeisel, S.H.; Zelman, K.M. Choline: The Underconsumed and Underappreciated Essential Nutrient. Nutr. Today 2018, 53, 240–253. [Google Scholar] [CrossRef]
- Botoran, O.R.; Ionete, R.E.; Miricioiu, M.G.; Costinel, D.; Radu, G.L.; Popescu, R. Amino Acid Profile of Fruits as Potential Fingerprints of Varietal Origin. Molecules 2019, 24, 4500. [Google Scholar] [CrossRef]
- Spiteri, M.; Jamin, E.; Thomas, F.; Rebours, A.; Lees, M.; Rogers, K.M.; Rutledge, D.N. Fast and Global Authenticity Screening of Honey Using 1H-NMR Profiling. Food Chem. 2015, 189, 60–66. [Google Scholar] [CrossRef] [PubMed]
- Farag, M.A.; Elsebai, M.F.; Khattab, A.R. Metabolome Based Classification of Artichoke Leaf: A Prospect for Phyto-Equivalency of Its Different Leaf Origins and Commercial Preparations. J. Pharm. Biomed. Anal. 2018, 158, 151–159. [Google Scholar] [CrossRef] [PubMed]
- Correia, R.T.; Borges, K.C.; Medeiros, M.F.; Genovese, M.I. Bioactive Compounds and Phenolic-Linked Functionality of Powdered Tropical Fruit Residues. Food Sci. Technol. Int. 2012, 18, 539–547. [Google Scholar] [CrossRef] [PubMed]
- da Silva, L.M.R.; de Figueiredo, E.A.T.; Ricardo, N.M.P.S.; Vieira, I.G.P.; de Figueiredo, R.W.; Brasil, I.M.; Gomes, C.L. Quantification of Bioactive Compounds in Pulps and By-Products of Tropical Fruits from Brazil. Food Chem. 2014, 143, 398–404. [Google Scholar] [CrossRef] [PubMed]
- Anthoni, U.; Christophersen, C.; Hougaard, L.; Nielsen, P.H. Quaternary Ammonium Compounds in the Biosphere—An Example of a Versatile Adaptive Strategy. Comp. Biochem. Physiol. Part B Comp. Biochem. 1991, 99, 1–18. [Google Scholar] [CrossRef]
- Chowdhury, A.A.; Gawali, N.B.; Munshi, R.; Juvekar, A.R. Trigonelline Insulates against Oxidative Stress, Proinflammatory Cytokines and Restores BDNF Levels in Lipopolysaccharide Induced Cognitive Impairment in Adult Mice. Metab. Brain Dis. 2018, 33, 681–691. [Google Scholar] [CrossRef]
- da Silva, M.A.; Arévalo Pinedo, R.; Kieckbusch, T.G. Ascorbic Acid Thermal Degradation during Hot Air Drying of Camu-Camu ( Myrciaria Dubia [H.B.K.] McVaugh) Slices at Different Air Temperatures. Dry. Technol. 2005, 23, 2277–2287. [Google Scholar] [CrossRef]
- Giamperi, L.; Fraternale, D.; Bucchini, A.; Ricci, D. Antioxidant Activity of Citrus Paradisi Seeds Glyceric Extract. Fitoterapia 2004, 75, 221–224. [Google Scholar] [CrossRef]
- Singh, G.; Mohanty, B.P.; Saini, G.S.S. Structure, Spectra and Antioxidant Action of Ascorbic Acid Studied by Density Functional Theory, Raman Spectroscopic and Nuclear Magnetic Resonance Techniques. Spectrochim. Acta A Mol. Biomol. Spectrosc. 2016, 155, 61–74. [Google Scholar] [CrossRef]
- Gamov, G.A.; Yarullin, D.N.; Gudyrina, M.A.; Pogodina, E.I.; Medvedeva, A.S.; Zavalishin, M.N. Protonation of l -Ascorbic Acid in an Aqueous Solution at T = 298.2 K, p = 0.1 MPa, and I = 0.10–5.0 Mol L–1 (NaCl). J. Chem. Eng. Data 2022, 67, 1358–1364. [Google Scholar] [CrossRef]
- Giraudeau, P.; Silvestre, V.; Akoka, S. Optimizing Water Suppression for Quantitative NMR-Based Metabolomics: A Tutorial Review. Metabolomics 2015, 11, 1041–1055. [Google Scholar] [CrossRef]
- Mckay, R.T. How the 1D-NOESY Suppresses Solvent Signal in Metabonomics NMR Spectroscopy: An Examination of the Pulse Sequence Components and Evolution. Concepts Magn. Reson. Part A 2011, 38A, 197–220. [Google Scholar] [CrossRef]
- Wells, R.J.; Cheung, J.; Hook, J.M. Dimethylsulfone as a Universal Standard for Analysis of Organics by QNMR. Accredit. Qual. Assur. 2004, 9, 450–456. [Google Scholar] [CrossRef]
- Bharti, S.K.; Roy, R. Quantitative 1H NMR Spectroscopy. TrAC Trends Anal. Chem. 2012, 35, 5–26. [Google Scholar] [CrossRef]
- Schönberger, T.; Monakhova, Y.B.; Lachenmeier, D.W.; Kuballa, T. Guide to NMR Method Development and Validation–Part I: Identification and Quantification. EUROLAB Tech. Rep. 2014, 2014, 1–20. [Google Scholar] [CrossRef]
- Zuriarrain, A.; Zuriarrain, J.; Puertas, A.I.; Dueñas, M.T.; Berregi, I. Quantitative Determination of Lactic and Acetic Acids in Cider by 1 H NMR Spectrometry. Food Control 2015, 52, 49–53. [Google Scholar] [CrossRef]
- Jacob, D.; Deborde, C.; Lefebvre, M.; Maucourt, M.; Moing, A. NMRProcFlow: A Graphical and Interactive Tool Dedicated to 1D Spectra Processing for NMR-Based Metabolomics. Metab. Off. J. Metab. Soc. 2017, 13, 36. [Google Scholar] [CrossRef]
- Yuan, J.-P.; Chen, F. Degradation of Ascorbic Acid in Aqueous Solution. J. Agric. Food Chem. 1998, 46, 5078–5082. [Google Scholar] [CrossRef]
- Turak, F.; Güzel, R.; Dinç, E. Simultaneous Determination of Ascorbic Acid and Caffeine in Commercial Soft Drinks Using Reversed-Phase Ultraperformance Liquid Chromatography. J. Food Drug Anal. 2017, 25, 285–292. [Google Scholar] [CrossRef] [Green Version]
- Vu, T.N.; Valkenborg, D.; Smets, K.; Verwaest, K.A.; Dommisse, R.; Lemière, F.; Verschoren, A.; Goethals, B.; Laukens, K. An Integrated Workflow for Robust Alignment and Simplified Quantitative Analysis of NMR Spectrometry Data. BMC Bioinform. 2011, 12, 405. [Google Scholar] [CrossRef] [PubMed] [Green Version]


| Compounds | Chemical Shift (ppm) Multiplicity (J in Hz) | MSI Status * | Identification Confirmation |
|---|---|---|---|
| Isoleucine | 0.93 (t, J = 7.56); 1.00 (d, J = 6.64) | 1 | Spike, TOCSY correlation |
| Leucine | 0.95 (t, J = 4.94) | 1 | TOCSY correlation |
| Valine | 0.98 (d, J = 7.02); 1.03 (d, J = 7.02) | 1 | TOCSY correlation |
| 1, 2-Butanediol | 1.13 (d, J = 6.08) | 1 | Spike, TOCSY correlation |
| Ethanol | 1.17 (t, J = 7.08) | 1 | TOCSY correlation, 1H-13C HSQC |
| Fucose | 1.24 (d, J = 6.48); 1.25 (d, J = 5.80) | 2 | TOCSY correlation |
| Threonine | 1.32 (d, J = 6.60) | 1 | TOCSY correlation, 1H-13C HSQC |
| Lactic acid | 1.38 (d, J = 6.96); 4.31 (q, J = 1.56) | 1 | TOCSY correlation, 1H-13C HSQC |
| Alanine | 1.47 (d, J = 7.28) | 1 | Spike, TOCSY correlation |
| Arginine | 1.69 (m); 1.89 (m) | 1 | Spike, TOCSY correlation |
| GABA | 1.94 (q, J = 7.48); 2.47 (t, J = 7.32) | 1 | TOCSY correlation |
| Proline | 2.01 (m); 3.55 (m) | 1 | TOCSY correlation |
| Acetic acid | 2.07 (s) | 2 | - |
| Glutamic acid | 2.14 (m); 2.54 (m) | 1 | Spike, TOCSY correlation |
| Pyruvic acid | 2.23 (s) | 2 | - |
| Succinic acid | 2.64 (s) | 1 | Spike |
| Malic acid | 2.74 (dd, J = 7.46, J = 16.27); 2.87 (dd, J = 4.50, J = 16.15) | 1 | TOCSY correlation, 1H-13C HSQC |
| Asparagine | 2.86 (dd, J = 7.76, J = 16.89); 2.96 (dd, J = 4.30, J = 16.99); 4.01 (dd, J = 4.46, J = 7.38) | 1 | Spike, TOCSY correlation, 1H-13C HSQC |
| β-glucose | 3.23 (dd, J = 8.00, J = 7.92); 4.63 (d, J = 7.96) | 1 | Spike, TOCSY correlation, 1H-13C HSQC |
| Choline | 3.25 (s) | 1 | TOCSY correlation, 1H-13C HSQC and 1H-13C HMBC correlation |
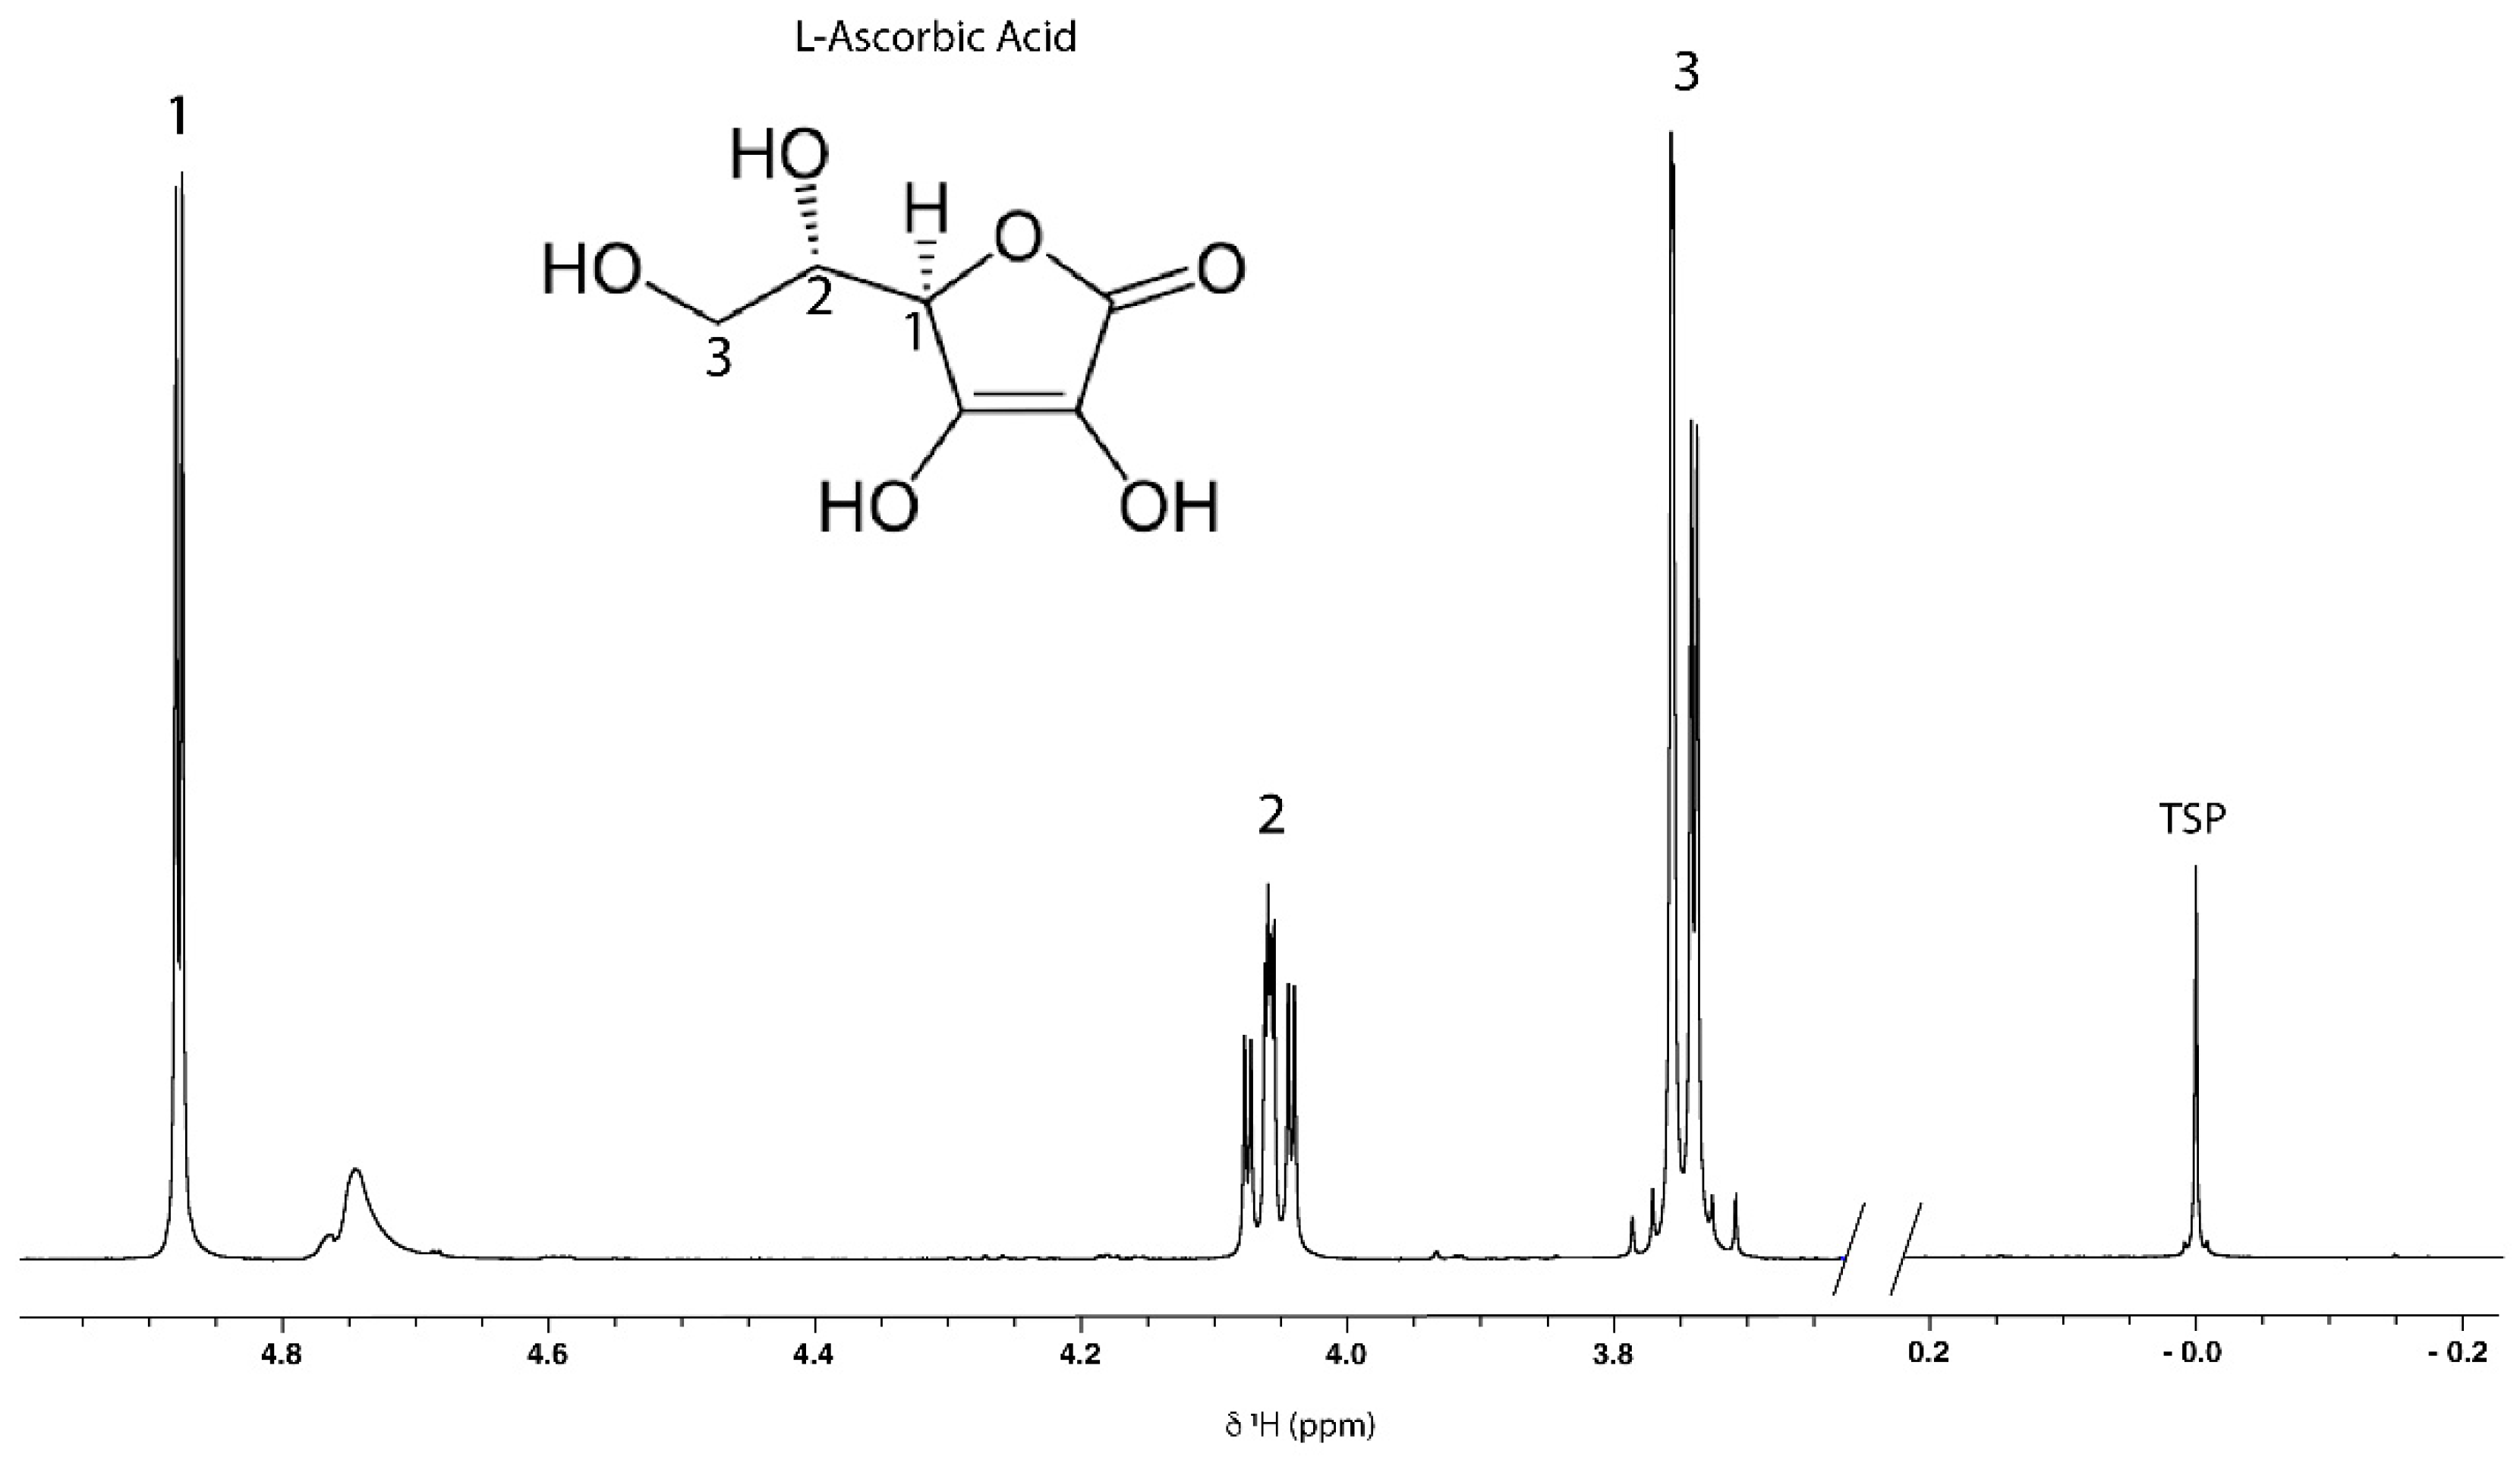
| Ascorbic acid | 3.74 (m); 4.06 (m); 4.89 (d, J = 1.88) | 1 | Spike, TOCSY correlation, 1H-13C HSQC |
| Fructose | 4.03 (m) | 1 | Spike, TOCSY correlation, 1H-13C HSQC |
| Trigonelline | 4.42 (s); 8.07 (m); 8.83 (m); 9.12 (s) | 1 | TOCSY correlation |
| β-galactose | 4.57 (d, J = 7.84) | 1 | Spike |
| α-glucose | 5.22 (d, J = 3.76) | 1 | Spike, TOCSY correlation, 1H-13C HSQC |
| α-galactose | 5.25 (d, J = 3.96) | 1 | Spike |
| Turanose | 5.30 (d, J = 3.84) | 2 | - |
| Sucrose | 5.40 (d, J = 3.80) | 1 | Spike, TOCSY correlation, 1H-13C HSQC |
| Cytosine | 5.89 (d, J = 7.56); 7.86 (d, J = 8.64) | 2 | TOCSY correlation |
| Uridine | 5.91 (d, J = 3.60); 7.94 (d, J = 4.44) | 2 | TOCSY correlation |
| Epicatechin | 6.09 (d, J = 2.22); 6.21 (d, J = 2.22); 6.99 (Br.s); 7.10 (d, J = 1.76) | 2 | TOCSY correlation |
| Fumaric acid | 6.70 (s) | 2 | - |
| Tyrosine | 6.88 (m); 7.18 (m) | 1 | Spike, TOCSY correlation |
| Hydroxybenzoic acid | 6.93 (d, J = 8.80); 7.57 (d, J = 8.64) | 2 | TOCSY correlation |
| Phenylalanine | 7.37 (m) | 1 | Spike, TOCSY correlation, 1H-13C HSQC |
| Formic acid | 8.34 (s) | 1 | Spike |
| Unk 1 | 0.86 (d, J = 6.11); 3.11 (N.D.); 3.76 (N.D.) | 4 | TOCSY correlation |
| Unk 2 | 6.37 (m); 7.66 (d, J = 6.36) | 4 | TOCSY correlation |
| Unk 3 | 8.31 (s) | 4 | - |
| Unk 4 | 8.40 (s) | 4 | - |
| Unk 5 | 8.66 (d, J = 1.36) | 4 | - |
| Food Supplements | Ratio (AA Area/Choline Area) | Remarks |
|---|---|---|
| D.S.1 | 2.23 | - |
| D.S.2 | N.C. | AA detected but not quantifiable |
| D.S.3 | 0.96 | - |
| D.S.4 | N.C. | Choline not detected |
| D.S.5 | 2.21 | - |
| D.S.6 | 23.13 | - |
| D.S.7 | 1.83 | - |
| D.S.8 | 26.79 | - |
| D.S.9 | 10.39 | - |
| D.S.10 | 29.69 | - |
| Protons | Chemical Shift (ppm) | T1 Values (s) |
|---|---|---|
| H1 | 4.850 | 3.417 |
| H2 | 4.016 | 3.315 |
| H3 | 3.705 | 1.047 |
| Experiment n° | NS | D1 (s) | Aq Time (s) | Experiment Time (min) | H1 Peak Area (a.u.) | SNR |
|---|---|---|---|---|---|---|
| 1 | 4 | 20 | 2 | 2.56 | 31.58 | 628.96 |
| 2 | 4 | 20 | 4 | 3.12 | 31.68 | 608.34 |
| 3 | 4 | 20 | 8 | 3.44 | 31.78 | 617.52 |
| 4 | 8 | 20 | 2 | 4.24 | 63.10 | 858.63 |
| 5 | 8 | 20 | 4 | 4.48 | 63.05 | 829.83 |
| 6 | 8 | 20 | 8 | 5.36 | 63.56 | 859.87 |
| 7 | 16 | 20 | 2 | 7.20 | 126.00 | 1104.08 |
| 8 | 16 | 20 | 4 | 8.00 | 126.29 | 1170.88 |
| 9 | 16 | 20 | 8 | 9.20 | 126.40 | 1192.31 |
| 10 | 32 | 20 | 2 | 13.13 | 252.81 | 1716.74 |
| 11 | 32 | 20 | 4 | 14.25 | 253.20 | 1617.95 |
| 12 | 32 | 20 | 8 | 16.49 | 254.53 | 1665.14 |
| Slope | Intercept | R2 | Sy/x * |
|---|---|---|---|
| 14.373 | −0.8626 | 0.9998 | 0.5387 |
| NMR Tube | AA Concentration (mg/mL) | RSD (%) |
|---|---|---|
| 1 | 0.742 | 6.01% |
| 2 | 1.485 | 4.17% |
| 3 | 2.228 | 2.98% |
| 4 | 2.238 | 3.48% |
| 5 | 2.971 | 2.32% |
| 6 | 3.357 | 2.12% |
| 7 | 3.713 | 2.06% |
| 8 | 4.456 | 1.62% |
| 9 | 4.476 | 1.50% |
| 10 | 5.199 | 1.59% |
| Food Supplement | AA% in Label (w/w) | AA% Measured Using 1H qNMR (w/w) (mean ± SD, n = 2) |
|---|---|---|
| D.S.1 | 17.50% | 15.28 ± 0.12% |
| D.S.2 | 1.60% | N.Q. |
| D.S.3 | 8.25% | 4.10 ± 0.0% |
| D.S.4 | 15.87% | 14.09 ± 0.13% |
| D.S.5 | 10% | 9.77% ± 0.33% |
| D.S.6 | 12.50% | 11.90 ± 1.18% |
| D.S.7 | 11.33% | 9.35 ± 0.09% |
| D.S.8 | 7.89% | 8.22 ± 0.06% |
| D.S.9 | 6.66% | 6.65 ± 0.62% |
| D.S.10 | 7.50% | 7.04 ± 0.45% |
Publisher’s Note: MDPI stays neutral with regard to jurisdictional claims in published maps and institutional affiliations. |
© 2022 by the authors. Licensee MDPI, Basel, Switzerland. This article is an open access article distributed under the terms and conditions of the Creative Commons Attribution (CC BY) license (https://creativecommons.org/licenses/by/4.0/).
Share and Cite
Bourafai-Aziez, A.; Jacob, D.; Charpentier, G.; Cassin, E.; Rousselot, G.; Moing, A.; Deborde, C. Development, Validation, and Use of 1H-NMR Spectroscopy for Evaluating the Quality of Acerola-Based Food Supplements and Quantifying Ascorbic Acid. Molecules 2022, 27, 5614. https://doi.org/10.3390/molecules27175614
Bourafai-Aziez A, Jacob D, Charpentier G, Cassin E, Rousselot G, Moing A, Deborde C. Development, Validation, and Use of 1H-NMR Spectroscopy for Evaluating the Quality of Acerola-Based Food Supplements and Quantifying Ascorbic Acid. Molecules. 2022; 27(17):5614. https://doi.org/10.3390/molecules27175614
Chicago/Turabian StyleBourafai-Aziez, Asma, Daniel Jacob, Gwladys Charpentier, Emmanuel Cassin, Guillaume Rousselot, Annick Moing, and Catherine Deborde. 2022. "Development, Validation, and Use of 1H-NMR Spectroscopy for Evaluating the Quality of Acerola-Based Food Supplements and Quantifying Ascorbic Acid" Molecules 27, no. 17: 5614. https://doi.org/10.3390/molecules27175614
APA StyleBourafai-Aziez, A., Jacob, D., Charpentier, G., Cassin, E., Rousselot, G., Moing, A., & Deborde, C. (2022). Development, Validation, and Use of 1H-NMR Spectroscopy for Evaluating the Quality of Acerola-Based Food Supplements and Quantifying Ascorbic Acid. Molecules, 27(17), 5614. https://doi.org/10.3390/molecules27175614