Article

Synthesis, Characterization and Anticancer Efficacy Studies of Iridium (III) Polypyridyl Complexes against Colon Cancer HCT116 Cells

1
The First Affiliated Hospital, Jinan University, Guangzhou 510630, China
2
Department of Gastroenterology, People’s Hospital of Longhua, Shenzhen 518109, China
3
School of Pharmacy, Guangdong Pharmaceutical University, Guangzhou 510006, China
4
Department of Medical Research Center, People’s Hospital of Longhua, Shenzhen 518109, China
5
Department of Gastroenterology, School of Medicine, Guangzhou First People’s Hospital, South China University of Technology, Guangzhou 511458, China
*
Author to whom correspondence should be addressed.
Molecules 2022, 27(17), 5434; https://doi.org/10.3390/molecules27175434
Submission received: 20 July 2022 / Revised: 16 August 2022 / Accepted: 20 August 2022 / Published: 25 August 2022
(This article belongs to the Special Issue Synthesis and Evaluation of Novel Anticancer Agents)

Abstract

:
In this paper, two new iridium (III) complexes, [Ir(ppy)2(ipbp)](PF6) (Ir1) (ppy = 2-phenylpyridine, ipbp = 3-(1H-imidazo[4,5-f][1,10]phenanthrolin-2yl)-4H-chromen-4-one) and [Ir(bzq)2(ipbp)](PF6) (Ir2) (bzq = benzo[h]quinolone), were synthesized and characterized. The cytotoxicity of the complexes against human colon cancer HCT116 and normal LO2 cells was evaluated by the 3-(4,5-dimethylthiazol-2-yl)-2,5-diphenyltetrazolium bromide (MTT) method. The complexes Ir1 and Ir2 show high cytotoxic efficacy toward HCT116 cells with a low IC50 value of 1.75 ± 0.10 and 6.12 ± 0.2 µM. Interestingly, Ir1 only kills cancer cells, not normal LO2 cells (IC50 > 200 µM). The inhibition of cell proliferation and migration were investigated by multiple tumor spheroid (3D) and wound healing experiments. The cellular uptake was explored under a fluorescence microscope. The intracellular reactive oxygen species (ROS), change of mitochondrial membrane potential, glutathione (GSH) and adenine nucleoside triphosphate (ATP) were studied. Apoptosis and cell cycle arrest were performed by flow cytometry. The results show that the complexes induce early apoptosis and inhibit the cell proliferation at the G0/G1 phase. Additionally, the apoptotic mechanism was researched by Western blot analysis. The results obtained demonstrate that the complexes cause apoptosis in HCT116 cells through ROS-mediated mitochondrial dysfunction and the inhibition of PI3K/AKT signaling pathways.

1. Introduction

Cancer, which is a multi-factorial disease featured by the uncontrolled growth of cells in the body, is the second leading cause of deaths worldwide [1]. For many years, cancer has been considered as the result of DNA mutations prompting the activation of oncogenes or the inactivation of tumor suppressor genes [2]. Popovtzer et al. developed a unique method for the specific mechanical lysis of cancer cells using superparamagnetic iron oxide nanoparticle rotation under a weak alternating magnetic field [3,4]. Cisplatin and analogues are extensively used as anticancer drug. However, some inherent limitations still exist in these drugs, such as side effects, general toxicity such as nephrotoxicity, emetogenesis, nerve damage, hair loss, nausea and neurotoxicity and intrinsic acquired resistance [5,6,7,8,9,10,11,12]. These drawbacks in platinum-based anticancer drugs have stimulated more research efforts to investigate drugs based on other transition metals. In the past 20 years, among these metal complexes, the anticancer activity of Ru (II) complexes has been extensively studied [13,14,15,16,17,18]. In recent years, the research in the anticancer activity of iridium (III) complexes has been paid great attention and a number of iridium (III) complexes show potent anticancer efficacy [19,20,21,22,23,24,25,26,27,28]. Yuan et al. reported that two iridium (III) complexes, [Ir(piq)2(NPIP)](PF6) (piq = 1-phenylisoquinoline, NPIP = 2-(2-nitrophenyl)-1H-imidazo[4,5-f][1,10]phenanthroline) and [Ir(bzq)2(NPIP)](PF6) (bzq = benzo[h]quinolone), targeted the mitochondria and the complexes led to the loss of mitochondrial membrane potential (MMP), increased the intracellular ROS content and further induced apoptosis [21]. Complex [Ir(ppy)2L]+ (ppy = 2-phenylpyridine, L = 1,2-bis(diphenylphosphino)benzene) was specifically targeted to lysosomes in A549 cancer cells. This targeting caused lysosomal damage and the induction of ROS (reactive oxygen species) production in cancer cells [29]. In the reported iridium (III) complexes, the cancer cells are mainly lung cancer, liver cancer and gastric cancer. Few studies reported the efficacy of the iridium (III) complexes against colon cancer. As some chromenone (benzopyranone) derivatives are the subject of considerable pharmaceutical and chemical interest [30,31], it is possible for the complexes containing chromenone to show high anticancer activity. To verify our hypothesis and obtain much information of the effects of the iridium(III) complexes on anticancer activity, in this article, we chose ipbp (ipbp = 3-(1H-imidazo[4,5-f][1,10]phenanthrolin-2yl)-4H-chromen-4-one) [32] containing chromenone as a ligand to synthesize two new iridium (III) complexes, [Ir(ppy)2(ipbp)](PF6) (Ir1) (ppy = 2-phenylpyridine) and [Ir(bzq)2(ipbp)](PF6) (Ir2) (bzq = benzo[h]quinolone). The synthetic route for the complexes is shown in Scheme 1. The complexes were characterized by elemental analysis, HRMS, 1H NMR and 13C NMR. The anticancer activity in vitro was evaluated by the 3-(4,5-dimethylthiazol-2-yl)-2,5-diphenyltetrazolium bromide (MTT) method. As expected, the complexes Ir1 and Ir2 show high anticancer activity with a low IC50 value of 1.75 ± 0.1 and 6.12 ± 0.2 µM against colon HCT116 cancer cells. The apoptosis, cell cycle arrest, intracellular reactive oxygen species (ROS), the change of mitochondrial membrane potential and the expression of B-cell lymphoma-2 (Bcl-2) family proteins was explored by Western blot analysis. The results show that the complexes induce apoptosis through a ROS-mediated mitochondrial dysfunction and inhibition of the PI3K/AKT signaling pathways, and the complexes may be potent anticancer candidate drugs for colon cancer treatment.

2. Experimental

2.1. Materials and Method

IrCl3·3H2O was obtained from Boren Precious Metals Co., Ltd. (Kunming, China). 2-phenylpyridine (Hppy) and benzo[h]quinolone (bzq) were purchased from Beijing HWRK Chem Co., Ltd (Beijing). Deionized water was used in all experiments. Elemental analysis was performed by a PerkinElmer 240Q elemental analyzer (USA). For the cellular experiment, Fetal bovine serum (FBS) and Dulbecco’s Modified Eagle’s Medium (DMEM, Gibco, California, USA) purchased from Gibco were used in the cell culture process. Fetal Bovine Serum (FBS, Gibco, California, USA), newborn calf serum (NBCS). Fluorescent probes and assay kits were purchased from Beyotime Biotechnology (Shanghai, China). 1H and 13C NMR spectra were recorded on a Varian-500 spectrometer (500 MHz) using DMSO-d6 as solvent and tetramethylsilane (TMS) as an internal standard at room temperature. The HRMS spectra were measured by direct injection with Waters Xevo G2-XS QTof mass analyzer.

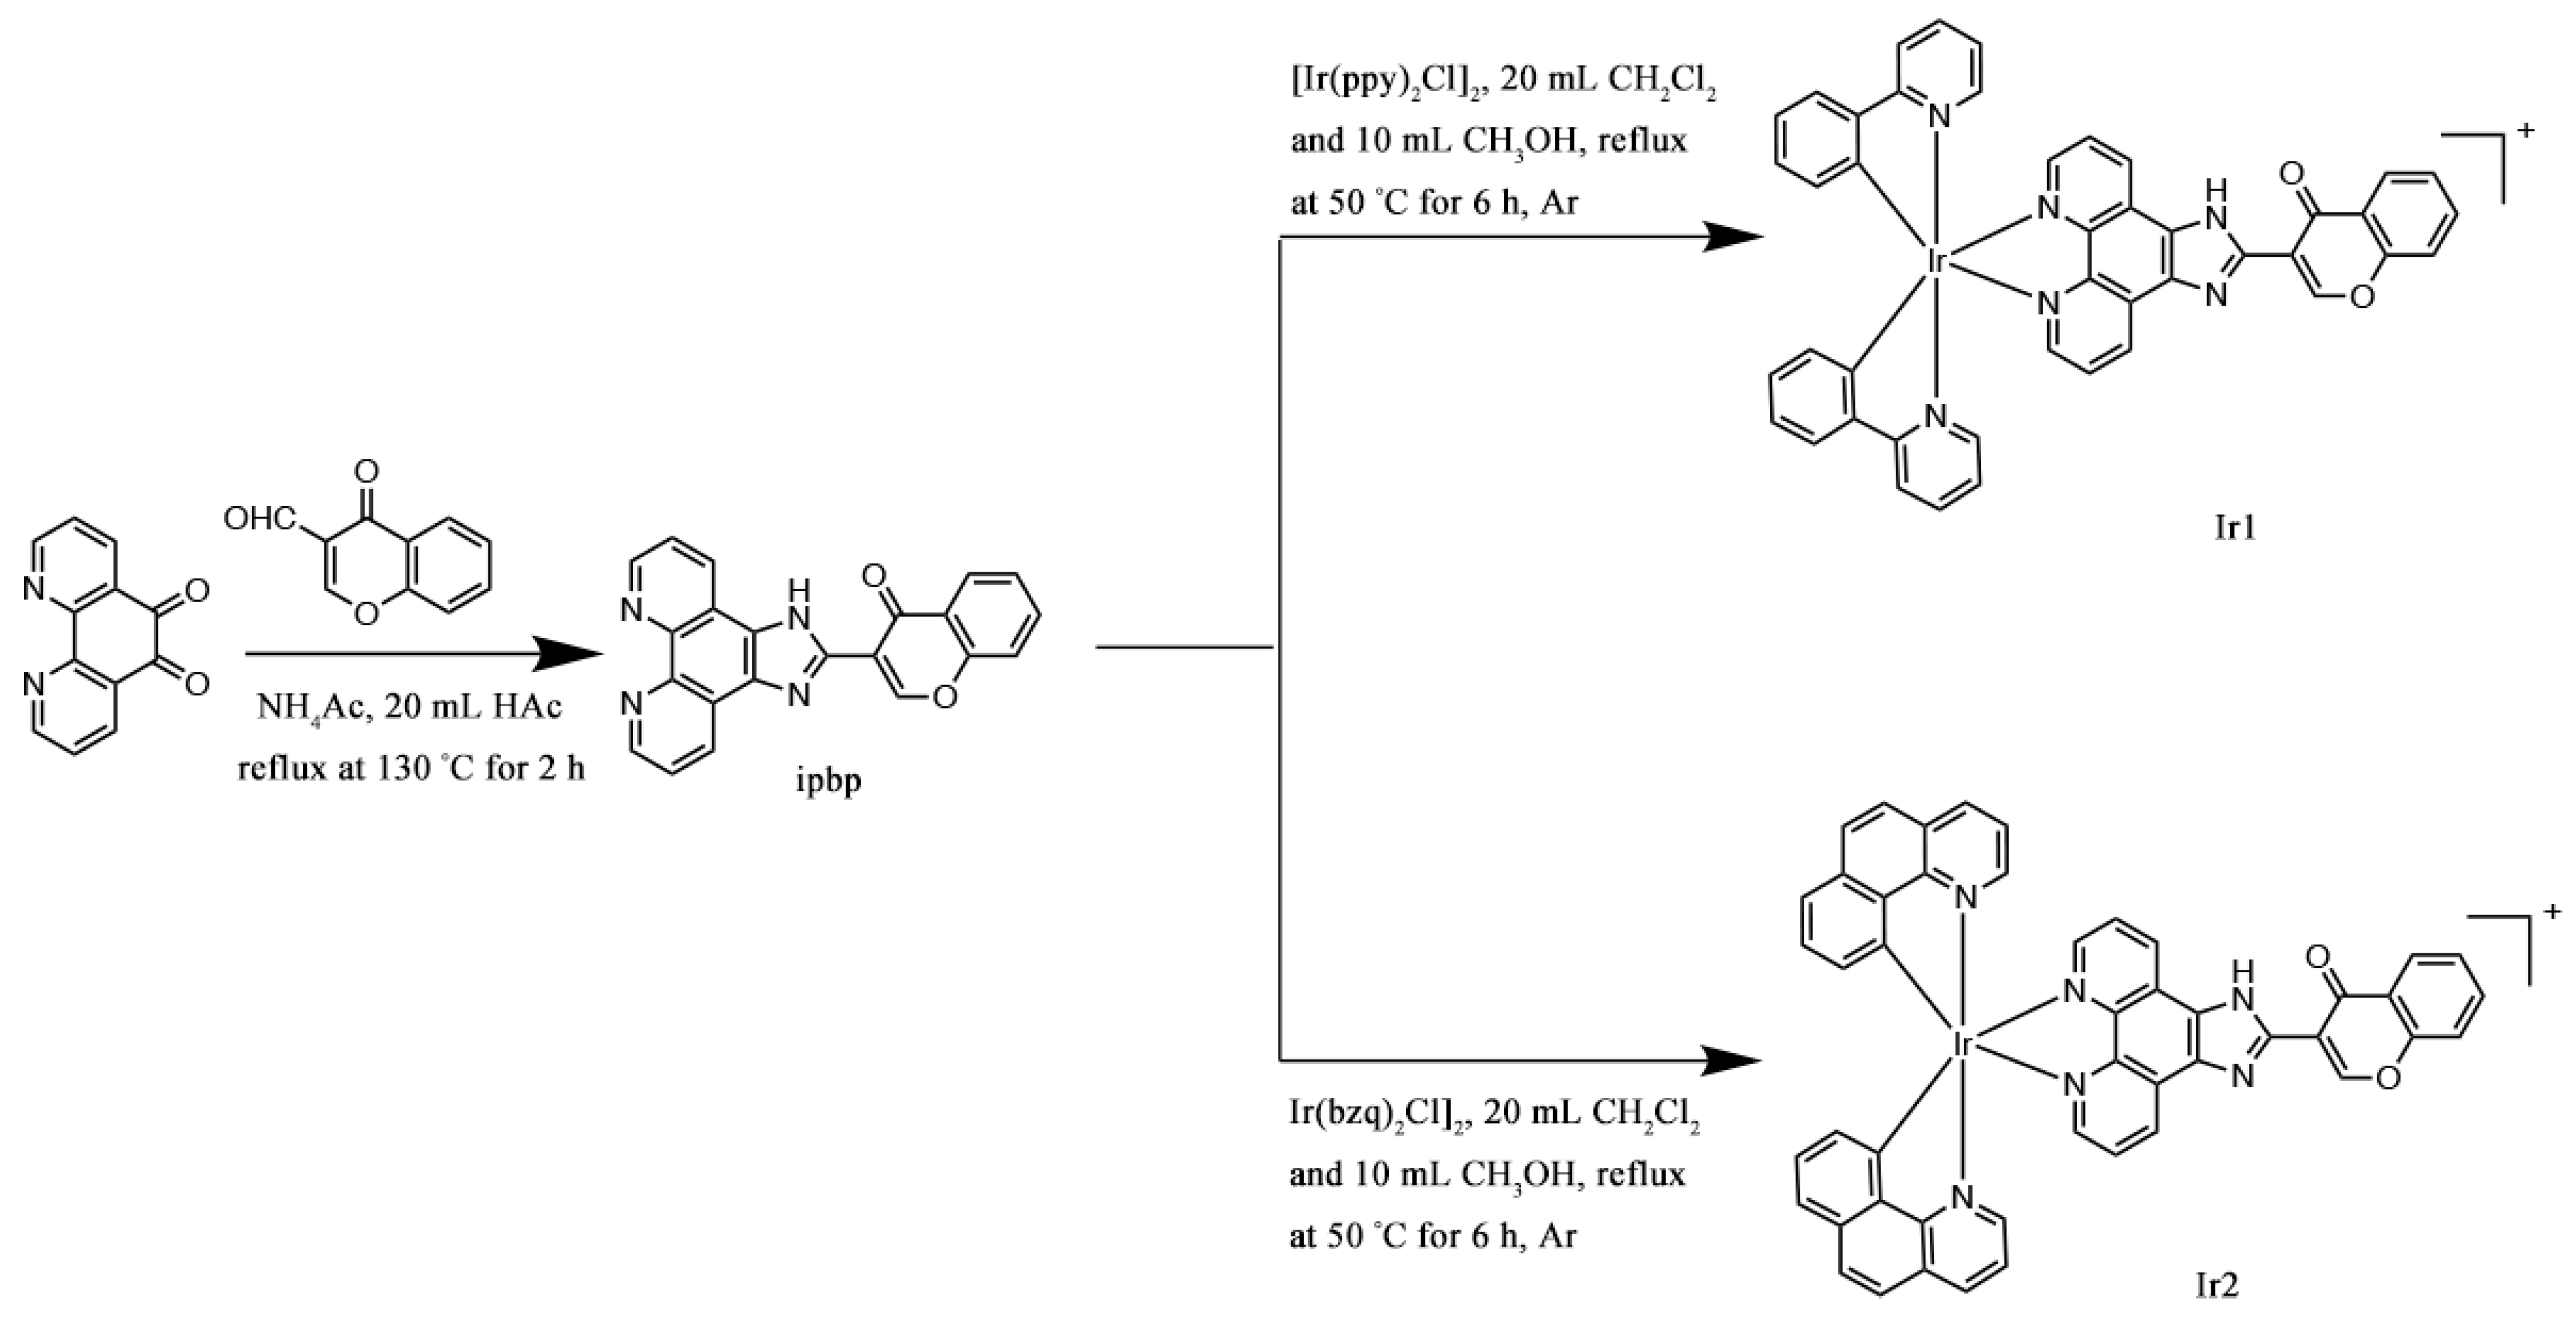
2.2. Synthesis of Complexes

2.2.1. Synthesis of [Ir(ppy)2(ipbp)](PF6) (Ir1)

[Ir(ppy)2Cl]2 [33] (0.232 g, 0.30 mmol) with ipbp (0.218 g, 0.60 mmol) [30] were mixed in a 150 mL of three-neck flask equipped with condenser and stirrer. Then 30 mL of dichloromethane and methanol (v/v = 2:1) was added into the flask. The mixture was heated and refluxed at 50 °C and stirred for 6 h under argon, a yellow solution was produced. After cooling to room temperature, excess NH4PF6 powder (0.75 g) was added into the above solution and continuously stirred for 1 h. After the solvent was removed under reducing pressure, a yellow precipitate was obtained. The precipitate was purified through a neutral alumina column with dichloromethane–acetone (v/v = 2:1) as eluent and a yellow band was collected. Then, the yellow solid was dried in vacuum conditions to obtain a yellow powder. Yield: 75% (0.468 g). Anal. Calc for C44H28N6O2IrPF6: C, 52.33, H, 2.79, N, 8.32%. Found: C, 52.62, H, 2.56, N, 8.58%. 1H NMR (DMSO-d6): 9.37 (s, 1H), 8.30 (dd, 1H, J = 1.5, J = 8.0 Hz), 8.26 (d, 2H, J = 8.5 Hz), 8.15 (dd, 2H, J = 1.0, J = 5.0 Hz), 8.09–8.06 (m, 2H), 7.95 (d, 2H, J = 7.5 Hz), 7.89–7.84 (m, 4H), 7.67 (t, 1H, J = 7.5 Hz), 7.50 (d, 2H, J = 5.5 Hz), 7.06 (t, 2H, J = 7.5 Hz), 7.00–6.94 (m, 6H), 6.30 (d, 2H, J = 7.5 Hz). 13C NMR (DMSO-d6, 125 MHz): 176.39, 168.91, 160.48, 157.68, 152.37, 151.15, 150.48, 148.44, 146.24, 146.04, 140.71, 137.17, 133.25, 132.28, 129.03, 128.63, 127.34, 127.07, 125.84, 125.42, 124.41, 121.97, 120.86, 116.65. HRMS (CH3CN): m/z = 866.2824 [(M−PF6)+].

2.2.2. Synthesis of [Ir(bzq)2(ipbp)](PF6) (Ir2)

This complex was synthesized according to the method described as Ir1, with [Ir(bzq)2Cl]2 [33] in place of [Ir(ppy)2Cl]2. Yield: 76% (0.496 g). Anal. Calc for C48H28N6O2IrPF6: C, 54.49, H, 2.67, N, 7.94%. Found: C, 54.25, H, 2.89, N, 8.16%. 1H NMR (DMSO-d6): 9.36 (s, 1H), 8.52 (d, 2H, J = 8.5 Hz), 8.30 (dd, 2H, J = 1.5, J = 8.0 Hz), 8.13 (d, 2H, J = 4.5 Hz), 8.01–7.95 (m, 6H), 7.89 (d, 2H, J = 8.5 Hz), 7.85–7.74 (m, 4H), 7.58 (d, 2H, J = 6.0 Hz), 7.45–7.43 (m, 2H), 7.22 (t, 2H, J = 7.5 Hz), 6.31 (d, 2H, J = 7.5 Hz). 13C NMR (DMSO-d6, 125 MHz): 174.85, 158.92, 158.29, 156.88, 156.12, 149.58, 149.36, 148.66, 147.66, 146.83, 140.84, 138.00, 135.59, 134.22, 130.18, 129.94, 129.00, 127.17, 127.03, 125.82, 124.69, 123.93, 123.23, 120.82, 119.30, 115.27. HRMS (CH3CN): m/z = 913.1222 [(M–PF6)+].

2.3. Cell Culture

HCT-116 (human colon cancer) and human normal liver LO2 cells were purchased from the Tumor Center of Sun Yat-Sen University (Guangzhou, China) and were grown in DMEM culture solution. To provide a suitable environment to sustain cell growth, 100 μg·mL−1 streptomycin, 100 U·mL−1 penicillin from Beyotime Institute of Biotechnology (Shanghai, China) and 10% FBS were added to the medium. The cell was maintained in the CO2 incubator.

2.4. Cell Viability Determination

The complexes Ir1 and Ir2 were dissolved in DMSO and the final concentration of DMSO was 0.05% in all the cell experiments. The cell viability of HCT116 cells exposure to the different concentration complexes Ir1 and Ir2 (1.56–100 µM) was performed according to MTT (3-(4,5-dimethylthiazol-2-yl)-2,5-diphenyltetrazolium bromide) method [34]. Briefly, HCT116 cells (4 × 10³ cells per well) were placed into 96-well plates and cultured in the incubator (5% CO2) at 37 °C for 24 h. Then the cells were treated with different concentrations of the complexes for 48 h, the supernate was removed and 90 μL of serum-free culture medium and 10 μL of MTT (5.0 mg/mL) were added to treat cells for 4 h. The optical density at 490 nm was measured by microplate reader and finally the mean IC50 values (three independent experiments) were obtained through SPSS software analysis.
Note: In the following cell experiments, IC50 concentration of Ir1 and Ir2 are 1.75 and 6.12 μM, respectively.

2.5. Cellular Uptake Studies

HCT116 cells were incubated in culture medium at a density of 5 × 10⁴ cells/well in 12-well plates overnight. The cells were treated with IC50 concentration of Ir1 (1.75 μM) and Ir2 (6.12 μM) and incubated in an incubator at 37 °C and 5% CO2 for 4 h, HCT116 cells were stained with DAPI and incubated at 37 °C for 20 min. The cells were photographed under the confocal microscopy (Leica, TCS SP8 SR: Wetzlar, Germany).

2.6. Studies of Inhibitory Efficacy in 3D Model

The 3D model was performed according to the literature [21]. In brief, 130 μL of matrigel matrix (10 mg/mL) was added into a pre-chilled confocal Petri dish at 37 °C for 30 min to form gel, then 150 μL of the cell suspension was added into the gel at 37 °C for 30 min. A total of 150 μL of matrigel substrate mixture was slowly added into the confocal Petri dishes to form gel–cell–gel structure and incubated for 7 consecutive days. Then, IC50 concentrations of Ir1 and Ir2 were added to the confocal Petri dishes for 24 h, the cells were dyed with Live/Dead Cell Kit (Meilum Biotechnology, Dalian) and Hoechst and the cells were washed three times with cool PBS and observed under a confocal microscope (Leica, TCS SP8 SR: Wetzlar, Germany).

2.7. Colony-Forming Assay

HCT116 cells in logarithmic phase were trypsinized and placed into a 6-well-plate (200 cells/well). After the cells grow adherently, the IC50 concentration of Ir1 and Ir2 were used to treat the cells for 24 h. After incubation, the culture solution was replaced with fresh culture solution. Then, the cells were continuously cultured for 10 days and the medium was replaced every 2 days during the colony growth period. After fixing with 70% ethanol and staining using crystal violet (m/v, 0.1%) for 25 min, they were rinsed twice with PBS and the colony was observed.

2.8. Wound Scratch Studies

HCT116 cells (1 × 10⁴ cells /well) were seeded in 6-well plate overnight. After the cell density reached 70%, the pipette tip was used to scratch, then, using phosphate buffer solution (PBS), the wells were washed three times to remove the cell debris. Then the wells were cultured in serum-free medium and incubated with IC50 concentration of the complexes at 0 and 48 h. Finally, the cells were photographed under an inverted microscope (Olympus Co.: Tokyo, Japan).

2.9. Cell Cycle Arrest Studies

Exponentially growing HCT116 cells were exposed to the IC50 concentrations of Ir1 and Ir2 for 24 h and the cells were trypsinized. After that, the cells were washed three times with cold phosphate buffer solution (PBS) and fixed with 70% ethanol overnight. Then the cells were dyed with 0.1% Triton X-100 (Biofroxx, Germany), 20 μL of PI (propidium iodide, 0.02 mg/mL) and 20 µL of RNase (ribonuclease, 0.2 mg/mL). Finally, the cell cycle distribution was determined by FACSCalibur flow cytometry (Beckman Dickinson & Co., Franklin Lakes, New Jersey, USA).

2.10. Detection of Intracellular Reactive Oxygen Species

2′,7′-dichlorodihydrofluorescein diacetate (DCHF-DA) was utilized to measure the reactive oxygen species (ROS) accumulation. In brief, HCT116 cells (1 × 10⁵ cells/well) were seeded into a blank 6-well plate and maintained in a constant temperature incubator for 24 h, the cells were treated with IC50 concentration of Ir1 and Ir2 for 24 h and then the cells were dyed with DCHF-DA for 30 min. The cells were washed three times with PBS solution and, finally, the cells were observed and the fluorescence intensity was quantified.

2.11. Glutathione (GSH) Measurement

HCT116 cells (5 × 10⁵ cells per well) were seeded in six-well plates overnight. After treatment with IC50 or 2IC50 concentrations of Ir1 and Ir2 for 24 h, the cells were trypsinized and washed three times with PBS. Glutathione (GSH) assay was carried out with GSH Assay Kit (Beyotime Biotechnology: Shanghai, China) according to the manufacturer’s protocol, the absorbance at 412 nm was measured and then the GSH content was calculated.

2.12. Mitochondrial Membrane Potential Detection

HCT116 cells were seeded into 12-well-plate (1.2 × 10⁵ cell/well) at 37 °C in the CO2 (5%) incubator overnight. The cells were exposed to IC50 concentration of Ir1 and Ir2 for 24 h, then the cells were washed three times with cool PBS to get rid of the residual complexes. Afterwards, the cells were stained with JC-1 (5,5′,6,6′-tetrachloro-1,1′,3,3′-tetraethylimidacarbocyanine iodide, 1 μg·mL-1) for 25 min. Finally, the cells were observed under an ImageXpress Micro XLS system (MD company, San Jose, California, USA).

2.13. Assay of ATP Content

HCT116 cells (5 × 10⁵ cell/well) were plated in a 6-well plate overnight. The cells were incubated with IC50 and 2IC50 concentrations of complexes Ir1 and Ir2 for 24 h. The cells were lysed and collected by centrifugation and the supernatant was extracted for subsequent determination. The ATP content of the sample was determined by an enhanced ATP (Adenosine triphosphate) detection kit (Beyotime Biotechnology: Shanghai, China). The concentration of ATP was calculated.

2.14. Cell Apoptosis Studies

HCT116 cells were seeded into six-well plates at a density of 5 × 10⁵ cells per well overnight. The cells were cultured in Dulbecco’s Modified Eagle Medium (DMEM, Gibco, California, USA) containing 10% of FBS and incubated at 37 °C (5% CO2) for 24 h. The medium was removed and replaced with a new medium containing IC50 or 2IC50 concentration of Ir1 and Ir2 for 24 h. Then HCT116 cells were harvested and washed with PBS three times. The cells were dyed with 50 μg/mL propidium iodide (PI) and 1 mg/mL Annexin V (Beyotime, Sahnghai, China) in the dark for 10 min. The percentage of living, early and late apoptotic cells was determined by a FACS Calibur flow cytometry (Beckman Dickinson & Co., Franklin Lakes, New Jersey, USA).

2.15. Expression of Bcl-2 Family Proteins

To quantitatively evaluate the expression of B-cell lymphoma-2 (Bcl-2) family proteins, Western blot was used. After the treatments, the total cell proteins were obtained by lysing HCT116 cells with RIPA (Radio Immunoprecipitation Assay, Cell Signaling Technology, Massachusetts, USA) lysis buffer containing 1% phenylmethanesulfonyl fluoride (PMSF). After centrifugation (13,000 × g, 10 min, 4 °C), the supernatant was gathered. The absorbance values of the protein were measured at 570 nm and diluted to the same concentration with water. Equally denatured protein samples (20 μL protein/lane) were electrophoresed by SDS-PAGE and transferred into polyvinylidene fluoride (PVDF, Millipore: Burlington, MA, USA) membranes. Five percent non-fat milk was used to block the membrane for 3 h in Tris-buffered solution and then maintained at 4 °C overnight. The membranes were then rinsed four times in TBST buffer (150 mM NaCl, 20 mM Tris-HCl, 0.05% Tween 20, pH = 8.0) with shaking and subsequently exposed to conjugated secondary antibodies at 4 °C for 70 min. The residual secondary antibodies were removed by washing with TBST, and each sample was visualized under a computerized imaging system using an enhanced chemiluminescence (ECL) detection kit. Apoptosis-related proteins, including caspase 3, phosphatidylinositol 3-kinase (PI3K), protein kinase B (AKT), Bcl-2-associated x protein (Bax), Bcl-2, PARP (poly ADP-ribose polymerase) and cleaved PARP were quantitatively determined.

2.16. Immunostaining Analysis

After HCT116 cells were seeded in 12-well plates and the density reached 70%, the cells were co-incubated with IC50 concentration of Ir1 and Ir2 for 24 h. The cells were fixed with 70% ethanol and washed with PBS three times, then the immunofluorescence blocking solution was added to block the cells for 1 h. The primary antibody was added and incubated overnight at 4 °C. After that, the fluorescent secondary antibody was added and incubated in dark for 1 h. Finally, the cell nuclei were stained with Hoechst (Beyotime, Shanghai, China) and observed under ImageXpress R Micro XLS System (MD company, San Jose, California, USA).

2.17. Data Analysis

All data were expressed as means ± SD. Statistical significance was evaluated by a t-test, differences are significant when a * p < 0.05, ** p < 0.01, *** p < 0.001.

3. Results and Discussion

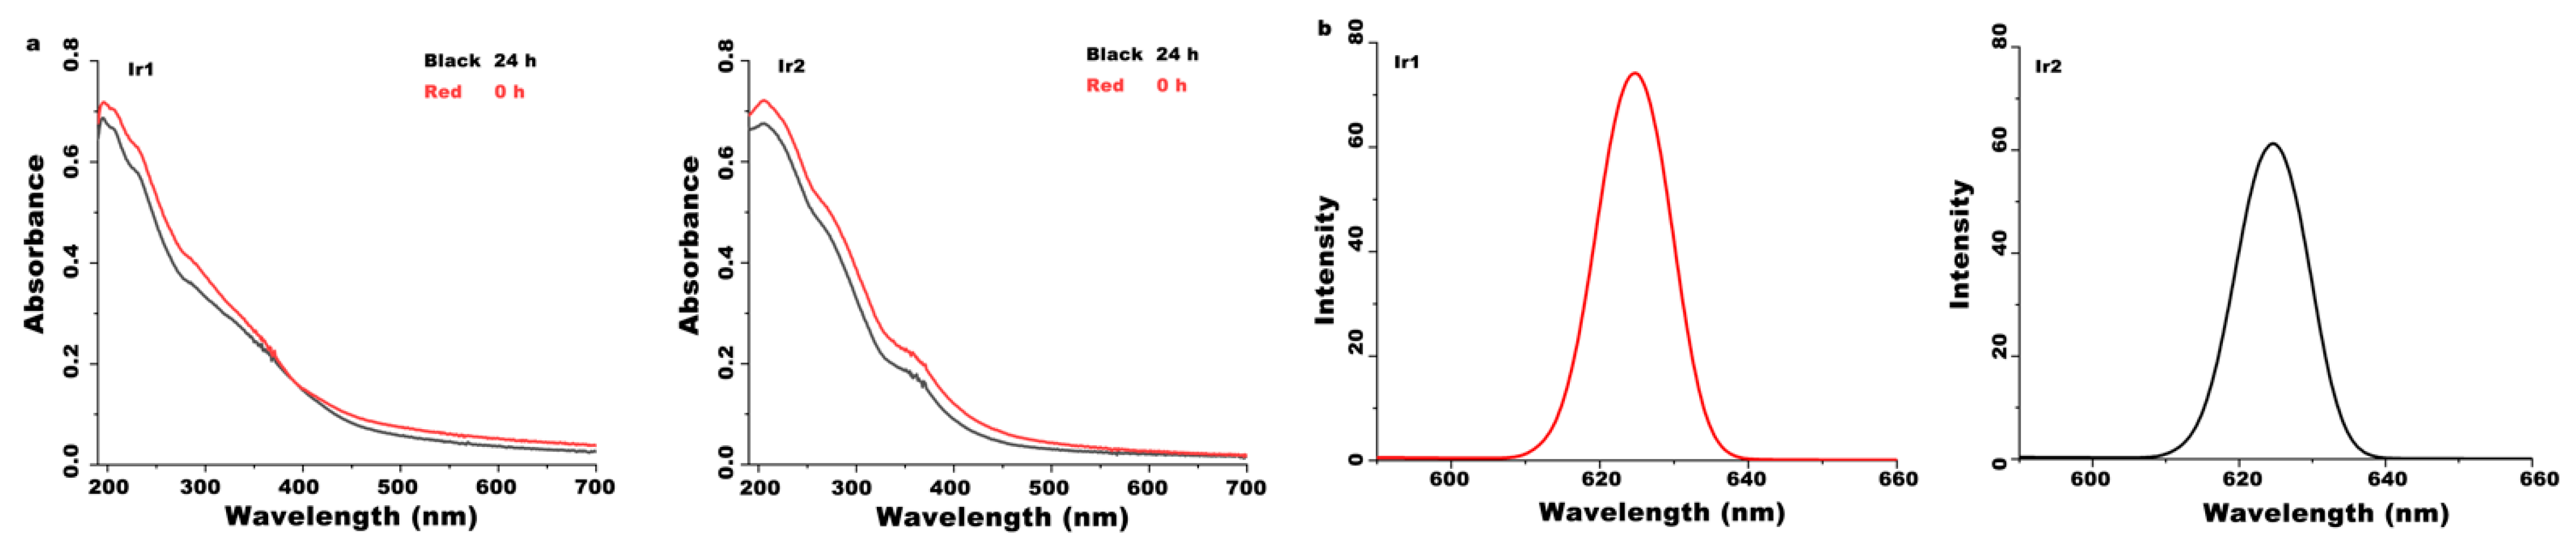
3.1. Synthesis and Characterization

The ligand ipbp was prepared according to the literature [32]. The complexes Ir1 and Ir2 were synthesized by the reaction of [Ir(ppy)2Cl]2 or [Ir(bzq)2Cl]2 with ipbp in dichloromethane and methanol. The complexes were purified by column chromatography with dichloromethane/acetone as the eluent and characterized by elemental analysis, HRMS, 1H NMR and 13C NMR. The determined molecular weight is line with the expected value in the HRMS spectra. In the 13C NMR spectra, the peaks of 176.39 ppm for Ir1 and 174.85 ppm for Ir2 are attributed to the carbon atom of the carboxyl group. In the 1H NMR spectra, the peaks of 9.37 (s, 1H) for Ir1 and 9.36 (s, 1H) for Ir2 are assigned to the hydrogen atom Ha. The peak for the proton on the nitrogen atom of the imidazole ring was not observed. This may be caused by metal coordination inducing electron deficiency in the ligand, therefore, the NH proton of the imidazole ring is very active and easy to be exchanged between the two imidazole nitrogen atoms in the solution [21,35]. The stability of the complexes was determined by the UV-Vis spectra in PBS solution at 0 and 24 h. As shown in Figure 1a, the shape of the peaks has no change, indicating that the complexes are stable in PBS solution. The complexes can luminesce in PBS solution at room temperature (Figure 1b), with a maximum appearing at 624 nm (λex = 310 nm) for Ir1 and 625 nm (λex = 310 nm) for Ir2, respectively.

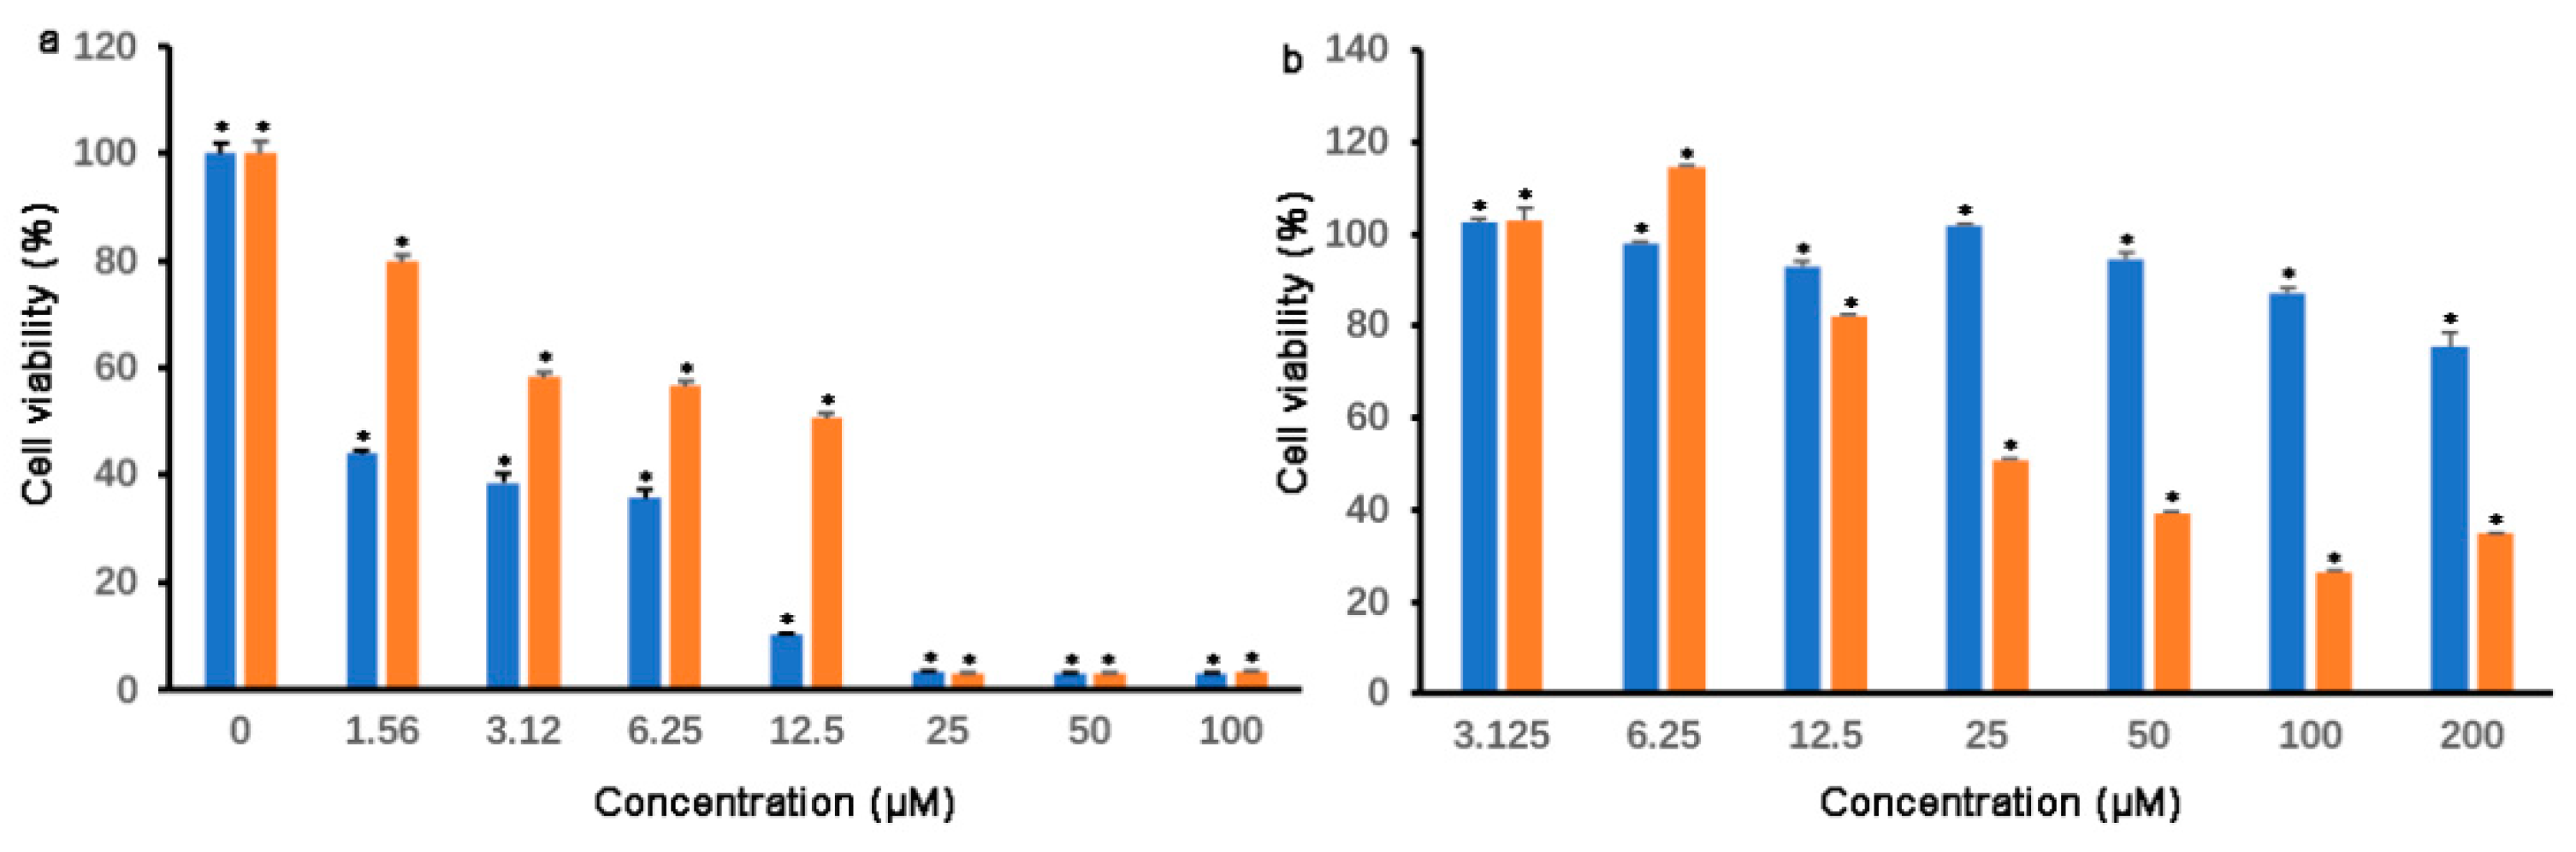
3.2. Cell Viability and IC50 Determination

The ability of the complexes to kill cancer cells was evaluated in terms of cell viability through the 3-(4,5-dimethylthiazole)-2,5-diphenyltetraazolium bromide (MTT) method. As shown in Figure 2a, HCT116 cells were treated with different concentrations (1.56, 3.12, 6.25, 12.5, 25, 50, 100 µM) of Ir1 and Ir2 for 48 h and with an increasing amount of the complexes, the cell viability decreased gradually. Therefore, the complexes showed a concentration-dependent inhibition of cell proliferation. The IC50 values (concentration of the compound inhibiting cell growth by 50%) were obtained according to the cell viability, and complexes Ir1 and Ir2 exhibited very high cytotoxicity toward HCT116 cells with a low IC50 value of 1.75 ± 0.10 and 6.12 ± 0.20 µM, respectively. Moreover, Ir1 showed a stronger ability to kill HCT116 cells than Ir2. Comparing the IC50 value with the cisplatin (IC50 = 15.6 ± 0.4 µM) [36], the complexes show higher cytotoxic activity against HCT116 cells than the cisplatin and gold(III) porphyrin complex (Au(III)porphyrin-adamantane chloride) (IC50 = 5.3 µM) [37]. The cytotoxic activity of Ir1 toward HCT116 cells is comparable with that of the ruthenium metal complex [Ru(phpy)(bpy)2]Cl (phpy = 2-phenylpyridine, bpy = 2,2′-bipyridine, IC50 = 1.6 ± 0.6 µM) [38]. In addition, the IC50 value of Ir2 toward normal LO2 cells was 40.8 ± 0.3 µM, while the IC50 value of Ir1 against LO2 cells was more than 200 µM, which indicated that complex Ir1 only kills HCT116 cells, not normal LO2 cells.

3.3. Cell Uptake Studies

The prerequisite for the complexes exerting anticancer activity is that the complexes can enter the cells, hence, we first investigated whether the complexes can effectively enter the cancer cells. As shown in Figure 3, during the exposure of HCT116 cells to IC50 concentrations of Ir1 and Ir2 for 4 h, the cell nuclei were stained blue with 2-(4-amidinophenyl)-6-indolecarbamidine dihydrochloride (DAPI), while the complexes emitted weak green fluorescence. The merge indicates that the complexes can enter the cells and mainly accumulate in the cytoplasm. The results demonstrate that the complexes can be successfully endocytosed by the cells.

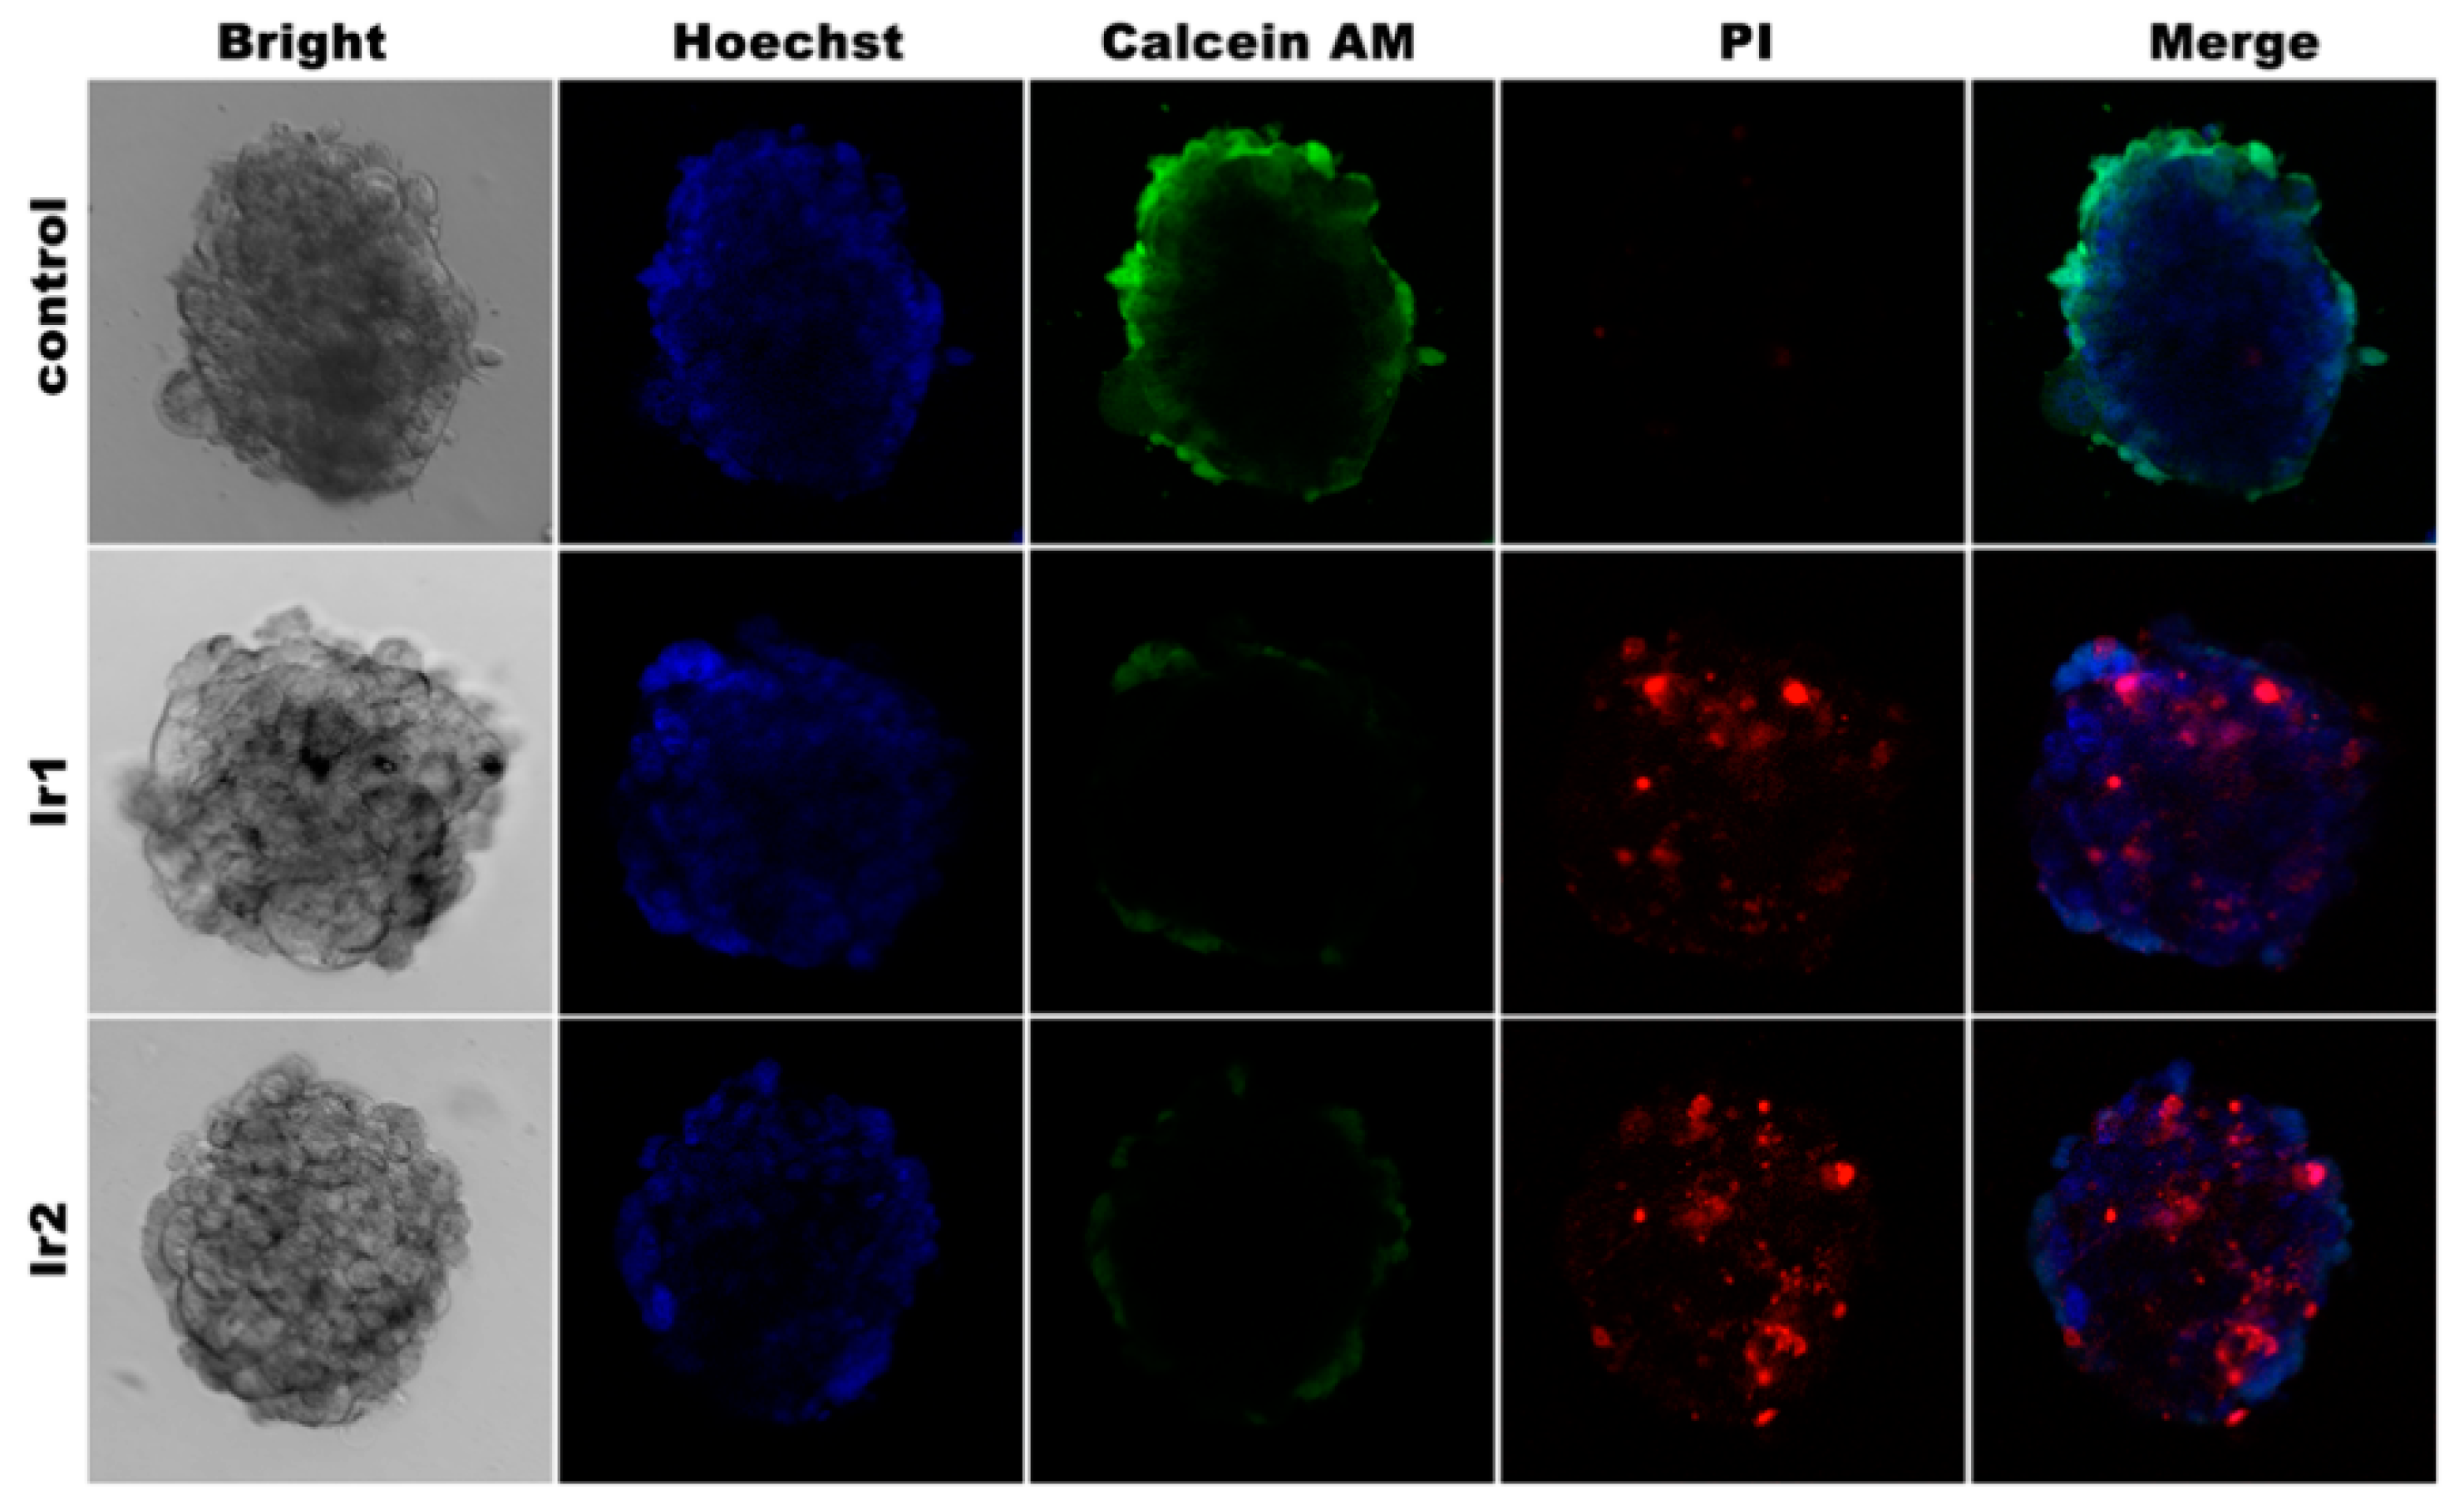
3.4. Cell 3D Model Studies

Multicellular tumor spheroid cell death was detected using the cell-impermeant indicator Calcein-acetoxymethylester (Calcein-AM) and the propidium iodide (PI) double-staining method. The living cells were stained green with Calcein-AM and the dead cells were stained red with PI. As shown in Figure 4, in the treatment of HCT116 cells with an IC50 concentration of Ir1 and Ir2 for 24 h, we found that the number of the living cells (green) was reduced and the dead cells (red) increased, compared with that in the control group. The results show that the complexes can effectively inhibit the cell proliferation.

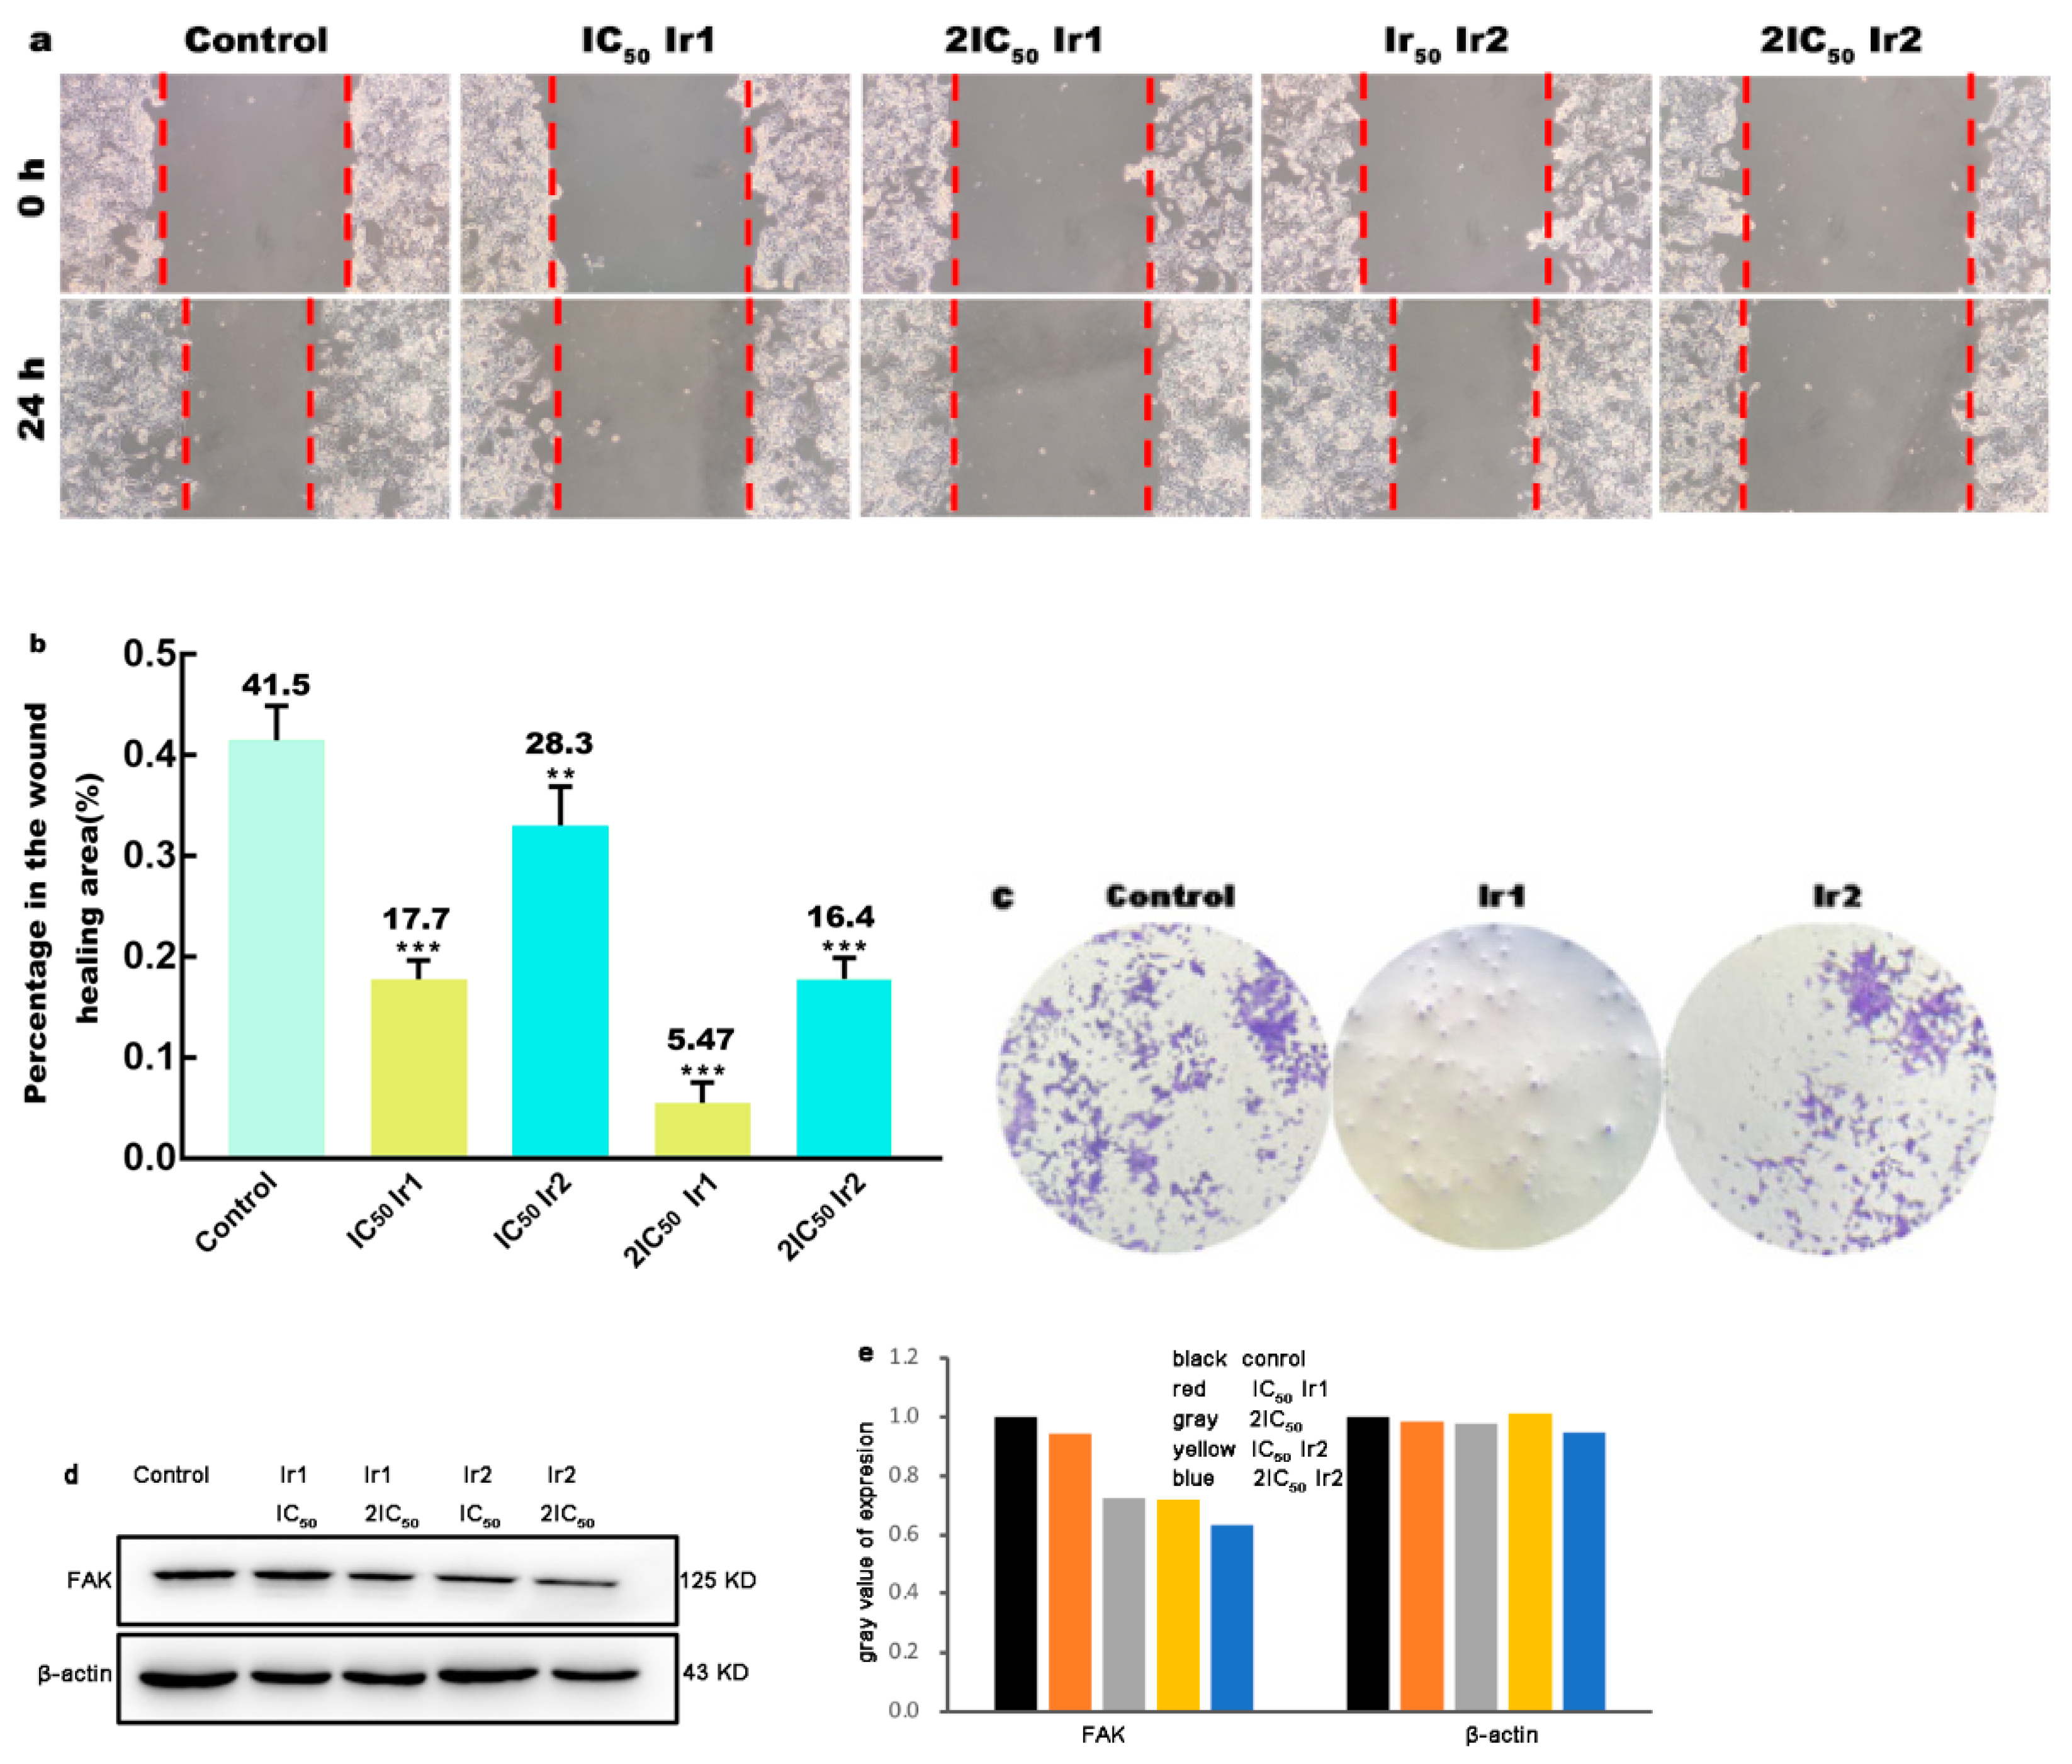
3.5. Wound Healing Studies

Metastasis is an intricate process and it involves a series of changes in extracellular matrix digestion, cell migration and invasion [39]. The important role of focal adhesion kinase (FAK) protein in various biological activities is promoting tumor progression and metastasis through targeting the cancer or stromal cells. The ability of the complexes to inhibit cell invasion and metastasis was studied through wound healing experiments. As shown in Figure 5a, the widths reduced in the Ir1- or Ir2-treated groups compared to those in the control after HCT116 cells were incubated with IC50 or 2IC50 concentrations of the complexes for 24 h, which reveals that the complexes can inhibit cell invasion. This is also confirmed in Figure 5b where the percentage in the wound healing area decreased in the complex-treated groups compared with that in the control group. Cell colony-forming was also investigated, as shown in Figure 5c where the treatment of HCT116 cells with IC50 concentrations of Ir1 and Ir2 for 24 h resulted in an obvious decrease in the number of the cells, which indicates that the complexes block cell proliferation. The effect of the complexes on the expression of FAK was explored, as shown in Figure 5d,e, where the HCT116 cells were treated with an IC50 or 2IC50 concentration of the complexes for 24 h. We discovered that the complexes downregulated the expression of the FAK protein, which further verified that the complexes can effectively inhibit cell invasion and metastasis.

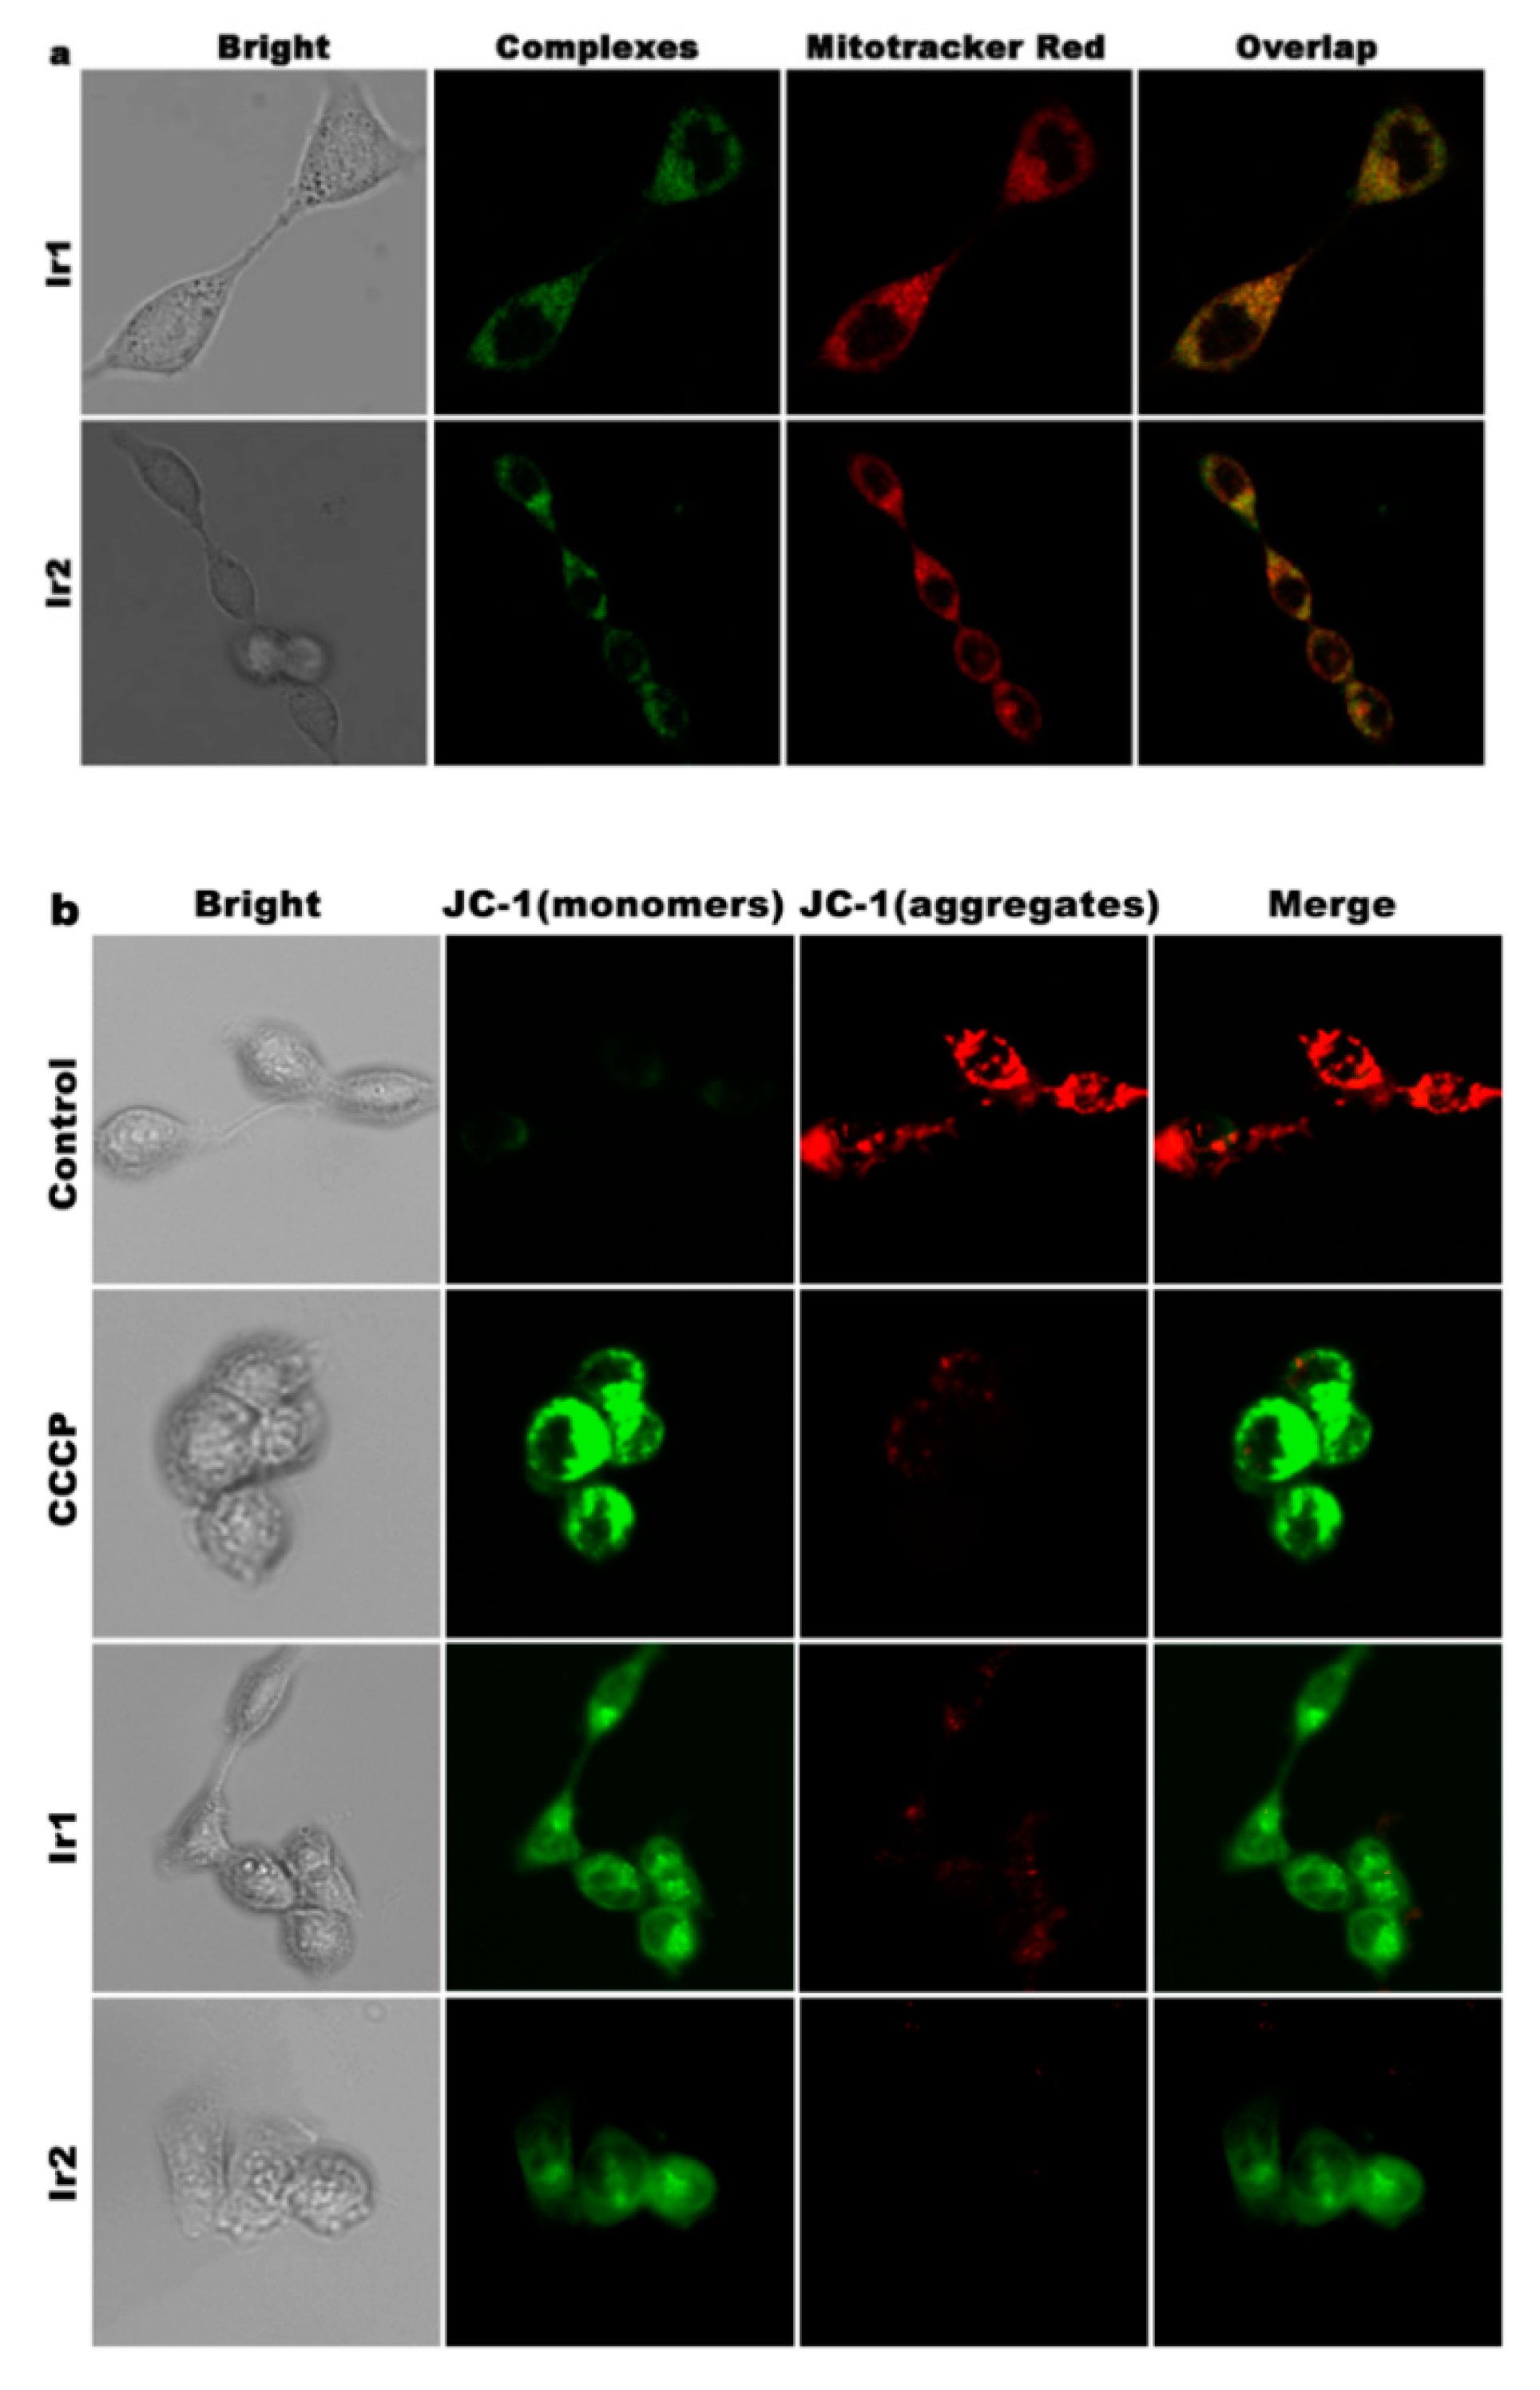
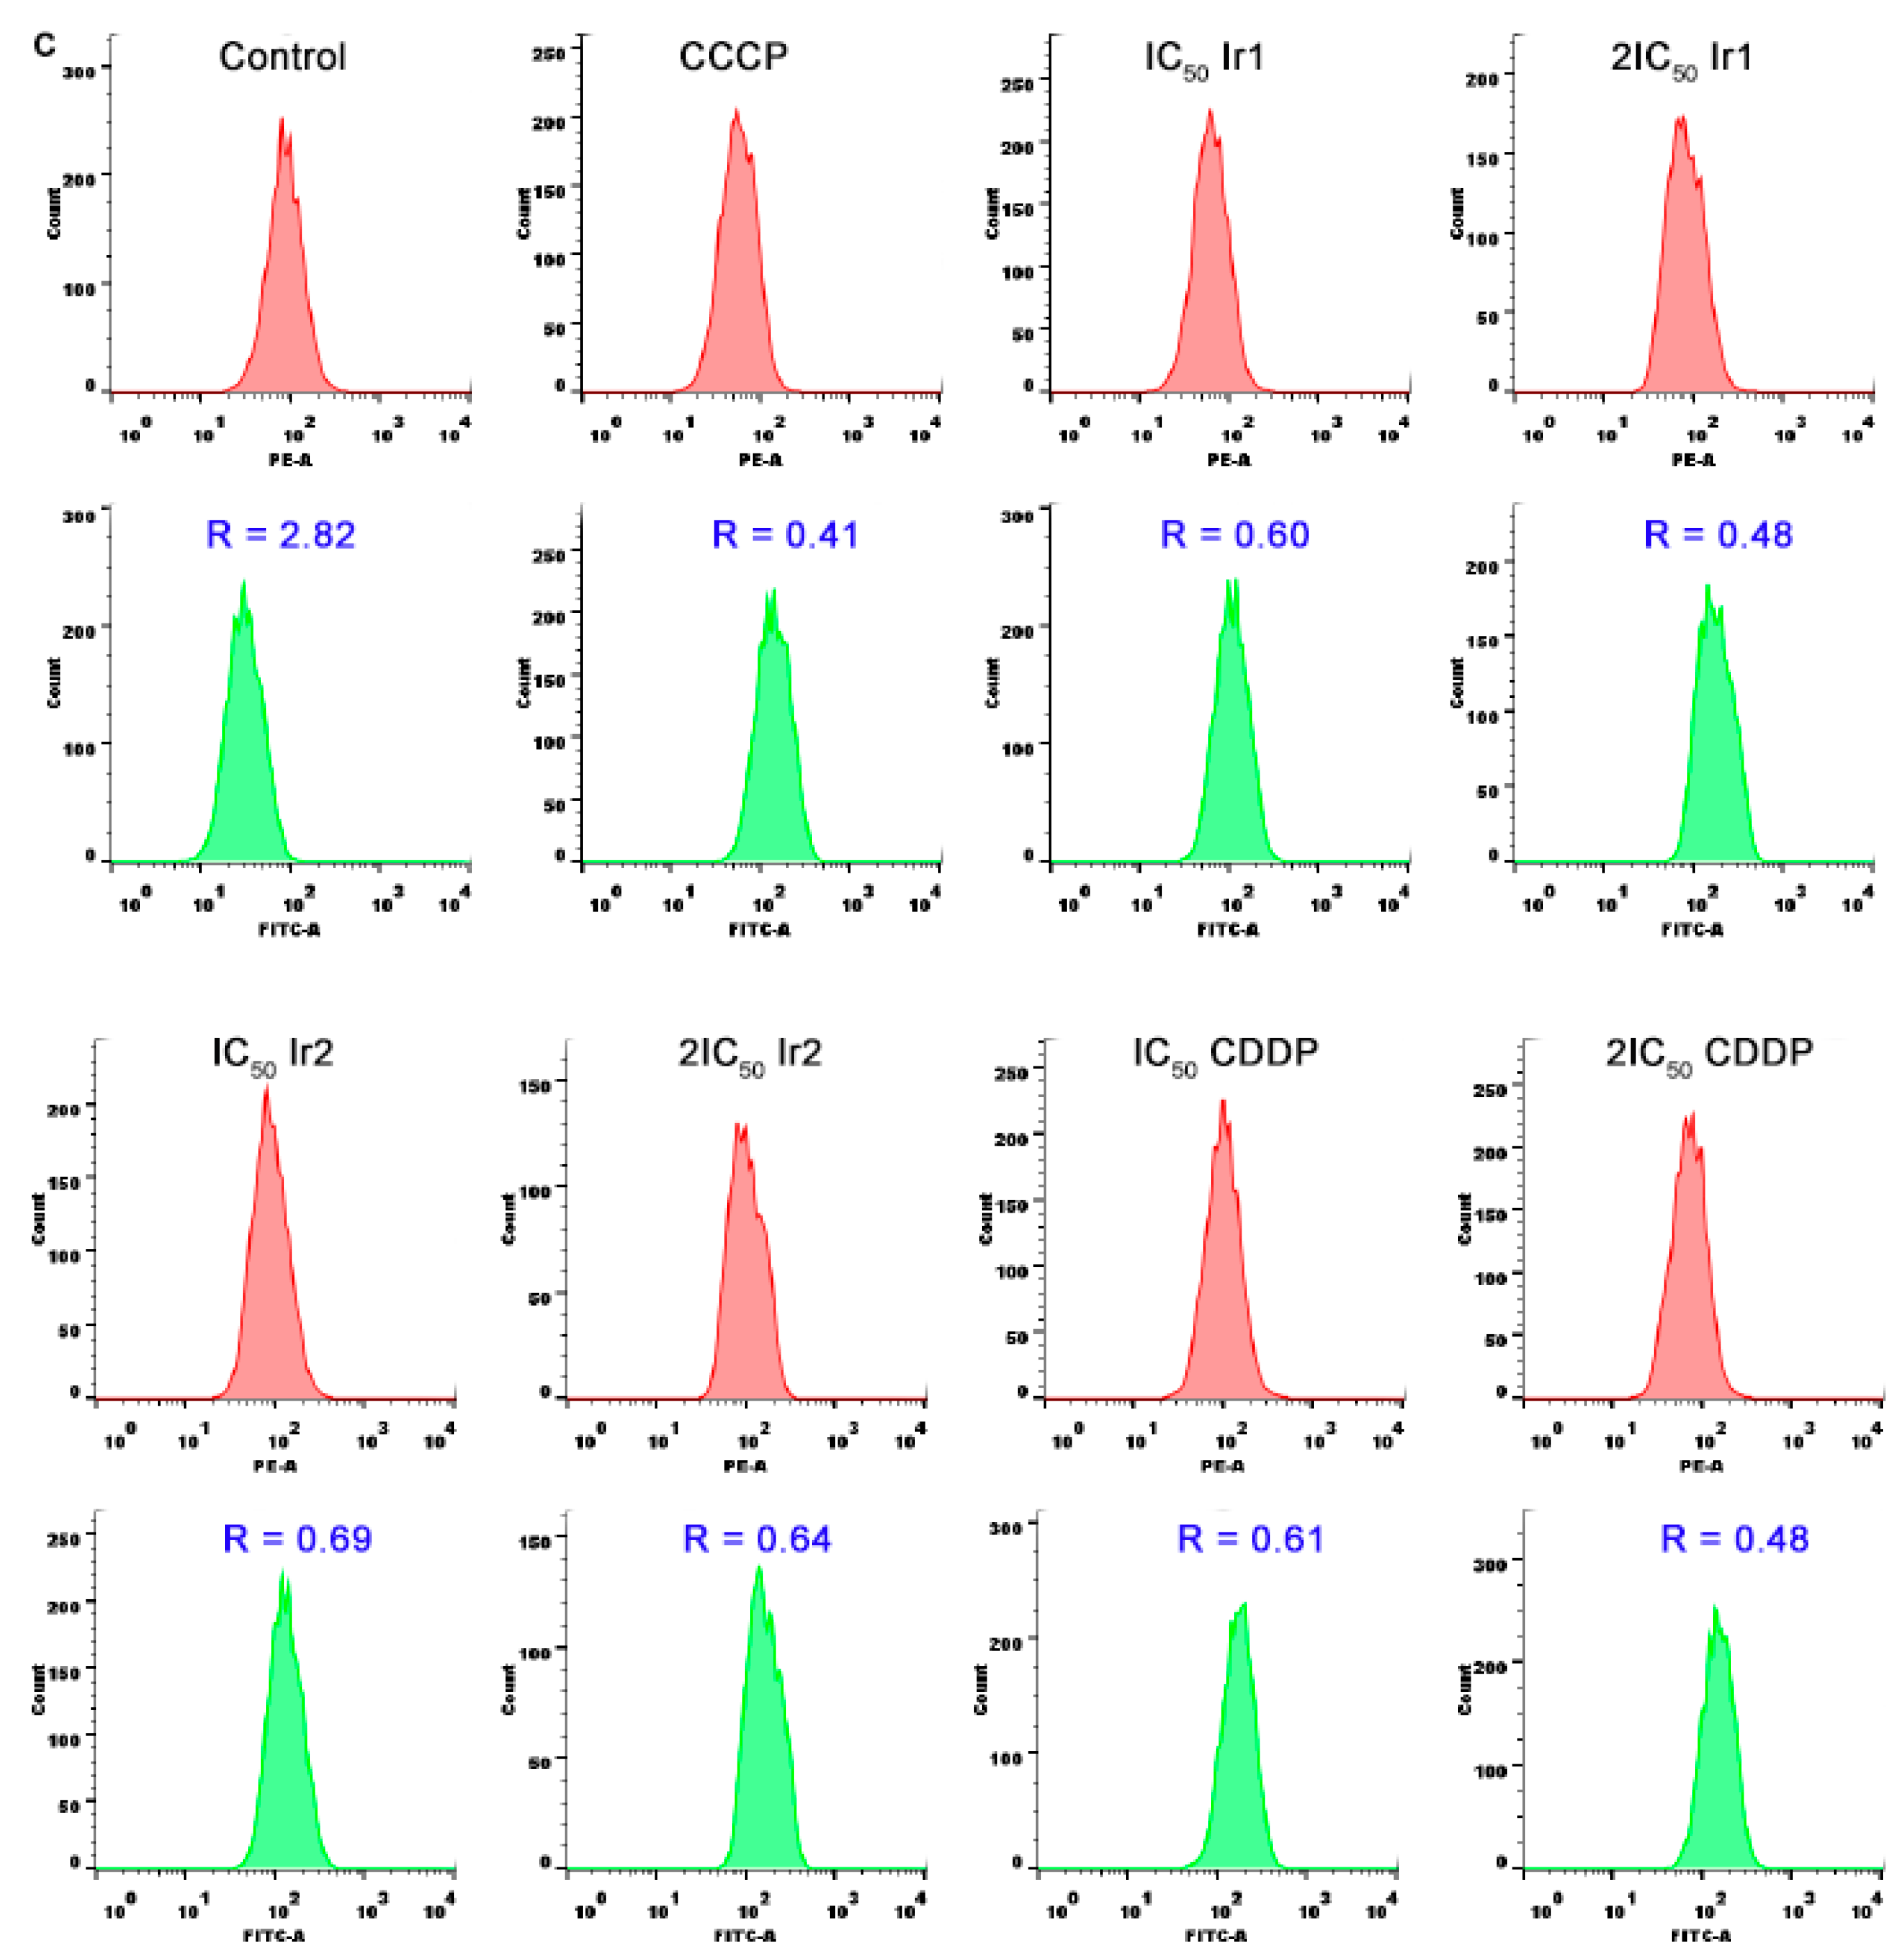
3.6. Location and the Change of Mitochondrial Membrane Potential

Mitochondrial changes, including loss of mitochondrial membrane potential, are key events that take place during drug-induced apoptosis [40]. Mitochondria are a critical organelle involved in maintaining cellular homeostasis and producing cellular energy (adenosine triphosphate, ATP) depending on oxidative phosphorylation [41,42]. To investigate whether the complexes enter the cells and then settle at the mitochondria, MitoTracker Red (Beyotime, Shanghai, China) was used as a fluorescence probe. As shown in Figure 6a, in the exposure of HCT116 cells to the IC50 concentration of the complexes for 4 h, the mitochondria were stained red and the complexes emitted weak green fluorescence; the overlap of the red and green fluorescence indicates that the complexes enter cells and settle at the mitochondria, which can cause the change in the mitochondrial membrane potential. In the assay of the change in the mitochondrial membrane potential, 5,5′,6,6′-Tetrachloro-1,1′,3,3′-tetraethyl-imidacarbocyanine iodide (JC-1) was used as a fluorescence probe. It is well known that JC-1 forms aggregates and emits red fluorescence corresponding to a high mitochondrial membrane potential. On the other hand, JC-1 exists as a monomer and emits green fluorescence corresponding to low mitochondrial membrane potential. As shown in Figure 6b, in the control, JC-1 emitted bright red fluorescence and very weak green fluorescence, while in carbonylcyanide-m-chlorophenylhydrazone (CCCP, positive control) and the IC50 of Ir1- and Ir2-treated groups, JC-1 emitted bright green fluorescence with little red fluorescence. The changes from the red to green fluorescence demonstrated that the complexes induced a decrease in the mitochondrial membrane potential. Owing to the complexes emitting weak green fluorescence, to exclude the cross-color disturbance, the ratio of red/green fluorescence intensity was determined through flow cytometry with the complexes as a reference. As shown in Figure 6c, compared with the control, the Ir1 and Ir2 complexes and cisplatin (CDDP) caused a decrease in the red/green ratio, namely, the red fluorescence intensity decreased and the green fluorescence intensity was enhanced. Taken together, the results showed that the complexes can cause a reduction in the mitochondrial membrane potential.

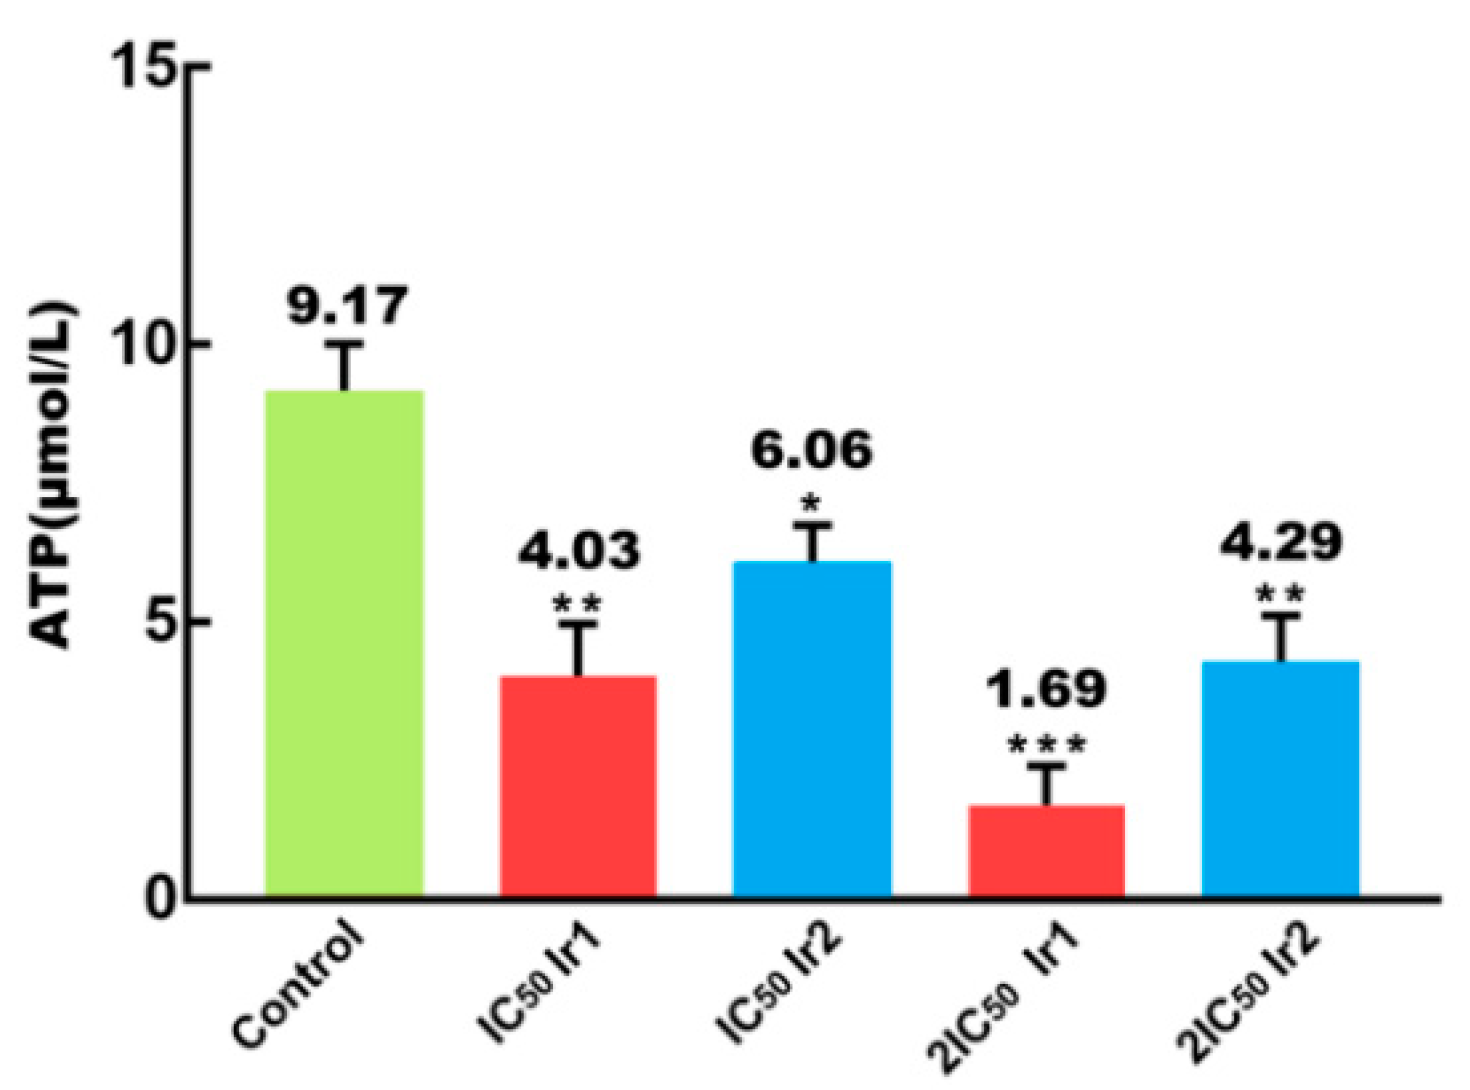
3.7. Intracellular ATP Content Determination

As the most direct source of energy in cells, adenine nucleoside triphosphate (ATP) plays an important role in the cell growth cycle. The interaction of the complexes on the mitochondria will result in a decrease in the intracellular ATP content. As shown in Figure 7, HCT116 cells were treated with IC50 and 2IC50 of Ir1 and Ir2 for 24 h, a decrease in the intracellular ATP content was observed compared with that in the control. Furthermore, the complexes showed a concentration-dependent reduction in the ATP content. Under the same conditions, Ir1 showed a stronger ability to cause an ATP reduction than Ir2, which is consistent with the cytotoxic activity of Ir1 and Ir2. These results reveal that the complexes act on the mitochondria, then induce mitochondrial ATP depletion and further promote the cell death through apoptosis in HCT116 cells.

3.8. Intracellular ROS Levels Assay

Many potential anticancer and chemopreventive agents induce apoptosis through the generation of reactive oxygen species (ROS) [43]. The change in the mitochondrial membrane potential is usually accompanied by the change in intracellular reactive oxygen species (ROS). The intracellular ROS level is commonly evaluated using 2′,7′-dichlorodihydrofluorescein diacetate (DCHF-DA) as a fluorescence probe. After the DCHF-DA diffuses inside the cells, it is hydrolyzed by intracellular esterase to yield 2′,7′-dichlorofluorescein (DCFH) [44]. The generated intracellular reactive oxygen species oxidize DCFH to the highly fluorescent compound, namely, 2′,7′-dichlorofluorescein (DCF). The fluorescent intensity of DCF is proportional to the amount of ROS level. As shown in Figure 8a, in the treatment of HCT116 cells with ROSUP (positive control) and the IC50 concentrations of Ir1 and Ir2 for 24 h, more bright green fluorescence points were found compared with those in the control (weak green fluorescence), indicating that the complexes can enhance the intracellular ROS levels. The DCF fluorescence intensity was quantitatively determined using flow cytometry. To exclude the interference of cross-color fluorescence, the same concentration of the complexes was used as a reference. As shown in Figure 8b, the green fluorescence intensity increased by 1.8 and 3.05 times for the IC50 and 2IC50 concentrations of Ir1, 2.25 and 10.5 times for the IC50 and 2IC50 concentrations of Ir2 and 29.7 times for the positive control ROSUP compared with that in the control. The increase in ROS levels followed the order of CCCP > Ir2 > Ir1. This is not in line with the cytotoxic activity of the complexes. These results further confirm that the complexes can increase intracellular ROS levels.

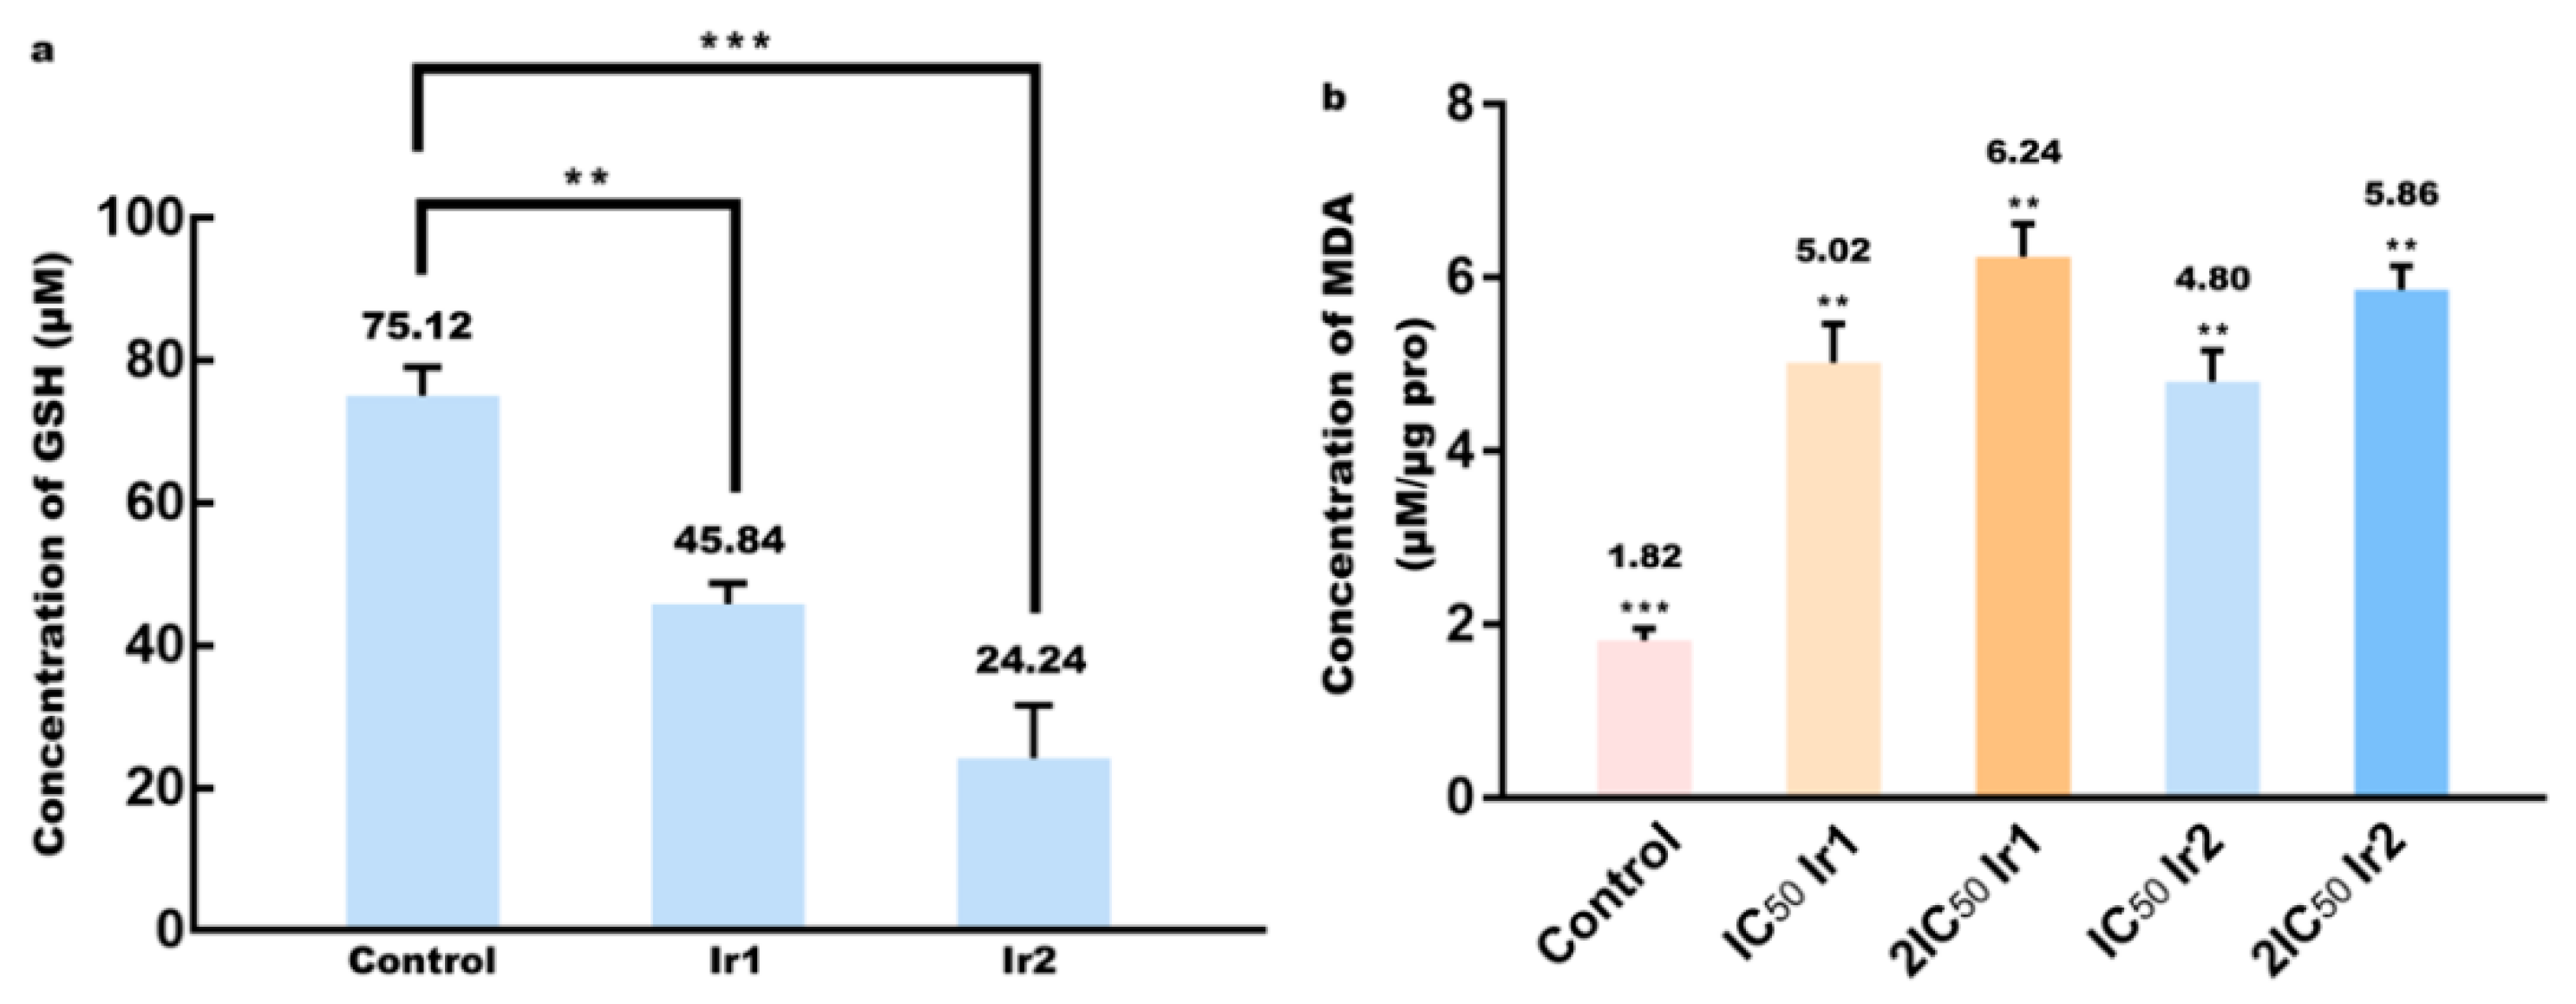
3.9. Determination of Glutathione and Lipid Peroxidation

Glutathione (GSH) plays an important role in cellular processes including cancer cell differentiation, proliferation and apoptosis [45]. As shown in Figure 9a, the intracellular concentration of GSH decreased compared with that in the control after a treatment of 24 h of HCT116 cells with the IC50 concentration of Ir1 and Ir2. A decrease in the cellular glutathione concentration suggests that the complexes reduce the antioxidant capacity of the cell and finally result in an increase in the reactive oxygen levels and the induction of ferroptosis. Malondialdehyde (MDA) levels in the cell can reflect lipid peroxidation levels. As shown in Figure 9b, HCT116 cells were treated with IC50 and 2IC50 concentrations of Ir1 and Ir2 for 24 h and the intracellular MDA content was enhanced in a concentration-dependent manner compared with that in the control. The results show that the complexes can trigger oxidant stress and further induce ferroptosis.

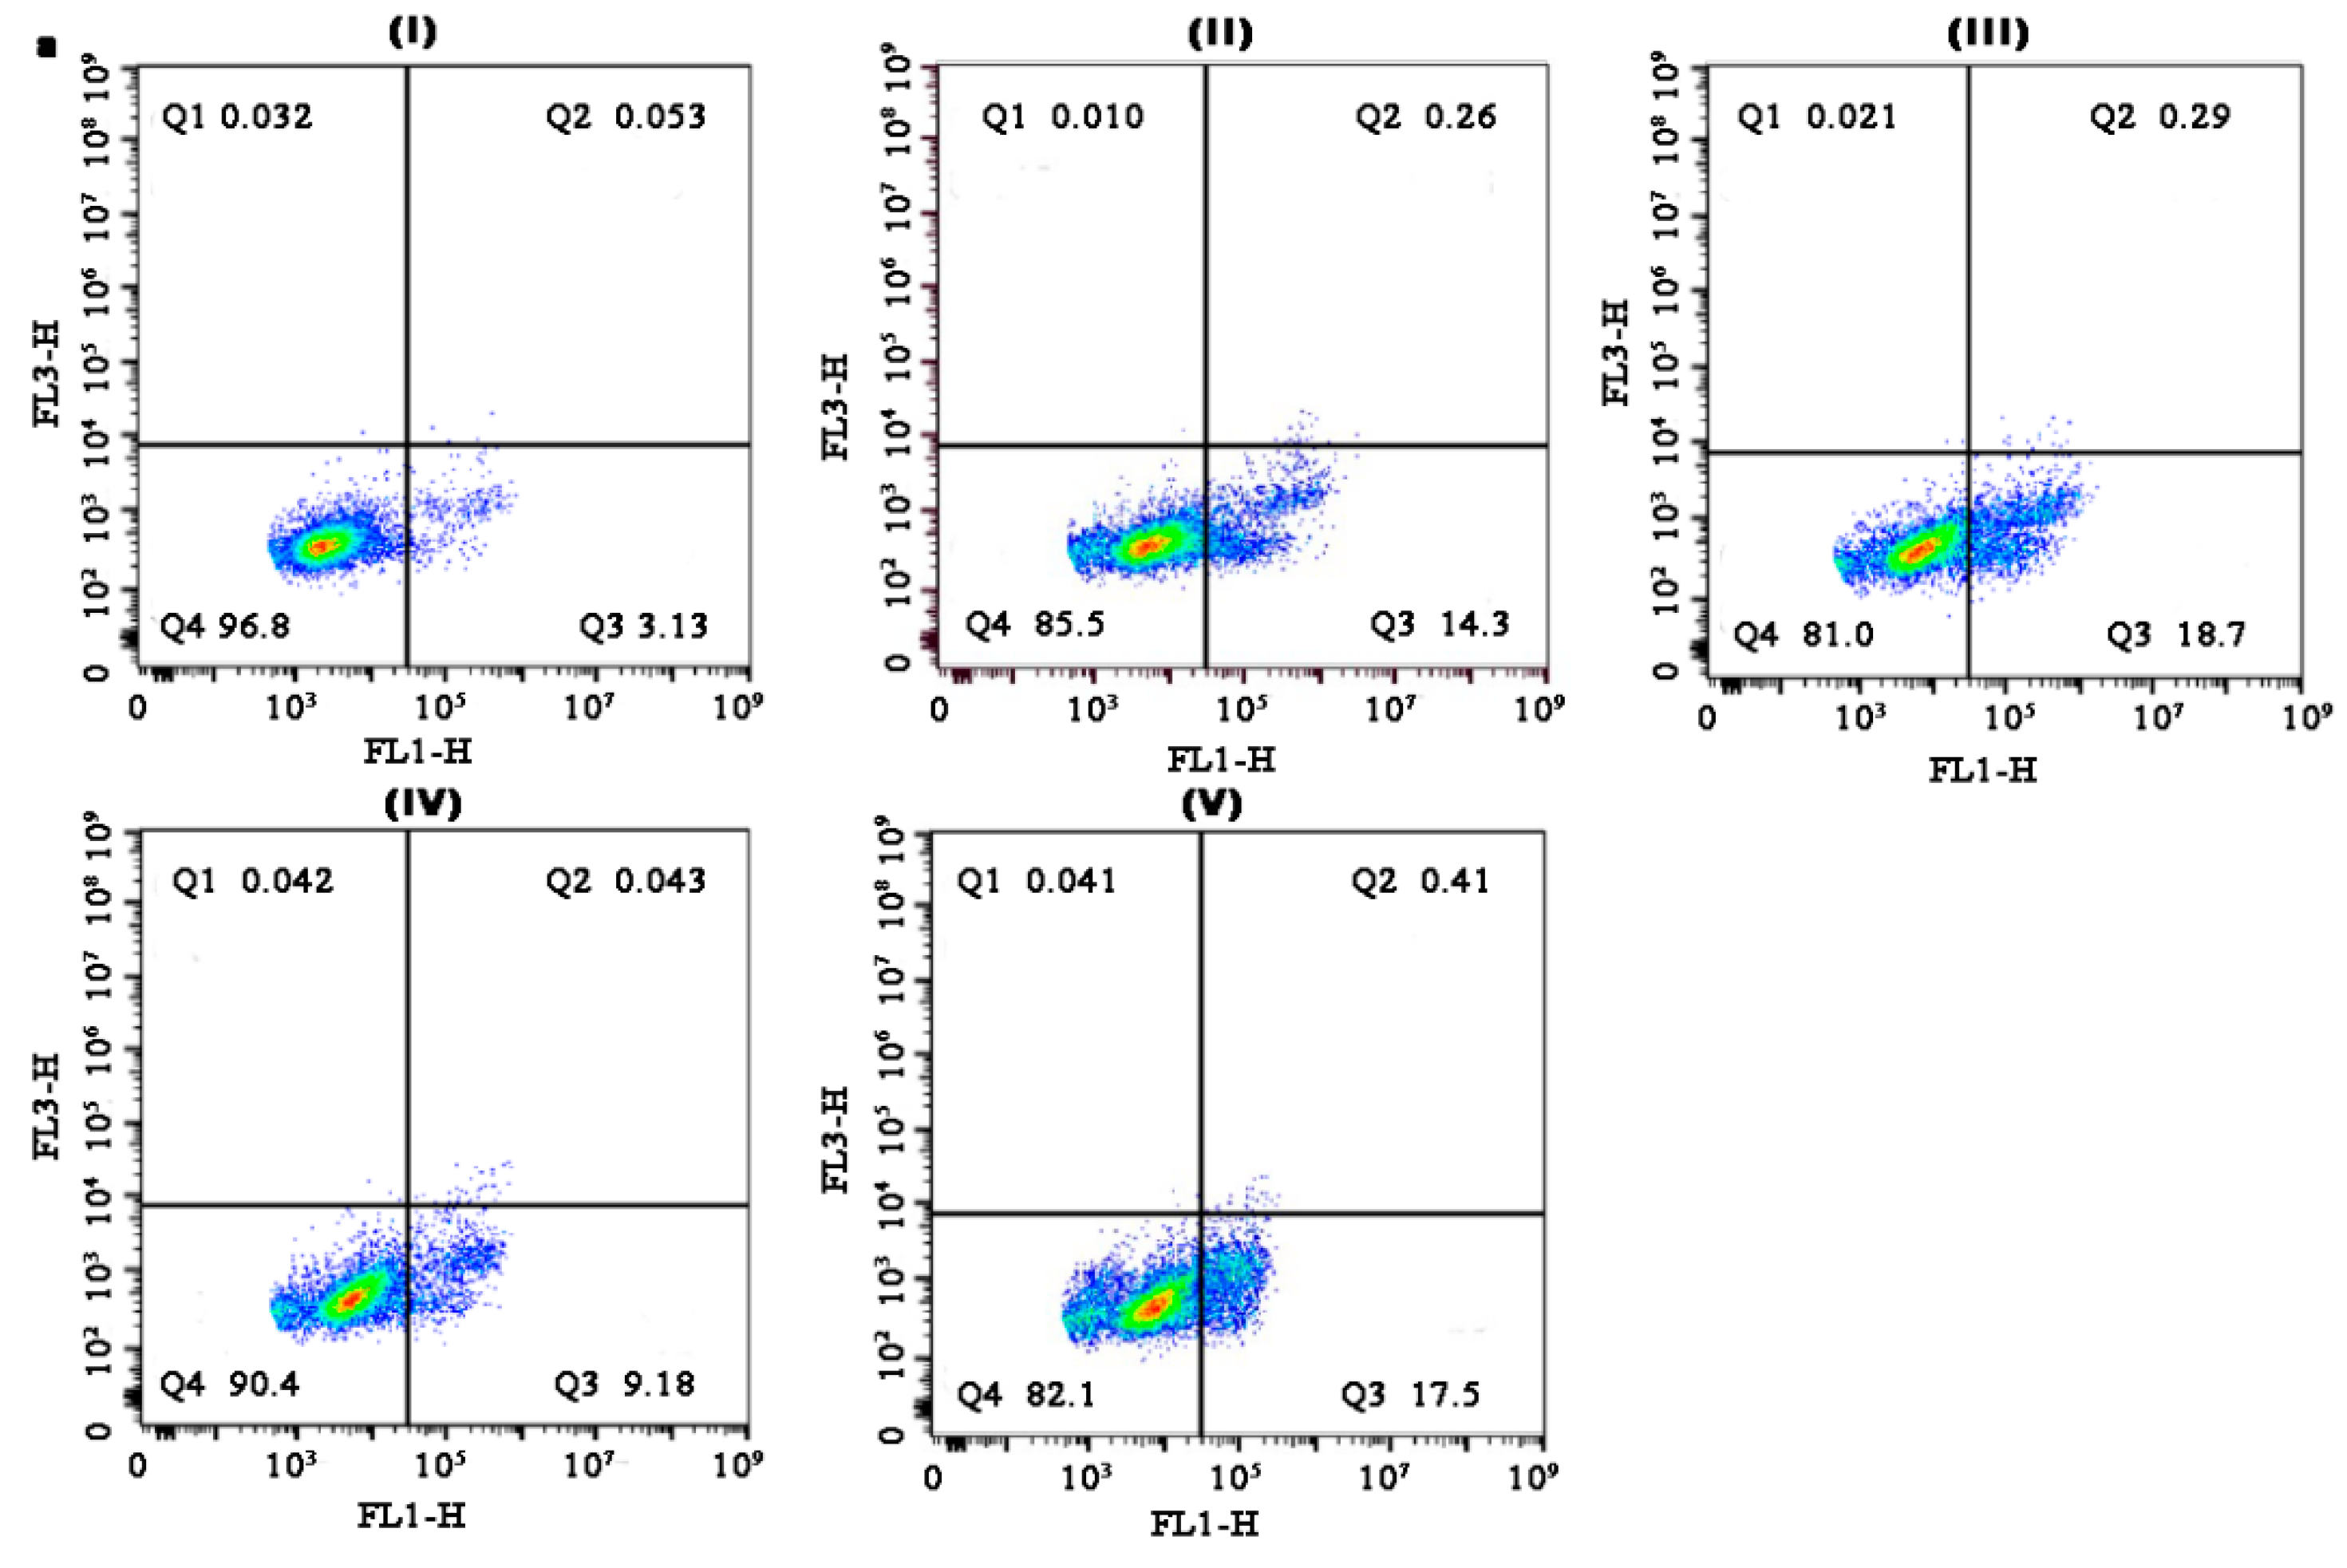
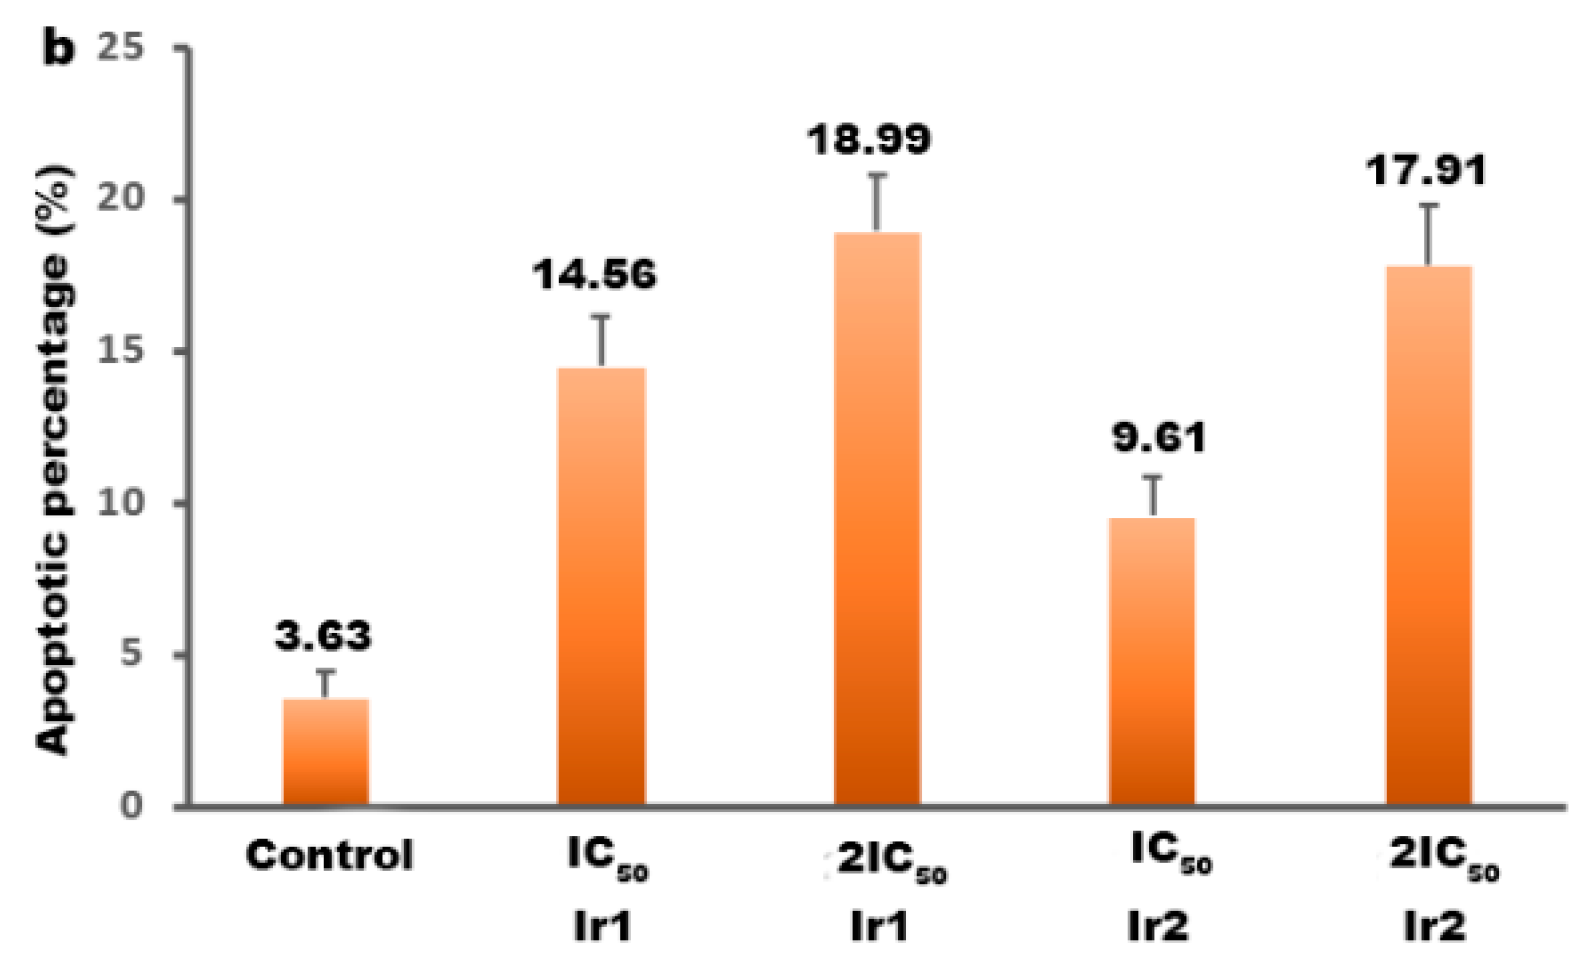
3.10. Apoptotic Efficacy Studies

External aggression by a chemical compound sensed by the cells causes them to undergo two major forms of death, necrosis or apoptosis, each with very distinct characteristics [46]. To evaluate the apoptotic efficacy, the apoptotic percentage in the cell was detected by flow cytometry. As shown in Figure 10a,b, after the treatment of HCT116 cells (I) with an IC50 concentration of Ir1 (II) and Ir2 (IV) for 24 h, the percentage of apoptotic cells increased by 11.17% for Ir1 and 6.06% for Ir2, respectively, while in the exposure of HCT116 cells to 2IC50 concentrations of Ir1 (III) and Ir2 (V) for 24 h, the percentage of apoptotic cells was enhanced by 15.57% and 14.47% for Ir1 and Ir2, respectively. The apoptotic efficacy followed the order of Ir1 > Ir2, which is consistent with that of the cytotoxic activity of the complexes. Therefore, the results show that the complexes can effectively induce apoptosis.

3.11. Cell Cycle Distribution Studies

The apoptosis of tumor cells is often associated with genomic DNA damage and cell cycle perturbation [7,47]. The distribution of HCT116 cells stained with propidium iodide (PI) in various compartments during the cell cycle was determined using flow cytometry. The DNA distribution histogram of HCT116 cells in the absence and presence of the complexes is shown in Figure 11a. In the control (I), the percentage in the cell in the G0/G1 phase was 40.55%. After HCT116 cells were incubated with IC50 concentrations of Ir1 (II) and Ir2 (III), an increase in the percentage in the cell in the G0/G1 phase of 10.98% was observed for Ir1 and 21.17% for Ir2, respectively, accompanied by a corresponding reduction of 16.41% for Ir1 and 26.06% for Ir2 in the cell in the S phase. The data showed that the complexes inhibited cell proliferation at the G0/G1 phase and the effect of the complexes on the cell cycle arrest followed the order of Ir2 > Ir1 under identical experimental conditions. p53, cyclin D1, CDK4 and p21 are related to the cell cycle arrest and regulate the cell cycle in G0/G1. Hence, we detected the expression of these proteins. As shown in Figure 11b,c, the exposure of HCT116 cells to IC50 and 2IC50 concentrations of Ir1 and Ir2 for 24 h resulted in an upregulation of the expression of p53, CDK4 and p21 and a downregulation of the expression of cyclin D1. These results further confirm that the complexes induce cell cycle arrest at the G0/G1 phase.

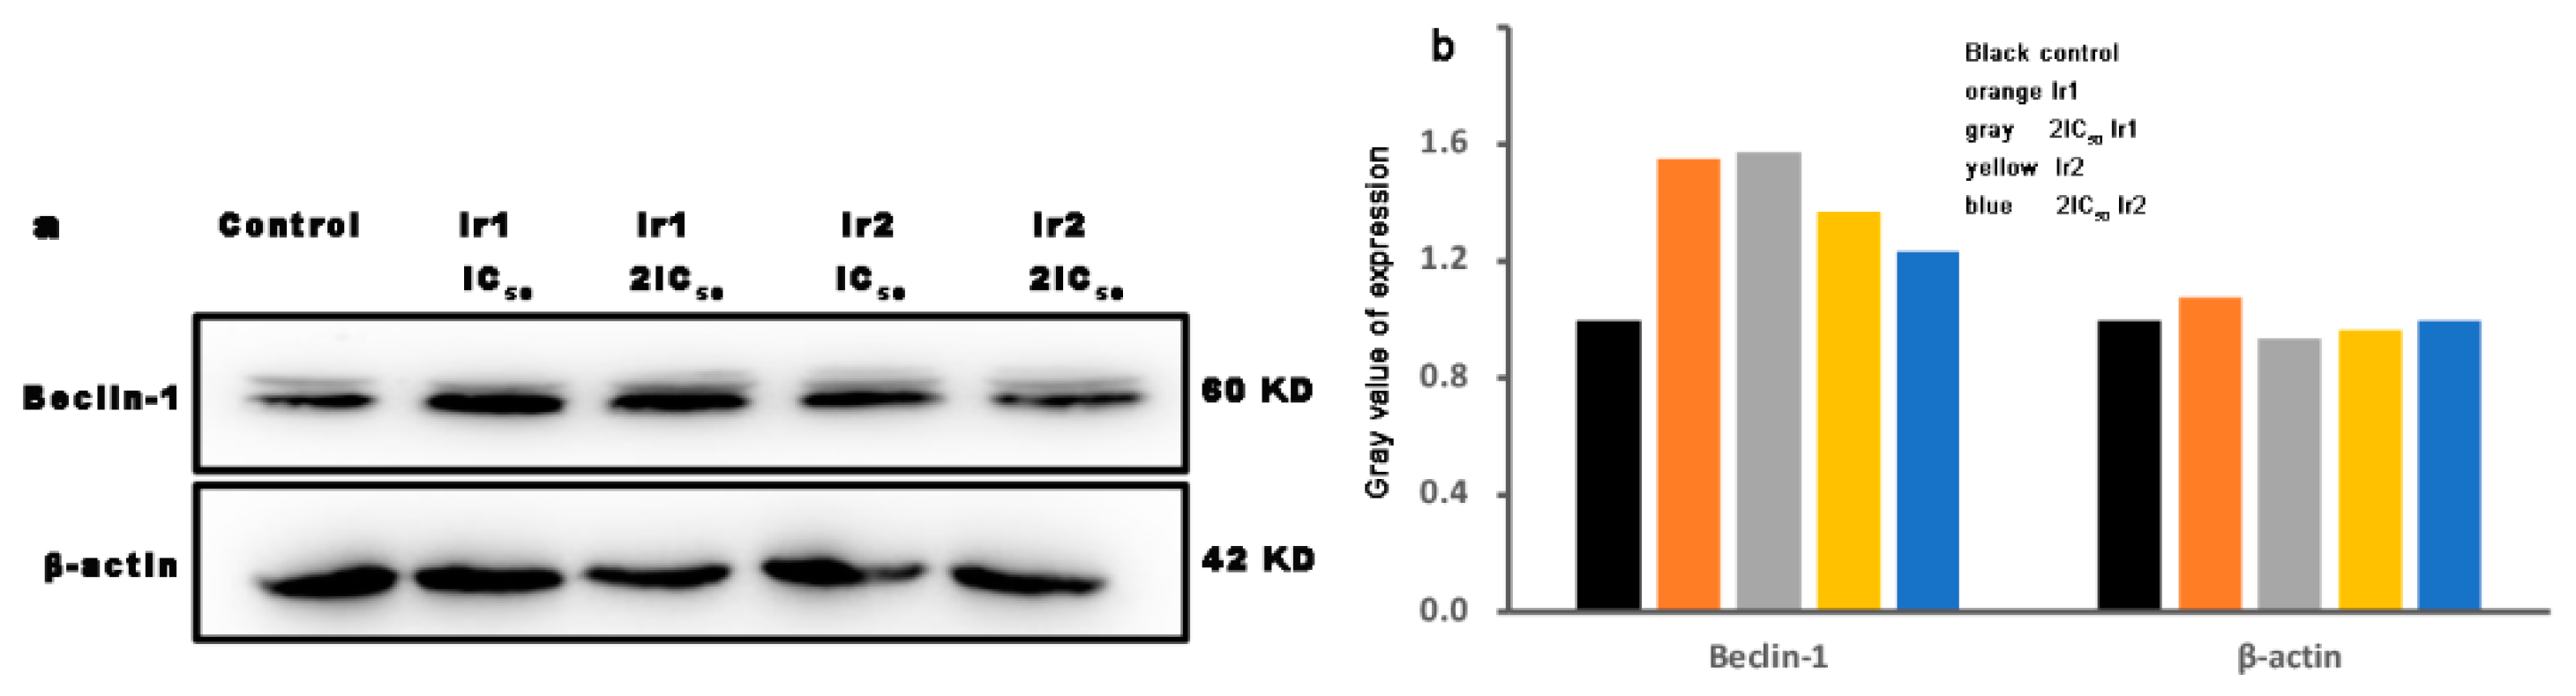
3.12. Autophagy Assay

Cell death includes apoptosis, necrosis and autophagic cell death. Autophagy is an evolutionarily conserved process degrading cellular proteins and cytoplasmic organelles, in which the phagophores surround and pack organelles to form autophagosomes [48]. The Beclin-1 protein is a hallmark of autophagy. As shown in Figure 12a,b, in the incubation of HCT116 cells with the IC50 and 2IC50 concentrations of Ir1 and Ir2 for 24 h, the expression of Beclin-1 increased compared with that of the control. Ir1 exhibited higher efficacy on autophagy than Ir2 under the same conditions. Similar results have been observed in other iridium (III) complexes [49,50]. The results show that the complexes can effectively induce autophagy.

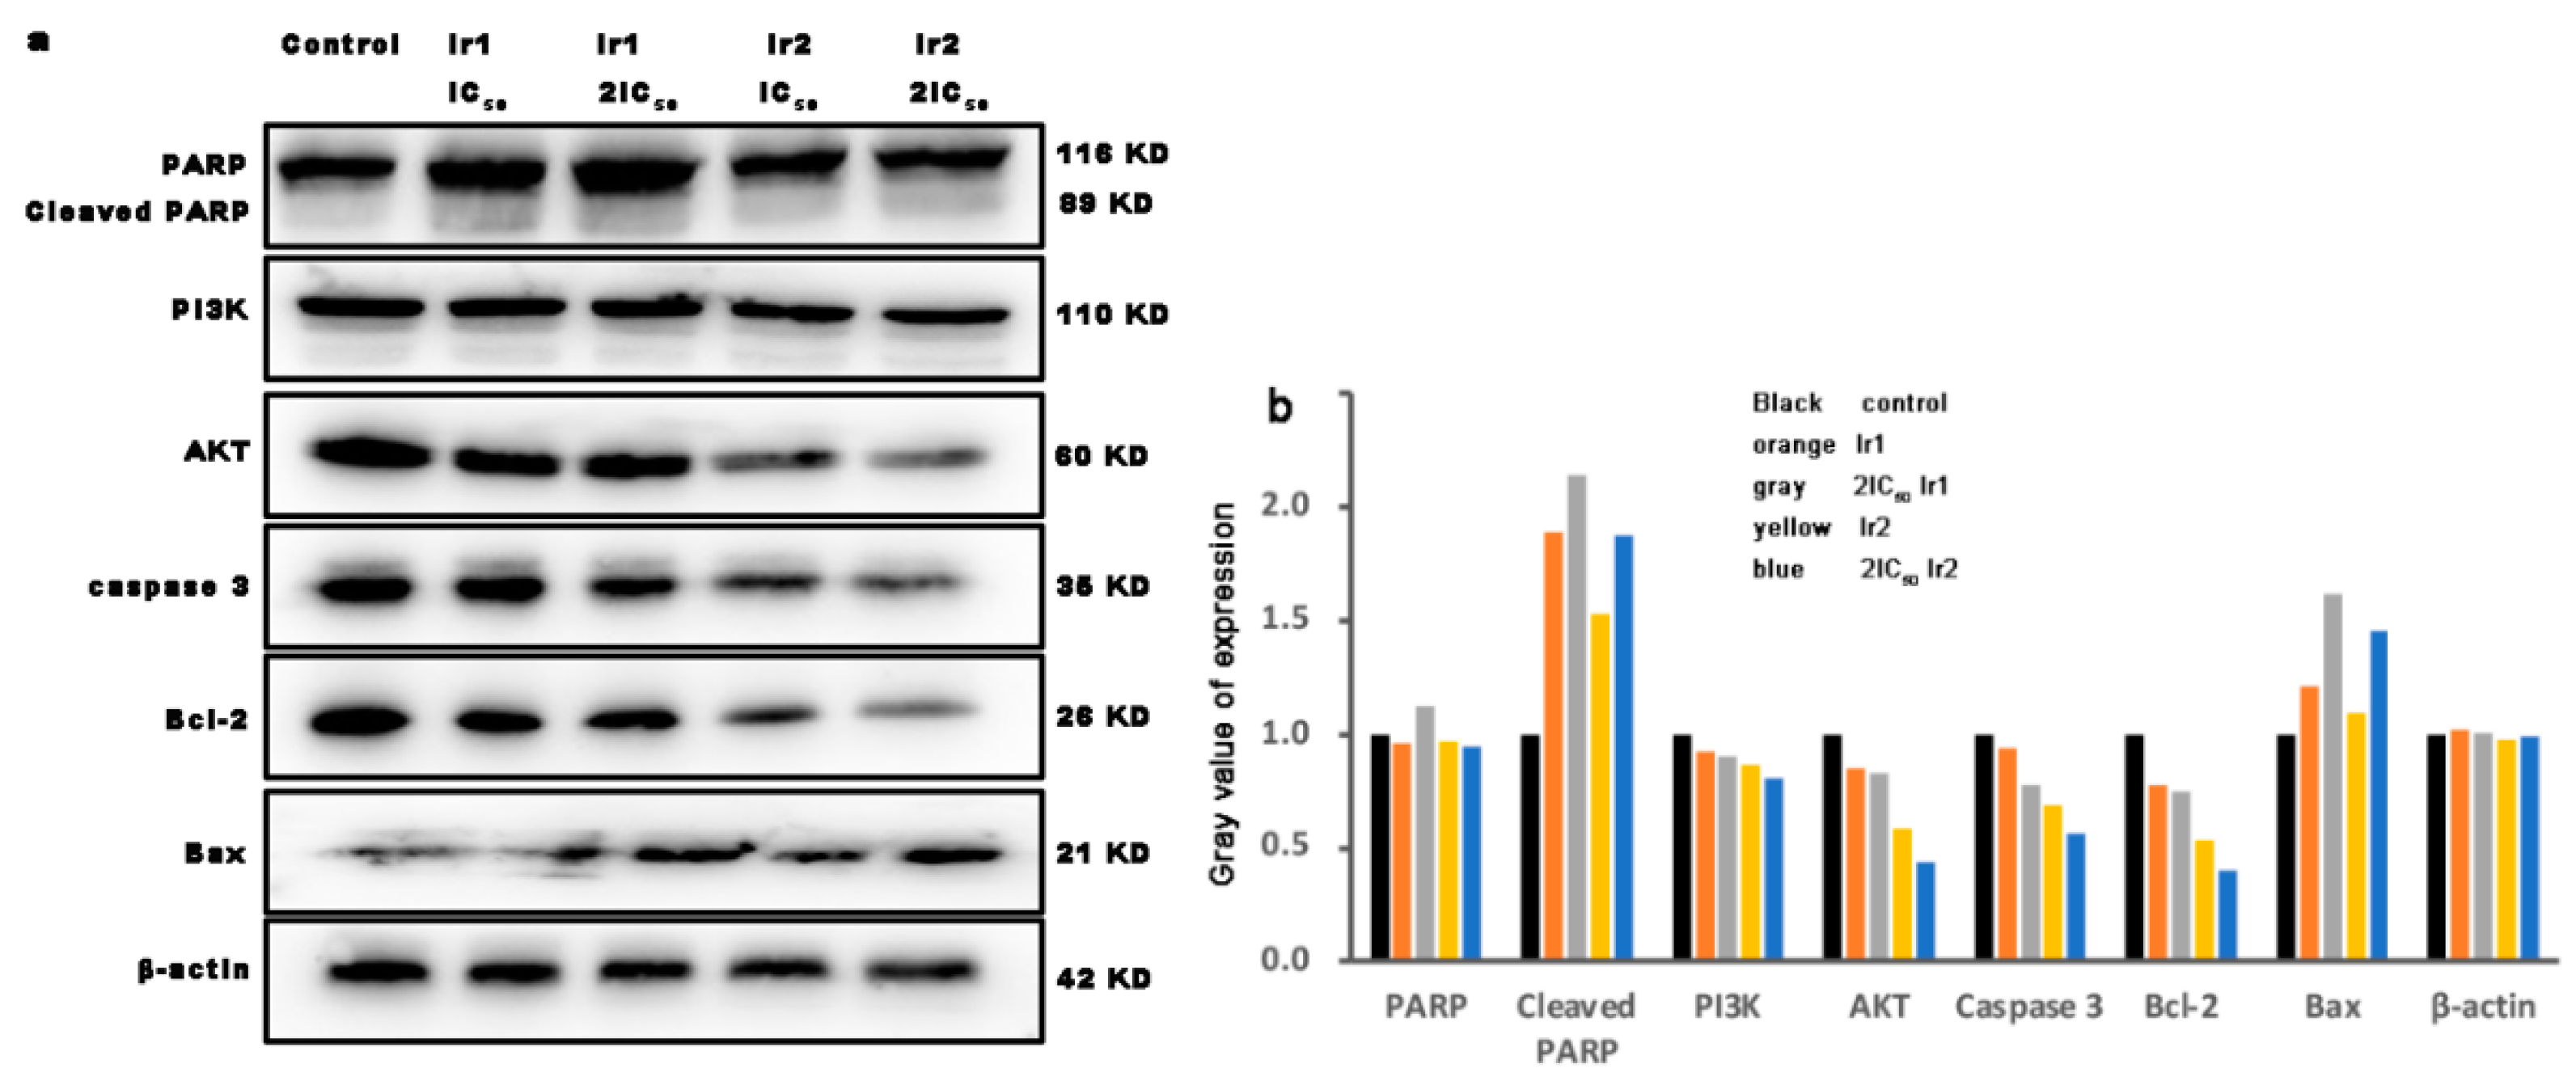
3.13. The Expression of Bcl-2 Family Proteins

Apoptosis is a kind of programmed cell death regulated by multiple signaling pathways and finally executed by caspase 3 [51]. PI3K (phosphatidylinositol 3-kinase)/AKT (protein kinase B) is an important signaling pathway that causes cell death. Caspase 3 eliminates apoptosis to induce morphological changes. PARP (poly ADP-ribose polymerase) is one of the most important substrates of caspase 3, which is associated with DNA repair and gene integrity [52]. As shown in Figure 13a,b, after the treatment of HCT116 cells with IC50 and 2IC50 concentrations of Ir1 and Ir2 for 24 h, cleaved PARP was found, a decrease in the expression of PI3K, AKT, caspase 3 and B-cell lymphoma-2 (Bcl-2) proteins was observed and the expression of proapoptotic protein Bcl-2-associated x protein (Bax) was increased. The results demonstrate that the complexes can regulate the expression of Bcl-2 family proteins and inhibit the expression of PI3K/AKT. Therefore, the results demonstrate that the complexes induce apoptosis through the inhibition of PI3K/AKT signaling pathway.

3.14. Immunogenic Cell Death

Immunogenic cell death (ICD) is a form of cell death. The increase in the cell surface calreticulin (CRT) and high expression of heat-shock protein 70 kDa (HSP70) are typical damage-associated molecular patterns (DAMPs) [53,54]. To evaluate whether the complexes can increase intracellular CRT and HSP70 content, HCT116 cells were exposed to an IC50 concentration of Ir1 and Ir2 for 24 h and the cells were observed using an ImageXpress R Micro XLS System (MD company, USA). As shown in Figure 14a,b, the green fluorescence intensity was increased, indicating that the complexes can enhance intracellular CTR and HSP70 content. Hence, the complexes can induce immunogenic cell death.

4. Conclusions

Two new iridium (III) complexes were synthesized and characterized by elemental analysis, HRMS, 1H NMR and 13C NMR. The Ir1 and Ir2 complexes showed high cytotoxicity against HCT116 cells. The multiple tumor spheroid, colony-forming, wound healing showed that the complexes can effectively inhibit cell proliferation and the cell cycle arrest revealed that the complexes inhibited cell proliferation in the G0/G1 phase. The Ir1 and Ir2 complexes can increase the intracellular ROS level, cause autophagy and upregulate the expression of Beclin-1. In addition, the complexes prevent the synthesis of GSH, induce a decrease in the mitochondrial membrane potential and reduce the intracellular ATP content. Western blot analysis showed that the complexes regulate the expression of the Bcl-2 family protein and inhibit the expression of PI3K and AKT. Taken together, the complexes cause apoptosis in HCT116 cells through ROS-mediated mitochondrial dysfunction and the inhibition of PI3K/AKT signaling pathways. This work may help us to understand the anticancer mechanism and synthesis of new iridium (III) complexes as potent candidate drugs for HCT116 cancer treatment.

Supplementary Materials

The following supporting information can be downloaded at: https://www.mdpi.com/article/10.3390/molecules27175434/s1, Figure S1. Gel pictures of the performed experiments. (A) Wound healing experiment. (B) Apoptotic experiment. (C) Cell cycle arrest. (D) Autophagy.

Author Contributions

Conceptualization, Y.N.; methodology, B.X. and Y.W.; validation, B.X.; formal analysis, D.W.; investigation, B.X., Y.W. and D.W.; resource, Y.N.; data curation, X.X.; writing—original draft preparation, B.X.; writing review and editing, Y.N.; visualization, Y.W. and B.X.; supervision, Y.N.; project administration, Y.N.; funding acquisition, Y.N. All authors have read and agreed to the published version of the manuscript.

Funding

This work was supported by the National Natural Science Foundation of China (82100586), Scientific Research Projects of the Medical and Health Institution of the Longhua District, Shenzhen (2022021), the Medical Key Discipline of Longhua, Shenzhen (MKD202007090209) and the Innovation and Technology Bureau of Longhua, Shenzhen (Public platform of Technique service of molecular Immunology and Molecular Diagnostics).

Institutional Review Board Statement

Not applicable.

Informed Consent Statement

Not applicable.

Data Availability Statement

All data are available in the manuscript and Supplementary Materials.

Conflicts of Interest

The authors declare no conflict of interest.

Abbreviations

AKTprotein kinase B
ATPadenine nucleoside triphosphate
BaxBcl-2-associated x protein
Bcl-2B-cell lymphoma-2
Bzqbenzo[h]quinolone
Calcein-AM.calcein-acetoxymethylester
CCCPcarbonylcyanide-m-chlorophenylhydrazone
CDK4cyclin-dependent kinase
CTRcell surface calreticulin
DAPI2-(4-amidinophenyl)-6-indolecarbamidine dihydrochloride
DCHF2′,7′-dichloro-3,6-fluorandiol
DCHF-DA2′,7′-dichlorodihydrofluorescein diacetate
DCFdichlorofluorescein
DEMEDulbecco’s Modified Eagle Medium
DMSOdimethylsulfoxide
FAKfocal adhesion kinase
FBSfetal bovine serum
FITCfluorescein isothiocyanate
GSHglutathione
HCT116human colon cancer cells
Hppy2-phenylpyridine
HSP70heat-shock protein 70
ICDimmunogenic cell death
Ipbp3-(1H-imidazo[4,5-f][1,10]phenanthrolin-2yl)-4H-chromen-4-one
JC-15,5′,6,6′-Tetrachloro-1,1′,3,3′-tetraethyl-imidacarbocyanine iodide
MMPmitochondrial membrane potential
MTT3-(4,5-dimethylthiazole)-2,5-diphenyltetraazolium bromide
NPIP2-(2-nitrophenyl)-1H-imidazo[4,5-f][1,10]phenanthroline
PARPpoly ADP-ribose polymerase
PIpropidium iodide
Piq1-phenylisoquinoline
PBSphosphate buffer saline
Ppydeprotonated phenylpyridine
PVDFpolyvinylidene fluoride
RIPA50 mM Tris (pH 7.4), 150 mM NaCl, 1% NP-40, 0.5% sodium deoxycholate
ROSreactive oxygen species
TBST150 mM NaCl, 20 mM Tris-HCl, 0.05% Tween 20
TMStetramethylsilane
Triton X-100polyethylene glycol octylphenyl ether
Tween 70polyoxyethylene monolaurate sorbaitan

References

  1. Stewart, B.W.; Wild, C.P. World Cancer Report 2014; IARC Nonserial Publication; World Health Organization: Geneva, Switzerland, 2014. [Google Scholar]
  2. Fardi, M.; Soladi, S.; Farshdousti, M. Epigenetic mechanisms as a new approach in cancer treatment: An updated review. Genes. Dis. 2018, 5, 304–311. [Google Scholar] [CrossRef] [PubMed]
  3. Vegerhof, A.; Barnoy, E.A.; Motiei, M.; Malka, D.; Danan, Y.; Zalevsky, Z.; Popovtzer, R. Targeted Magnetic Nanoparticles for Mechanical Lysis of Tumor Cells by Low-Amplitude Alternating Magnetic Field. Materials 2016, 9, 943. [Google Scholar] [CrossRef] [PubMed]
  4. Vegerhof, A.; Motei, M.; Rudinzky, A.; Malka, D.; Popovtzer, R.; Zalevsky, Z. Thermal therapy with magnetic nanoparticles for cell destruction. Biomed. Opt. Express 2016, 7, 4581–4594. [Google Scholar] [CrossRef] [PubMed]
  5. Hill, J.M.; Speer, R.J. Organo-platinum complexes as antitumor agents (review). Anticancer Res. 1982, 2, 173–186. [Google Scholar]
  6. Rosenberg, B. Noble Metal Complexes in Cancer Chemotherapy. Adv. Exp. Med. Biol. 1978, 91, 129–150. [Google Scholar] [CrossRef]
  7. Wang, D.; Lippard, S.J. Cellular processing of platinum anticancer drugs. Nat. Rev. Drug Discov. 2005, 4, 307–320. [Google Scholar] [CrossRef]
  8. Klein, A.V.; Hambley, T.W. Platinum Drug Distribution in Cancer Cells and Tumors. Chem. Rev. 2009, 109, 4911–4920. [Google Scholar] [CrossRef]
  9. Gao, E.-J.; Wang, K.-H.; Gu, X.-F.; Yu, Y.; Sun, Y.-G.; Zhang, W.-Z.; Yin, H.-X.; Wu, Q.; Zhu, M.-C.; Yan, X.-M. A novel binuclear palladium complex with benzothiazole-2-thiolate: Synthesis, crystal structure and interaction with DNA. J. Inorg. Biochem. 2007, 101, 1404–1409. [Google Scholar] [CrossRef]
  10. Bruijnincx, P.C.A.; Sadler, P.J. New trends for metal complexes with anticancer activity. Curr. Opin. Chem. Biol. 2008, 12, 197–206. [Google Scholar] [CrossRef]
  11. YLiu, Z.; Vinje, J.; Pacifico, C.; Natile, G.; Sletten, E. Formation of adenine-N3/guanine-N7 cross-link in the reaction of trans-oriented platinum substrates with dinucleotides. J. Am. Chem. Soc. 2002, 124, 12854–12862. [Google Scholar]
  12. Gust, R.; Beck, W.; Jaouen, G.; Schönenberger, H. Optimization of cisplatin for the treatment of hormone dependent tumoral diseases. Coord. Chem. Rev. 2009, 253, 2742–2759. [Google Scholar] [CrossRef]
  13. He, M.; Du, F.; Zhang, W.-Y.; Yi, Q.-Y.; Wang, Y.-J.; Yin, H.; Bai, L.; Gu, Y.-Y.; Liu, Y.-J. Photoinduced anticancer effect evaluation of ruthenium(II) polypyridyl complexes toward human lung cancer A549 cells. Polyhedron 2019, 165, 97–110. [Google Scholar] [CrossRef]
  14. Yi, Q.-Y.; Wang, Y.-J.; He, M.; Zhang, W.-Y.; Du, F.; Gu, Y.-Y.; Bai, L.; Liu, Y.-J. Induction of apoptosis in SGC-7901 cells by ruthenium(II) complexes through ROS-mediated lysosome–mitochondria dysfunction and inhibition of PI3K/AKT/mTOR pathways. Transit. Met. Chem. 2018, 44, 187–205. [Google Scholar] [CrossRef]
  15. Brindell, M.; Gurgul, I.; Janczy-Cempa, E.; Gajda-Morszewski, P.; Mazuryk, O. Moving Ru polypyridyl complexes beyond cytotoxic activity towards metastasis inhibition. J. Inorg. Biochem. 2021, 226, 111652. [Google Scholar] [CrossRef] [PubMed]
  16. Huang, Y.C.; Haribabu, J.; Chien, C.M.; Sabapathi, G.; Chou, C.; Karvembu, R.; Venuvanalingam, P.; Ching, W.M.; Tsai, M.L.; Hsu, S.C.N. Half-sandwich Ru(η6-p-cymene) complexes featuring pyrazole appended ligands: Synthesis, DNA binding and in vitro cytotoxicity. J. Inorg. Biochem. 2019, 194, 74–84. [Google Scholar] [CrossRef] [PubMed]
  17. Fandzloch, M.; Dobrzańska, L.; Jędrzejewski, T.; Jezierska, J.; Wiśniewska, J.; Łakomska, I. Synthesis, structure and biological evaluation of ruthenium(III) complexes of triazolopyrimidines with anticancer properties. JBIC J. Biol. Inorg. Chem. 2019, 25, 109–124. [Google Scholar] [CrossRef]
  18. Chen, J.; Wang, J.; Deng, Y.; Li, B.; Li, C.; Lin, Y.; Yang, D.; Zhang, H.; Chen, L.; Wang, T. Novel cyclometalated Ru(II) complexes containing isoquinoline ligands: Synthesis, characterization, cellular uptake and in vitro cytotoxicity. Eur. J. Med. Chem. 2020, 203, 112562. [Google Scholar] [CrossRef] [PubMed]
  19. Li, W.; Wu, X.; Liu, H.; Shi, C.; Yuan, Y.; Bai, L.; Liao, X.; Zhang, Y.; Liu, Y. Enhanced in vitro cytotoxicity and antitumor activity in vivo of iridium(III) complexes liposomes targeting endoplasmic reticulum and mitochondria. J. Inorg. Biochem. 2022, 233. [Google Scholar] [CrossRef]
  20. Liu, X.; Chen, S.; Ge, X.; Zhang, Y.; Xie, Y.; Hao, Y.; Wu, D.; Zhao, J.; Yuan, X.-A.; Tian, L.; et al. Dual functions of iridium(III) 2-phenylpyridine complexes: Metastasis inhibition and lysosomal damage. J. Inorg. Biochem. 2020, 205, 110983. [Google Scholar] [CrossRef]
  21. Yuan, Y.; Shi, C.; Wu, X.; Li, W.; Huang, C.; Liang, L.; Chen, J.; Wang, Y.; Liu, Y. Synthesis and anticancer activity in vitro and in vivo evaluation of iridium(III) complexes on mouse melanoma B16 cells. J. Inorg. Biochem. 2022, 232. [Google Scholar] [CrossRef]
  22. Gu, Y.; Wen, H.; Zhang, Y.; Bai, L.; Zhou, Y.; Zhang, H.; Tian, L.; Hao, J.; Liu, Y. Studies of anticancer activity in vivo and in vitro behaviors of liposomes encapsulated iridium(III) complex. JBIC J. Biol. Inorg. Chem. 2021, 26, 109–122. [Google Scholar] [CrossRef] [PubMed]
  23. Liu, X.; Hao, H.; Ge, X.; He, X.; Liu, Y.; Wang, Y.; Wang, H.; Shao, M.; Jing, Z.; Tian, L.; et al. Triphenylamine-appended cyclometallated iridium(III) complexes: Preparation, photophysical properties and application in biology/luminescence imaging. J. Inorg. Biochem. 2019, 199, 110757. [Google Scholar] [CrossRef] [PubMed]
  24. Tian, L.; Zhang, Y.; Zhang, H.; Zhou, Y.; Li, W.; Yuan, Y.; Hao, J.; Yang, L.; Liu, Y. Synthesis and evaluation of iridium(III) complexes on antineoplastic activity against human gastric carcinoma SGC-7901 cells. JBIC J. Biol. Inorg. Chem. 2021, 26, 705–714. [Google Scholar] [CrossRef] [PubMed]
  25. Li, Y.; Liu, B.; Xu, C.-X.; He, L.; Wan, Y.-C.; Ji, L.-N.; Mao, Z.-W. Mitochondria-targeted phosphorescent cyclometalated iridium(III) complexes: Synthesis, characterization, and anticancer properties. JBIC J. Biol. Inorg. Chem. 2020, 25, 597–607. [Google Scholar] [CrossRef] [PubMed]
  26. Zhang, H.; Tian, L.; Xiao, R.; Zhou, Y.; Zhang, Y.; Hao, J.; Liu, Y.; Wang, J. Anticancer effect evaluation in vitro and in vivo of iridium(III) polypyridyl complexes targeting DNA and mitochondria. Bioorganic Chem. 2021, 115, 105290. [Google Scholar] [CrossRef] [PubMed]
  27. Zhang, Y.; Fei, W.; Zhang, H.; Zhou, Y.; Tian, L.; Hao, J.; Yuan, Y.; Li, W.; Liu, Y. Increasing anticancer effect in vitro and vivo of liposome-encapsulated iridium(III) complexes on BEL-7402 cells. J. Inorg. Biochem. 2021, 225, 111622. [Google Scholar] [CrossRef]
  28. Gilewska, A.; Barszcz, B.; Masternak, J.; Kazimierczuk, K.; Sitkowski, J.; Wietrzyk, J.; Turlej, E. Similarities and differences in d6 low-spin ruthenium, rhodium and iridium half-sandwich complexes: Synthesis, structure, cytotoxicity and interaction with biological targets. JBIC J. Biol. Inorg. Chem. 2019, 24, 591–606. [Google Scholar] [CrossRef]
  29. Liu, Z.; Li, J.; Ge, X.; Zhang, S.; Xu, Z.; Gao, W. Design, synthesis, and evaluation of phosphorescent Ir(III) complexes with anticancer activity. J. Inorg. Biochem. 2019, 197, 110703. [Google Scholar] [CrossRef]
  30. Nohara, A.; Umetani, T.; Sanno, Y. Studies on antianaphylactic agents-I: A facile synthesis of 4-oxo-4H-1-benzopyran-3-carboxaldehydes by vilsmeier reagents. Tetrahedron 1974, 30, 3553–3561. [Google Scholar] [CrossRef]
  31. Recanatini, M.; Bisi, A.; Cavall, A.; Belluti, F.; Gobbi, S.; Rampa, A.; Palzer, P.; Palusczak, A.; Hartmann, R.W. A new class of nonsteroidal aromatase inhibitors: Design and synthesis of chromone and xanthone derivatives and inhibition of the P450 enzymes aromatase and 17r-Hydroxylase/C17,20-Lyase. J. Med. Chem. 2001, 44, 672–680. [Google Scholar] [CrossRef]
  32. Liu, Y.J.; Cao, H.; Yao, J.H.; Li, H.; Yuan, Y.X.; Ji, L.N. Synthesis, characterization, and DNA interaction studies of the ruthenium(II) complexes [Ru(bpy)2(ipbp)]2+ and [Ru(ipbp)(phen)2]2+ (ipbp = 3-(1H-Imidazo[4,5-f][1,10]phenanthrolin-2-yl)-4H-1-benzopyran-2-one; bpy = 2,2′-bipyridine; phen = 1,10-phenanthroline). Helv. Chim. Acta 2004, 87, 3119–3130. [Google Scholar]
  33. Sprouse, S.; King, K.A.; Spellane, P.J.; Watts, R.J. Photophysical effects of metal-carbon.sigma. bonds in ortho-metalated complexes of iridium (III) and rhodium (III). J. Am. Chem. Soc. 1984, 106, 6647–6653. [Google Scholar] [CrossRef]
  34. Liu, Y.; Peterson, D.A.; Kimura, H.; Schubert, D. Diphenyltetrazolium bromide ( MTT ) reduction. J. Neurochem. 1997, 69, 581–593. [Google Scholar] [CrossRef] [PubMed]
  35. Wu, J.Z.; Ye, B.H.; Wang, L.; Ji, L.N.; Zhou, J.Y.; Li, R.H. Bis(2,2′-bipyridine)ruthenium(II) complexes with imidazo[4,5-f][1,10]-phenanthroline or 2-phenylimidazo[4,5-f][1,10]phenanthroline. J. Chem. Soc. Dalton Trans. 1997, 8, 1395–1402. [Google Scholar] [CrossRef]
  36. Kordestani, N.; Rudbari, H.A.; Fernandes, A.R.; Raposo, L.R.; Baptista, P.V.; Ferreira, D.; Bruno, G.; Bella, G.; Scopelliti, R.; Braun, J.D.; et al. Antiproliferative Activities of Diimine-Based Mixed Ligand Copper(II) Complexes. ACS Comb. Sci. 2020, 22, 89–99. [Google Scholar] [CrossRef]
  37. Dandash, F.; Léger, D.Y.; Fidanzi-Dugas, C.; Nasri, S.; Brégier, F.; Granet, R.; Karam, W.; Diab-Assaf, M.; Sol, V.; Liagre, B. In vitro anticancer activity of new gold(III) porphyrin complexes in colon cancer cells. J. Inorg. Biochem. 2017, 177, 27–38. [Google Scholar] [CrossRef]
  38. Bautista, H.R.; Díaz, R.O.S.; Shen, L.Z.Q.; Orvain, C.; Gaiddon, C.; Lagadec, R.L.; Ryabov, A.D. Impact of cyclometalated ruthe-nium(II) complexes on lactate dehydrogenase activity and cytotoxicity in gastric and colon cancer cells. J. Inorg. Biochem. 2016, 163, 28–38. [Google Scholar] [CrossRef]
  39. Gu, Y.; Wen, H.; Bai, L.; Zhou, Y.; Zhang, H.; Tian, L.; Zhang, Y.; Hao, J.; Liu, Y. Exploring anticancer efficiency of mitochondria-targeted cyclometalated iridium(III) complexes. J. Inorg. Biochem. 2020, 212, 111215. [Google Scholar] [CrossRef]
  40. Yugandhar, D.; Nayak, V.L.; Archana, S.; Shekar, K.C.; Srivastava, A.K. Design, synthesis and anticancer properties of novel oxa/azaspiro[4,5]trienones as potent apoptosis inducers through mitochondrial disruption. Eur. J. Med. Chem. 2015, 101, 348–357. [Google Scholar] [CrossRef] [PubMed]
  41. Heller, A.; Brockhoff, G.; Goepferich, A. Targeting drugs to mitochondria. Eur. J. Pharm. Biopharm. 2012, 82, 1–18. [Google Scholar] [CrossRef]
  42. Abu-Gosh, S.E.; Kolvazon, N.; Tirosh, B.; Ringel, I.; Yavin, E. Multiple Triphenylphosphonium Cations Shuttle a Hydrophilic Peptide into Mitochondria. Mol. Pharm. 2009, 6, 1138–1144. [Google Scholar] [CrossRef] [PubMed]
  43. Malugin, A.; Kopeèková, P.; Kopeèek, J. HPMA Copolymer-bound doxorubicin induces apoptosis in ovarian carcinoma cells by the disruption of mitochondrial function. Mol. Pharm. 2006, 3, 351–361. [Google Scholar] [CrossRef] [PubMed]
  44. Hajare, S.N.; Subramanian, M.; Gautam, S.; Sharma, A. Induction of apoptosis in human cancer cells by a Bacillus lipopeptide bacillomycin D. Biochimie 2013, 95, 1722–1731. [Google Scholar] [CrossRef] [PubMed]
  45. Rozanov, D.; Cheltsov, A.; Sergienko, E.; Vasile, S.; Golubkov, V.; Aleshin, A.E.; Levin, T.; Traer, E.; Hann, B.; Freimuth, J.; et al. TRAIL-Based High Throughput Screening Reveals a Link between TRAIL-Mediated Apoptosis and Glutathione Reductase, a Key Component of Oxidative Stress Response. PLoS ONE 2015, 10, e0129566. [Google Scholar] [CrossRef]
  46. Wan, D.; Lai, S.-H.; Zeng, C.-C.; Zhang, C.; Tang, B.; Liu, Y.-J. Ruthenium(II) polypyridyl complexes: Synthesis, characterization and anticancer activity studies on BEL-7402 cells. J. Inorg. Biochem. 2017, 173, 1–11. [Google Scholar] [CrossRef]
  47. Shapiro, G.I.; Harper, J. Anticancer drug targets: Cell cycle and checkpoint control. J. Clin. Investig. 1999, 104, 1645–1653. [Google Scholar] [CrossRef]
  48. Zhao, F.; Zhao, Y.; Liu, Y.; Chang, X.; Chen, C.; Zhao, Y. Cellular Uptake, Intracellular Trafficking, and Cytotoxicity of Nanomaterials. Small 2011, 7, 1322–1337. [Google Scholar] [CrossRef]
  49. Tang, B.; Shen, F.; Wan, D.; Guo, B.-H.; Wang, Y.-J.; Yi, Q.-Y.; Liu, Y.-J. DNA-binding, molecular docking studies and biological activity studies of ruthenium(ii) polypyridyl complexes. RSC Adv. 2017, 7, 34945–34958. [Google Scholar] [CrossRef]
  50. Xu, J.; Bai, L.; Gu, Y.-Y.; Du, F.; Zhang, W.-Y.; He, M.; Liu, Y.-J. Synthesis, characterization, apoptosis, ROS, autophagy and western blotting studies of cyclometalated iridium(III) complexes. Inorg. Chem. Commun. 2019, 111, 107594. [Google Scholar] [CrossRef]
  51. Cai, F.; Chen, M.; Zha, D.; Zhang, P.; Zhang, X.; Cao, N.; Wang, J.; He, Y.; Fan, X.; Zhang, W.; et al. Curcumol potentiates celecoxib-induced growth inhibition and apoptosis in human non-small cell lung cancer. Oncotarget 2017, 8, 115526–115545. [Google Scholar] [CrossRef]
  52. Wu, S.-W.; Su, C.-H.; Ho, Y.-C.; Huang-Liu, R.; Tseng, C.-C.; Chiang, Y.-W.; Yeh, K.-L.; Lee, S.-S.; Chen, W.-Y.; Chen, C.-J.; et al. Genotoxic effects of 1-nitropyrene in macrophages are mediated through a p53-dependent pathway involving cytochrome c release, caspase activation, and PARP-1 cleavage. Ecotoxicol. Environ. Saf. 2021, 213, 112062. [Google Scholar] [CrossRef] [PubMed]
  53. Wang, L.; Guan, R.; Xie, L.; Liao, X.; Xiong, K.; Ree, T.W.; Chen, Y.; Ji, L.; Chao, H. An ER-targeting iridium(III) complex which induces immunogenic cell death in non-small cell lung cancer. Angew. Chem. Int. Ed. Engl. 2021, 60, 4657–4665. [Google Scholar] [CrossRef] [PubMed]
  54. Guido, K.; Lorenzo, G.; Oliver, K.; Laurence, Z. Immunogenic cell death in cancer Therapy. Annu. Rev. Immunol. 2013, 31, 51–72. [Google Scholar]
Scheme 1. Synthetic route of ligand and complexes Ir1 and Ir2.
Molecules 27 05434 sch001
Figure 1. (a) The stability detection of the complexes (40 µM) in PBS solution at room temperature. (b) Luminescence of the complexes (40 µM) in PBS solution at room temperature.
Molecules 27 05434 g001
Figure 2. The cell viability of HCT116 (a) and normal LO2 (b) cells exposed to different concentrations of Ir1 (blue) and Ir2 (orange) for 48 h. * p < 0.05 represents significant difference compared with the control.
Molecules 27 05434 g002
Figure 3. Cell uptake assay after HCT116 cells were exposed to IC50 concentration of the complexes for 4 h.
Molecules 27 05434 g003
Figure 4. Multicellular tumor spheroids (3D) assay of HCT116 cells exposed to IC50 concentration of Ir1 and Ir2 for 24 h.
Molecules 27 05434 g004
Figure 5. (a) Wound healing in HCT116 cells after treatment with IC50 or 2IC50 of Ir1 and Ir2 for 0 h and 24 h. (b) Wound closure of the control and Ir1- and Ir2-treated group. (c) Colony formation of HCT116 cells were exposed to IC50 concentration of Ir1 and Ir2 for 24 h. (d,e) The expression of FAK protein after a 24 h treatment of HCT116 cells with IC50 or 2IC50 of concentrations of Ir1 and Ir2 for 24 h. β-actin was used as internal control. ** p < 0.01, *** p < 0.001.
Molecules 27 05434 g005
Figure 6. (a) The location of the complexes at the mitochondria after a 4 h exposure of HCT116 cells to IC50 concentration of the complexes. (b) The assay of the change of mitochondrial membrane potential and (c) the ratio of red/green fluorescence after HCT116 cells were treated with IC50 and 2IC50 concentration of the complexes and cisplatin (CDDP) for 24 h.
Molecules 27 05434 g006aMolecules 27 05434 g006b
Figure 7. Intracellular ATP content analysis after a 24 h treatment of HCT116 cells with IC50 and 2IC50 of Ir1 and Ir2 for 24 h. * p < 0.05, ** p < 0.01, *** p < 0.001.
Molecules 27 05434 g007
Figure 8. (a) Intracellular ROS levels assay after HCT116 cells exposure to ROSUP (positive control) and IC50 concentration of Ir1 and Ir2 for 24 h. (b) DCF fluorescence intensity was determined by flow cytometry after the treatment of HCT116 cells with ROSUP and IC50 and 2IC50 concentration of the complexes for 24 h. * p < 0.05, ** p < 0.01, *** p < 0.001.
Molecules 27 05434 g008
Figure 9. (a) Intracellular GSH and (b) MDA content assay after a 24 h exposure of HCT116 cells to IC50 or 2IC50 concentration of the complexes for 24 h. ** p < 0.01, *** p < 0.001.
Molecules 27 05434 g009
Figure 10. (a) Apoptosis assay after HCT116 cells (I) were treated with IC50, 2IC50 concentration of the complexes Ir1 (II, III) and Ir2 (IV, V) for 24 h. (b) The apoptotic percentage of early and late apoptosis. Q1, Q2, Q3 and Q4 stand for necrotic cell, late apoptosis, early apoptosis and living cell, respectively.
Molecules 27 05434 g010aMolecules 27 05434 g010b
Figure 11. (a) Cell cycle arrest of HCT116 was treated with IC50 concentration of Ir1 and Ir2 for 24 h. (b) Expression of p53, cyclin D1, CDK4 and p21 proteins after a 24 h treatment of HCT116 cells with IC50 and 2IC50 concentration of Ir1 and Ir2 for 24 h. (c) Gray values of the expression of p53, cyclin D1, CDK4 and p21 proteins.
Molecules 27 05434 g011
Figure 12. (a) Autophagy assay of HCT116 cells exposed to IC50 and 2IC50 concentration of Ir1 and Ir2 for 24 h. (b) The gray values of the expression of Beclin-1, β-actin was used as internal control.
Molecules 27 05434 g012
Figure 13. (a) Expression of Bcl-2 family proteins after a 24 h exposure of HCT116 cells to IC50 and 2IC50 concentration of Ir1 and Ir2 for 24 h. (b) The gray values of PARP, caspase 3, PI3K, AKT, Bcl-2 and Bax proteins.
Molecules 27 05434 g013
Figure 14. The assays of intracellular CRT (a) and HSP70 (b) content after a 24 h exposure of HCT116 cells to IC50 concentration of Ir1 and Ir2.
Molecules 27 05434 g014
Publisher’s Note: MDPI stays neutral with regard to jurisdictional claims in published maps and institutional affiliations.

