
Effect of Inulin on Organic Acids and Microstructure of Synbiotic Cheddar-Type Cheese Made from Buffalo Milk

 ,
,  ,
,
Abstract
1. Introduction
2. Results and Discussion
2.1. Physicochemical Analysis
2.2. Mineral Profiling
2.3. Organic Acids
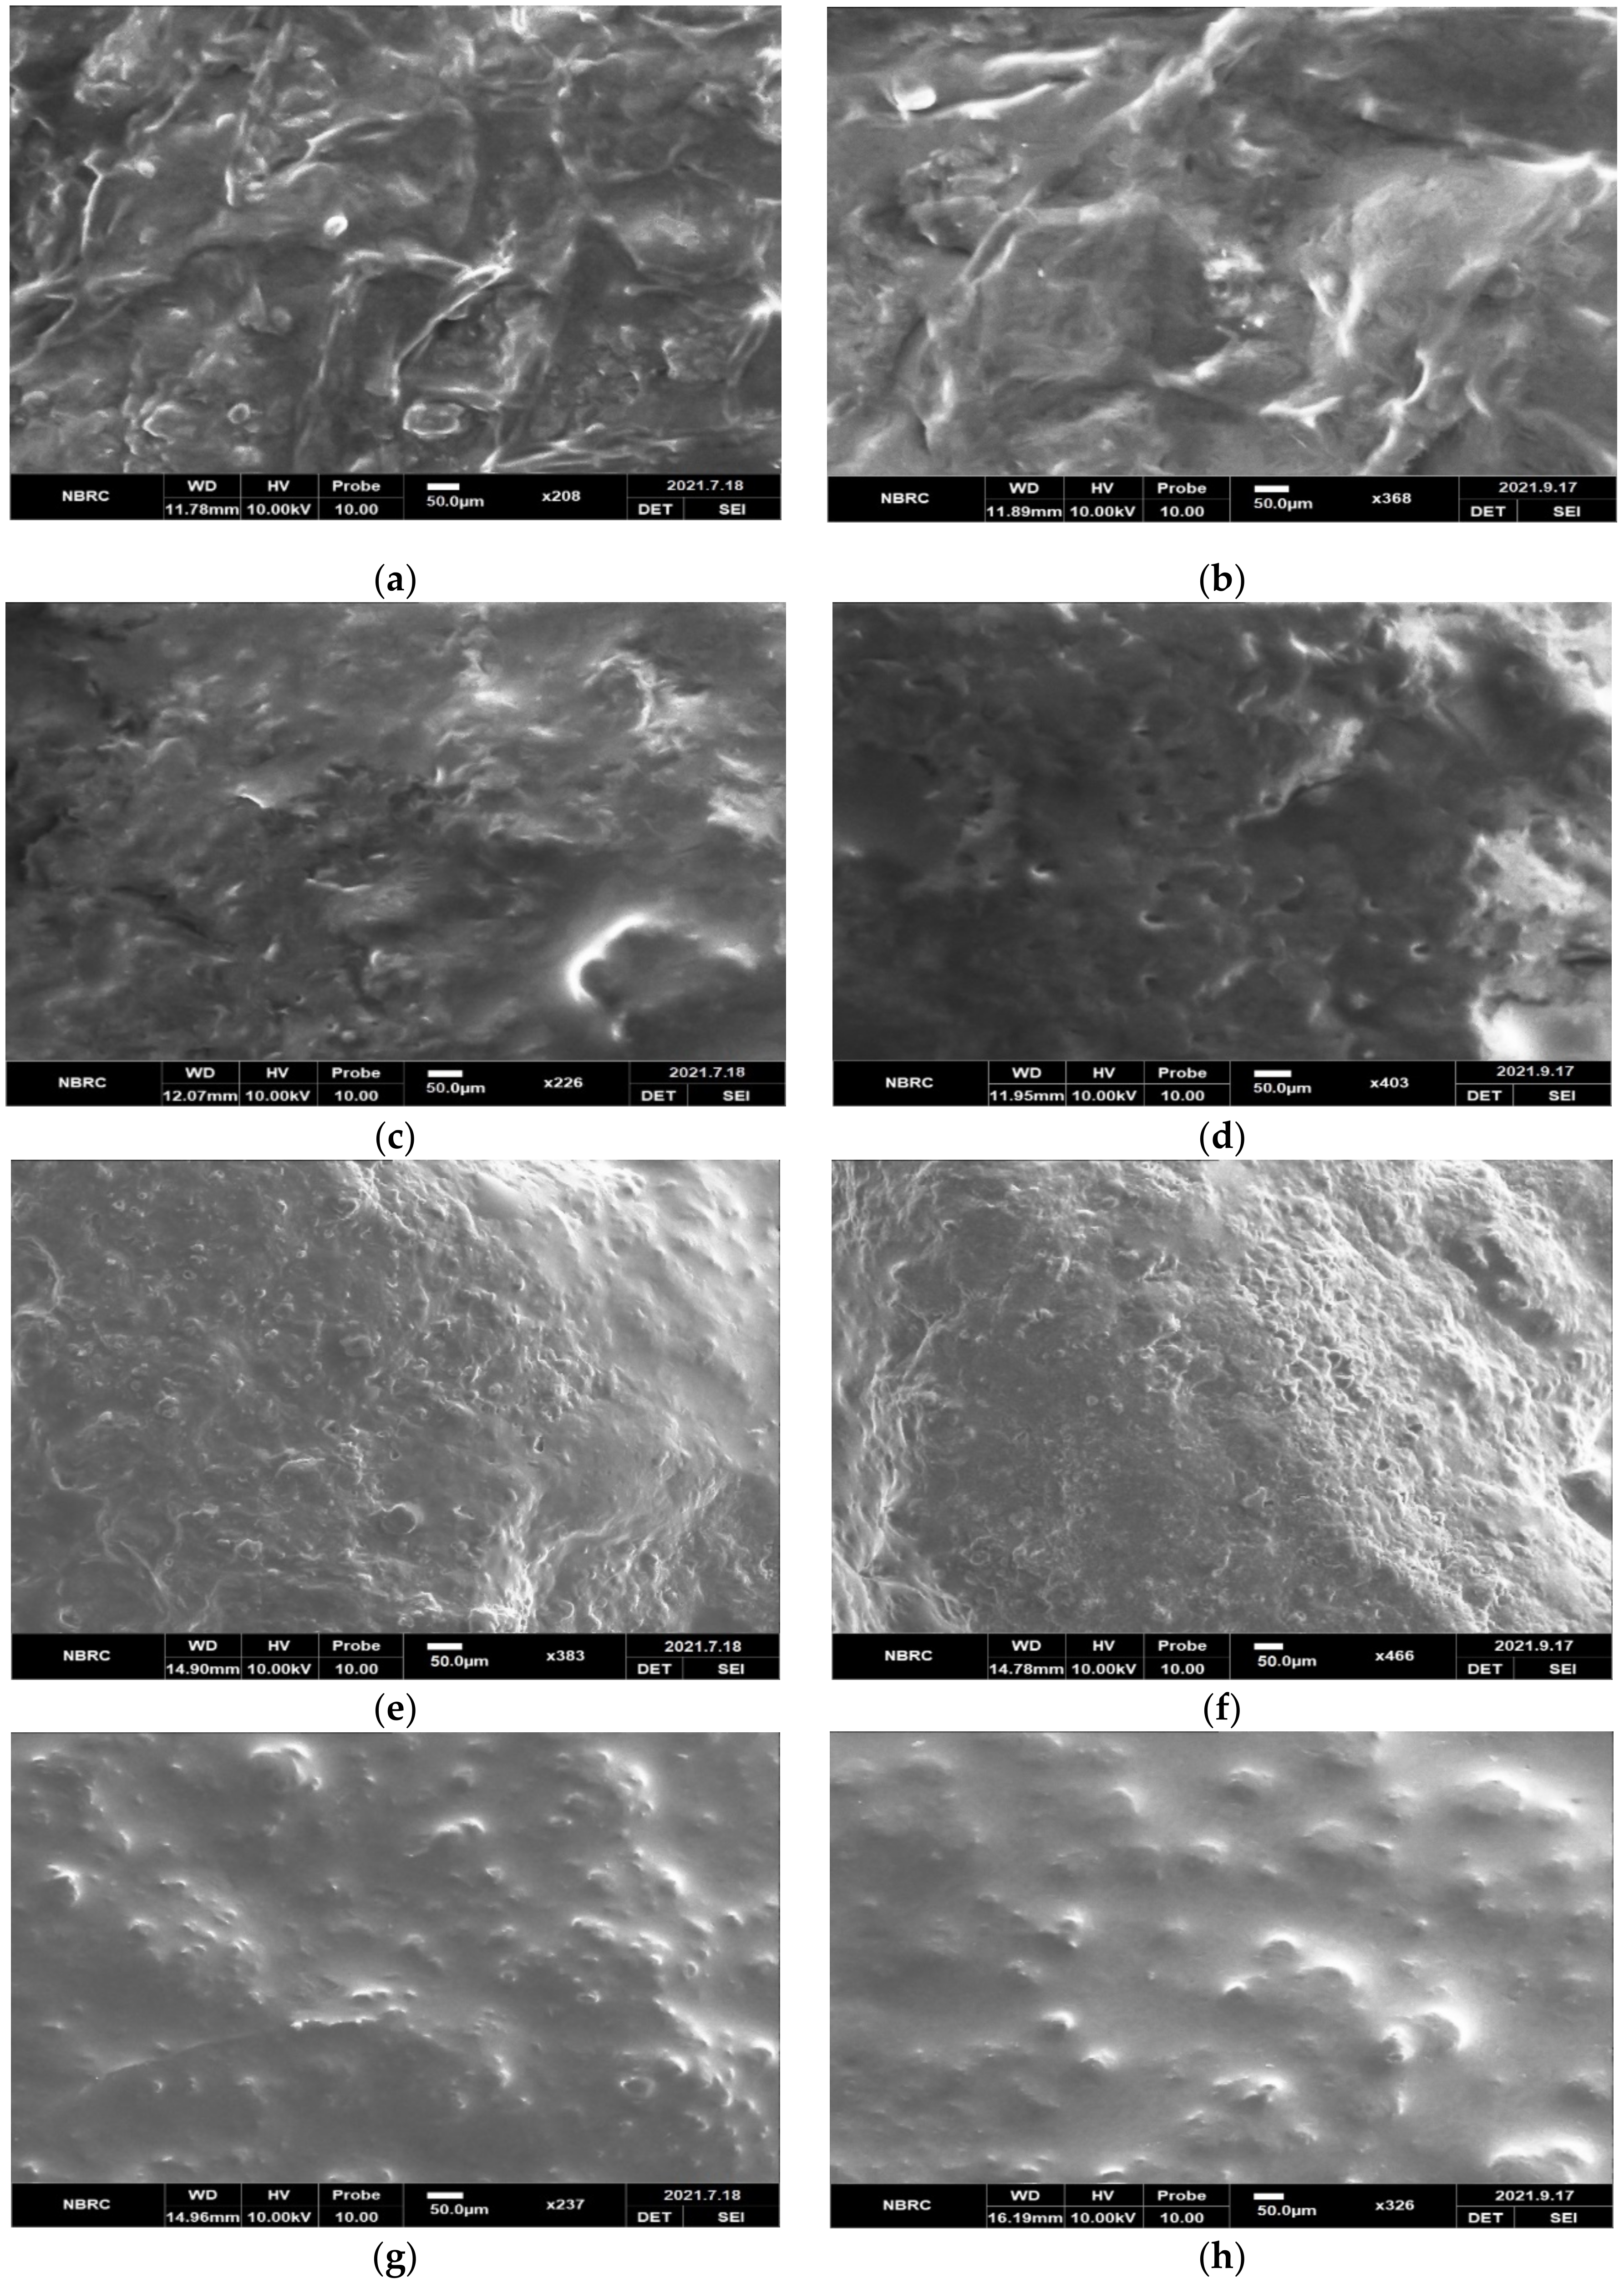
2.4. Microstructure
2.5. Sensory Evaluation
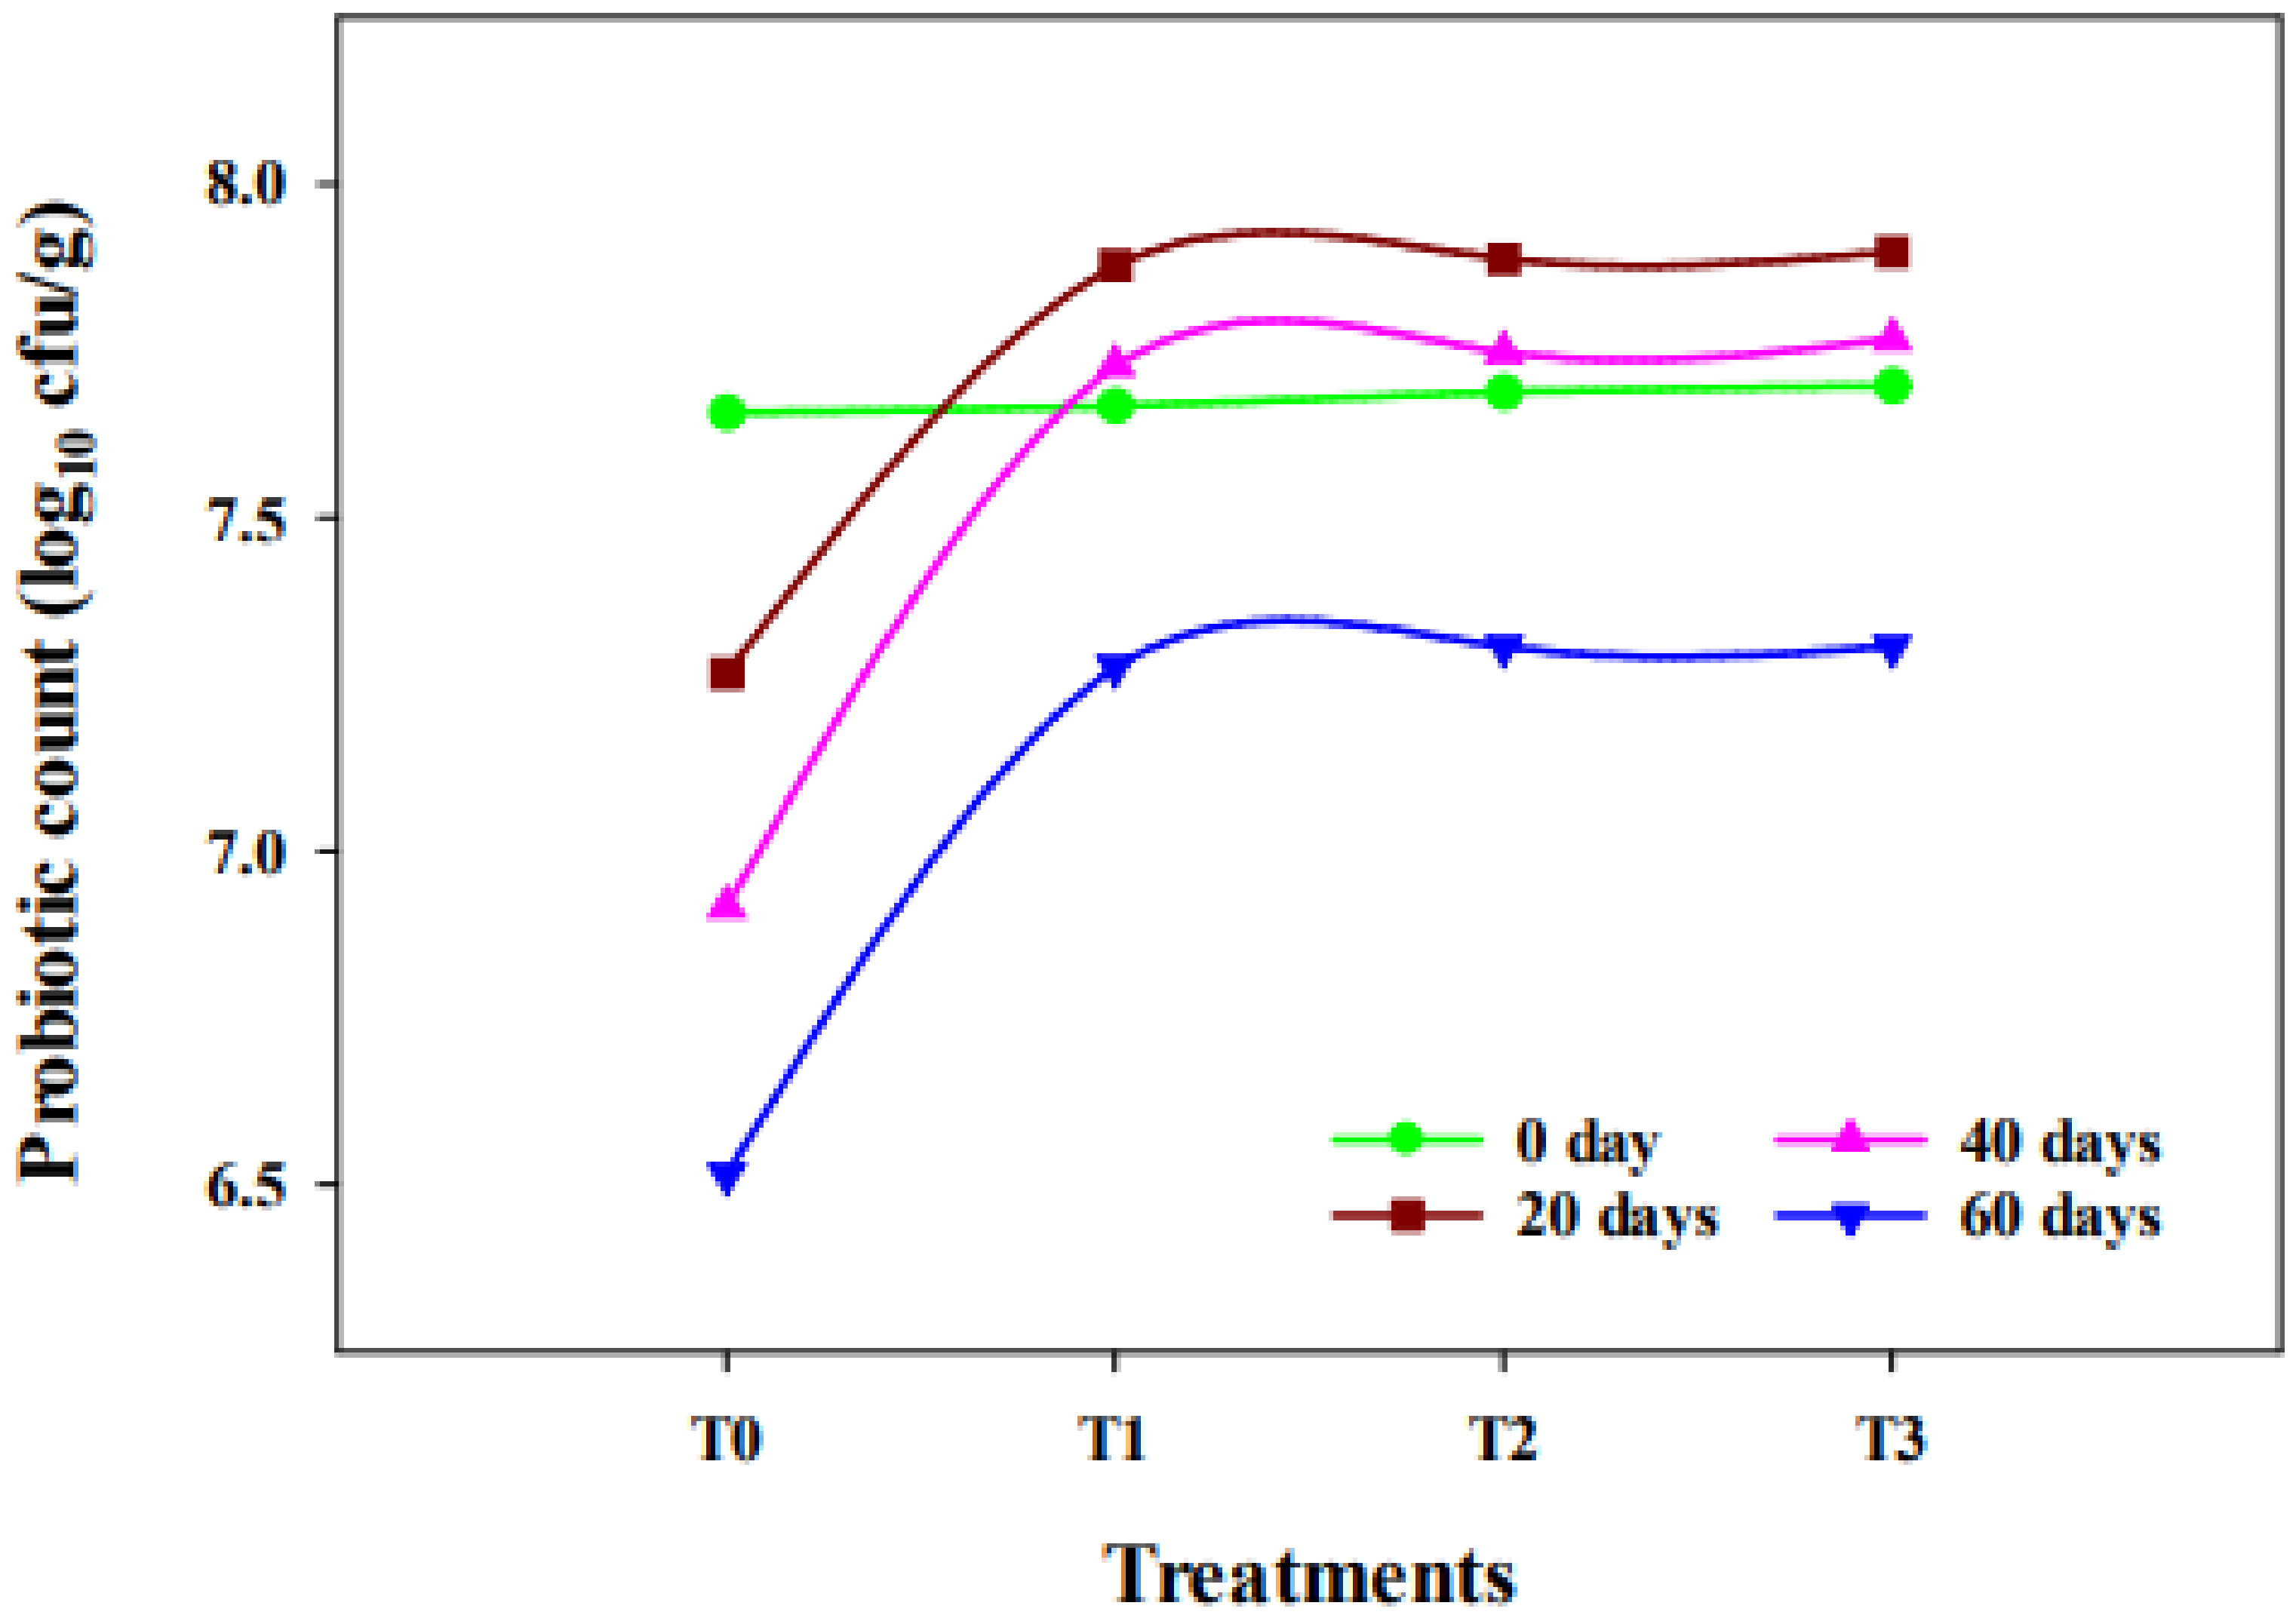
2.6. Probiotic Count
3. Materials and Methods
3.1. Raw Materials Procurement
3.2. Production of Cheese
3.3. Physicochemical Composition
3.4. Mineral Profile
3.5. Estimation of Organic Acids
3.6. SEM Analysis
3.7. Sensory Evaluation
3.8. Survival of Probiotics
3.9. Statistical Analysis
4. Conclusions
Author Contributions
Funding
Institutional Review Board Statement
Informed Consent Statement
Data Availability Statement
Acknowledgments
Conflicts of Interest
References
- Cencic, A.; Chingwaru, W. The role of functional foods, nutraceuticals, and food supplements in intestinal health. Nutrients 2010, 2, 611–625. [Google Scholar] [CrossRef] [PubMed]
- Ahmad, S.; Nadeem, M.; Ayaz, M.; Jaspal, M.H. Effect of low-melting fractions of milk fat on lipolysis of Cheddar cheese. J. Food Process. Preserv. 2015, 39, 2516–2522. [Google Scholar] [CrossRef]
- Hill, C.; Guarner, F.; Reid, G.; Gibson, G.R.; Merenstein, D.J.; Pot, B.; Morelli, L.; Canani, R.B.; Flint, H.J.; Salminen, S.; et al. The International Scientific Association for Probiotics and Prebiotics consensus statement on the scope and appropriate use of the term probiotic. Nat. Rev. Gastroenterol. Hepatol. 2014, 11, 506–514. [Google Scholar] [CrossRef] [PubMed]
- Champagne, C.P.; da Cruz, A.G.; Daga, M. Strategies to improve the functionality of probiotics in supplements and foods. Curr. Opin. Food Sci. 2018, 22, 145–166. [Google Scholar] [CrossRef]
- Karimi, R.; Mortazavian, A.M.; Da Cruz, A.G. Viability of probiotic microorganisms in cheese during production and storage: A review. Dairy Sci. Technol. 2011, 91, 283–308. [Google Scholar] [CrossRef]
- Fernández, M.; Hudson, J.A.; Korpela, R.; de los Reyes-Gavilán, C.G. Impact on human health of microorganisms present in fermented dairy products: An overview. BioMed Res. Int. 2015, 412714. [Google Scholar] [CrossRef]
- Beykont, E.; Kilic-Akyilmaz, M. Physical properties of an imitation cheese as Affected by emulsifying salts and citric acid. J. Food Process. Preserv. 2014, 38, 1918–1925. [Google Scholar] [CrossRef]
- Desfossés-Foucault, É.; Dussault-Lepage, V.; Le Boucher, C.; Savard, P.; LaPointe, G.; Roy, D. Assessment of probiotic viability during Cheddar cheese manufacture and ripening using propidium monoazide-PCR quantification. Front. Microbiol. 2012, 3, 350. [Google Scholar] [CrossRef]
- Ganesan, B.; Weimer, B.C.; Pinzon, J.; Dao Kong, N.; Rompato, G.; Brothersen, C.; McMahon, D.J. Probiotic bacteria survive in Cheddar cheese and modify populations of other lactic acid bacteria. J. Appl. Microbiol. 2014, 116, 1642–1656. [Google Scholar] [CrossRef]
- Karimi, R.; Mortazavian, A.M.; Amiri-Rigi, A. Selective enumeration of probiotic microorganisms in cheese. Food Microbiol. 2012, 29, 1–9. [Google Scholar] [CrossRef]
- Al-Sheraji, S.H.; Ismail, A.; Manap, M.Y.; Mustafa, S.; Yusof, R.M.; Hassan, F.A. Prebiotics as functional foods: A review. J. Funct. Foods 2013, 5, 1542–1553. [Google Scholar] [CrossRef]
- Speranza, B.; Campaniello, D.; Monacis, N.; Bevilacqua, A.; Sinigaglia, M.; Corbo, M.R. Functional cream cheese supplemented with Bifidobacterium animalis subsp. lactis DSM 10140 and Lactobacillus reuteri DSM 20016 and prebiotics. Food Microbiol. 2018, 72, 16–22. [Google Scholar] [CrossRef]
- Quigley, E.M. Prebiotics and probiotics in digestive health. Clin. Gastroenterol. Hepatol. 2018, 17, 333–344. [Google Scholar] [CrossRef]
- Liu, R.T.; Walsh, R.F.; Sheehan, A.E. Prebiotics and probiotics for depression and anxiety: A systematic review and meta-analysis of controlled clinical trials. Neurosci. Biobehav. Rev. 2019, 102, 13–23. [Google Scholar] [CrossRef]
- Swanson, K.S.; Gibson, G.R.; Hutkins, R.; Reimer, R.A.; Reid, G.; Verbeke, K.; Scott, K.P.; Holscher, H.D.; Azad, M.B.; Delzenne, N.M.; et al. The International Scientific Association for Probiotics and Prebiotics (ISAPP) consensus statement on the definition and scope of synbiotics. Nat. Rev. Gastroenterol. Hepatol. 2020, 7, 687–701. [Google Scholar] [CrossRef]
- Zamora-Vega, R.; Montantilde, J.L.; Venegas-González, J.; Bernardino-Nicanor, A.; Cruz, L.G.; Martínez-Flores, H.E. Development and characterization of a symbiotic cheese added with Saccharomyces boulardii and inulin. Afr. J. Microbiol. Res. 2013, 7, 2828–2834. [Google Scholar]
- Angiolillo, L.; Conte, A.; Faccia, M.; Zambrini, A.V.; Del Nobile, M.A. A new method to produce synbiotic Fiordilatte cheese. Innov. Food Sci. Emerg. Technol. 2014, 22, 180–187. [Google Scholar] [CrossRef]
- Rani, K.S.; Srividya, N. Effect of inulin, fructooligosaccharides and L. acidophilus in formulating a synbiotic yoghurt. Asian J. Dairy Food Res. 2016, 35, 37–40. [Google Scholar] [CrossRef][Green Version]
- Rezaei, R.; Khomeiri, M.; Aalami, M.; Kashaninejad, M. Effect of inulin on the physicochemical properties, flow behavior and probiotic survival of frozen yogurt. J. Food Sci. Technol. 2014, 51, 2809–2814. [Google Scholar] [CrossRef]
- Ozturkoglu-Budak, S.; Akal, H.C.; Buran, İ.; Yetişemiyen, A. Effect of inulin polymerization degree on various properties of synbiotic fermented milk including Lactobacillus acidophilus La-5 and Bifidobacterium animalis Bb-12. J. Dairy Sci. 2019, 102, 6901–6913. [Google Scholar] [CrossRef]
- Barbosa, I.C.; Oliveira, M.E.; Madruga, M.S.; Gullón, B.; Pacheco, M.T.; Gomes, A.M.; Batista, A.S.; Pintado, M.M.; Souza, E.L.; Queiroga, R.C. Influence of the addition of Lactobacillus acidophilus La-05, Bifidobacterium animalis subsp. lactis Bb-12 and inulin on the technological, physicochemical, microbiological and sensory features of creamy goat cheese. Food Funct. 2016, 7, 4356–4371. [Google Scholar] [CrossRef]
- Giri, A.; Kanawjia, S.K.; Singh, M.P. Effect of inulin on physico-chemical, sensory, fatty acid profile and microstructure of processed cheese spread. J. Food Sci. Technol. 2017, 54, 2443–2451. [Google Scholar] [CrossRef]
- Rafiq, S.; Huma, N.; Pasha, I.; Shahid, M. Compositional profiling and proteolytic activities in cow and buffalo milk cheddar cheese. Pak. J. Zool. 2016, 48, 1141–1146. [Google Scholar]
- Murtaza, M.A.; Anjum, F.M.; Anjum, M. Nutritional comparison of cow and buffalo milk cheddar cheese. Pak. J. Nutr. 2008, 7, 509–512. [Google Scholar] [CrossRef][Green Version]
- Murtaza, M.A.; Rehman, S.U.; Anjum, F.M.; Huma, N.; Tarar, O.M.; Mueen-Ud-Din, G. Organic acid contents of buffalo milk Cheddar cheese as influenced by accelerated ripening and sodium salt. J. Food Biochem. 2012, 36, 99–106. [Google Scholar] [CrossRef]
- Costa, G.; Vasconcelos, Q.; Abreu, G.; Albuquerque, A.; Vilarejo, J.; Aragão, G. Changes in nutrient absorption in children and adolescents caused by fructans, especially fructooligosaccharides and inulin. Archives de Pédiatrie 2020, 27, 166–169. [Google Scholar] [CrossRef]
- Liong, M.T.; Shah, N.P. Production of organic acids from fermentation of mannitol, fructooligosaccharide and inulin by a cholesterol removing Lactobacillus acidophilus strain. J. Appl. Microbiol. 2005, 99, 783–793. [Google Scholar] [CrossRef] [PubMed]
- De Souza Oliveira, R.P.; Perego, P.; de Oliveira, M.N.; Converti, A. Growth, organic acids profile and sugar metabolism of Bifidobacterium lactis in co-culture with Streptococcus thermophilus: The inulin effect. Food Res. Int. 2012, 48, 21–27. [Google Scholar] [CrossRef]
- Da Cruz, A.G.; Buriti, F.C.A.; de Souza, C.H.B.; Faria, J.A.F.; Saad, S.M.I. Probiotic cheese: Health benefits, technological and stability aspects. Trends Food Sci. Technol. 2009, 20, 344–354. [Google Scholar] [CrossRef]
- Murtaza, M.A.; Huma, N.; Shabbir, M.A.; Murtaza, M.S.; Anees-ur-Rehman, M. Survival of microorganisms and organic acid profile of probiotic Cheddar cheese from buffalo milk during accelerated ripening. Int. J. Dairy Technol. 2017, 70, 562–571. [Google Scholar] [CrossRef]
- Kip, P.; Meyer, D.; Jellema, R.H. Inulin improve sensoric and textural properties of low-fat yoghurts. Int. Dairy J. 2006, 16, 1098–1103. [Google Scholar] [CrossRef]
- Sarwar, A.; Aziz, T.; Al-Dalali, S.; Zhao, X.; Zhang, J.; Chen, C.; Cao, Y.; Yang, Z. Physicochemical and microbiological properties of Synbiotic yogurt made with probiotic yeast Saccharomyces boulardii in combination with Inulin. Foods 2019, 8, 468. [Google Scholar] [CrossRef]
- Junyusen, T.; Ngampang, N.; Sangmuang, A.; Suthada, S.; Chatchavanthatri, N. The effects of inulin on the textural, thermal, and microstructural properties of reduced-fat cheese. Suranaree J. Sci. Technol. 2017, 24, 23–30. [Google Scholar]
- Blaschek, K.M.; Wendorff, W.L.; Rankin, S.A. Survey of Salty and Sweet Whey Composition from Various Cheese Plants in Wisconsin. J. Dairy Sci. 2007, 90, 2029–2034. [Google Scholar] [CrossRef]
- AOAC. Official Methods of Analysis of AOAC International, 18th ed.; AOAC International: 481 North Frederick Avenue; AOAC: Gaithersburg, MD, USA, 2005. [Google Scholar]
- IDF 221:2008; Milk and Milk Products. Determination of Fat Content. Van Gulik Method. International Dairy Federation: Brussels, Belgium, 2008.
- IDF 20-1:2014; Milk and Milk Products. Determination of Nitrogen Content—Part 1: Kjeldahl Principle and Crude Protein Calculation. International Dairy Federation: Brussels, Belgium, 2014.
- Sulieman, A.M.E.; Ohag, O.M.; Hassan, H.M.; Abdelmageed, E.; Veetil, V.M. Production and quality evaluation of gouda cheese produced at small scale level. Int. J. Food Sci. Nutr. Eng. 2018, 8, 45–51. [Google Scholar]
- Jooyandeh, H.; Goudarzi, M.; Rostamabadi, H.; Hojjati, M. Effect of Persian and almond gums as fat replacers on the physicochemical, rheological, and microstructural attributes of low-fat Iranian White cheese. Food Sci. Nutr. 2017, 5, 669–677. [Google Scholar] [CrossRef]
- Shaukat, A.; Nadeem, M.; Qureshi, T.M.; Kanwal, R.; Sultan, M.; Kashongwe, O.B.; Shamshiri, R.R.; Murtaza, M.A. Effect of In Vitro Digestion on the Antioxidant and Angiotensin-Converting Enzyme Inhibitory Potential of Buffalo Milk Processed Cheddar Cheese. Foods 2021, 10, 1661. [Google Scholar] [CrossRef]
- Steel, R.G.D. Analysis of variance II: Multiway classifications. In Principles and Procedures of Statistics: A Biometrical Approach; McGraw-Hill: New York, NY, USA, 1997; pp. 204–252. [Google Scholar]


| Parameter | Treatments | Ripening | Means | |||
|---|---|---|---|---|---|---|
| 0 Day | 20 Days | 40 Days | 60 Days | |||
| Moisture % | T0 | 38.67 ± 0.02 a | 38.36 ± 0.01 b | 38.07 ± 0.01 d | 37.78 ± 0.01 g | 38.22 ± 0.01 a |
| T1 | 38.23 ± 0.01 c | 37.97 ± 0.02 f | 37.74 ± 0.01 gh | 37.50 ± 0.02 ij | 37.86 ± 0.01 b | |
| T2 | 38.03 ± 0.01 e | 37.73 ± 0.01 h | 37.48 ± 0.02 j | 37.22 ± 0.01 l | 37.61 ± 0.01 c | |
| T3 | 37.77 ± 0.02 g | 37.53 ± 0.01 i | 37.36 ± 0.01 k | 37.11 ± 0.02 m | 37.44 ± 0.01 d | |
| Fat % | T0 | 31.32 ± 0.02 d | 31.43 ± 0.03 c | 31.52 ± 0.03 b | 31.63 ± 0.03 a | 31.48 ± 0.02 a |
| T1 | 31.13 ± 0.03 f | 31.22 ± 0.03 e | 31.33 ± 0.03 d | 31.42 ± 0.03 c | 31.28 ± 0.03 b | |
| T2 | 31.01 ± 0.02 g | 31.11 ± 0.02 f | 31.22 ± 0.03 e | 31.33 ± 0.03 d | 31.17 ± 0.02 c | |
| T3 | 30.88 ± 0.03 h | 31.01 ± 0.02 g | 31.11 ± 0.02 f | 31.22 ± 0.03 e | 31.06 ± 0.02 d | |
| Protein % | T0 | 27.11 ± 0.01 f | 27.28 ± 0.02 d | 27.43 ± 0.01 b | 27.59 ± 0.02 a | 27.35 ± 0.02 a |
| T1 | 26.94 ± 0.01 h | 27.12 ± 0.01 f | 27.28 ± 0.01 d | 27.42 ± 0.02 b | 27.19 ± 0.01 b | |
| T2 | 26.85 ± 0.01 i | 27.02 ± 0.01 fg | 27.20 ± 0.02 e | 27.33 ± 0.01 c | 27.10 ± 0.01 c | |
| T3 | 26.72 ± 0.01 j | 26.91 ± 0.01 h | 27.06 ± 0.01 g | 27.21 ± 0.01 e | 26.97 ± 0.01 d | |
| Ash % | T0 | 3.956 ± 0.002 i | 3.977 ± 0.002 gh | 3.998 ± 0.002 d | 4.027 ± 0.002 a | 3.989 ± 0.002 a |
| T1 | 3.949 ± 0.002 j | 3.971 ± 0.001 h | 3.990 ± 0.001 e | 4.020 ± 0.002 ab | 3.982 ± 0.001 b | |
| T2 | 3.941 ± 0.001 k | 3.962 ± 0.002 i | 3.985 ± 0.001 ef | 4.014 ± 0.001 b | 3.976 ± 0.001 c | |
| T3 | 3.932 ± 0.002 l | 3.943 ± 0.001 jk | 3.980 ± 0.002 fg | 4.006 ± 0.002 c | 3.964 ± 0.002 d | |
| pH | T0 | 5.35 ± 0.01 a | 5.28 ± 0.01 c | 5.21 ± 0.01 e | 5.12 ± 0.01 g | 5.24 ± 0.01 a |
| T1 | 5.32 ± 0.01 b | 5.25 ± 0.01 d | 5.18 ± 0.01 f | 5.09 ± 0.01 h | 5.21 ± 0.01 b | |
| T2 | 5.30 ± 0.01 c | 5.22 ± 0.01 d | 5.16 ± 0.01 f | 5.07 ± 0.01 i | 5.19 ± 0.01 c | |
| T3 | 5.29 ± 0.01 c | 5.21 ± 0.01 e | 5.14 ± 0.01 g | 5.05 ± 0.01 i | 5.17 ± 0.01 d | |
| Acidity % | T0 | 0.898 ± 0.001 h | 0.902 ± 0.001 fg | 0.906 ± 0.001 de | 0.911 ± 0.001 bc | 0.904 ± 0.001 d |
| T1 | 0.900 ± 0.001 gh | 0.904 ± 0.001 fg | 0.908 ± 0.001 cd | 0.912 ± 0.001 abc | 0.906 ± 0.001 c | |
| T2 | 0.902 ± 0.001 fg | 0.905 ± 0.001 ef | 0.910 ± 0.001 abc | 0.913 ± 0.001 ab | 0.908 ± 0.001 b | |
| T3 | 0.905 ± 0.001 ef | 0.907 ± 0.001 de | 0.913 ± 0.001 ab | 0.915 ± 0.001 a | 0.910 ± 0.001 a | |
| Minerals | Treatments | Ripening | Means | |||
|---|---|---|---|---|---|---|
| 0 Day | 20 Days | 40 Days | 60 Days | |||
| Sodium (mg) | T0 | 680.46 ± 0.01 j | 680.98 ± 0.01 f | 681.48 ± 0.02 c | 681.98 ± 0.01 a | 681.22 ± 0.01 a |
| T1 | 680.11 ± 0.02 m | 680.55 ± 0.01 i | 681.10 ± 0.01 e | 681.57 ± 0.01 b | 680.83 ± 0.01 b | |
| T2 | 679.76 ± 0.01 o | 680.21 ± 0.01 l | 680.75 ± 0.01 h | 681.26 ± 0.01 d | 680.50 ± 0.01 c | |
| T3 | 679.40 ± 0.01 p | 679.88 ± 0.01 n | 680.39 ± 0.02 k | 680.88 ± 0.01 g | 680.14 ± 0.01 d | |
| Potassium (mg) | T0 | 81.40 ± 0.01 k | 81.66 ± 0.02 g | 81.93 ± 0.01 c | 82.18 ± 0.01 a | 81.79 ± 0.01 a |
| T1 | 81.27 ± 0.01 m | 81.53 ± 0.01 i | 81.78 ± 0.01 e | 82.05 ± 0.01 b | 81.66 ± 0.01 b | |
| T2 | 81.10 ± 0.01 n | 81.36 ± 0.02 l | 81.63 ± 0.01 h | 81.89 ± 0.01 d | 81.50 ± 0.01 c | |
| T3 | 80.98 ± 0.02 o | 81.24 ± 0.01 m | 81.49 ± 0.01 j | 81.73 ± 0.01 f | 81.36 ± 0.01 d | |
| Calcium (mg) | T0 | 749.23 ± 0.01 i | 749.55 ± 0.01 f | 749.88 ± 0.01 c | 750.20 ± 0.01 a | 749.72 ± 0.01 a |
| T1 | 749.11 ± 0.01 j | 749.43 ± 0.02 g | 749.74 ± 0.01 d | 750.07 ± 0.01 b | 749.59 ± 0.01 b | |
| T2 | 748.96 ± 0.01 k | 749.30 ± 0.01 h | 749.45 ± 0.01 e | 749.92 ± 0.01 c | 749.44 ± 0.01 c | |
| T3 | 748.81 ± 0.01 l | 749.15 ± 0.01 j | 749.46 ± 0.02 g | 749.77 ± 0.02 d | 749.29 ± 0.01 d | |
| Organic Acids | Treatments | Ripening | Means | |||
|---|---|---|---|---|---|---|
| 0 Day | 20 Days | 40 Days | 60 Days | |||
| Lactic acid (ppm) | T0 | 14,245 ± 3 o | 14,476 ± 3 k | 14,753 ± 4 g | 14,902 ± 5 d | 14,594 ± 4 d |
| T1 | 14,298 ± 6 n | 14,525 ± 4 j | 14,803 ± 5 f | 14,951 ± 4 c | 14,644 ± 5 c | |
| T2 | 14,351 ± 6 m | 14,588 ± 5 i | 14,852 ± 4 e | 15,005 ± 5 b | 14,699 ± 5 b | |
| T3 | 14,409 ± 5 l | 14,652 ± 5 h | 14,911 ± 5 d | 15,058 ± 6 a | 14,758 ± 5 a | |
| Acetic acid (ppm) | T0 | 421.0 ± 1.0 i | 428.0 ± 1.0 h | 435.7 ± 0.6 f | 442.7 ± 0.6 f | 431.8 ± 0.8 d |
| T1 | 425.7 ± 0.6 h | 435.0 ± 1.0 f | 443.3 ± 0.6 e | 450.7 ± 0.6 c | 438.6 ± 0.7 c | |
| T2 | 430.7 ± 0.6 g | 441.3 ± 0.6 e | 450.0 ± 1.0 c | 458.3 ± 0.6 b | 445.1 ± 0.7 b | |
| T3 | 436.3 ± 0.6 f | 447.0 ± 1.0 d | 457.3 ± 1.1 b | 467.7 ± 1.1 a | 452.0 ± 1.0 a | |
| Citric acid (ppm) | T0 | 828.3 ± 1.1 l | 849.7 ± 1.1 j | 871.7 ± 1.5 g | 896.7 ± 1.5 d | 861.6 ± 1.3 d |
| T1 | 841.3 ± 0.6 k | 863.7 ± 0.6 h | 886.0 ± 1.0 e | 912.0 ± 1.0 c | 875.7 ± 0.8 c | |
| T2 | 853.6 ± 0.6 i | 875.7 ± 0.6 f | 899.7 ± 0.6 d | 926.3 ± 1.1 b | 888.8 ± 0.7 b | |
| T3 | 862.7 ± 1.1 h | 887.0 ± 1.1 e | 913.7 ± 0.6 c | 941.0 ± 1.0 a | 901.1 ± 0.9 a | |
| Butyric acid (ppm) | T0 | 1862.0 ± 2.0 m | 1896.3 ± 2.1 j | 1931.0 ± 1.0 g | 1968.0 ± 1.0 d | 1914.3 ± 1.5 d |
| T1 | 1874.3 ± 1.5 l | 1908.0 ± 1.0 i | 1943.7 ± 1.5 f | 1980.0 ± 1.7 c | 1926.5 ± 1.4 c | |
| T2 | 1886.3 ± 1.5 k | 1919.7 ± 1.5 h | 1955.0 ± 1.0 e | 1992.0 ± 1.0 b | 1938.3 ± 1.3 b | |
| T3 | 1899.7 ± 1.5 j | 1930.7 ± 1.2 g | 1966.3 ± 1.5 d | 2002.3 ± 0.6 a | 1949.8 ± 1.2 a | |
Publisher’s Note: MDPI stays neutral with regard to jurisdictional claims in published maps and institutional affiliations. |
© 2022 by the authors. Licensee MDPI, Basel, Switzerland. This article is an open access article distributed under the terms and conditions of the Creative Commons Attribution (CC BY) license (https://creativecommons.org/licenses/by/4.0/).
Share and Cite
Islam, M.; Alharbi, M.A.; Alharbi, N.K.; Rafiq, S.; Shahbaz, M.; Murtaza, S.; Raza, N.; Farooq, U.; Ali, M.; Imran, M.; et al. Effect of Inulin on Organic Acids and Microstructure of Synbiotic Cheddar-Type Cheese Made from Buffalo Milk. Molecules 2022, 27, 5137. https://doi.org/10.3390/molecules27165137
Islam M, Alharbi MA, Alharbi NK, Rafiq S, Shahbaz M, Murtaza S, Raza N, Farooq U, Ali M, Imran M, et al. Effect of Inulin on Organic Acids and Microstructure of Synbiotic Cheddar-Type Cheese Made from Buffalo Milk. Molecules. 2022; 27(16):5137. https://doi.org/10.3390/molecules27165137
Chicago/Turabian StyleIslam, Mahad, Maha A. Alharbi, Nada K. Alharbi, Saima Rafiq, Muhammad Shahbaz, Shamas Murtaza, Nighat Raza, Umar Farooq, Muqarrab Ali, Muhammad Imran, and et al. 2022. "Effect of Inulin on Organic Acids and Microstructure of Synbiotic Cheddar-Type Cheese Made from Buffalo Milk" Molecules 27, no. 16: 5137. https://doi.org/10.3390/molecules27165137
APA StyleIslam, M., Alharbi, M. A., Alharbi, N. K., Rafiq, S., Shahbaz, M., Murtaza, S., Raza, N., Farooq, U., Ali, M., Imran, M., & Ali, S. (2022). Effect of Inulin on Organic Acids and Microstructure of Synbiotic Cheddar-Type Cheese Made from Buffalo Milk. Molecules, 27(16), 5137. https://doi.org/10.3390/molecules27165137