
Predicting the Surface Tension of Deep Eutectic Solvents: A Step Forward in the Use of Greener Solvents

 , ,
, ,  ,
, 

Abstract
:1. Introduction
2. Materials and Methods
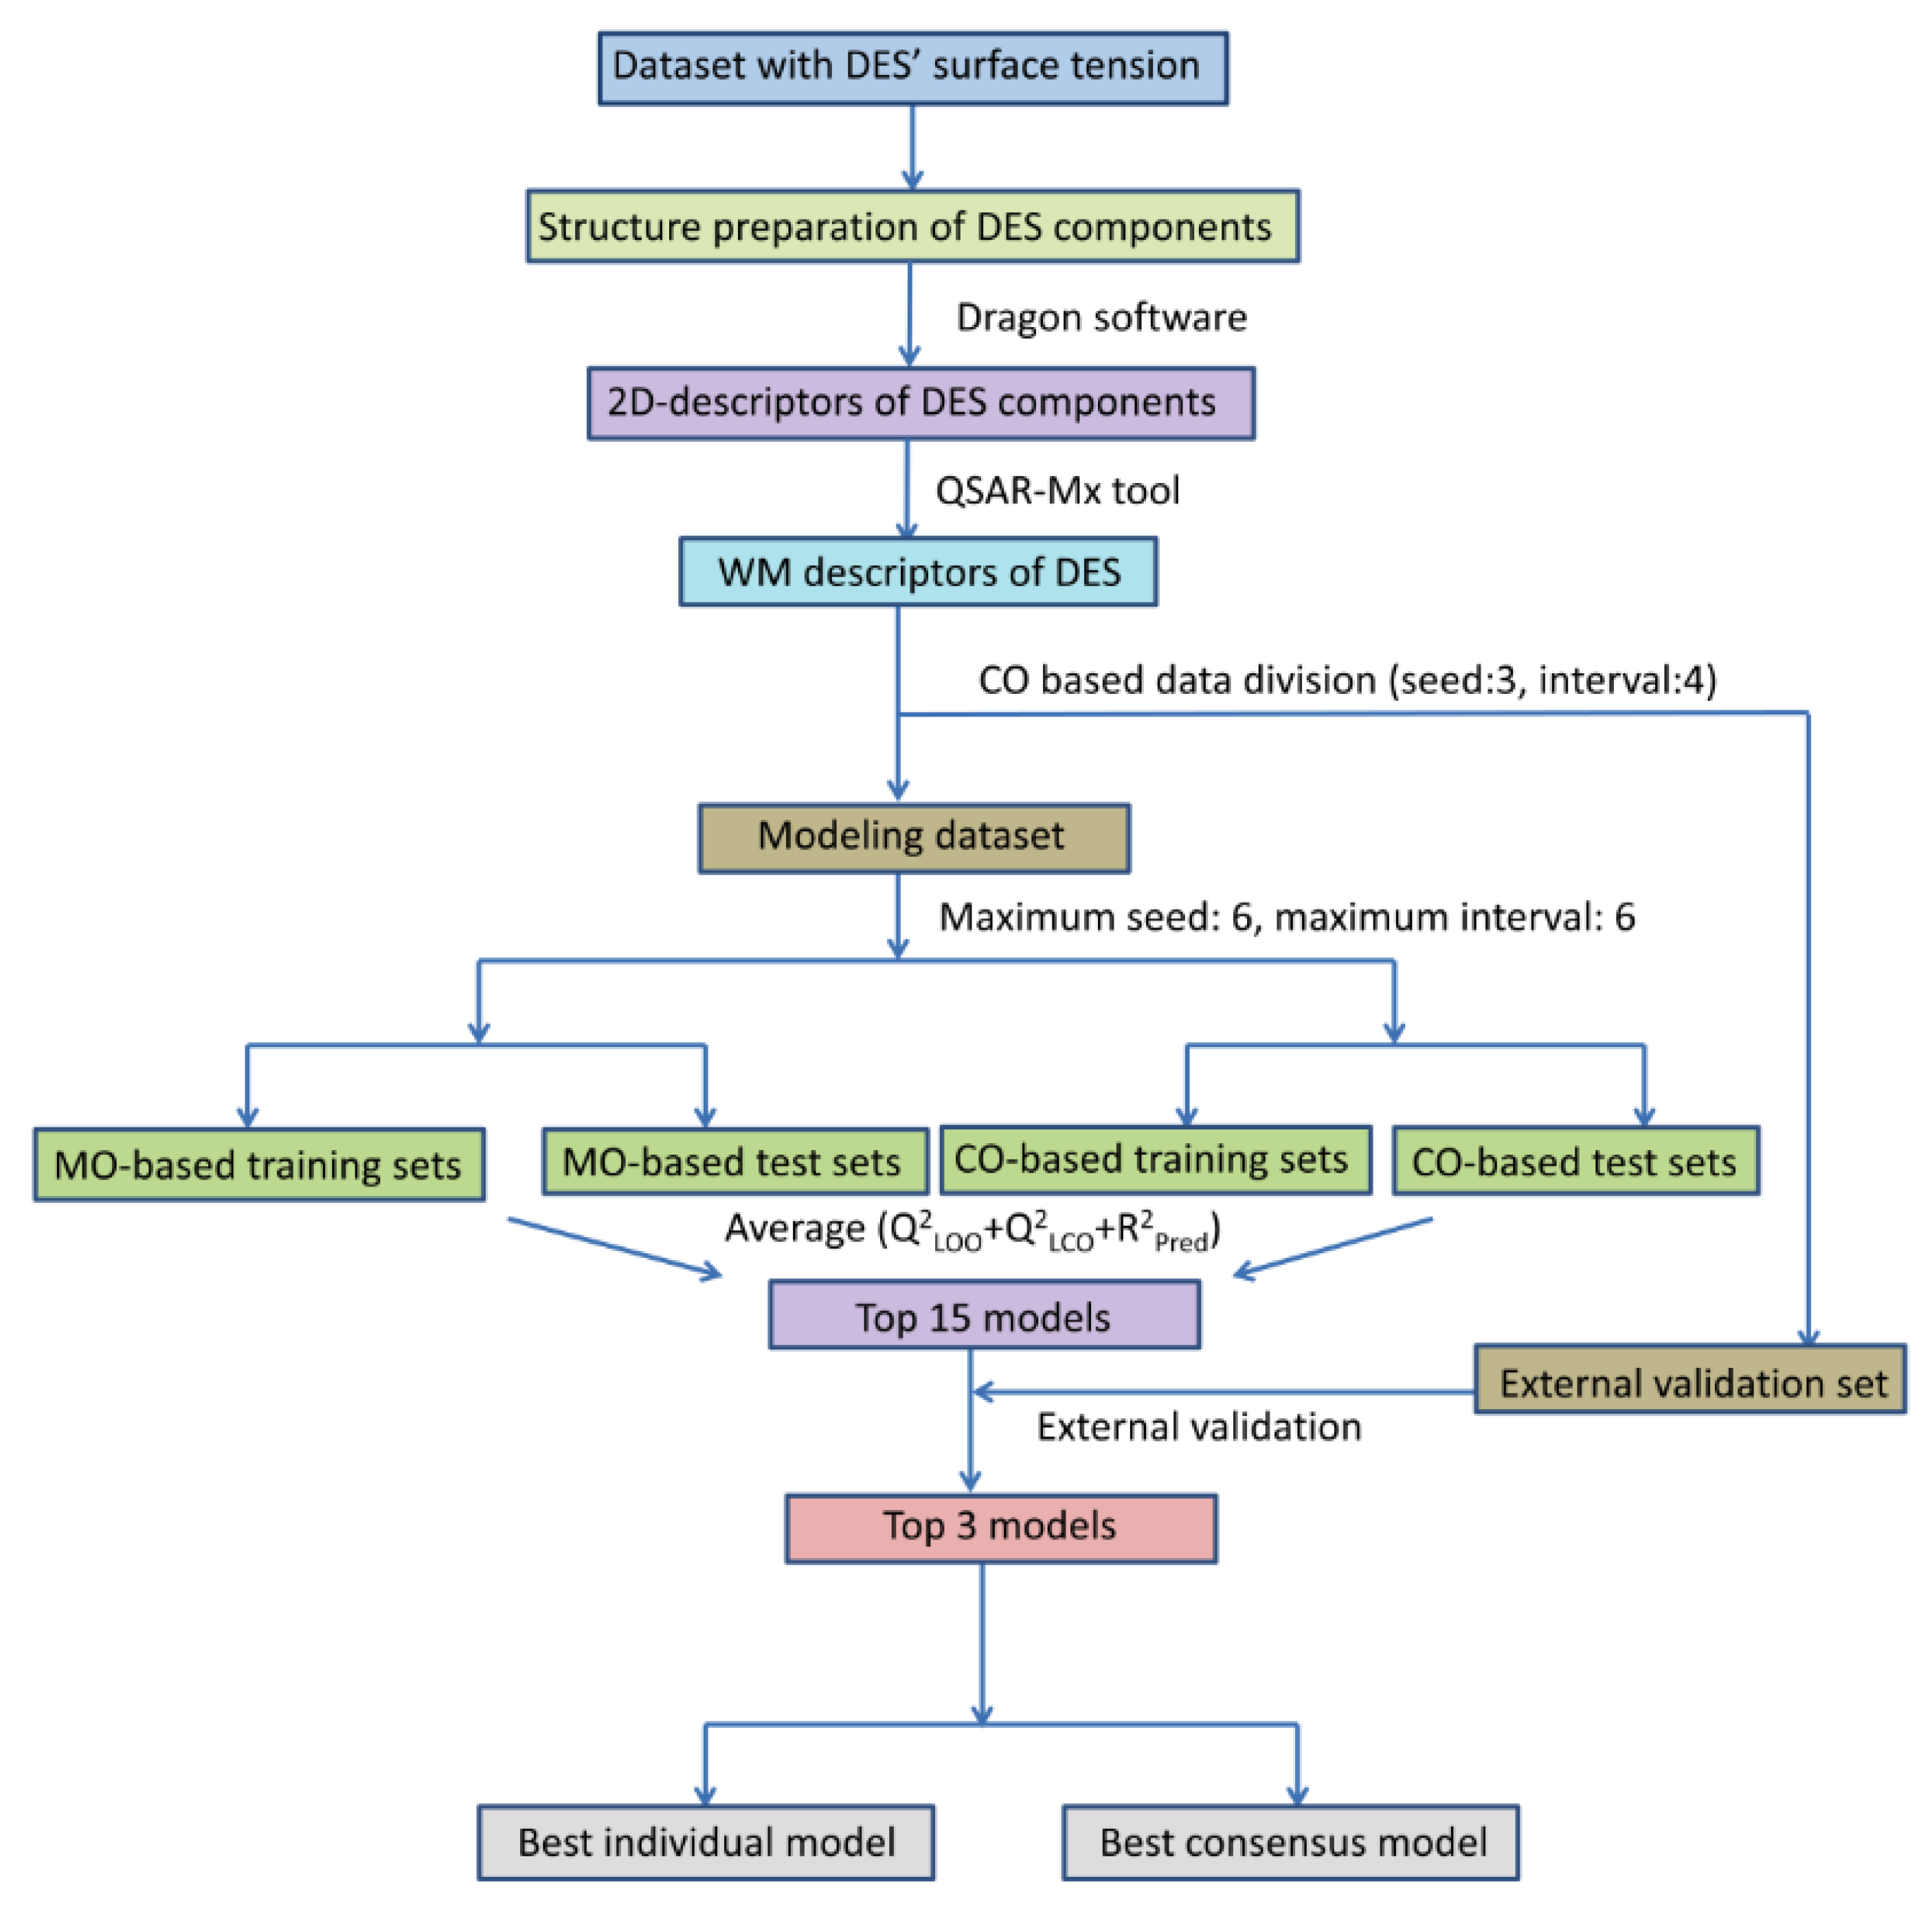
2.1. Dataset Collection and Splitting
2.2. Mixture Descriptors
2.3. Modeling Techniques and Evaluation
- (a)
- determination coefficient (R2), no cross-validation;
- (b)
- negative mean absolute error (NMAE), no cross-validation;
- (c)
- negative mean Poisson deviance (NMPD), no cross-validation;
- (d)
- determination coefficient (R2), five-fold cross-validation (CV) or ten-fold CV.
2.4. Consensus Modeling
3. Results
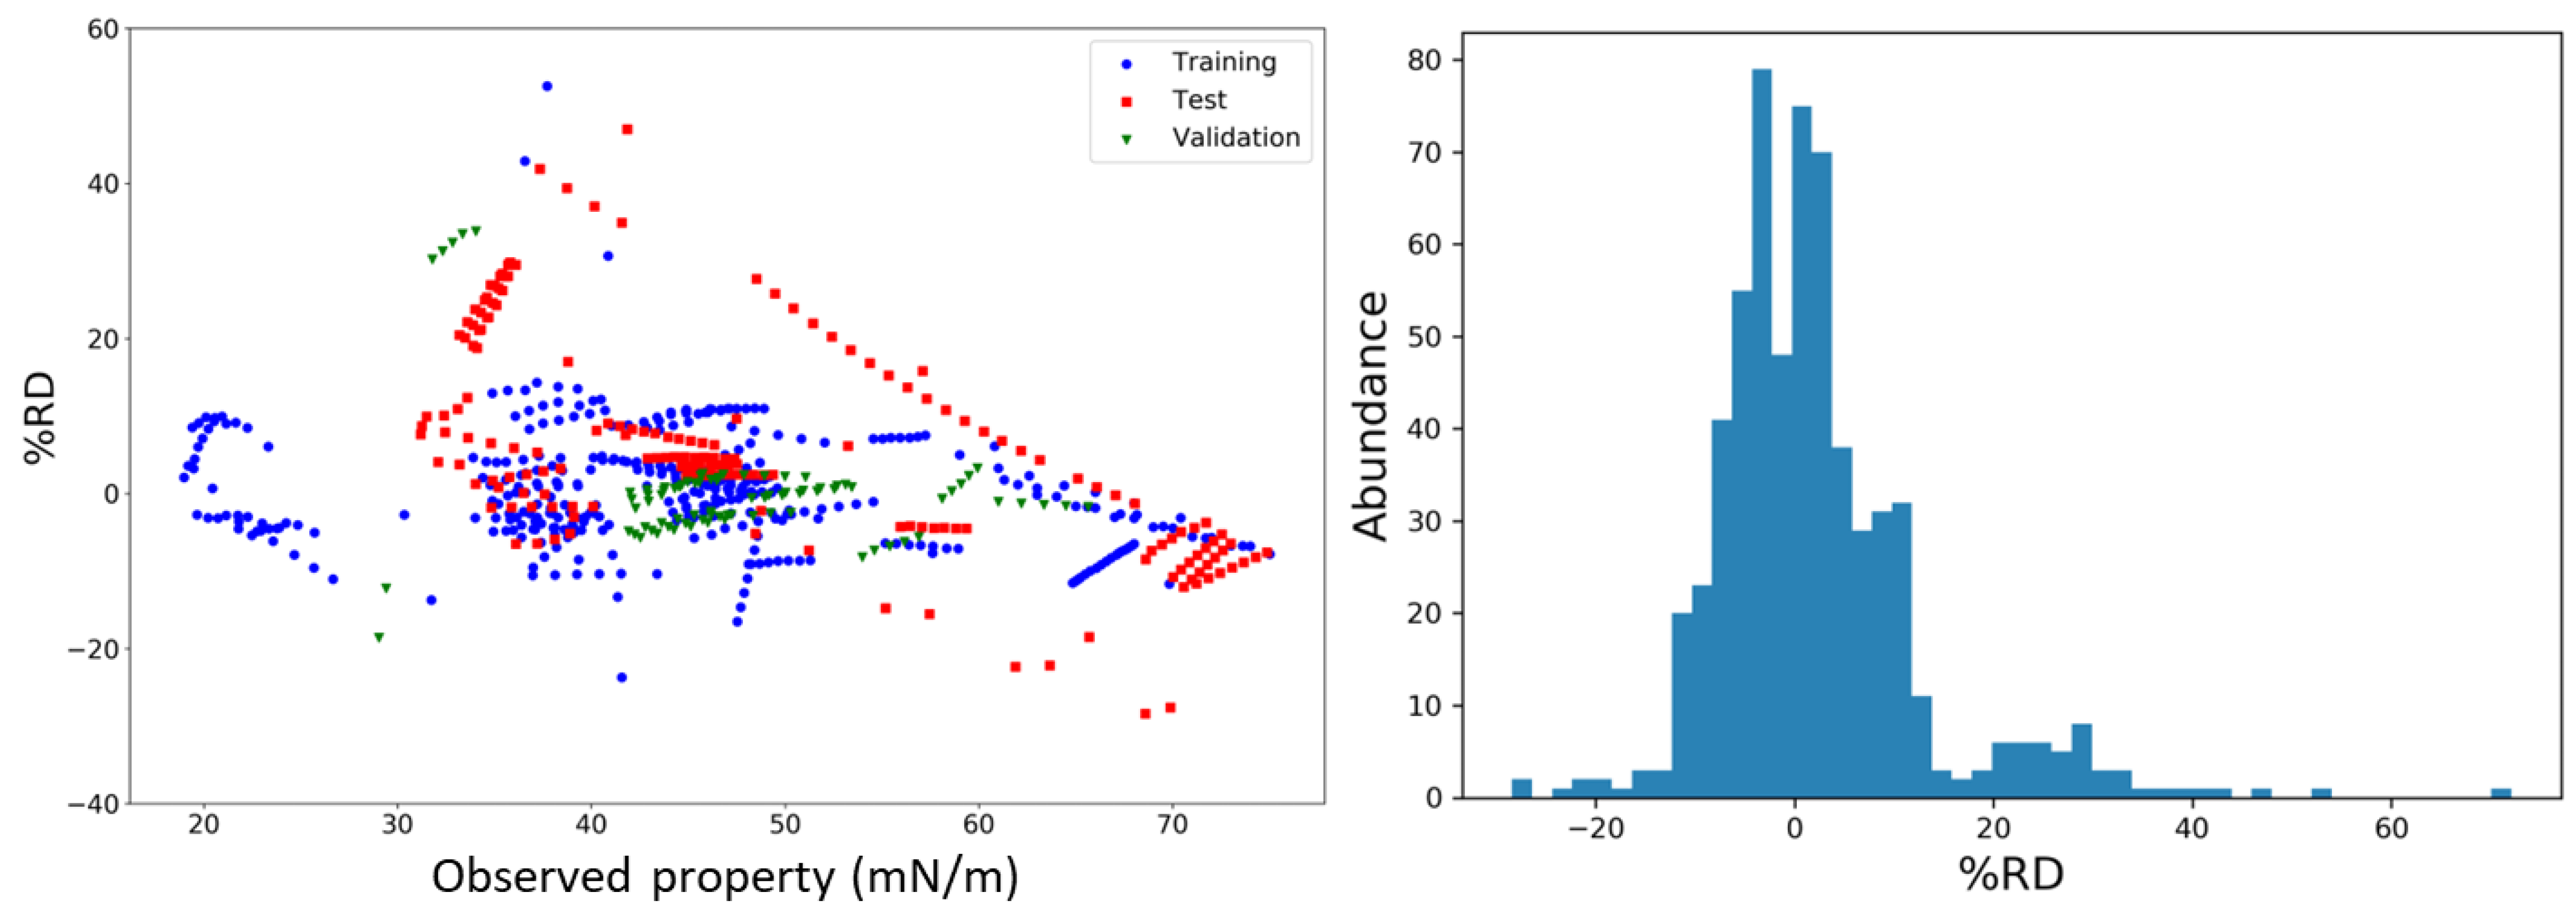
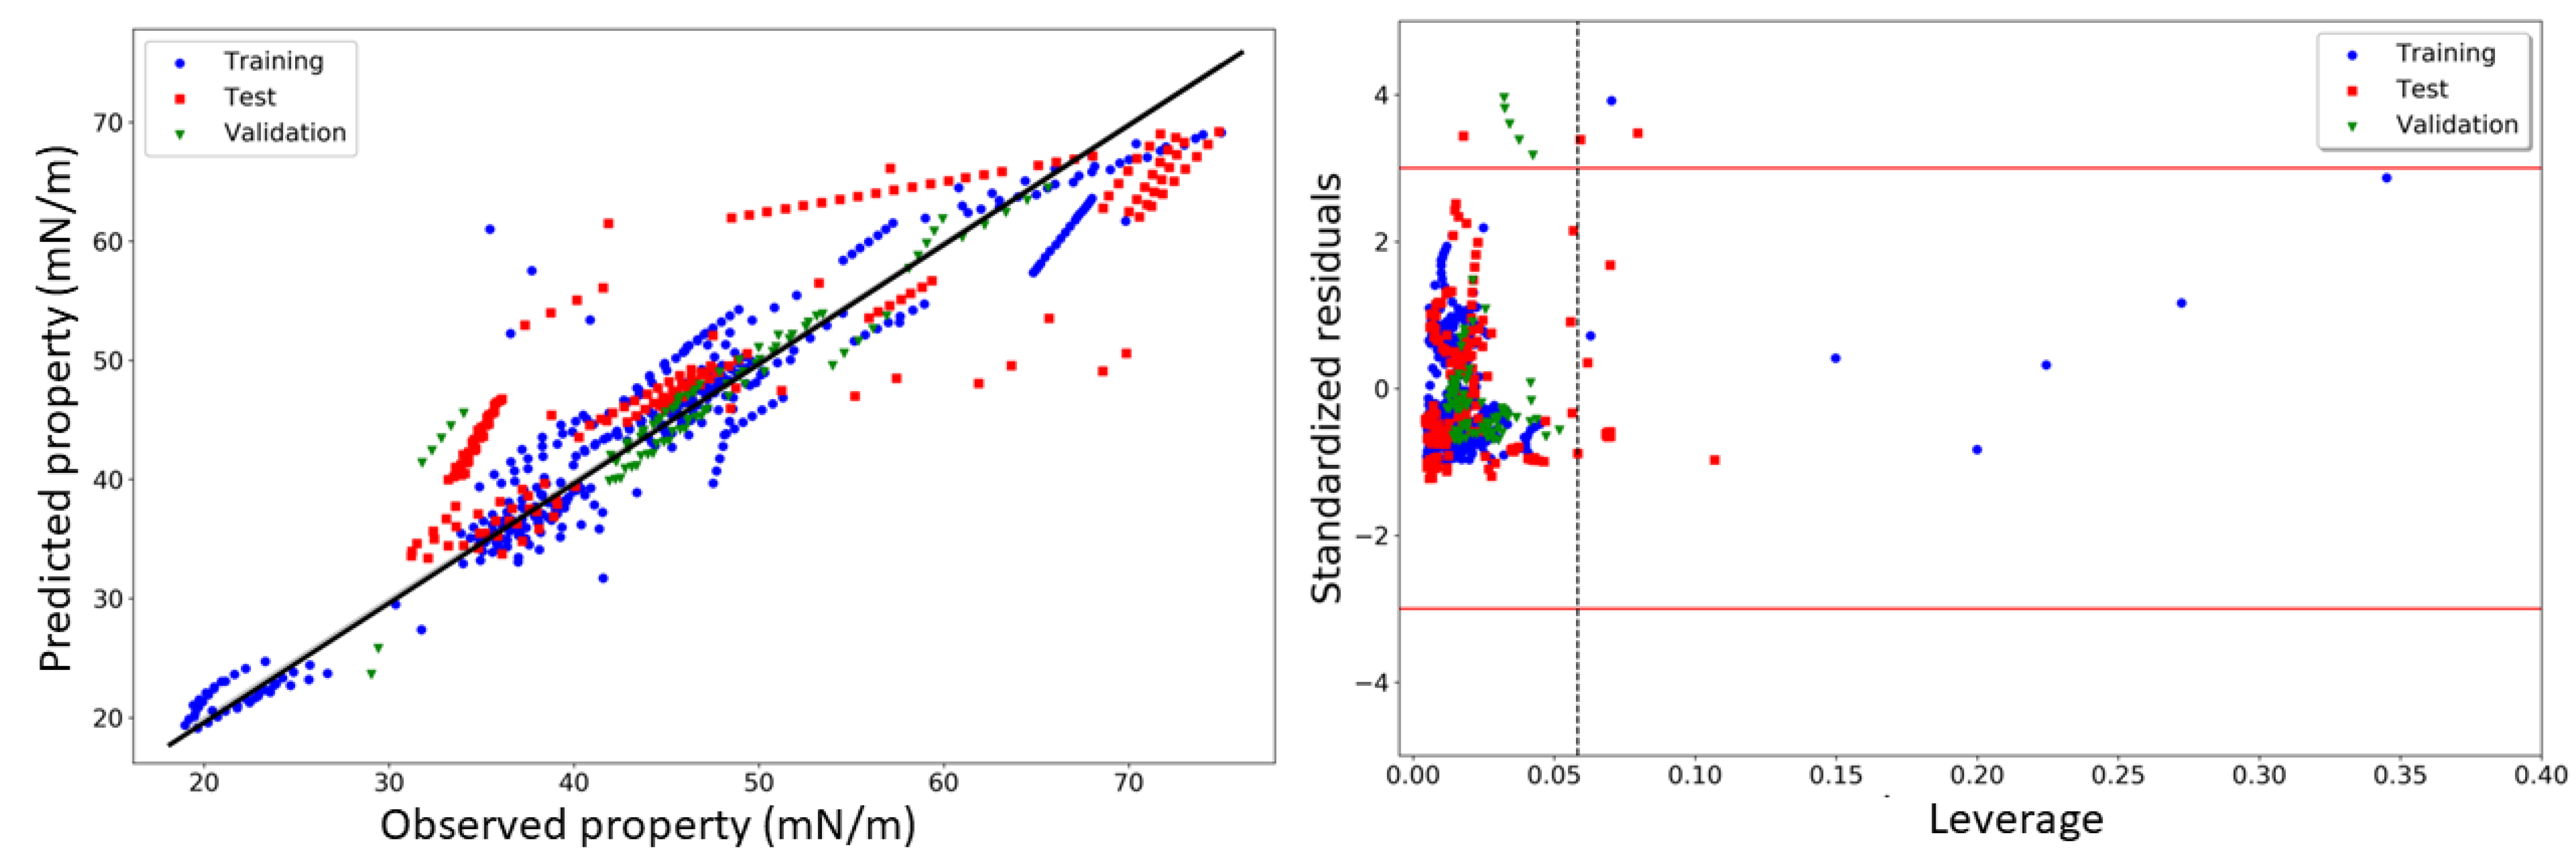
3.1. Model Calibration and Evaluation
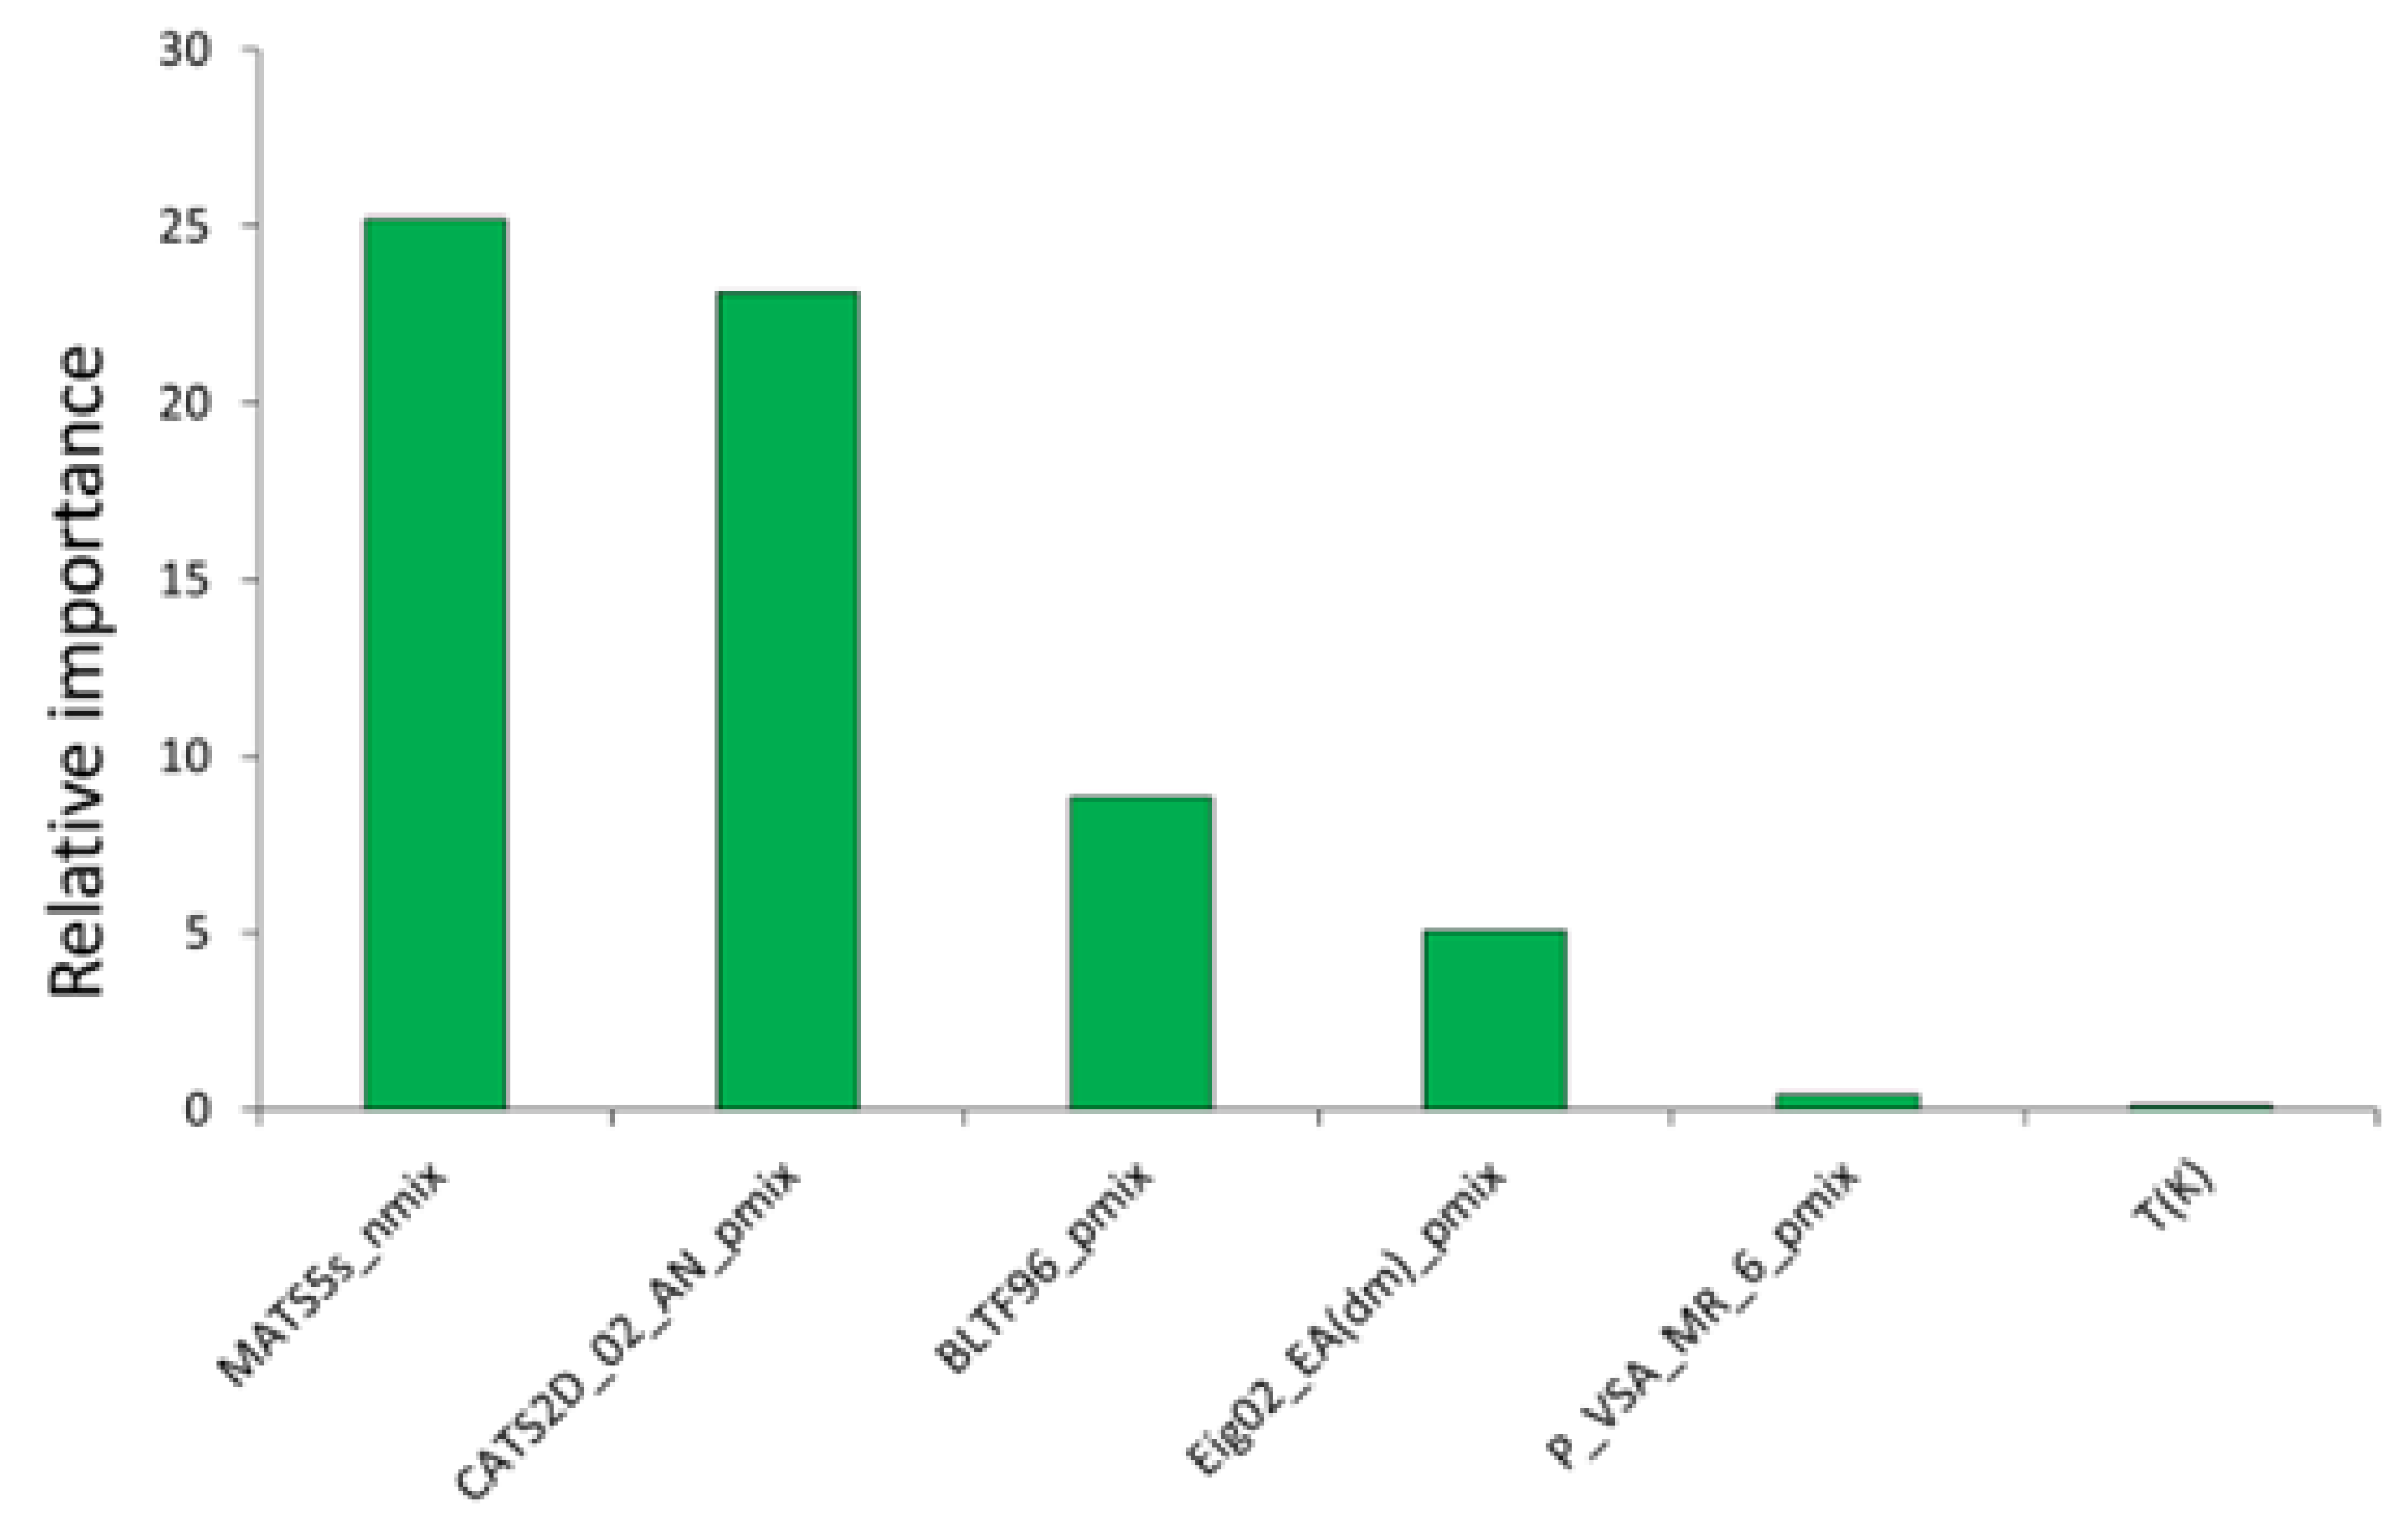
3.2. Model Interpretation
3.3. Non-Linear Models
3.4. Consensus Modeling
4. Conclusions
Supplementary Materials
Author Contributions
Funding
Institutional Review Board Statement
Informed Consent Statement
Data Availability Statement
Acknowledgments
Conflicts of Interest
Sample Availability
References
- Clarke, C.J.; Tu, W.C.; Levers, O.; Brohl, A.; Hallett, J.P. Green and Sustainable Solvents in Chemical Processes. Chem. Rev. 2018, 118, 747–800. [Google Scholar] [CrossRef]
- Sheldon, R.A. Green Solvents for Sustainable Organic Synthesis: State of the Art. Green Chem. 2005, 7, 267–278. [Google Scholar] [CrossRef]
- Sheldon, R.A. Fundamentals of Green Chemistry: Efficiency in Reaction Design. Chem. Soc. Rev. 2012, 41, 1437–1451. [Google Scholar] [CrossRef] [PubMed] [Green Version]
- García, G.; Aparicio, S.; Ullah, R.; Atilhan, M. Deep Eutectic Solvents: Physicochemical Properties and Gas Separation Applications. Energy Fuels 2015, 29, 2616–2644. [Google Scholar] [CrossRef]
- Hansen, B.B.; Spittle, S.; Chen, B.; Poe, D.; Zhang, Y.; Klein, J.M.; Horton, A.; Adhikari, L.; Zelovich, T.; Doherty, B.W.; et al. Deep Eutectic Solvents: A Review of Fundamentals and Applications. Chem. Rev. 2021, 121, 1232–1285. [Google Scholar] [CrossRef] [PubMed]
- El Achkar, T.; Greige-Gerges, H.; Fourmentin, S. Basics and Properties of Deep Eutectic Solvents: A Review. Environ. Chem. Lett. 2021, 19, 3397–3408. [Google Scholar] [CrossRef]
- Abbott, A.P.; Capper, G.; Davies, D.L.; Rasheed, R.K.; Tambyrajah, V. Novel Solvent Properties of Choline Chloride/Urea Mixtures. Chem. Commun. 2003, 70–71. [Google Scholar] [CrossRef] [Green Version]
- Zhang, Q.; De Oliveira Vigier, K.; Royer, S.; Jérôme, F. Deep Eutectic Solvents: Syntheses, Properties and Applications. Chem. Soc. Rev. 2012, 41, 7108–7146. [Google Scholar] [CrossRef]
- Halder, A.K.; Cordeiro, M.N.D.S. Probing the Environmental Toxicity of Deep Eutectic Solvents and Their Components: An In Silico Modeling Approach. ACS Sustain. Chem. Eng. 2019, 7, 10649–10660. [Google Scholar] [CrossRef]
- Palmelund, H.; Andersson, M.P.; Asgreen, C.J.; Boyd, B.J.; Rantanen, J.; Löbmann, K. Tailor-Made Solvents for Pharmaceutical Use? Experimental and Computational Approach for Determining Solubility in Deep Eutectic Solvents (DES). Int. J. Pharm. X 2019, 1, 100034. [Google Scholar] [CrossRef]
- Nam, M.W.; Zhao, J.; Lee, M.S.; Jeong, J.H.; Lee, J. Enhanced Extraction of Bioactive Natural Products Using Tailor-Made Deep Eutectic Solvents: Application to Flavonoid Extraction from Flos Sophorae. Green Chem. 2015, 17, 1718–1727. [Google Scholar] [CrossRef]
- Chen, Y.; Chen, W.; Fu, L.; Yang, Y.; Wang, Y.; Hu, X.; Wang, F.; Mu, T. Surface Tension of 50 Deep Eutectic Solvents: Effect of Hydrogen-Bonding Donors, Hydrogen-Bonding Acceptors, Other Solvents, and Temperature. Ind. Eng. Chem. Res. 2019, 58, 12741–12750. [Google Scholar] [CrossRef]
- Ghaedi, H.; Ayoub, M.; Sufian, S.; Shariff, A.M.; Lal, B. The Study on Temperature Dependence of Viscosity and Surface Tension of Several Phosphonium-Based Deep Eutectic Solvents. J. Mol. Liq. 2017, 241, 500–510. [Google Scholar] [CrossRef]
- Haghbakhsh, R.; Taherzadeh, M.; Duarte, A.R.C.; Raeissi, S. A General Model for the Surface Tensions of Deep Eutectic Solvents. J. Mol. Liq. 2020, 307, 112972. [Google Scholar] [CrossRef]
- Le, T.; Epa, V.C.; Burden, F.R.; Winkler, D.A. Quantitative Structure-Property Relationship Modeling of Diverse Materials Properties. Chem. Rev. 2012, 112, 2889–2919. [Google Scholar] [CrossRef]
- Mikolajczyk, A.; Gajewicz, A.; Rasulev, B.; Schaeublin, N.; Maurer-Gardner, E.; Hussain, S.; Leszczynski, J.; Puzyn, T. Zeta Potential for Metal Oxide Nanoparticles: A Predictive Model Developed by a Nano-Quantitative Structure-Property Relationship Approach. Chem. Mater. 2015, 27, 2400–2407. [Google Scholar] [CrossRef]
- Kim, M.; Li, L.Y.; Grace, J.R. Predictability of Physicochemical Properties of Polychlorinated Dibenzo-p-Dioxins (PCDDs) Based on Single-Molecular Descriptor Models. Environ. Pollut. 2016, 213, 99–111. [Google Scholar] [CrossRef] [PubMed]
- Moura, A.S.; Halder, A.K.; Cordeiro, M.N.D.S. From Biomedicinal to In Silico Models and Back to Therapeutics: A Review on the Advancement of Peptidic Modeling. Future Med. Chem. 2019, 11, 2313–2331. [Google Scholar] [CrossRef] [PubMed]
- Sepehri, B. A Review on Created QSPR Models for Predicting Ionic Liquids Properties and Their Reliability from Chemometric Point of View. J. Mol. Liq. 2020, 297, 112013. [Google Scholar] [CrossRef]
- Muratov, E.N.; Bajorath, J.; Sheridan, R.P.; Tetko, I.V.; Filimonov, D.; Poroikov, V.; Oprea, T.I.; Baskin, I.I.; Varnek, A.; Roitberg, A.; et al. QSAR Without Borders. Chem. Soc. Rev. 2020, 49, 3525–3564. [Google Scholar] [CrossRef]
- Awfa, D.; Ateia, M.; Mendoza, D.; Yoshimura, C. Application of Quantitative Structure–Property Relationship Predictive Models to Water Treatment: A Critical Review. ACS EST Water 2021, 1, 498–517. [Google Scholar] [CrossRef]
- Wang, J.; Song, Z.; Chen, L.; Xu, T.; Deng, L.; Qi, Z. Prediction of CO2 Solubility in Deep Eutectic Solvents using Random Forest Model Based on COSMO-RS-Derived Descriptors. Green Chem. Eng. 2021, 2, 431–440. [Google Scholar] [CrossRef]
- Balali, M.; Sobati, M.A.; Gorji, A.E. QSPR Modeling of Thiophene Distribution Between Deep Eutectic Solvent (DES) and Hydrocarbon Phases: Effect of Hydrogen Bond Donor (HBD) Structure. J. Mol. Liq. 2021, 342, 117496. [Google Scholar] [CrossRef]
- Khajeh, A.; Shakourian-Fard, M.; Parvaneh, K. Quantitative Structure-Property Relationship for Melting and Freezing Points of Deep Eutectic Solvents. J. Mol. Liq. 2021, 321, 114744. [Google Scholar] [CrossRef]
- Benguerba, Y.; Alnashef, I.M.; Erto, A.; Balsamo, M.; Ernst, B. A Quantitative Prediction of the Viscosity of Amine Based DESs Using Ss-profile Molecular Descriptors. J. Mol. Struct. 2019, 1184, 357–363. [Google Scholar] [CrossRef]
- Lemaoui, T.; Hammoudi, N.E.H.; Alnashef, I.M.; Balsamo, M.; Erto, A.; Ernst, B.; Benguerba, Y. Quantitative Structure Properties Relationship for Deep Eutectic Solvents Using Sσ-profile as Molecular Descriptors. J. Mol. Liq. 2020, 309, 113165. [Google Scholar] [CrossRef]
- Lemaoui, T.; Darwish, A.S.; Attoui, A.; Hatab, F.A.; Hammoudi, N.E.H.; Benguerba, Y.; Vega, L.F.; Alnashef, I.M. Predicting the Density and Viscosity of Hydrophobic Eutectic Solvents: Towards the Development of Sustainable Solvents. Green Chem. 2020, 22, 8511–8530. [Google Scholar] [CrossRef]
- Halder, A.K.; Haghbakhsh, R.; Voroshylova, I.V.; Duarte, A.R.C.; Cordeiro, M.N.D.S. Density of Deep Eutectic Solvents: The Path Forward Cheminformatics-Driven Reliable Predictions for Mixtures. Molecules 2021, 26, 5779. [Google Scholar] [CrossRef]
- Haghbakhsh, R.; Bardool, R.; Bakhtyari, A.; Duarte, A.R.C.; Raeissi, S. Simple and Global Correlation for the Densities of Deep Eutectic Solvents. J. Mol. Liq. 2019, 296, 111830. [Google Scholar] [CrossRef]
- Organization for Economic Co-Operation and Development (OECD). Guidance Document on the Validation of (Quantitative) Structure-Activity Relationship ((Q)SAR) Models; OECD Series on Testing and Assessment 69; OECD Document ENV/JM/MONO2007; OECD Publishing: Paris, France, 2014; pp. 55–65. [Google Scholar]
- Toropov, A.A.; Toropova, A.P. QSPR/QSAR: State-of-Art, Weirdness, the Future. Molecules 2020, 25, 1292. [Google Scholar] [CrossRef] [Green Version]
- Omar, K.A.; Sadeghi, R. Novel Deep Eutectic Solvents Based on Pyrogallol: Synthesis and Characterizations. J. Chem. Eng. Data 2021, 66, 2088–2095. [Google Scholar] [CrossRef]
- Nunes, R.J.; Saramago, B.; Marrucho, I.M. Surface Tension of dl-Menthol:Octanoic Acid Eutectic Mixtures. J. Chem. Eng. Data 2019, 64, 4915–4923. [Google Scholar] [CrossRef]
- Lapeña, D.; Bergua, F.; Lomba, L.; Giner, B.; Lafuente, C. A Comprehensive Study of the Thermophysical Properties of Reline and Hydrated Reline. J. Mol. Liq. 2020, 303, 112679. [Google Scholar] [CrossRef]
- Abdallah, M.M.; Müller, S.; González de Castilla, A.; Gurikov, P.; Matias, A.A.; Bronze, M.d.R.; Fernández, N. Physicochemical Characterization and Simulation of the Solid–Liquid Equilibrium Phase Diagram of Terpene-Based Eutectic Solvent Systems. Molecules 2021, 26, 1801. [Google Scholar] [CrossRef] [PubMed]
- Muratov, E.N.; Varlamova, E.V.; Artemenko, A.G.; Polishchuk, P.G.; Kuz’min, V.E. Existing and Developing Approaches for QSAR Analysis of Mixtures. Mol. Inform. 2012, 31, 202–221. [Google Scholar] [CrossRef] [PubMed]
- Oprisiu, I.; Novotarskyi, S.; Tetko, I.V. Modeling of Non-Additive Mixture Properties Using the Online CHEmical Database and Modeling Environment (OCHEM). J. Cheminformatics 2013, 5, 4. [Google Scholar] [CrossRef] [Green Version]
- Halder, A.K.; Cordeiro, M.N.D.S. Development of Predictive Linear and Non-linear QSTR Models for Aliivibrio Fischeri Toxicity of Deep Eutectic Solvents. IJQSPR 2019, 4, 50–69. [Google Scholar] [CrossRef]
- ChemAxon. Standardizer; Version 15.9.14.0 Software; ChemAxon: Budapest, Hungary, 2010. [Google Scholar]
- Mauri, A.C.V.; Pavan, M.; Todeschini, R. Dragon Software: An Easy Approach to Molecular Descriptor calculations. MATCH Commun. Math. Comput. Chem. 2006, 56, 237–248. [Google Scholar]
- Hechinger, M.; Leonhard, K.; Marquardt, W. What is Wrong with Quantitative Structure–Property Relations Models Based on Three-Dimensional Descriptors? J. Chem. Inf. Model. 2012, 52, 1984–1993. [Google Scholar] [CrossRef]
- Raschka, S. MLxtend: Providing Machine Learning and Data Science Utilities and Extensions to Python’s Scientific Computing Stack. J. Open Source Softw. 2018, 3, 638. [Google Scholar] [CrossRef]
- Cover, T.; Hart, P. Nearest Neighbor Pattern Classification. IEEE Trans. Inform. Theory 1967, 13, 21–27. [Google Scholar] [CrossRef] [Green Version]
- Breiman, L. Random Forests. Mach. Learn. 2001, 45, 5–32. [Google Scholar] [CrossRef] [Green Version]
- Boser, B.E.; Guyon, I.M.; Vapnik, V.N. A Training Algorithm for Optimal Margin Classifiers. In Proceedings of the Fifth Annual Workshop on Computational Learning Theory ACM, Pittsburgh, PA, USA, 27–29 July 1992; pp. 144–152. [Google Scholar]
- Guang-Bin, H.; Babri, H.A. Upper Bounds on the Number of Hidden Neurons in Feedforward Networks with Arbitrary Bounded Nonlinear Activation Functions. IEEE Trans. Neural Netw. 1998, 9, 224–229. [Google Scholar] [CrossRef] [PubMed] [Green Version]
- Friedman, J.H. Greedy function approximation: A gradient boosting machine. Ann. Stat. 2001, 29, 1189–1232. [Google Scholar] [CrossRef]
- Golbraikh, A.; Tropsha, A. Beware of Q2! J. Mol. Graph. Model. 2002, 20, 269–276. [Google Scholar] [CrossRef]
- Gramatica, P. On the Development and Validation of QSAR Models. Methods Mol. Biol. 2013, 930, 499–526. [Google Scholar] [PubMed]
- Roy, P.P.; Paul, S.; Mitra, I.; Roy, K. On Two Novel Parameters for Validation of Predictive QSAR Models. Molecules 2009, 14, 1660–1701. [Google Scholar]
- Ojha, P.K.; Roy, K. Comparative QSARs for Antimalarial Endochins: Importance of Descriptor-Thinning and Noise Reduction Prior to Feature Selection. Chemom. Intell. Lab. Syst. 2011, 109, 146–161. [Google Scholar] [CrossRef]
- Gramatica, P. Principles of QSAR Models Validation: Internal and External. QSAR Comb. Sci. 2007, 26, 694–701. [Google Scholar] [CrossRef]
- Hunter, J.D. Matplotlib: A 2D Graphics Environment. Comput. Sci. Eng. 2007, 9, 90–95. [Google Scholar] [CrossRef]
- Roy, K.; Ambure, P.; Kar, S.; Ojha, P.K. Is It Possible to Improve the Quality of Predictions from an “Intelligent” Use of Multiple QSAR/QSPR/QSTR Models? J. Chemom. 2018, 32, e2992. [Google Scholar] [CrossRef]
- Todeschini, R.; Consonni, V. Handbook of Molecular Descriptors; Wiley-VCH: Weinheim, Germany, 2000. [Google Scholar]
- Todeschini, R.; Consonni, V. Molecular Descriptors for Chemoinformatics, 2nd ed.; Wiley-VCH: Weinheim, Germany, 2009. [Google Scholar]
- Labute, P. A Widely Applicable Set of Descriptors. J. Mol. Graph. Model. 2000, 18, 464–477. [Google Scholar] [CrossRef]
- Reutlinger, M.; Koch, C.P.; Reker, D.; Todoroff, N.; Schneider, P.; Rodrigues, T.; Schneider, G. Chemically Advanced Template Search (CATS) for Scaffold-Hopping and Prospective Target Prediction for ‘Orphan’ Molecules. Mol. Inform. 2013, 32, 133–138. [Google Scholar] [CrossRef] [PubMed] [Green Version]
- García-Domenech, R.; Julián-Ortiz, J.V. Antimicrobial Activity Characterization in a Heterogeneous Group of Compounds. J. Chem. Inf. Comput. Sci. 1998, 38, 445–449. [Google Scholar] [CrossRef] [PubMed]
- Khan, K.; Khan, P.M.; Lavado, G.; Valsecchi, C.; Pasqualini, J.; Baderna, D.; Marzo, M.; Lombardo, A.; Roy, K.; Benfenati, E. QSAR Modeling of Daphnia magna and Fish Toxicities of Biocides Using 2D Descriptors. Chemosphere 2019, 229, 8–17. [Google Scholar] [CrossRef] [PubMed]

| Model | Seed; Interval | Descriptor a | Split b | Scoring c | Ntrd | Q2LOOe | Q2LCOf | MAELOO g | Ntsh | R2Predi | MAEtest j | Avg k |
|---|---|---|---|---|---|---|---|---|---|---|---|---|
| M01 | 2; 5 | Method-1 | MO | NMAE | 408 | 0.884 | 0.854 | 2.586 | 127 | 0.907 | 3.863 | 0.882 |
| M02 | 4; 5 | Method-2 | MO | NMAE | 435 | 0.873 | 0.849 | 2.658 | 100 | 0.899 | 3.966 | 0.874 |
| M03 | 1; 4 | Method-2 | MO | NMAE | 408 | 0.898 | 0.854 | 2.775 | 127 | 0.865 | 2.569 | 0.872 |
| M04 | 5; 4 | Method-2 | MO | NMAE | 409 | 0.898 | 0.855 | 2.771 | 126 | 0.862 | 2.584 | 0.872 |
| M05 | 4; 5 | Method-1 | MO | NMAE | 435 | 0.871 | 0.839 | 2.635 | 100 | 0.898 | 4.039 | 0.869 |
| M06 | 3; 5 | Method-1 | MO | NMAE | 443 | 0.881 | 0.849 | 2.671 | 92 | 0.871 | 4.073 | 0.867 |
| M07 | 1; 3 | Method-1 | MO | NMAE | 359 | 0.901 | 0.862 | 2.369 | 176 | 0.836 | 4.223 | 0.866 |
| M08 | 4; 5 | Method-1 | MO | R2 | 435 | 0.883 | 0.858 | 2.854 | 100 | 0.855 | 4.695 | 0.865 |
| M09 | 4; 3 | Method-1 | MO | NMAE | 360 | 0.906 | 0.854 | 2.322 | 175 | 0.83 | 4.389 | 0.864 |
| M10 | 1; 2 | Method-2 | CO | R2 | 301 | 0.931 | 0.903 | 1.660 | 234 | 0.754 | 6.030 | 0.862 |
| M11 | 4; 5 | Method-2 | MO | 5-fold | 435 | 0.865 | 0.841 | 3.000 | 100 | 0.876 | 4.282 | 0.861 |
| M12 | 4; 3 | Method-2 | MO | R2 | 360 | 0.908 | 0.882 | 2.608 | 175 | 0.783 | 5.134 | 0.858 |
| M13 | 4; 5 | Method-1 | MO | 5-fold | 435 | 0.871 | 0.845 | 2.706 | 100 | 0.857 | 4.626 | 0.858 |
| M14 | 1; 4 | Method-1 | MO | 10-fold | 408 | 0.869 | 0.849 | 3.340 | 127 | 0.847 | 2.050 | 0.855 |
| M15 | 5; 4 | Method-1 | MO | 10-fold | 409 | 0.869 | 0.85 | 3.336 | 126 | 0.844 | 2.052 | 0.855 |
| Model b | Training Set | Test Set | External Validation Set | |||||||
|---|---|---|---|---|---|---|---|---|---|---|
| Ntr | Q2LOO | Q2LCO | %AARD | Nts | R2Pred | %AARD | Nexc | R2Pred | %AARD | |
| M01 | 408 | 0.884 | 0.854 | 5.541 | 127 | 0.907 | 11.843 | 84 | −0.335 | 15.931 |
| M02 | 435 | 0.873 | 0.849 | 6.11 | 100 | 0.899 | 7.517 | 84 | 0.464 | 12.176 |
| M03 | 408 | 0.898 | 0.854 | 6.063 | 127 | 0.865 | 5.418 | 84 | −0.196 | 15.833 |
| M04 | 409 | 0.898 | 0.855 | 6.057 | 126 | 0.862 | 5.446 | 84 | −0.19 | 15.818 |
| M05 | 435 | 0.871 | 0.839 | 5.965 | 100 | 0.898 | 7.538 | 84 | 0.392 | 11.838 |
| M06 | 443 | 0.881 | 0.849 | 6.052 | 92 | 0.871 | 7.65 | 84 | 0.516 | 11.021 |
| M07 | 359 | 0.901 | 0.862 | 5.222 | 176 | 0.836 | 9.331 | 84 | −7.225 | 27.7 |
| M08 | 435 | 0.883 | 0.858 | 6.6 | 100 | 0.855 | 8.456 | 84 | 0.466 | 11.45 |
| M09 | 360 | 0.906 | 0.854 | 5.202 | 175 | 0.83 | 9.872 | 84 | 0.688 | 8.527 |
| M10 | 301 | 0.931 | 0.903 | 4.208 | 234 | 0.754 | 12.754 | 84 | 0.734 | 7.777 |
| M11 | 435 | 0.865 | 0.841 | 6.875 | 100 | 0.876 | 7.78 | 84 | 0.568 | 10.047 |
| M12 | 360 | 0.908 | 0.882 | 5.805 | 175 | 0.783 | 11.155 | 84 | 0.862 | 4.418 |
| M13 | 435 | 0.871 | 0.845 | 6.204 | 100 | 0.857 | 8.442 | 84 | 0.544 | 11.093 |
| M14 | 408 | 0.869 | 0.849 | 7.344 | 127 | 0.847 | 3.943 | 84 | 0.352 | 11.642 |
| M15 | 409 | 0.869 | 0.85 | 7.339 | 126 | 0.844 | 3.929 | 84 | 0.353 | 11.638 |
| Symbol | Definition [55,56,57,58] | Class |
|---|---|---|
| P_VSA_MR_6pmix | P_VSA-like on Molar Refractivity, at bin size 6 | P_VSA-like descriptor a (Dpmix type) |
| Eig02_EA(dm)pmix | eigenvalue n. 2 from edge adjacency matrix, weighted by dipole moment | Edge adjacency indices (Dpmix type) |
| CATS2D_02_ANpmix | CATS2D Acceptor-Negative at lag 2 | 2D CATS b (Dpmix type) |
| BLTF96pmix | Verhaar Fish base-line toxicity from MLOGP (mmol/L) | Molecular properties (Dpmix type) |
| MATS5snmix | Moran autocorrelation of lag 5, weighted by I-state c | 2D autocorrelations (Dnmix type) |
| Training Set | Test Set | External Set |
|---|---|---|
| Ntr = 360; | Nts = 175; | Nex = 84; |
| R2 = 0.916; R2Adj = 0.915; F(6353) = 642.4; | R2Pred = 0.783; | R2Pred = 0.862; |
| Q2LOO = 0.908; MAELOO = 2.608; Q2LCO = 0.882; MAELCO = 3.122; | MAE = 5.134; | MAE = 1.777; |
| rm2(LOO) = 0.869, ∆rm2(LOO) = 0.066; | rm2(test) = 0.573, ∆rm2(test) = 0.197; | rm2(ext) = 0.767, ∆rm2(ext) = 0.097; |
| %AARD = 5.805; cRP2 (1000 runs) = 0.908 | %AARD = 11.155 | %AARD = 4.418 |
| Method a | Training Set (Q25-fold) | Test Set (R2Pred) | External Set (R2Pred) |
|---|---|---|---|
| k-NN | 0.176 | 0.597 | not determined |
| RF | 0.473 | 0.746 | not determined |
| SVM | 0.874 | 0.774 | 0.767 |
| MLP | 0.541 | 0.269 | not determined |
| GB | 0.453 | 0.471 | not determined |
| Consensus Models | Models | CM a | R2Predb | rm2(test)c | MAEtest d | %AARD e |
|---|---|---|---|---|---|---|
| C1 | M09, M10, M12 | 0 | 0.864 | 0.801 | 1.869 | 4.459 |
| C2 | M10 and M12 | 2 | 0.823 | 0.812 | 2.089 | 4.732 |
| C3 | M09 and M10 | 2 | 0.853 | 0.787 | 1.979 | 4.393 |
| C4 | M09 and M12 | None | ----- | ----- | ----- | ----- |
| M12 | ----- | ----- | 0.862 | 0.767 | 1.777 | 4.418 |
Publisher’s Note: MDPI stays neutral with regard to jurisdictional claims in published maps and institutional affiliations. |
© 2022 by the authors. Licensee MDPI, Basel, Switzerland. This article is an open access article distributed under the terms and conditions of the Creative Commons Attribution (CC BY) license (https://creativecommons.org/licenses/by/4.0/).
Share and Cite
Halder, A.K.; Haghbakhsh, R.; Voroshylova, I.V.; Duarte, A.R.C.; Cordeiro, M.N.D.S. Predicting the Surface Tension of Deep Eutectic Solvents: A Step Forward in the Use of Greener Solvents. Molecules 2022, 27, 4896. https://doi.org/10.3390/molecules27154896
Halder AK, Haghbakhsh R, Voroshylova IV, Duarte ARC, Cordeiro MNDS. Predicting the Surface Tension of Deep Eutectic Solvents: A Step Forward in the Use of Greener Solvents. Molecules. 2022; 27(15):4896. https://doi.org/10.3390/molecules27154896
Chicago/Turabian StyleHalder, Amit Kumar, Reza Haghbakhsh, Iuliia V. Voroshylova, Ana Rita C. Duarte, and Maria Natalia D. S. Cordeiro. 2022. "Predicting the Surface Tension of Deep Eutectic Solvents: A Step Forward in the Use of Greener Solvents" Molecules 27, no. 15: 4896. https://doi.org/10.3390/molecules27154896
APA StyleHalder, A. K., Haghbakhsh, R., Voroshylova, I. V., Duarte, A. R. C., & Cordeiro, M. N. D. S. (2022). Predicting the Surface Tension of Deep Eutectic Solvents: A Step Forward in the Use of Greener Solvents. Molecules, 27(15), 4896. https://doi.org/10.3390/molecules27154896