
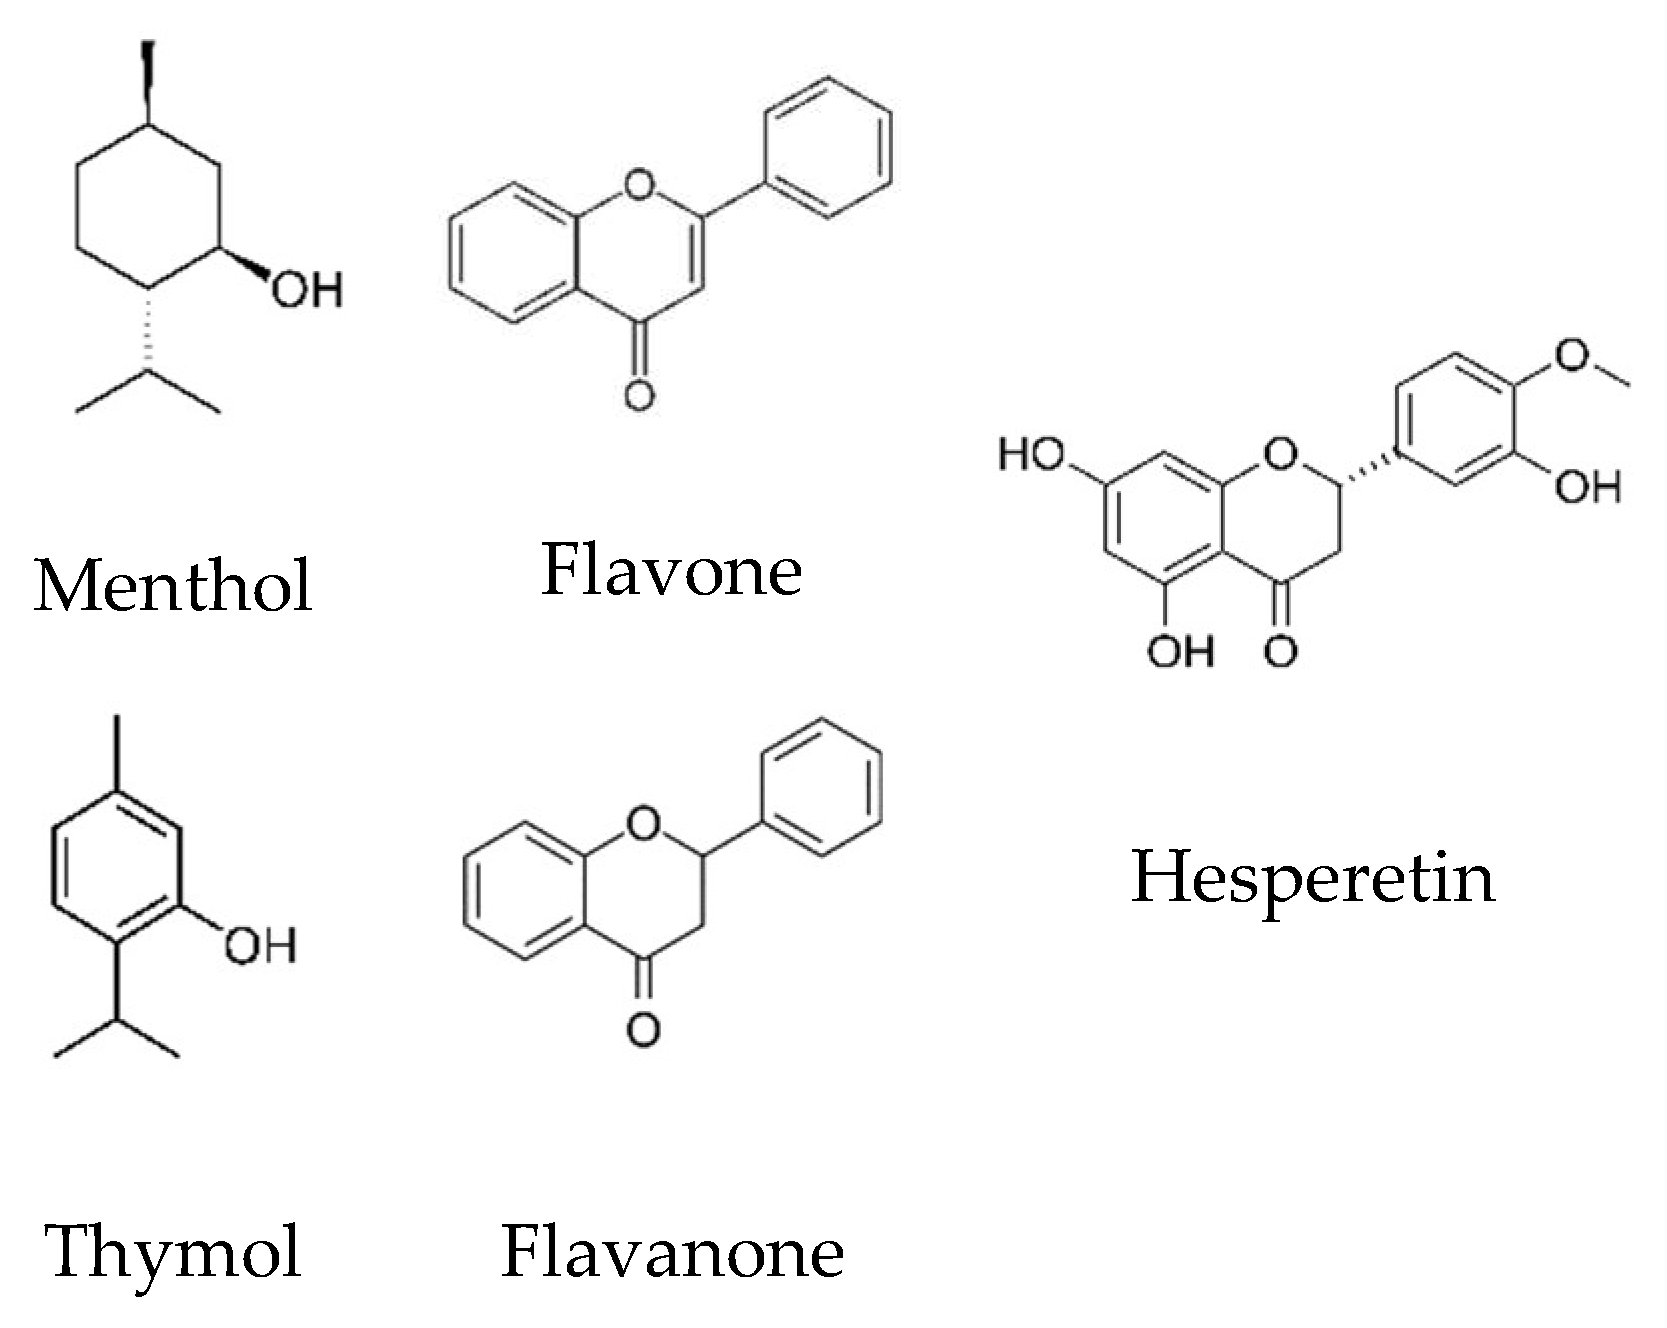
Liquefying Flavonoids with Terpenoids through Deep Eutectic Solvent Formation

 , , , , ,
  , and
, and
Abstract
:1. Introduction
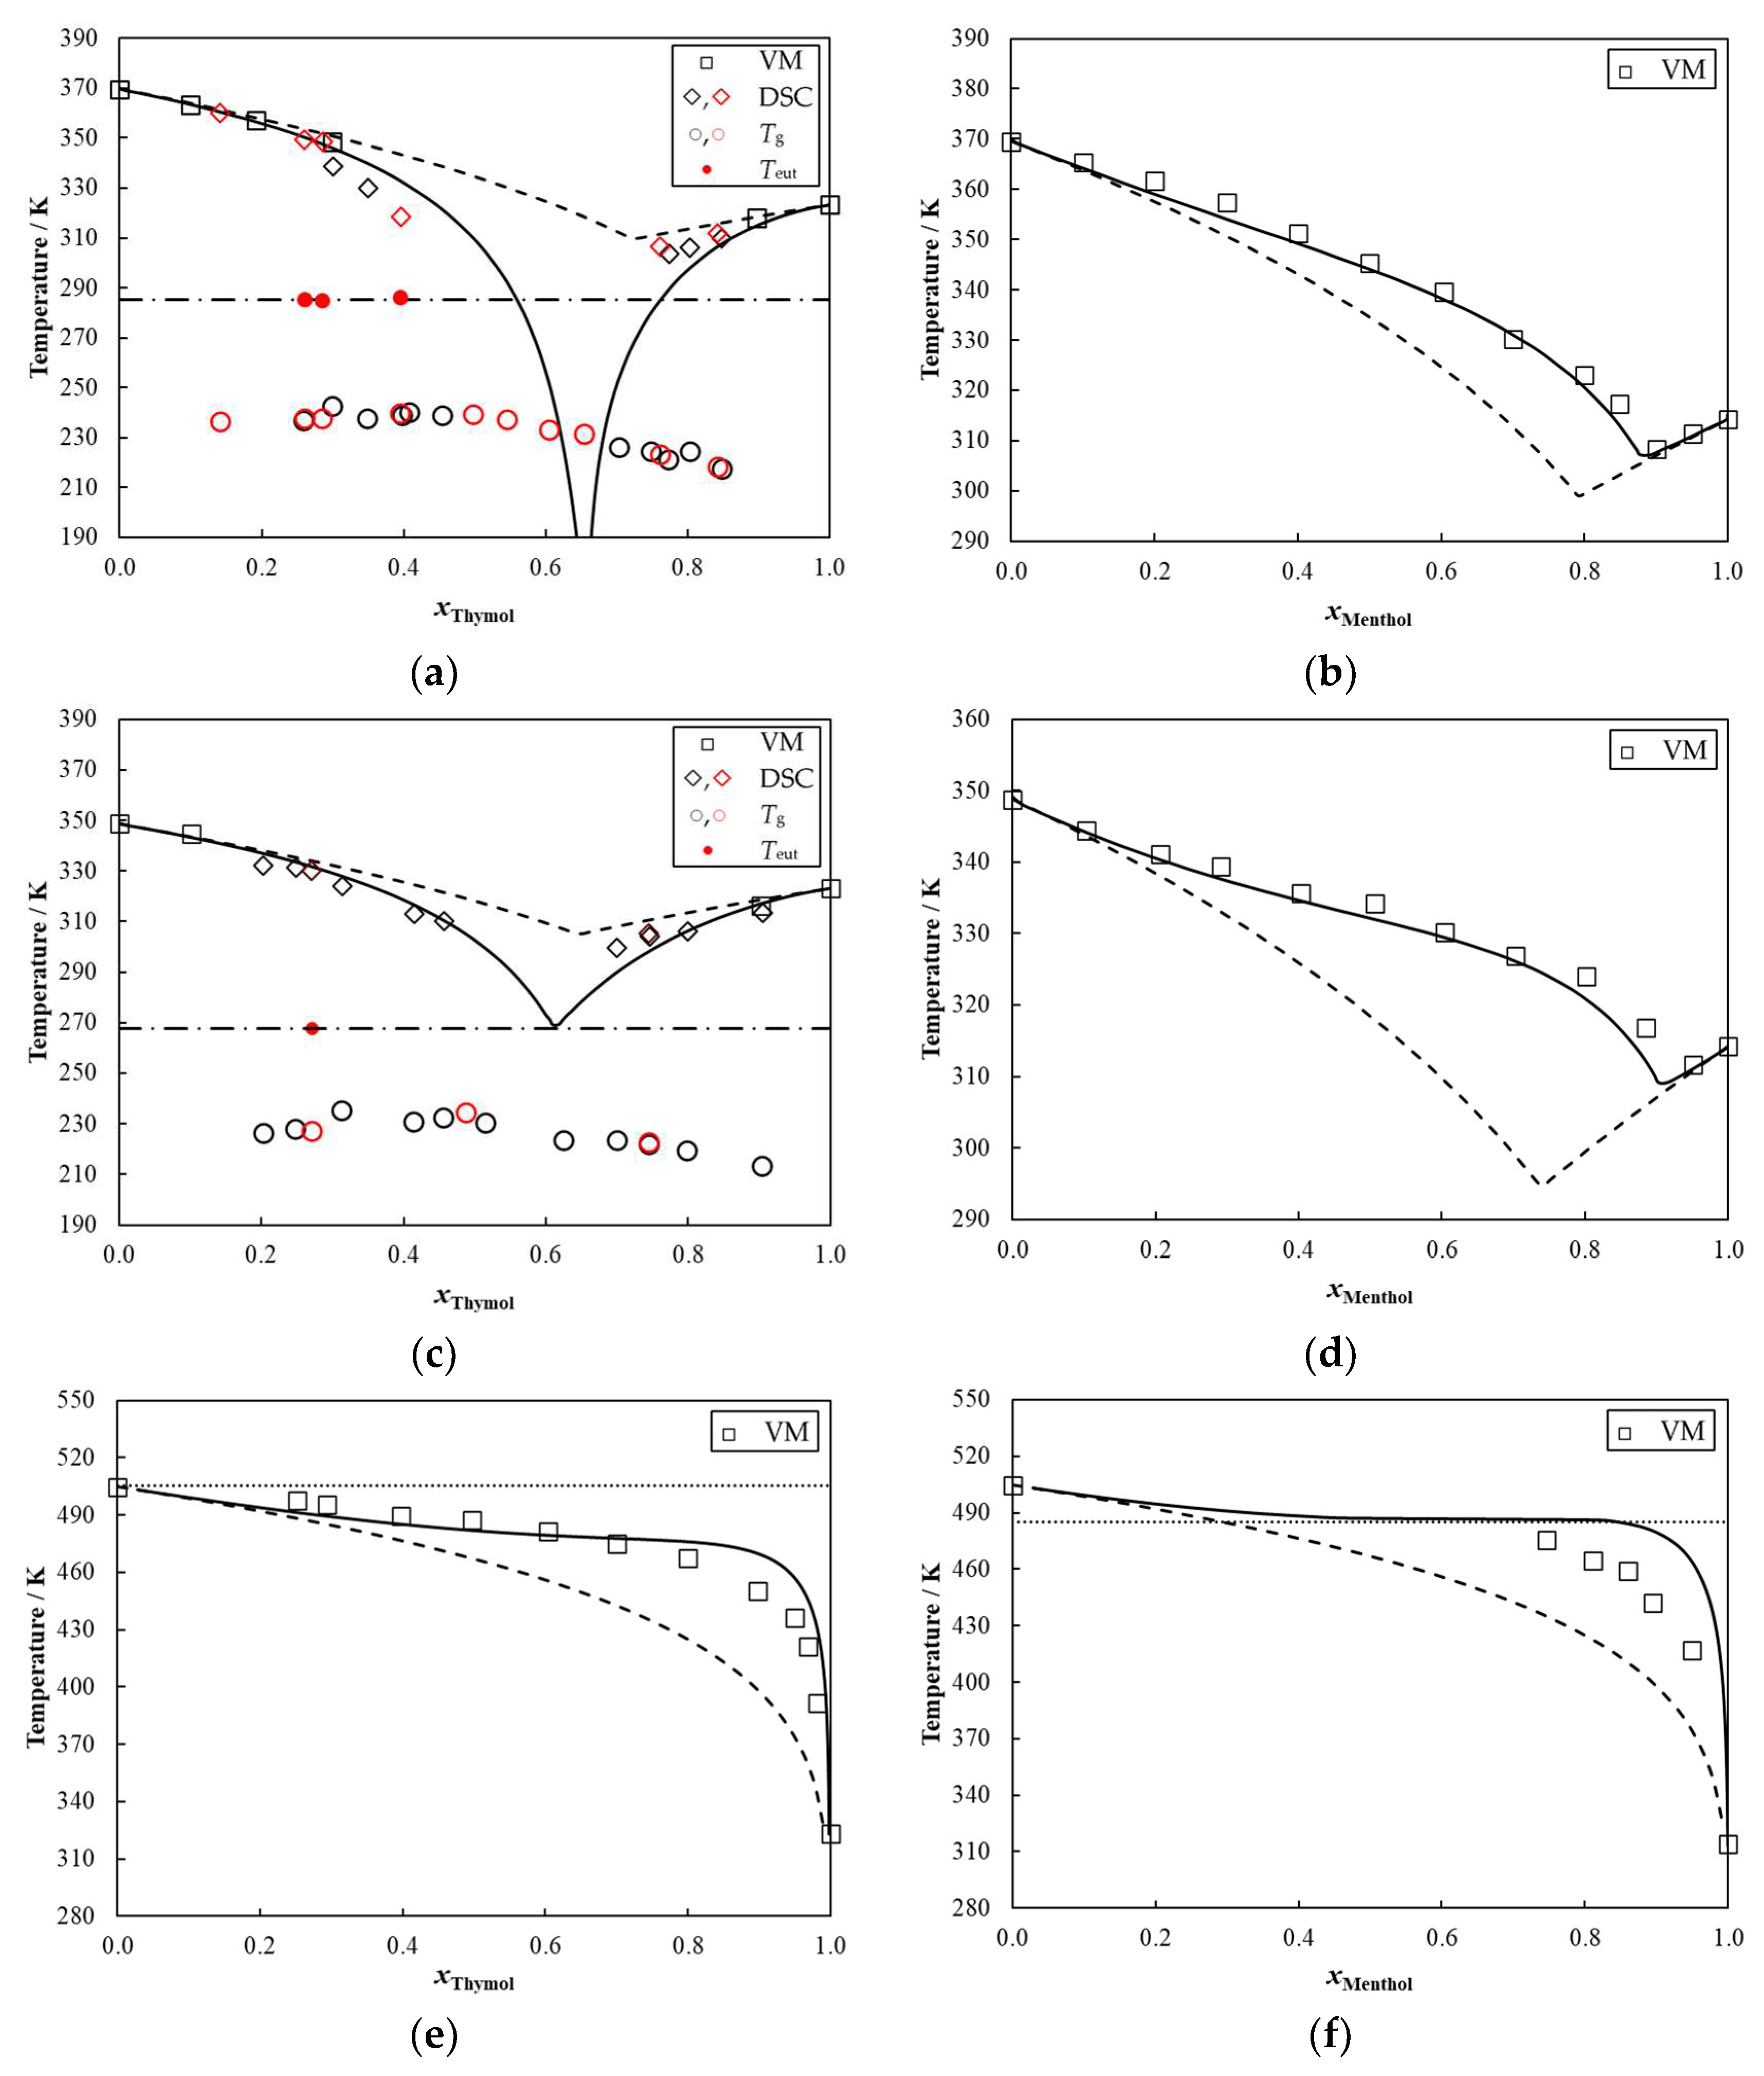
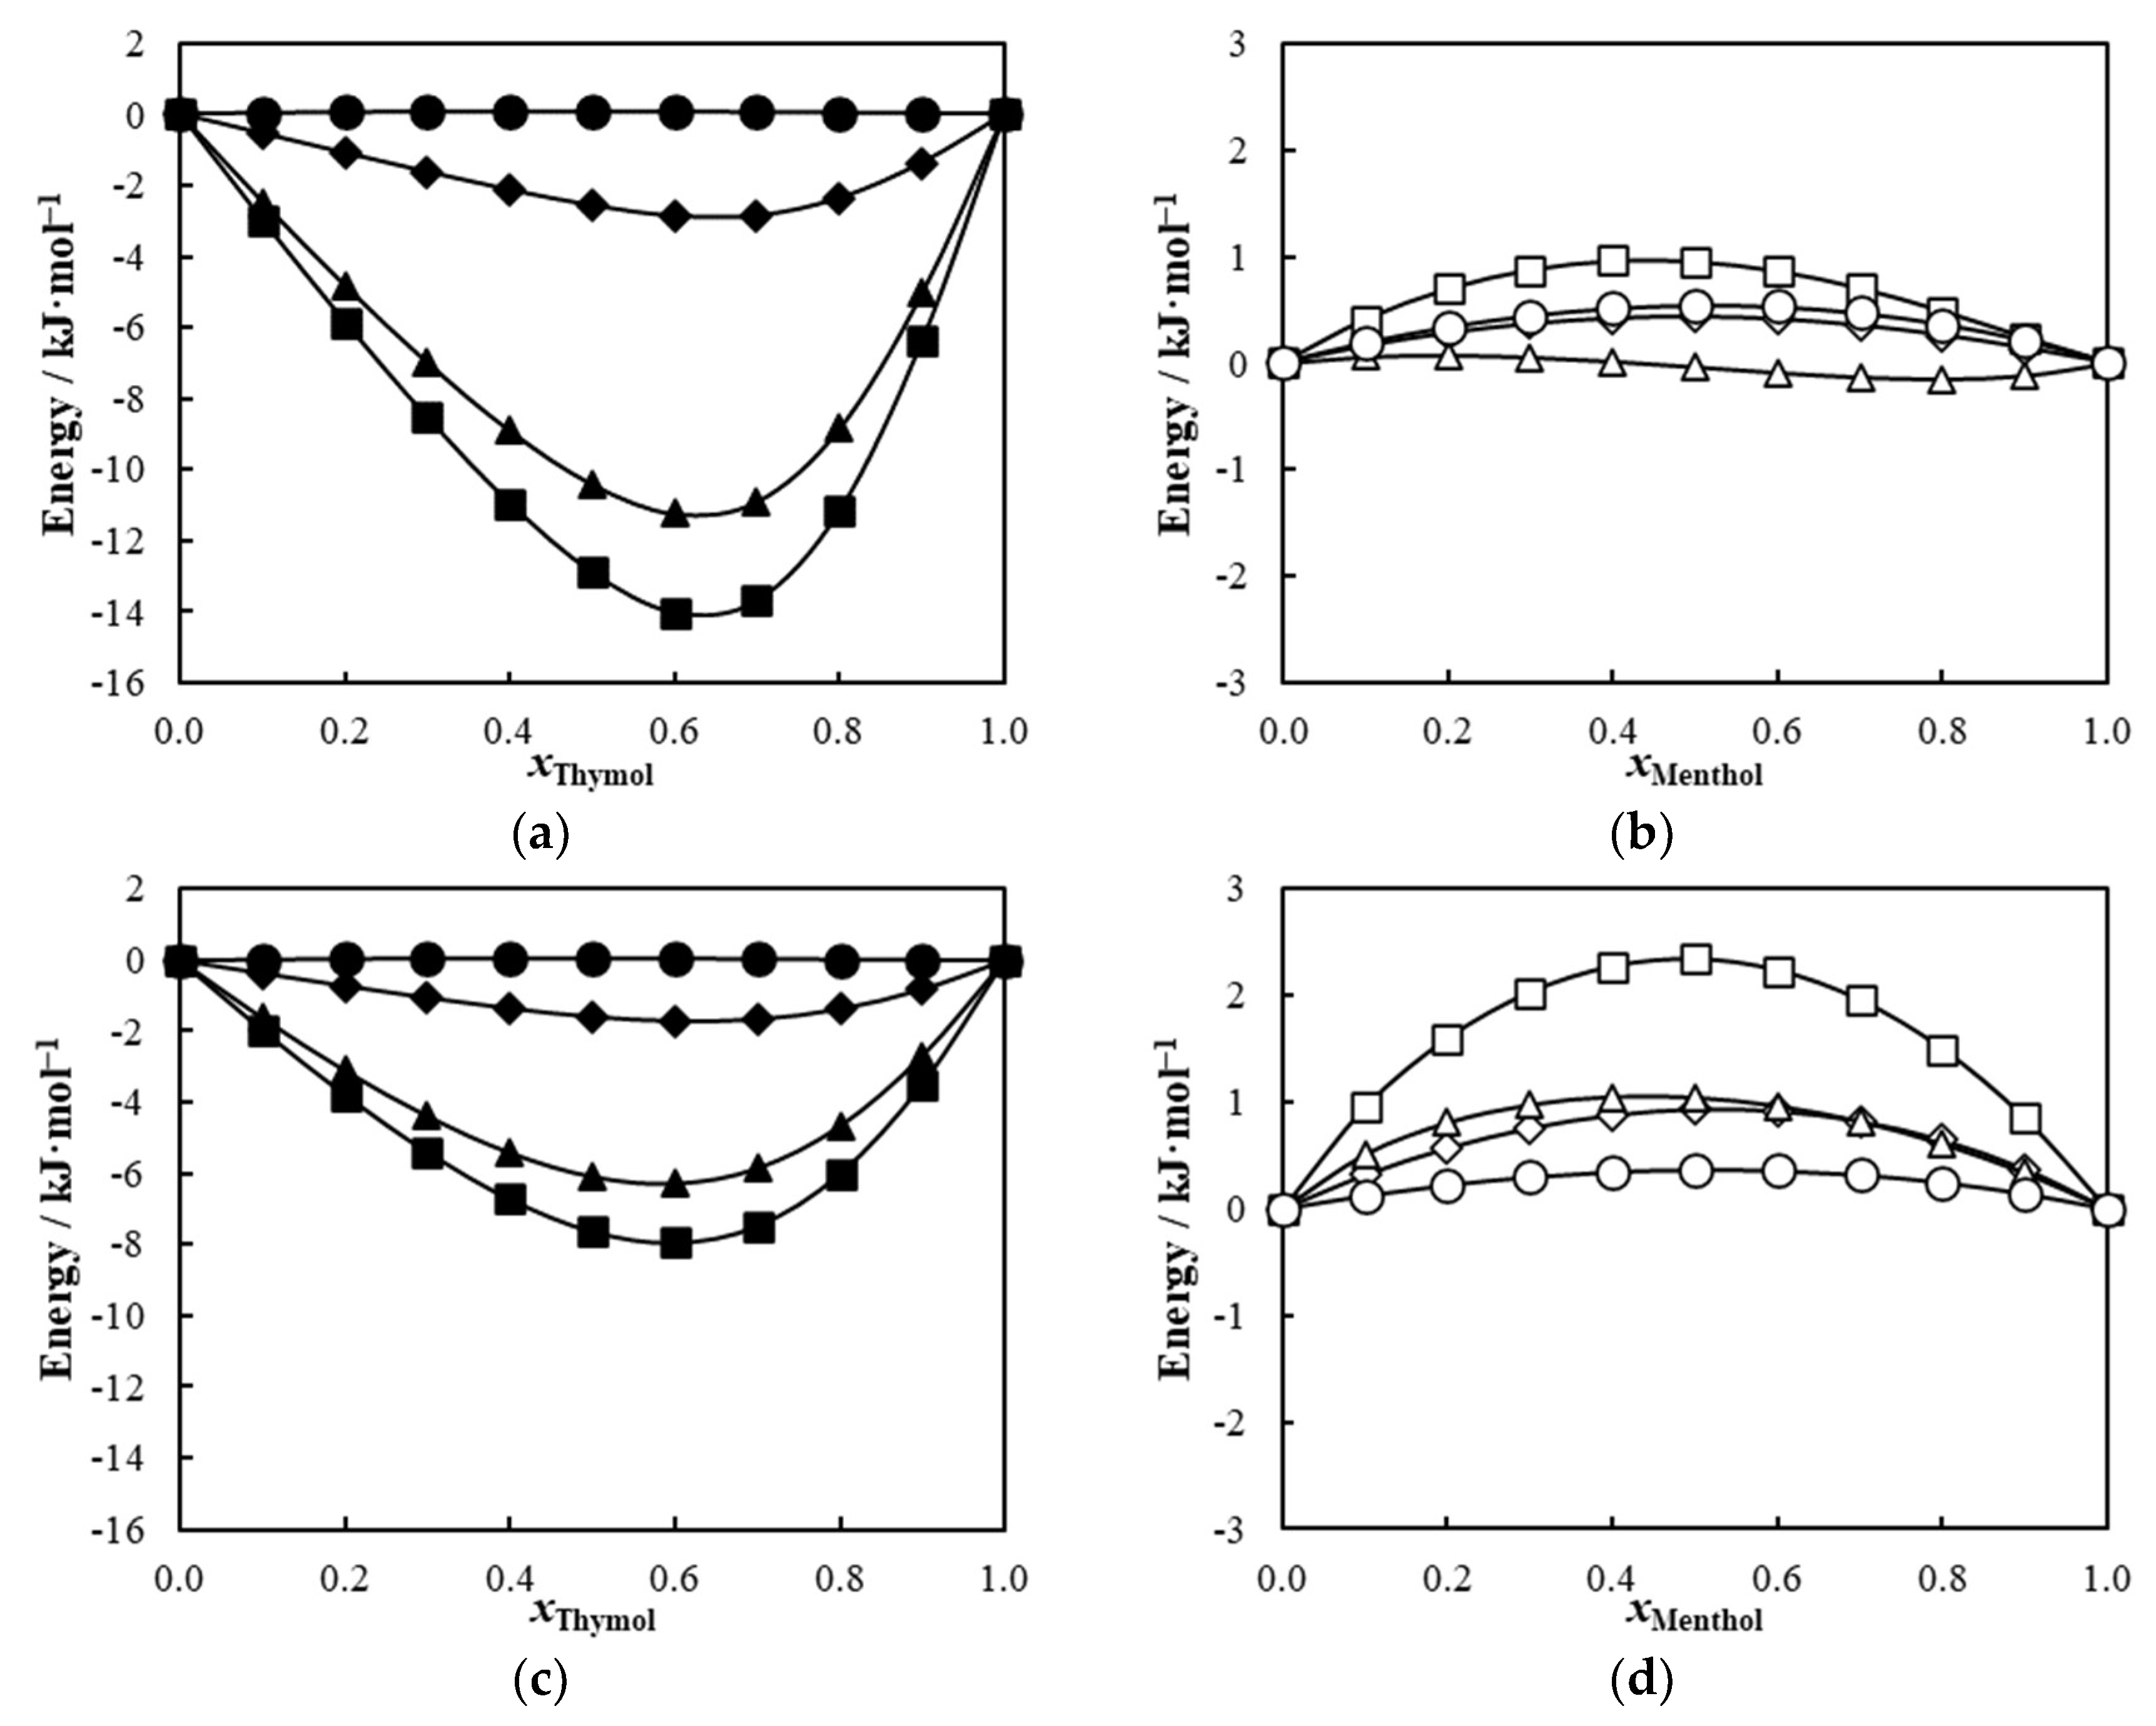
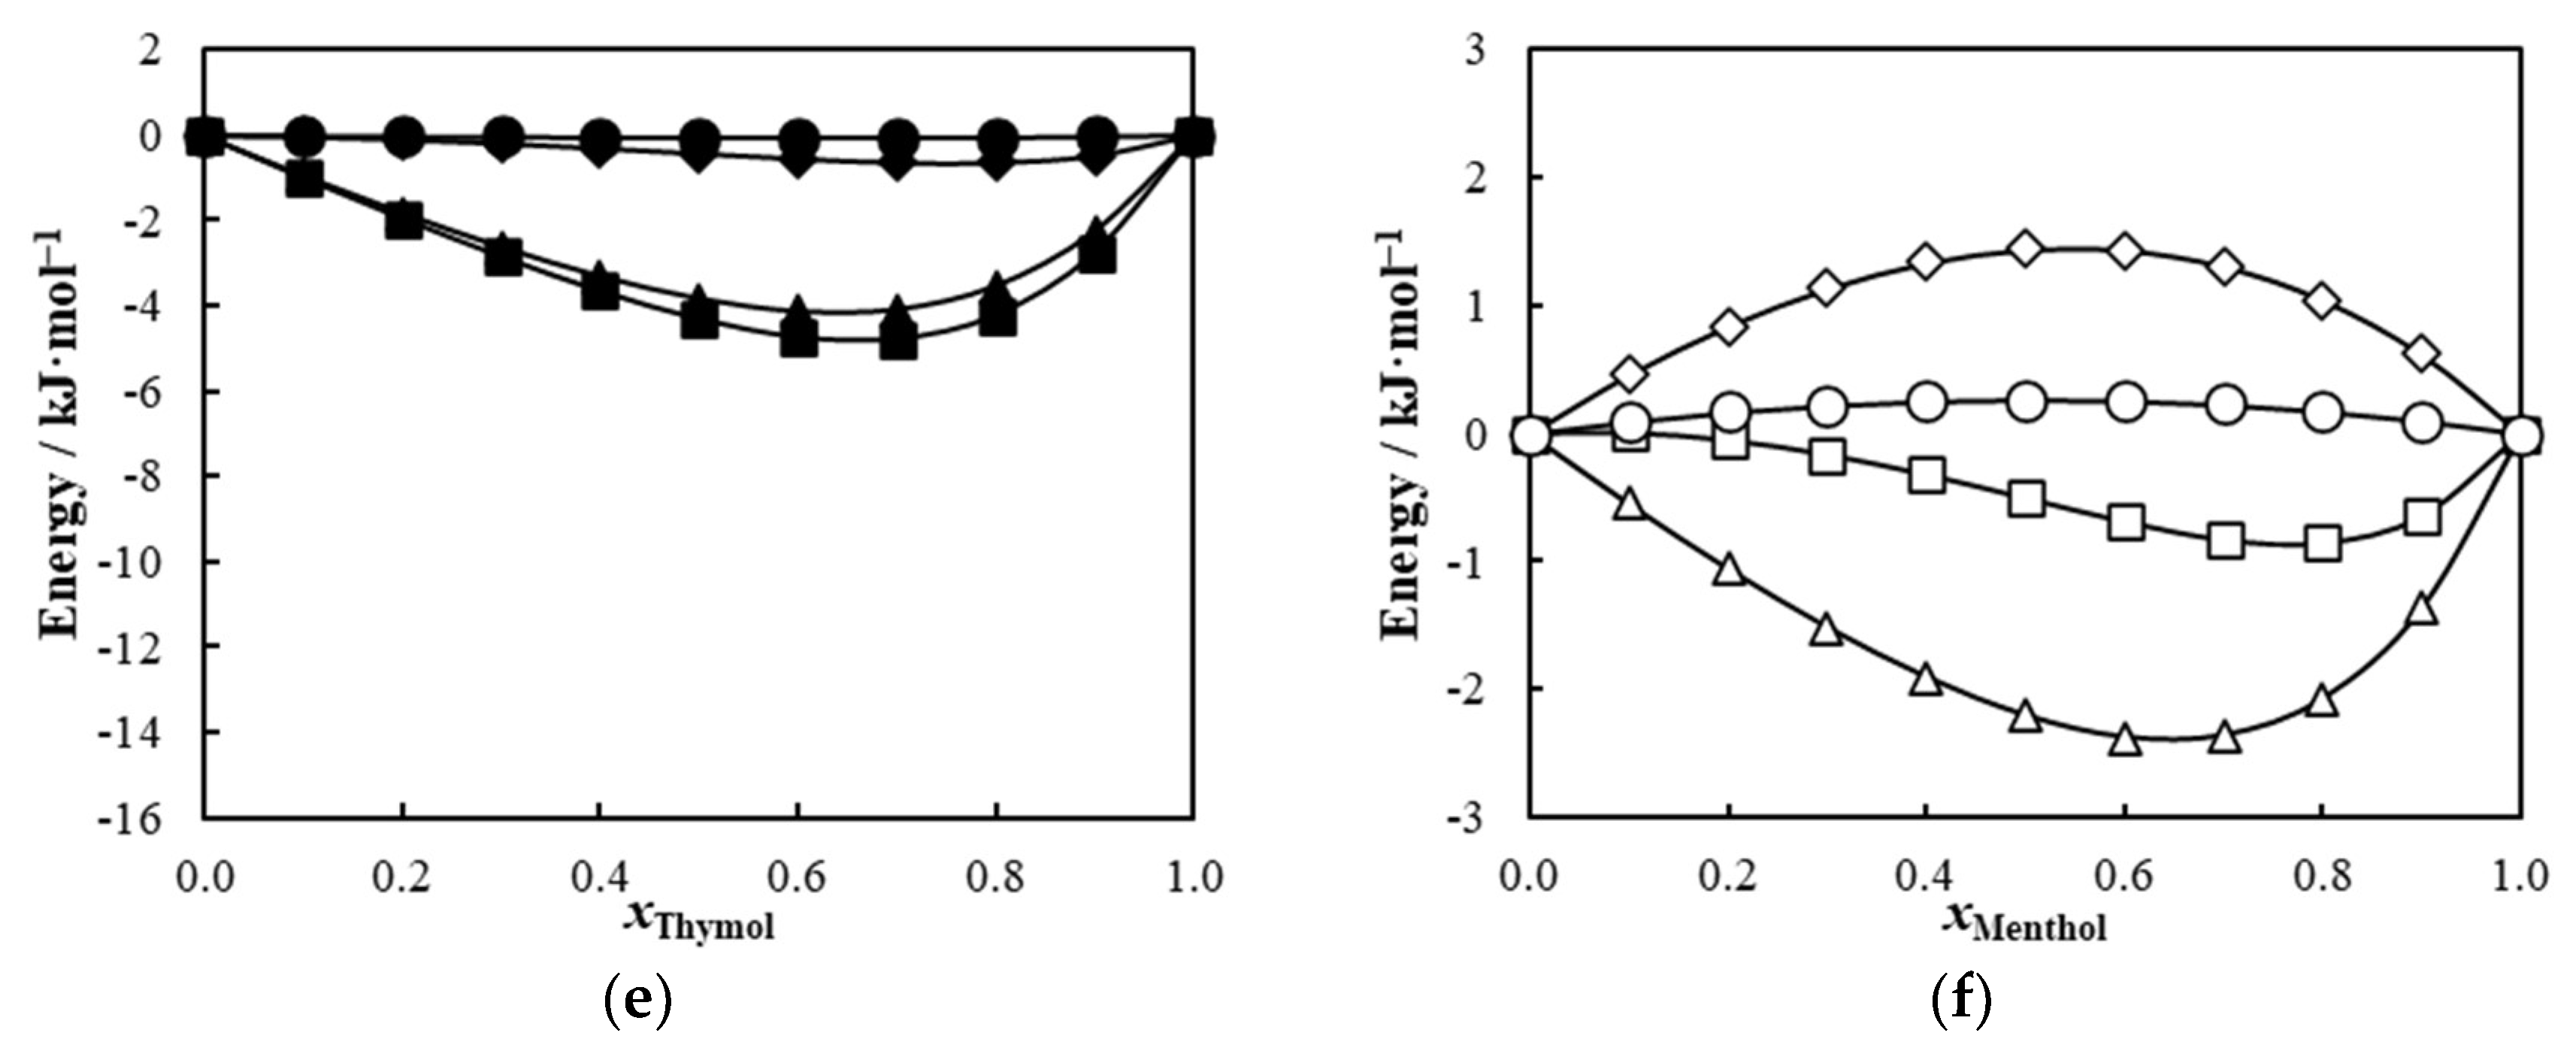
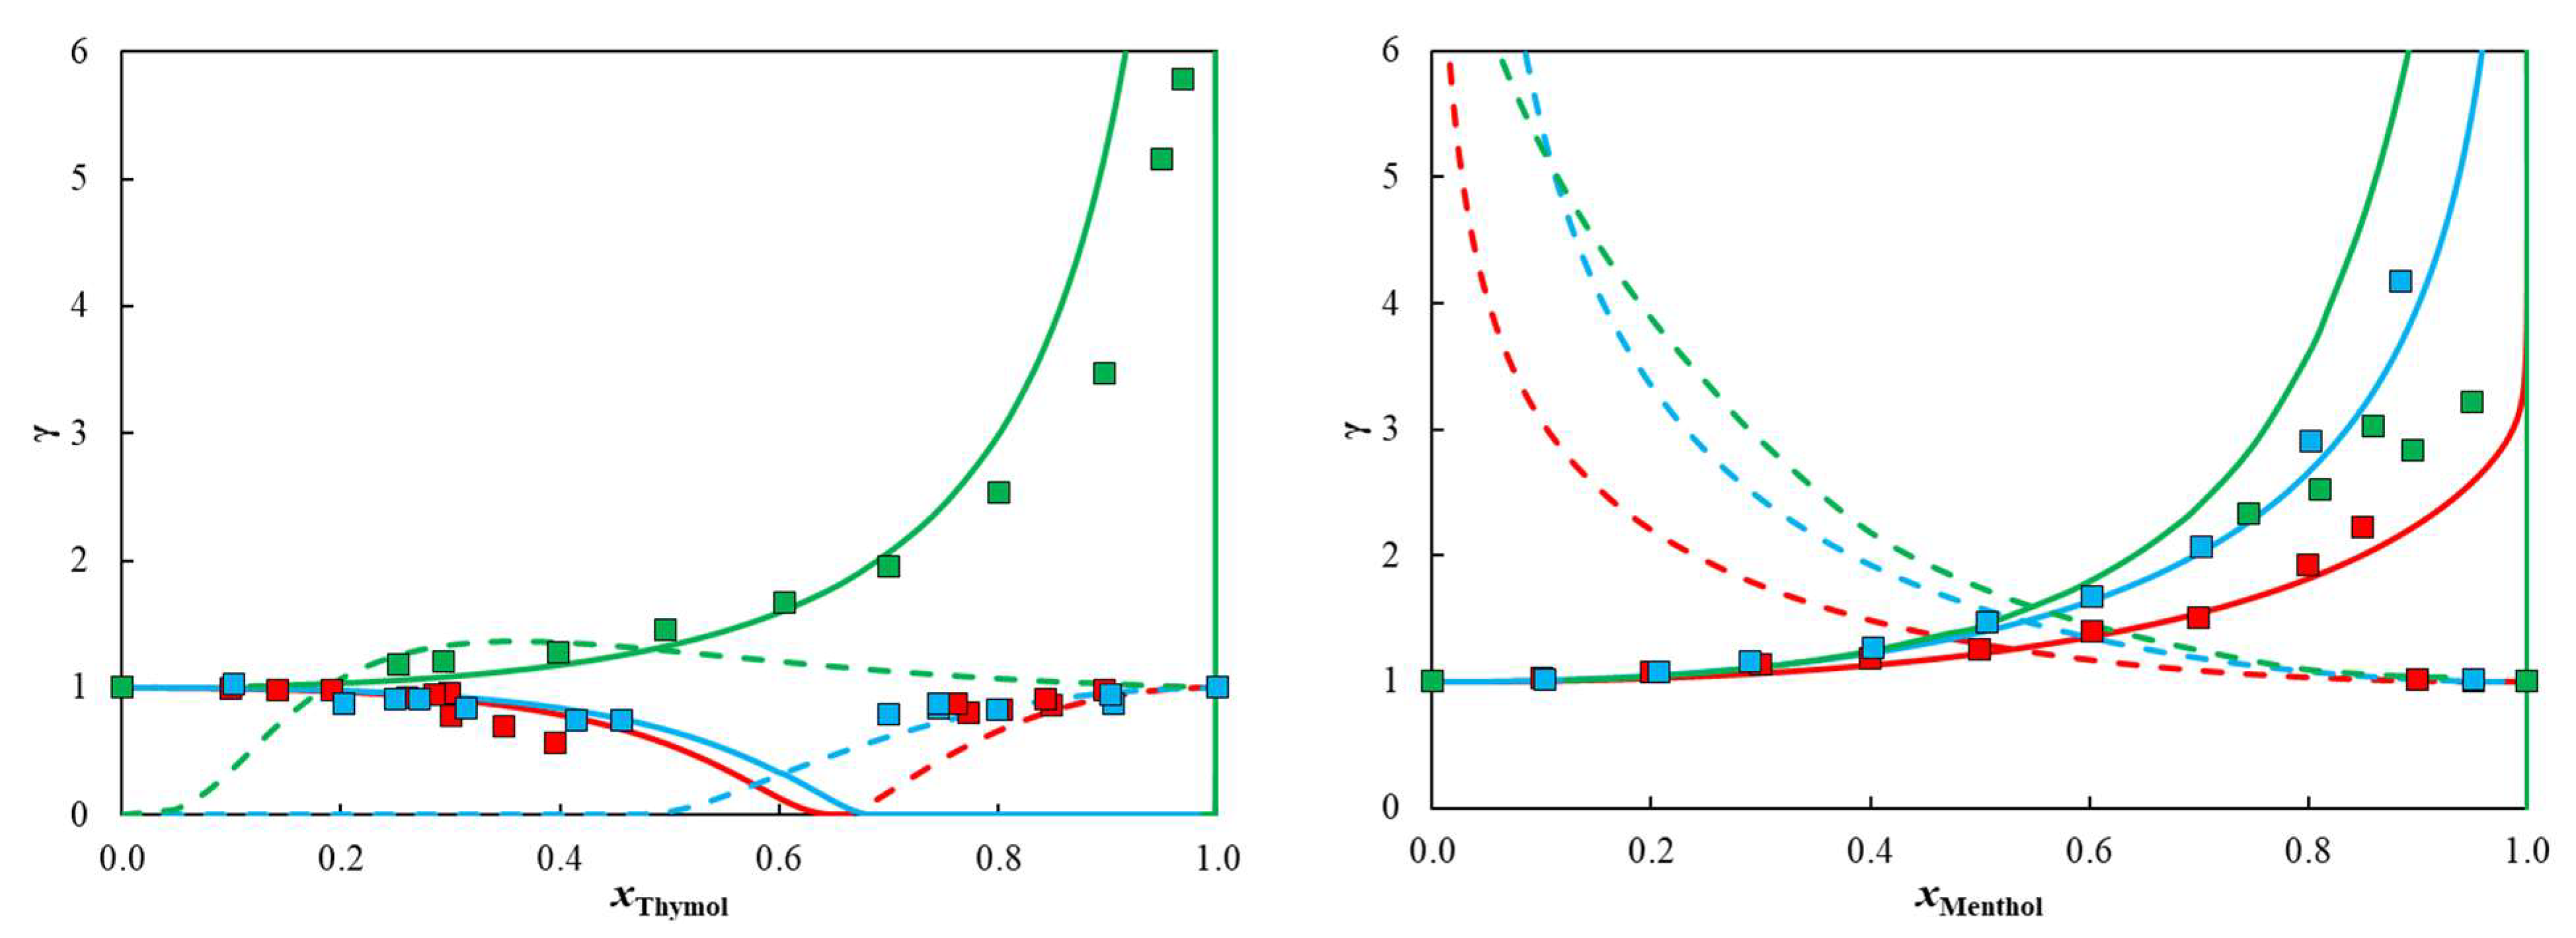
2. Results
3. Materials and Methods
3.1. Chemicals
3.2. Mixture Preparation
3.3. Solid-Liquid Equilibria Measurement
3.4. Thermodynamic Framework
3.5. The COSMO-RS Model
4. Conclusions
Supplementary Materials
Author Contributions
Funding
Institutional Review Board Statement
Informed Consent Statement
Data Availability Statement
Conflicts of Interest
Sample Availability
References
- Anastas, P.; Eghbali, N. Green Chemistry: Principles and Practice. Chem. Soc. Rev. 2010, 39, 301–312. [Google Scholar] [CrossRef]
- Ali Redha, A. Review on Extraction of Phenolic Compounds from Natural Sources Using Green Deep Eutectic Solvents. J. Agric. Food Chem. 2021, 69, 878–912. [Google Scholar] [CrossRef]
- Chemat, F.; Vian, M.A.; Ravi, H.K.; Khadhraoui, B.; Hilali, S.; Perino, S.; Tixier, A.S.F. Review of alternative solvents for green extraction of food and natural products: Panorama, principles, applications and prospects. Molecules 2019, 24, 3007. [Google Scholar] [CrossRef] [Green Version]
- Abbott, A.P.; Capper, G.; Davies, D.L.; Rasheed, R.K.; Tambyrajah, V. Novel solvent properties of choline chloride/urea mixtures. Chem. Commun. 2003, 9, 70–71. [Google Scholar] [CrossRef] [Green Version]
- Florindo, C.; Branco, L.C.; Marrucho, I.M. Quest for Green-Solvent Design: From Hydrophilic to Hydrophobic (Deep) Eutectic Solvents. ChemSusChem 2019, 12, 1549–1559. [Google Scholar] [CrossRef]
- Zdanowicz, M.; Wilpiszewska, K.; Spychaj, T. Deep eutectic solvents for polysaccharides processing. A review. Carbohydr. Polym. 2018, 200, 361–380. [Google Scholar] [CrossRef]
- Hansen, B.B.; Spittle, S.; Chen, B.; Poe, D.; Zhang, Y.; Klein, J.M.; Horton, A.; Adhikari, L.; Zelovich, T.; Doherty, B.W.; et al. Deep Eutectic Solvents: A Review of Fundamentals and Applications. Chem. Rev. 2021, 121, 1232–1285. [Google Scholar] [CrossRef]
- Smith, E.L.; Abbott, A.P.; Ryder, K.S. Deep Eutectic Solvents (DESs) and Their Applications. Chem. Rev. 2014, 114, 11060–11082. [Google Scholar] [CrossRef] [Green Version]
- Martins, M.A.R.; Pinho, S.P.; Coutinho, J.A.P. Insights into the Nature of Eutectic and Deep Eutectic Mixtures. J. Solut. Chem. 2019, 48, 962–982. [Google Scholar] [CrossRef] [Green Version]
- Abranches, D.O.; Silva, L.P.; Martins, M.A.R.; Pinho, S.P.; Coutinho, J.A.P. Understanding the Formation of Deep Eutectic Solvents: Betaine as a Universal Hydrogen Bond Acceptor. ChemSusChem 2020, 13, 4916–4921. [Google Scholar] [CrossRef]
- Abranches, D.O.; Martins, M.A.R.; Silva, L.P.; Schaeffer, N.; Pinho, S.P.; Coutinho, J.A.P. Phenolic hydrogen bond donors in the formation of non-ionic deep eutectic solvents: The quest for type v des. Chem. Commun. 2019, 55, 10253–10256. [Google Scholar] [CrossRef] [Green Version]
- Brett, C.M.A. Deep eutectic solvents and applications in electrochemical sensing. Curr. Opin. Electrochem. 2018, 10, 143–148. [Google Scholar] [CrossRef]
- Zhekenov, T.; Toksanbayev, N.; Kazakbayeva, Z.; Shah, D.; Mjalli, F.S. Formation of type III Deep Eutectic Solvents and effect of water on their intermolecular interactions. Fluid Phase Equilib. 2017, 441, 43–48. [Google Scholar] [CrossRef]
- Abbott, A.P.; Boothby, D.; Capper, G.; Davies, D.L.; Rasheed, R.K. Deep Eutectic Solvents formed between choline chloride and carboxylic acids: Versatile alternatives to ionic liquids. J. Am. Chem. Soc. 2004, 126, 9142–9147. [Google Scholar] [CrossRef]
- Abranches, D.O.; Coutinho, J.A.P. Type V Deep Eutectic Solvents: Design and Applications. Curr. Opin. Green Sustain. Chem. 2022, 35, 100612. [Google Scholar] [CrossRef]
- Hernández-Rodríguez, P.; Baquero, L.P.; Larrota, H.R. Flavonoids: Potential Therapeutic Agents by Their Antioxidant Capacity. In Bioactive Compounds: Health Benefits and Potential Applications; Woodhead Publishing: Sawston, UK, 2018; pp. 265–288. ISBN 9780128147757. [Google Scholar]
- Cao, D.; Liu, Q.; Jing, W.; Tian, H.; Yan, H.; Bi, W.; Jiang, Y.; Chen, D.D.Y. Insight into the Deep Eutectic Solvent Extraction Mechanism of Flavonoids from Natural Plant. ACS Sustain. Chem. Eng. 2020, 8, 19169–19177. [Google Scholar] [CrossRef]
- Ruesgas-Ramón, M.; Figueroa-Espinoza, M.C.; Durand, E. Application of Deep Eutectic Solvents (DES) for Phenolic Compounds Extraction: Overview, Challenges, and Opportunities. J. Agric. Food Chem. 2017, 65, 3591–3601. [Google Scholar] [CrossRef]
- Bajkacz, S.; Adamek, J. Development of a Method Based on Natural Deep Eutectic Solvents for Extraction of Flavonoids from Food Samples. Food Anal. Methods 2018, 11, 1330–1344. [Google Scholar] [CrossRef] [Green Version]
- Brouwer, T.; Dielis, B.C.; Bock, J.M.; Schuur, B. Hydrophobic deep eutectic solvents for the recovery of bio-based chemicals: Solid–liquid equilibria and liquid–liquid extraction. Processes 2021, 9, 796. [Google Scholar] [CrossRef]
- Cañada-Barcala, A.; Rodríguez-Llorente, D.; López, L.; Navarro, P.; Hernández, E.; Águeda, V.I.; Álvarez-Torrellas, S.; Parajó, J.C.; Rivas, S.; Larriba, M. Sustainable Production of Furfural in Biphasic Reactors Using Terpenoids and Hydrophobic Eutectic Solvents. ACS Sustain. Chem. Eng. 2021, 9, 10266–10275. [Google Scholar] [CrossRef]
- Rodríguez-Llorente, D.; Cañada-Barcala, A.; Álvarez-Torrellas, S.; Águeda, V.I.; García, J.; Larriba, M. A review of the use of eutectic solvents, terpenes and terpenoids in liquid–liquid extraction processes. Processes 2020, 8, 1220. [Google Scholar] [CrossRef]
- Klamt, A. Conductor-like screening model for real solvents: A new approach to the quantitative calculation of solvation phenomena. J. Phys. Chem. 1995, 99, 2224–2235. [Google Scholar] [CrossRef]
- Klamt, A.; Jonas, V.; Bürger, T.; Lohrenz, J.C.W. Refinement and parametrization of COSMO-RS. J. Phys. Chem. A 1998, 102, 5074–5085. [Google Scholar] [CrossRef]
- Eckert, F.; Klamt, A. Fast Solvent Screening via Quantum Chemistry: COSMO-RS Approach. AIChE J. 2002, 48, 369–385. [Google Scholar] [CrossRef] [Green Version]
- Tiecco, M.; Cappellini, F.; Nicoletti, F.; Del Giacco, T.; Germani, R.; Di Profio, P. Role of the hydrogen bond donor component for a proper development of novel hydrophobic deep eutectic solvents. J. Mol. Liq. 2019, 281, 423–430. [Google Scholar] [CrossRef]
- Schaeffer, N.; Conceição, J.H.F.; Martins, M.A.R.; Neves, M.C.; Pérez-Sánchez, G.; Gomes, J.R.B.; Papaiconomou, N.; Coutinho, J.A.P. Non-ionic hydrophobic eutectics-versatile solvents for tailored metal separation and valorisation. Green Chem. 2020, 22, 2810–2820. [Google Scholar] [CrossRef]
- Van den Bruinhorst, A.; Raes, S.; Maesara, S.A.; Kroon, M.C.; Esteves, A.C.C.; Meuldijk, J. Hydrophobic eutectic mixtures as volatile fatty acid extractants. Sep. Purif. Technol. 2019, 216, 147–157. [Google Scholar] [CrossRef]
- Liu, Q.; Mou, H.; Chen, W.; Zhao, X.; Yu, H.; Xue, Z.; Mu, T. Highly Efficient Dissolution of Lignin by Eutectic Molecular Liquids. Ind. Eng. Chem. Res. 2019, 58, 23438–23444. [Google Scholar] [CrossRef]
- Santana-Mayor, Á.; Socas-Rodríguez, B.; Rodríguez-Ramos, R.; Herrera-Herrera, A.V.; Rodríguez-Delgado, M.Á. Quality assessment of environmental water by a simple and fast non-ionic hydrophobic natural deep eutectic solvent-based extraction procedure combined with liquid chromatography tandem mass spectrometry for the determination of plastic migrants. Anal. Bioanal. Chem. 2021, 413, 1967–1981. [Google Scholar] [CrossRef]
- Cao, J.; Su, E. Hydrophobic deep eutectic solvents: The new generation of green solvents for diversified and colorful applications in green chemistry. J. Clean. Prod. 2021, 314, 127965. [Google Scholar] [CrossRef]
- Chen, C.C.; Huang, Y.H.; Fang, J.Y. Hydrophobic deep eutectic solvents as green absorbents for hydrophilic VOC elimination. J. Hazard. Mater. 2022, 424, 127366. [Google Scholar] [CrossRef] [PubMed]
- Martins, M.R.; Crespo, E.A.; Pontes, P.V.A.; Silva, L.P.; Bülow, M.; Maximo, G.J.; Batista, E.A.C.; Held, C.; Pinho, S.P.; Coutinho, J.A.P. Tunable Hydrophobic Eutectic Solvents Based on Terpenes and Monocarboxylic Acids. ACS Sustain. Chem. Eng. 2018, 6, 8836–8846. [Google Scholar] [CrossRef]
- Abranches, D.O.; Martins, R.O.; Silva, L.P.; Martins, M.A.R.; Pinho, S.P.; Coutinho, J.A.P. Liquefying Compounds by Forming Deep Eutectic Solvents: A Case Study for Organic Acids and Alcohols. J. Phys. Chem. B 2020, 124, 4174–4184. [Google Scholar] [CrossRef] [PubMed]
- Alhadid, A.; Mokrushina, L.; Minceva, M. Formation of glassy phases and polymorphism in deep eutectic solvents. J. Mol. Liq. 2020, 314, 113667. [Google Scholar] [CrossRef]
- Pätzold, M.; Burek, B.O.; Liese, A.; Bloh, J.Z.; Holtmann, D. Product recovery of an enzymatically synthesized (−)-menthol ester in a deep eutectic solvent. Bioprocess Biosyst. Eng. 2019, 42, 1385–1389. [Google Scholar] [CrossRef]
- Alagawany, M.; Farag, M.R.; Abdelnour, S.A.; Elnesr, S.S. A review on the beneficial effect of thymol on health and production of fish. Rev. Aquac. 2021, 13, 632–641. [Google Scholar] [CrossRef]
- Rodríguez-Llorente, D.; Navarro, P.; Santiago, R.; Águeda, V.I.; Álvarez-Torrellas, S.; García, J.; Larriba, M. Extractive removal and recovery of bisphenol A from aqueous solutions using terpenoids and hydrophobic eutectic solvents. J. Environ. Chem. Eng. 2021, 9, 106128. [Google Scholar] [CrossRef]
- Klamt, A.; Eckert, F.; Arlt, W. COSMO-RS: An alternative to simulation for calculating thermodynamic properties of liquid mixtures. Annu. Rev. Chem. Biomol. Eng. 2010, 1, 101–122. [Google Scholar] [CrossRef] [Green Version]
- Schaeffer, N.; Abranches, D.O.; Silva, L.P.; Martins, M.A.R.; Carvalho, P.J.; Russina, O.; Triolo, A.; Paccou, L.; Guinet, Y.; Hedoux, A.; et al. Non-Ideality in Thymol + Menthol Type v Deep Eutectic Solvents. ACS Sustain. Chem. Eng. 2021, 9, 2203–2211. [Google Scholar] [CrossRef]
- Chadha, K.; Karan, M.; Chadha, R.; Bhalla, Y.; Vasisht, K. Is Failure of Cocrystallization Actually a Failure? Eutectic Formation in Cocrystal Screening of Hesperetin. J. Pharm. Sci. 2017, 106, 2026–2036. [Google Scholar] [CrossRef]
- Sousa, C.C.S.; Matos, M.A.R.; Morais, V.M.F. Energetics of flavone and flavanone. J. Chem. Thermodyn. 2009, 41, 1408–1412. [Google Scholar] [CrossRef]
- Chebil, L.; Humeau, C.; Anthoni, J.; Dehez, F.; Engasser, J.-M.; Ghoul, M. Solubility of flavonoids in pure solvents. J. Chem. Eng. Data 2007, 52, 1552–1556. [Google Scholar] [CrossRef]
- Martins, M.A.R.; Silva, L.P.; Jorge, P.S.; Abranches, D.O.; Pinho, S.P.; Coutinho, J.A.P. The role of ionic vs. non-ionic excipients in APIs-based eutectic systems. Eur. J. Pharm. Sci. 2021, 156, 105583. [Google Scholar] [CrossRef]
- Lobo Ferreira, A.I.M.C.; Rodrigues, A.S.M.C.; Villas, M.; Tojo, E.; Rebelo, L.P.N.; Santos, L.M.N.B.F. Crystallization and Glass-Forming Ability of Ionic Liquids: Novel Insights into Their Thermal Behavior. ACS Sustain. Chem. Eng. 2019, 7, 2989–2997. [Google Scholar] [CrossRef]
- Gamsjäger, H.; Lorimer, J.W.; Scharlin, P.; Shaw, D.G. Glossary of terms related to solubility: (IUPAC Recommendations 2008). Pure Appl. Chem. 2008, 80, 233–276. [Google Scholar] [CrossRef]
- Coutinho, J.A.P.; Andersen, S.I.; Stenby, E.H. Evaluation of activity coefficient models in prediction of alkane solid-liquid equilibria. Fluid Phase Equilib. 1995, 103, 23–39. [Google Scholar] [CrossRef]
- TURBOMOLE V7.4 2019, a Development of University of Karlsruhe and Forschungszentrum Karlsruhe GmbH, 1989–2007, TURBOMOLE GmbH, Since 2007. Available online: http://www.turbomole.com (accessed on 17 April 2022).
- Balasubramani, S.G.; Chen, G.P.; Coriani, S.; Diedenhofen, M.; Frank, M.S.; Franzke, Y.J.; Furche, F.; Grotjahn, R.; Harding, M.E.; Hättig, C.; et al. TURBOMOLE: Modular program suite for ab initio quantum-chemical and condensed-matter simulations. J. Chem. Phys. 2020, 152, 184107. [Google Scholar] [CrossRef]
- BIOVIA COSMOtherm Software, Release 2021; Dassault Systèmes. Available online: https://www.3ds.com/ (accessed on 17 April 2022).

| Compound | Source | CAS | Purity wt. % a | Water Content wt. % | Tm/K | ΔmH/kJ·mol−1 | |
|---|---|---|---|---|---|---|---|
| This Work b | Lit. | ||||||
| (−)-Menthol | Acros Organics c | 89-78-1 | ≥99.5 | <0.01 | 314.2 ± 0.3 | 315.68 ± 0.22 d | 12.89 ± 0.77 d |
| Thymol | TCI Chemicals e | 89-83-8 | ≥99.0 | <0.01 | 323.3 ± 0.3 | 323.50 ± 0.34 d | 19.65 ± 0.42 d |
| Flavone | Acros Organics c | 525-82-6 | ≥99.0 | <0.01 | 369.6 ± 0.3 | 369.89 ± 0.13 f | 20.32 ± 0.14 f |
| Flavanone | Alfa Aesar g | 487-26-3 | ≥98.0 | <0.01 | 348.8 ± 0.3 | 349.49 ± 0.13 f | 21.04 ± 0.19 f |
| (−)-Hesperetin | Cayman Chemical h | 520-33-2 | ≥98.0 | <0.282 | 504.8 ± 0.3 | 499.22 ± 1.00 i | 35.9 ± 0.08 i |
Publisher’s Note: MDPI stays neutral with regard to jurisdictional claims in published maps and institutional affiliations. |
© 2022 by the authors. Licensee MDPI, Basel, Switzerland. This article is an open access article distributed under the terms and conditions of the Creative Commons Attribution (CC BY) license (https://creativecommons.org/licenses/by/4.0/).
Share and Cite
Teixeira, G.; Abranches, D.O.; Silva, L.P.; Vilas-Boas, S.M.; Pinho, S.P.; Ferreira, A.I.M.C.L.; Santos, L.M.N.B.F.; Ferreira, O.; Coutinho, J.A.P. Liquefying Flavonoids with Terpenoids through Deep Eutectic Solvent Formation. Molecules 2022, 27, 2649. https://doi.org/10.3390/molecules27092649
Teixeira G, Abranches DO, Silva LP, Vilas-Boas SM, Pinho SP, Ferreira AIMCL, Santos LMNBF, Ferreira O, Coutinho JAP. Liquefying Flavonoids with Terpenoids through Deep Eutectic Solvent Formation. Molecules. 2022; 27(9):2649. https://doi.org/10.3390/molecules27092649
Chicago/Turabian StyleTeixeira, Gabriel, Dinis O. Abranches, Liliana P. Silva, Sérgio M. Vilas-Boas, Simão P. Pinho, Ana I. M. C. L. Ferreira, Luís M. N. B. F. Santos, Olga Ferreira, and João A. P. Coutinho. 2022. "Liquefying Flavonoids with Terpenoids through Deep Eutectic Solvent Formation" Molecules 27, no. 9: 2649. https://doi.org/10.3390/molecules27092649
APA StyleTeixeira, G., Abranches, D. O., Silva, L. P., Vilas-Boas, S. M., Pinho, S. P., Ferreira, A. I. M. C. L., Santos, L. M. N. B. F., Ferreira, O., & Coutinho, J. A. P. (2022). Liquefying Flavonoids with Terpenoids through Deep Eutectic Solvent Formation. Molecules, 27(9), 2649. https://doi.org/10.3390/molecules27092649