Article

GC/MS Analysis, Antioxidant Activity, and Antimicrobial Effect of Pelargonium peltatum (Geraniaceae)

by
Alan-Misael Alonso
1,
Oscar Kevin Reyes-Maldonado
2,
Ana María Puebla-Pérez
3,
Martha Patricia Gallegos Arreola
4,
Sandra Fabiola Velasco-Ramírez
2,
Victor Zúñiga-Mayo
5,
Rosa E. Sánchez-Fernández
6,
Jorge-Iván Delgado-Saucedo
3,* and
Gilberto Velázquez-Juárez
2,*
1
Doctorado en Ciencias en Procesos Biotecnológicos, Centro Universitario de Ciencias Exactas e Ingenierías, Universidad de Guadalajara, Blvd. Marcelino García Barragán #1421, Guadalajara CP 44340, Jalisco, Mexico
2
Centro Universitario de Ciencias Exactas e Ingenierías, Laboratorio de Bioquímica Avanzada, Departamento de Química, Universidad de Guadalajara, Blvd. Marcelino García Barragán #1421, Guadalajara CP 44430, Jalisco, Mexico
3
Centro Universitario de Ciencias Exactas e Ingenierías, Departamento de Farmacobiología, Universidad de Guadalajara, Blvd. Marcelino García Barragán #1421, Guadalajara CP 44430, Jalisco, Mexico
4
Centro de Investigación Biomédica de Occidente, División de Genética, I.M.S.S., Sierra Mojada 800, Independencia Oriente, Guadalajara CP 44340, Jalisco, Mexico
5
Campus Montecillo, CONACyT-Instituto de Fitosanidad, Colegio de Postgraduados, Texcoco CP 56230, Estado de Mexico, Mexico
6
Laboratorio Nacional de Investigación y Servicio Agroalimentario y Forestal (LANISAF), Universidad Autónoma Chapingo, Mexico-Texcoco km 38.5, Texcoco CP 56230, Mexico
*
Authors to whom correspondence should be addressed.
Molecules 2022, 27(11), 3436; https://doi.org/10.3390/molecules27113436
Submission received: 5 March 2022 / Revised: 24 May 2022 / Accepted: 24 May 2022 / Published: 26 May 2022

Abstract

:
In recent years, the increase in antibiotic resistance demands searching for new compounds with antimicrobial activity. Phytochemicals found in plants offer an alternative to this problem. The genus Pelargonium contains several species; some have commercial use in traditional medicine such as P. sinoides, and others such as P. peltatum are little studied but have promising potential for various applications such as phytopharmaceuticals. In this work, we characterized the freeze-dried extracts (FDEs) of five tissues (root, stem, leaf, and two types of flowers) and the ethyl acetate fractions from leaf (Lf-EtOAc) and flower (Fwr-EtOAc) of P. peltatum through the analysis by thin-layer chromatography (T.L.C.), gas chromatography coupled to mass spectrometry (GC-MS), phytochemicals quantification, antioxidant capacity, and antimicrobial activity. After the first round of analysis, it was observed that the FDE-Leaf and FDE-Flower showed higher antioxidant and antimicrobial activities compared to the other FDEs, for which FDE-Leaf and FDE-Flower were fractionated and analyzed in a second round. The antioxidant activity determined by ABTS showed that Lf-EtOAc and Fwr-EtOAc had the lowest IC50 values with 27.15 ± 1.04 and 28.11 ± 1.3 µg/mL, respectively. The content of total polyphenols was 264.57 ± 7.73 for Lf-EtOAc and 105.39 ± 4.04 mg G.A./g FDE for Fwr-EtOAc. Regarding the content of flavonoid, Lf-EtOAc and Fw-EtOAc had the highest concentration with 34.4 ± 1.06 and 29.45 ± 1.09 mg Q.E./g FDE. In addition, the minimum inhibitory concentration (M.I.C.) of antimicrobial activity was evaluated: Lf-EtOAc and Fwr-EtOAc were effective at 31.2 µg/mL for Staphylococcus aureus and 62.5 µg/mL for Salmonella enterica, while for the Enterococcus feacalis strain, Fwr-EtOAc presented 31.2 µg/mL of M.I.C. According to the GC-MS analysis, the main compounds were 1,2,3-Benzenetriol (Pyrogallol), with 77.38% of relative abundance in the Lf-EtOAc and 71.24% in the Fwr-EtOAc, followed by ethyl gallate (13.10%) in the Fwr-EtOAc and (Z)-9-Octadecenamide (13.63% and 6.75%) in both Lf-EtOAc and Fwr-EtOAc, respectively.

1. Introduction

Plants’ primary metabolism is essential for their survival, characterized by synthesizing the necessary metabolites for their growth and functionality, such as sugars, fatty acids, and amino acids, among others. On the other hand, secondary metabolism is not essential for their survival; it is generated in response to chemical, physical, and biological factors resulting from the interaction between the plant and the environment. Secondary metabolism confers defense to biotic and abiotic stress, triggering a synthesis response of secondary metabolites that activates the plant’s defense mechanism [1,2].
It has been estimated that plants can produce more than 200,000 secondary metabolites; among them, terpenes, alkaloids, and polyphenols are the most diverse [3,4]. Polyphenols are a well-known group of compounds with antioxidant properties present in plants among the secondary metabolites. Polyphenols are present in more significant quantities in epidermal and sub-epidermal cells’ walls and vacuoles. The basic structure of polyphenols is composed of a phenyl ring with a hydroxyl group attached to it. This basic structure allows polyphenols to be classified into different subfamilies, including flavonoids and tannins [5,6,7].
Flavonoids have a 15-carbon phenyl benzopyran skeleton [5]. They are synthesized in all parts of the plant and are responsible for the pigmentation of flowers. Polyphenols protect the plant from certain insects and ultraviolet radiation [8]. Tannins are molecules with high molecular weight (500 to 20,000 Daltons), produced in seeds, roots, bark, wood, and leaves. They are characterized by an astringent taste [9] that generates protection against predators such as birds, herbivores, and some insects [5].
Tannins are classified as hydrolyzable and condensed tannins. Hydrolyzable tannins can be hydrolyzed with acids, bases, and hot water. This class of tannins is divided into gallotannins with a central structure of glucose, and ellagitannins result from the oxidation of penta-galloylglucose. Condensed tannins, also called proanthocyanidins are flavonoid oligomers with varying degrees of polymerization [9]. These metabolites are characterized by their ability to scavenge free radicals, such as reactive oxygen species (R.O.S.), reactive nitrogen species (R.N.S.), and reactive sulfur species (R.S.).
These radical species affect cells through various mechanisms, such as destabilization of cell membrane structure, interference in signaling pathways, alteration of D.N.A. integrity, disruption of homeostasis, and induction of imbalance in organisms. All these mechanisms can lead to cardiovascular and chronic degenerative diseases and some types of cancer [10].
Many patients in clinics present complications caused by microorganisms since the treatments are not as efficient as required because bacteria have developed resistance to certain antibiotics, causing complications and delays in the recovery of health in patients [11]. In fact, we are going through a stage that may become critical since antibiotics are becoming less effective and common bacterial infections that were easily cured are now more complicated to treat. These complications are due to the increasing antibiotic resistance in bacterial strains. This phenomenon worsens, and many people could risk losing their lives due to a lack of adequate and effective treatment. Therefore, the search for new active ingredients with antimicrobial activity is required, and one primary source is plants.
Plants are an excellent renewable source of chemical compounds with various properties beneficial to humans. However, plants produce a wide variety of compounds, making it difficult to identify specific compounds associated with a given property. To solve this challenge, various chromatographic techniques have been developed to separate and identify the compounds of a complex sample, such as gas chromatography coupled to mass spectrometry (GC-MS), used in several studies for the identification of different compounds with antimicrobial activity obtained through the extraction of various parts of the plant and with different types of solvents [12,13,14,15,16].
Several studies researched the composition of the aerial parts of plants by GC/MS to characterize the volatile compounds in the extracts. For example, 77 compounds were found accumulated in mint extract, within which menthol and p-mentahn3-one had the highest antimicrobial activity [17]. Some studies relate antioxidant activity and the profile of volatiles in plants [18,19,20,21]. On the other hand, there are few studies of characterization by GC/MS in the genus Pelargonium, including P.graveolens [21], P. quercetorum [18], and P. capitatum [22].
In traditional medicine, the use of plant extracts is common. An example of this is the standardized extract [23] from the Pelargonium sidoides plant, an auxiliary in treating respiratory tract complications [24]. To this extract, it is attributed antimicrobial activity [25,26], antiviral activity [27], antitumor activity [28], and antioxidant synergistic potential [29]. Antimicrobial and antiviral activities have been attributed to gallic acid, its methyl ester derivatives, and coumarins such as 5,6,7-trimethoxycoumarin and 6,8-dihydroxy-5,7-dimethoxycoumarin [25,30]. P. sidoides belong to the Geraniaceae family, most of which are native to Africa and comprise 11 genera, including the genus Pelargonium, which comprises more than 7500 species [31,32].
However, the diverse biological activities are not exclusive to the species P. sidoides; for example, antimicrobial activity has been reported against Staphylococcus aureus in extracts of P. graveolens. In this study, the antimicrobial activity of essential oil from P. graveolens was attributed to compounds such as β-citronellol, β-caryophyllene, and caryophyllene oxide [33,34]. In the case of P. peltatum, biological activity against Streptococcus mutans and Streptococcus tanguinis has also been reported. Nevertheless, more studies are needed to demonstrate the potential of the compounds present in P. peltatum, both in their antimicrobial properties and antioxidant potential. Therefore, the purpose of this research was to perform a phytochemical, antioxidant, and GC-MS profile of hydroalcoholic extracts of root, stem, leaf, and flower of P. peltatum, seeking to compare the differences in the concentration of antioxidant compounds among the different tissues and to evaluate which of the extracts obtained had the highest antioxidant and antimicrobial activity and the possible semi-volatile compounds related to them.

2. Results

2.1. Yield and Solubility of Freeze-Dried Extract from P. peltatum

Table 1 shows the dry weight of each part of the plant and the weight obtained from the freeze-dried extracts (FDE). The freeze-dried flower extract (FDE-Bicolour) showed the highest recovery with a 28.47% yield, while the freeze-dried stem extract (FDE-Stem) showed the lowest with a 6.65% yield. From now on, we will refer to the freeze-dried extracts as FDE-Root, FDE-Stem, FDE-Leaf, FDE-Flower, and FDE-Bicolour. The lyophilized extracts were subjected to solubility tests. Most of the extracts were soluble in polar solvents, as shown in Supplementary Table S1.

2.2. Phytochemical Profiling by High-Performance Thin Layer Chromatography

The FDEs of P. peltatum were analyzed by thin-layer chromatography (T.L.C.) using a mobile phase of water: methanol: ethyl acetate (10:14:76) for their separation. The chromatoplates were developed using specific reagents for each group of compounds and exposure to ultraviolet light at two wavelengths (254 and 366 nm). For the development of tannins, we used a 1% ferric chloride solution; the chromatoplates showed the presence of bands in all the FDE. In particular, two bands (with RF = 0.015 and RF = 0.036) were present in all extracts, suggesting that the compounds found in these retention factors are common in all plant tissues. Similarly, a 1% aluminum chloride developer was used for flavonoids. In this case, all extracts presented bands reactive to this solution, where FDE-Flower showed the highest complexity of banding pattern (13 bands). Table 2 summarizes the retention factors (R.F.) for the bands detected in each experiment. In the case of the chromatoplates visualized at 254 nm, very few bands were observed in only two extracts, while the banding patterns visualized at a wavelength of 366 nm presented complex banding patterns in all extracts (see Supplementary Figure S1). We were unable to detect compounds with the alkaloid developer.

2.3. Antioxidant Activity of Freeze-Dried Extract from P. peltatum

The antioxidant capacity of the FDEs samples were evaluated using the DPPH, ABTS, and FRAP methodologies. The results are shown in Table 3. In these experiments, we evaluated different concentrations of the FDEs (20–500 µg/mL), and the results were expressed as IC50 (µg/mL) for ABTS and DPPH. FRAP measurements are reported in µM Trolox equivalent (T.E.).
When the DPPH technique determined the antioxidant activity, the FDE-Leaf showed the lowest IC50 value with 46.32 ± 1.84 µg/mL, followed by FDE-flower with 48.9 ± 3.36 µg/mL. Both values did not show significant differences between them. In comparison, FDE-Root showed the highest IC50 value with 77.47 ± 6.92 µg/mL, followed by FDE-Stem with 75.02 ± 10.57 µg/mL. Similarly, the results obtained by the ABTS method showed that FDE-Flower and FDE-Leaf had the lowest IC50 values with 103.9 ± 19.29 and 132.5 ± 19.15 µg/mL, respectively. In contrast, FDE-Stem showed the highest IC50 value with 293.40 ± 24.75 µg/mL. Measurements performed with FRAP methodology showed that FDE-Leaf has the highest antioxidant activity with 274.00 ± 3.70 µM T.E. followed by FDE-Flower with 258.70 ± 2.46 µM T.E. This time, a significant difference between these two samples was observed. Instead, FDE-Root showed the lowest value with 44.03 ± 3.79 µM T.E. Together these results indicate that FDE-Leaf and FDE-Flower have the highest, while FDE-Root and FDE-Stem have the lowest antioxidant capacity.

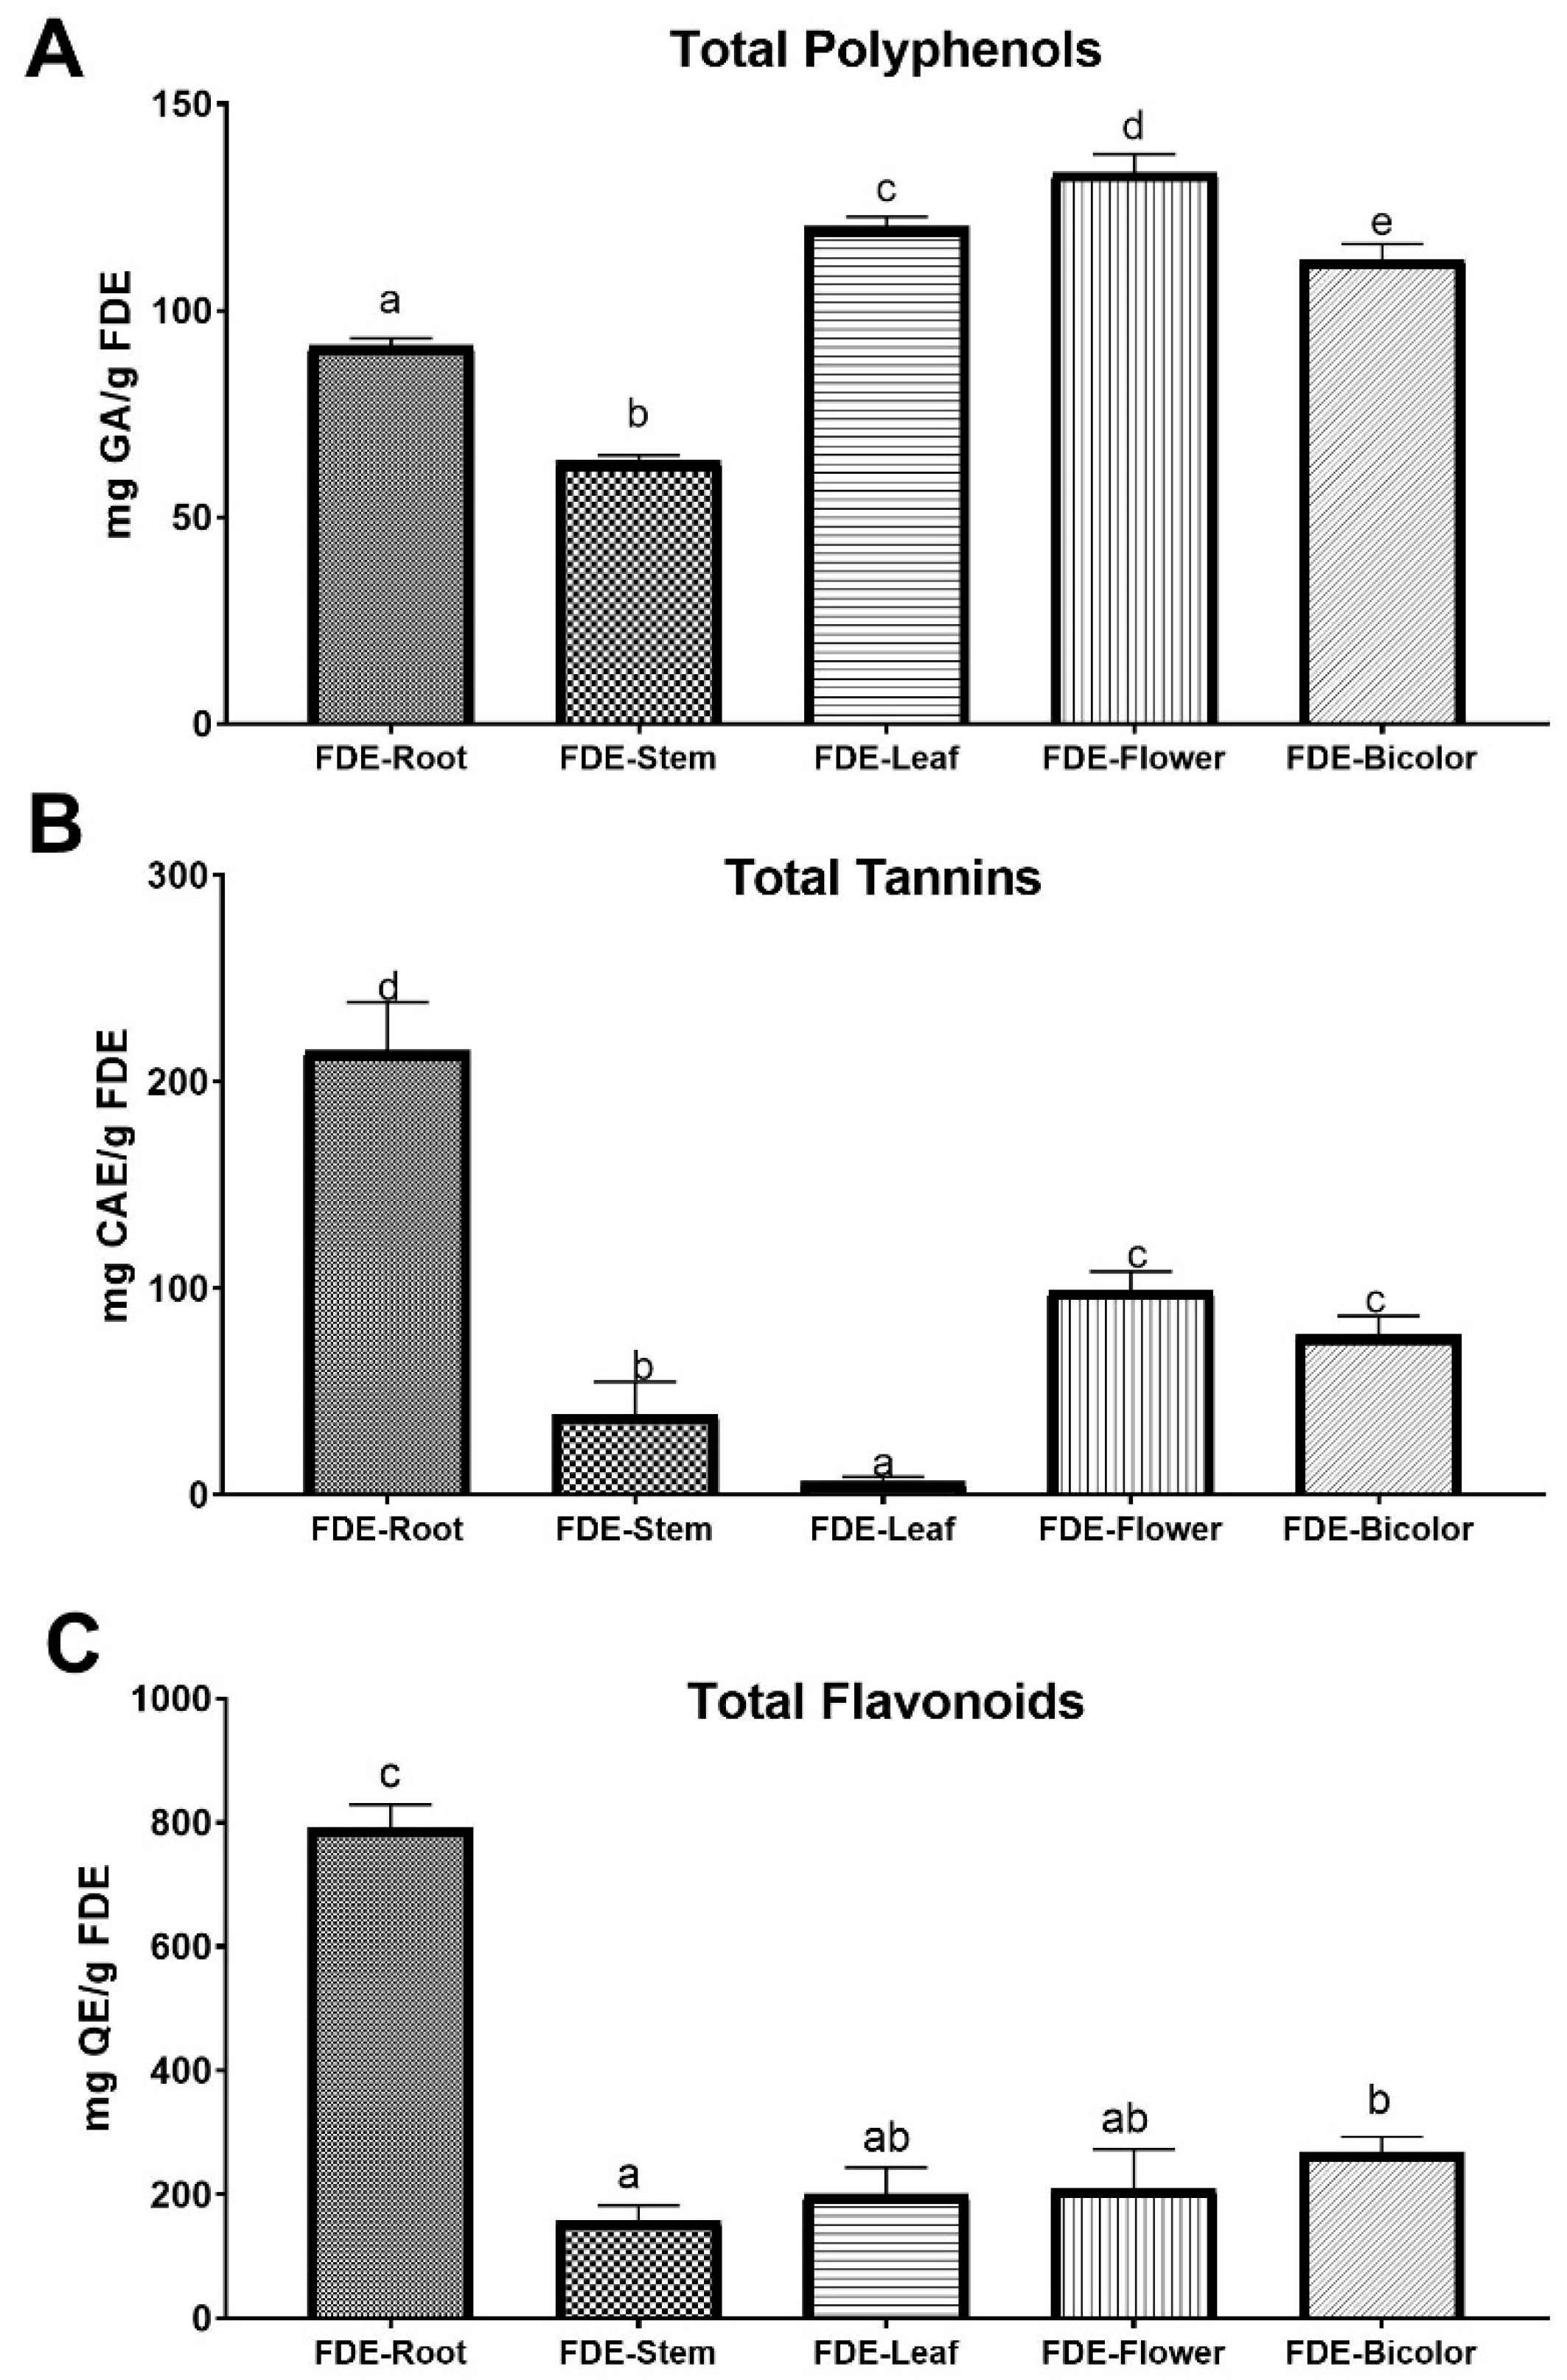
2.4. Quantification of Polyphenols, Tannins, and Flavonoids in FDEs from P. peltatum

Total polyphenol content was determined spectrophotometrically according to the Folin–Ciocalteu methodology. The results were expressed as mg of gallic acid (G.A.) equivalents per g of FDE. The highest concentration of polyphenols was found in FDE-Flower and FDE-Leaf with 133.36 ± 4.4 and 120 ± 2.4 mg G.A. equivalents/g of FDE, respectively. In comparison, FDE-Stem was the sample with the lowest concentration of polyphenols with 63.53 ± 1.4 mg G.A. equivalents/g of FDE. The graphed values can be seen in Figure 1A.
Tannin concentration was determined by the vanillin method. The results were expressed in mg of catechin equivalents (Q.A.)/g of dry extract. The FDE-Root had the highest tannin content with 214.99 ± 21.3 mg Q.A. equivalents/g of FDE, being almost twice as high as the FDE-Flower extracts with 99.02 ± 8.2 and the FDE-Bicolour with 77.14 ± 8.2 mg Q.A. equivalents/g of FDE. In contrast, the FDE-Leaf had the lowest tannin concentration with 6.23 ± 7.5 mg Q.A. equivalents/g of FDE. These values are plotted in Figure 1B, where the significant differences between the samples can be observed with a confidence level of 95% using the ANOVA and Tukey test.
The flavonoid content was performed using the aluminum trichloride method. Results were expressed as mg quercetin equivalents (Q.E.)/g of FDE. The FDE-Root showed the highest amount of flavonoids with 743.5 ± 36.7 mg Q.E. equivalents/g of FDE (Figure 1C) compared with the rest of the extracts, which showed about three times less. This time, the FDE-Stem was the sample with the lowest flavonoid content with 157.58 ± 24.6 mg Q.E. equivalents/g of FDE.

2.5. Antimicrobial Activity of Freeze-Dried Extract from P. peltatum

The FDEs of P. peltatum were tested to inhibit bacterial growth using four strains: Staphylococcus aureus, Enterococcus faecalis (Gram + bacteria), Salmonella enterica, and Serratia marcescens (Gram-bacteria). The FDEs were diluted with sterile water to a 5 mg/mL concentration and then assayed in the agar-well diffusion method. The FDEs exhibited microbial inhibitory activity in all strains tested (Figure S2). However, FDE-Leaf, FDE-bicolour, and FDE-Flower presented generally more considerable inhibition halos than FDE-Stem and FDE-root. Gram-positive strains were more susceptible to inhibition by FDEs than gram-negative strains. Notably, E. faecalis was highly susceptible to growth inhibition with FDE-Leaf. Generally, the FDEs with the highest activity are also those with the highest presence of polyphenols. The inhibition zones generated by FDEs against S. aureus, E. faecalis, S. enterica, and S. marcescens are presented in Supplementary Table S2.

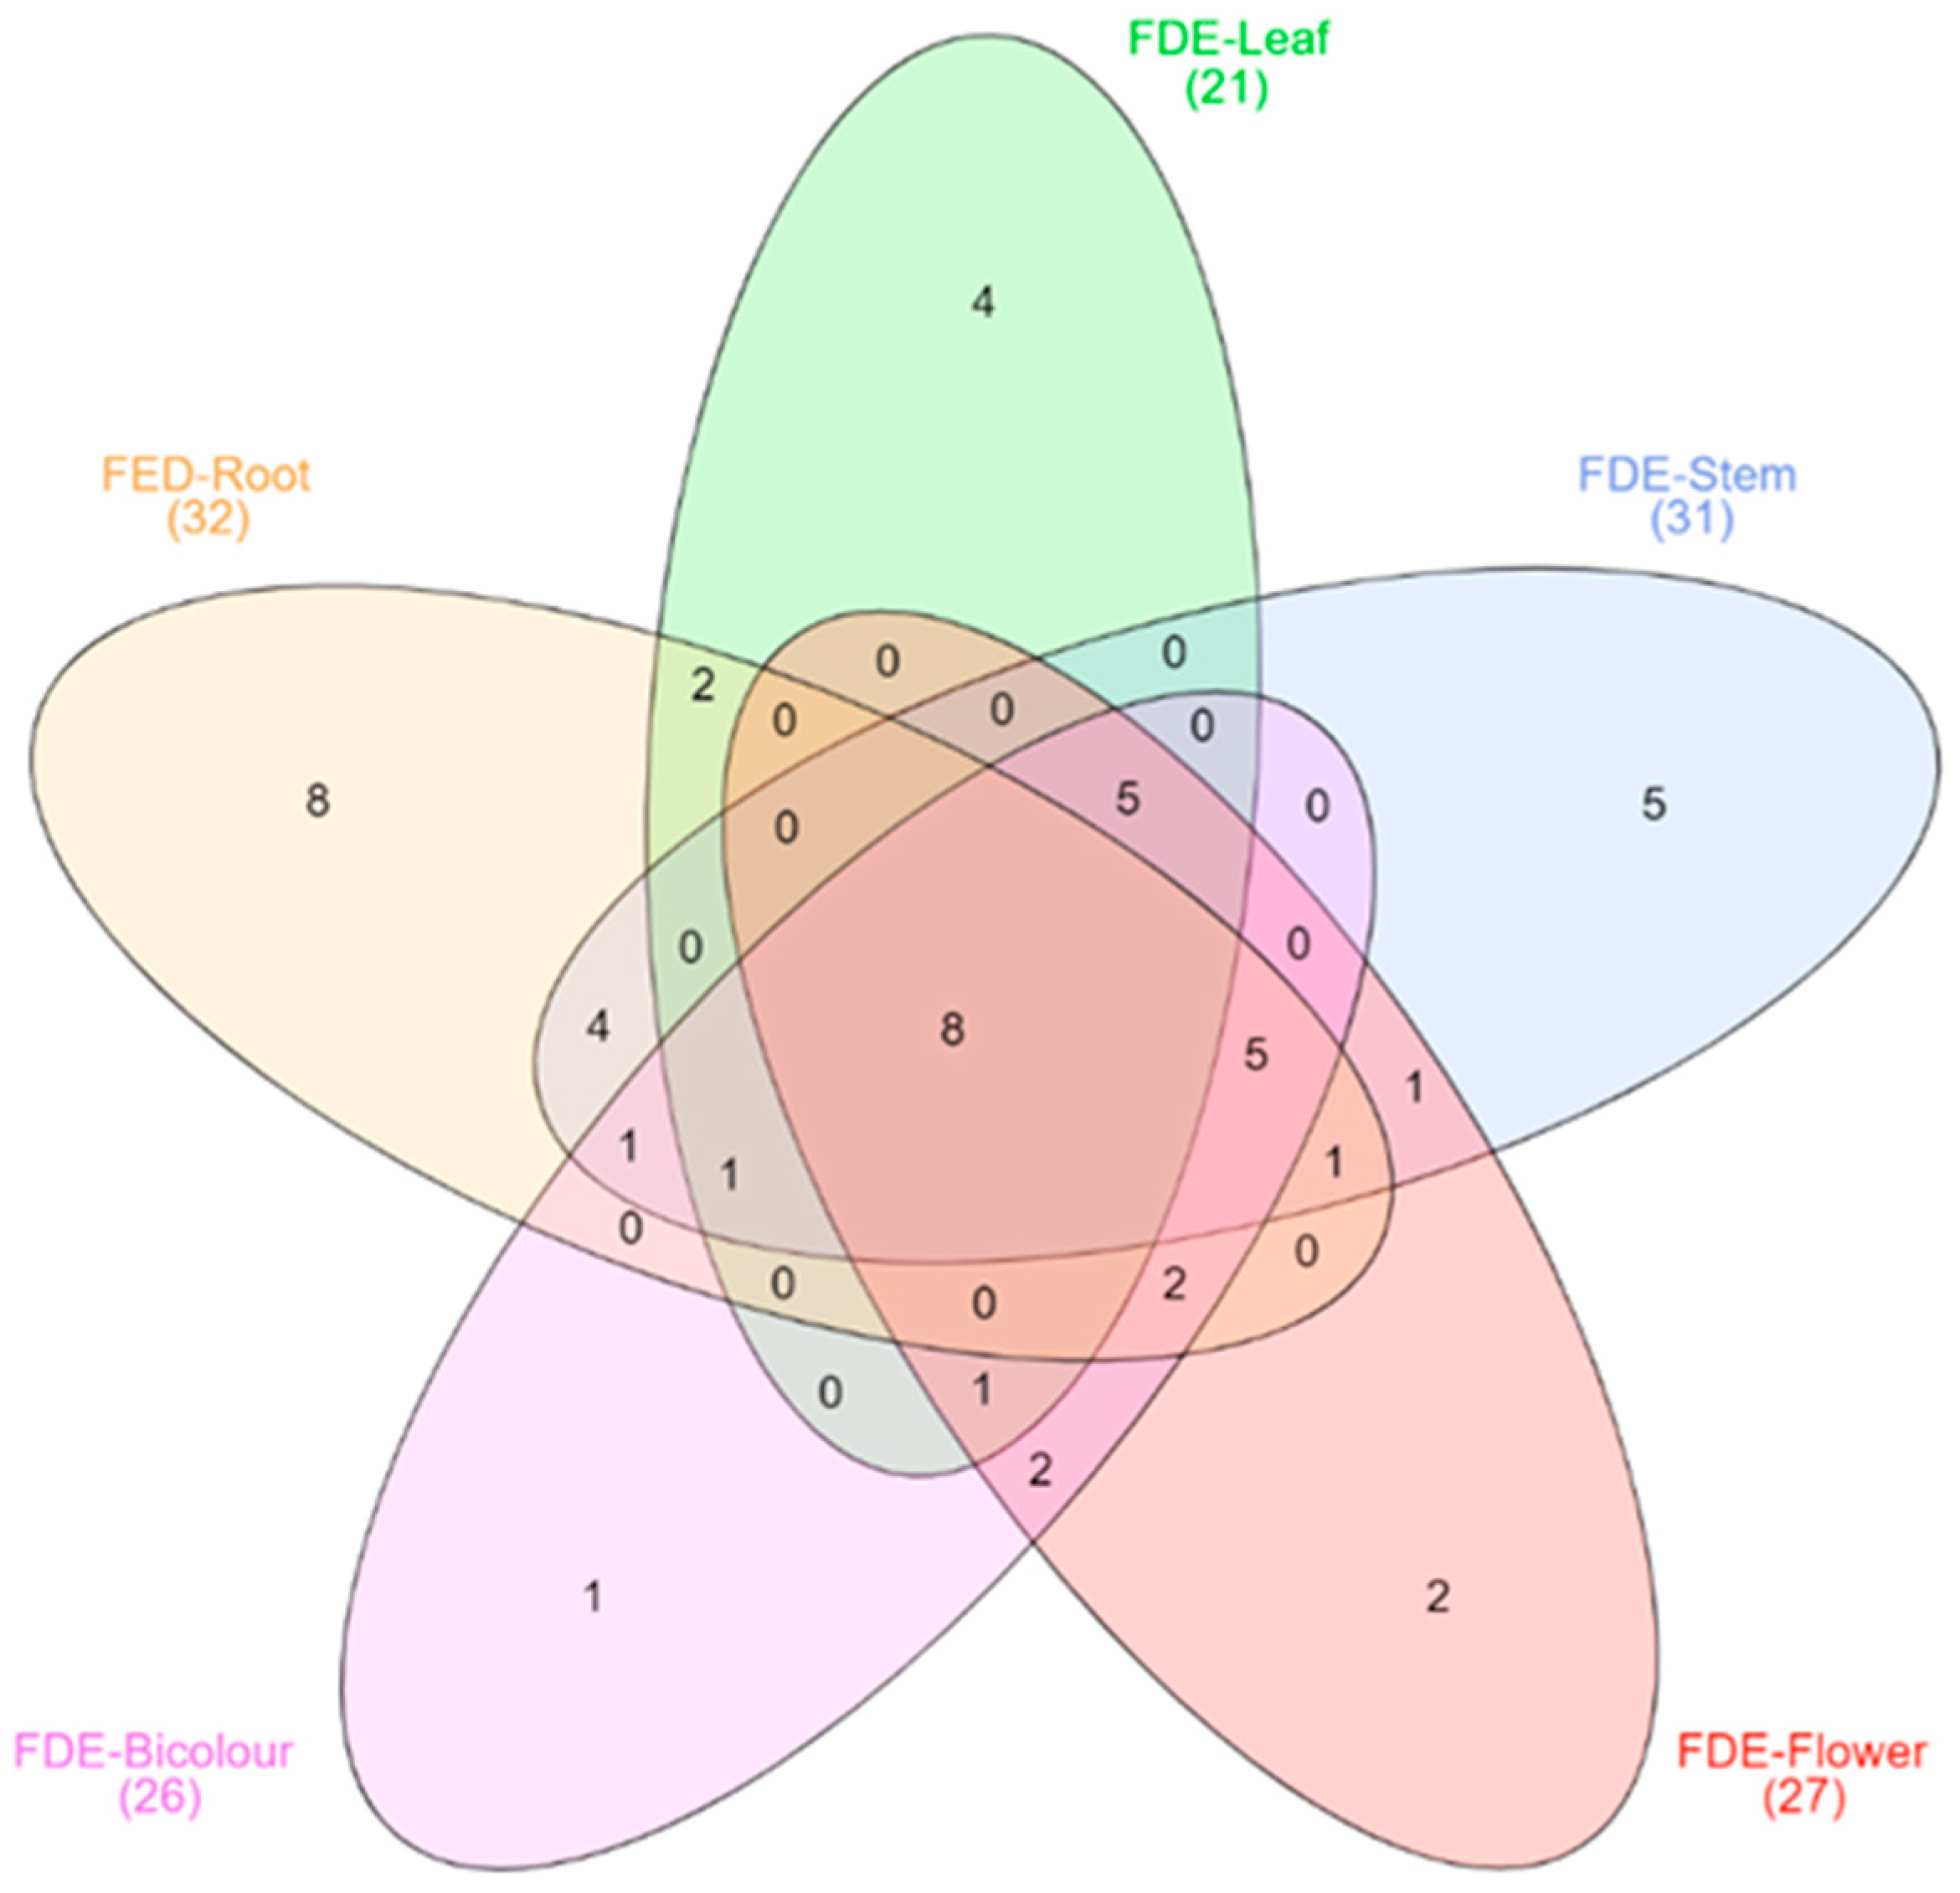
2.6. GC-MS Analysis of FDEs from P. peltatum

In order to know the chemical composition of the five extracts, we decided to perform a screening of volatile and semi-volatile compounds by gas chromatography coupled with mass spectrometry (GC-MS). A total of 53 compounds were identified by GC-MS analysis of polar extracts (Table 4). These compounds were esters, carboxylic acids, aldehydes, benzene derivatives, phenolic compounds, aromatic compounds, and terpenes. The FDE-Root had the most diverse chemical composition with 32 compounds, of which eight were unique, while the leaf extract was the least diverse with 21 compounds, of which four were unique, and only eight compounds are shared among all five FDEs (Figure 2).
The ethyl gallate and 1,2,3-Benzenetriol, also known as pyrogallol, are the most abundant compounds in the leaf, stem, flower, and bicolour extracts, while in the root, tridecanoic acid and 2,3-dihydro-3,5-dihydroxy-6-methyl-4H-pyran-4-one are the most abundant. This difference in chemical composition could be related to the nature of the samples, since the root is the underground part, while the leaf, stem, and flower are the aerial part of the plant.

2.7. Kupchan Partitioning of FDE-Flower and FDE-Leaf

The GC-MS analysis of the FDEs yielded important information about their chemical composition. However, the number of identified compounds was relatively high, and the data obtained in the antimicrobial activity assay showed that this effect was observed at high concentrations, suggesting that the compound(s) associated with this activity were diluted in the samples. In order to define these compounds, the fractionation of the FDEs was carried out using solvents with different polarities. In this case, we decided to work exclusively with the flower and leaf samples because, in the antioxidant and antimicrobial activity experiments, both FDEs presented the highest activity in both analyses. Likewise, the FDE-flower and FDE-bicolour were worked together since the GC-MS data showed that both shared 85% of the compounds. Four solvents were used: hexane (Hx), chloroform (Chl), ethyl acetate (EtOAc), and methanol (MeOH), using a Kupchan partition sequence.
The FDE-Flower and FDE-Leaf samples were subjected to solvent partitioning. The yield with the Hx fraction was practically null, so it will no longer be reported during this study. On the other hand, we obtained sufficient yields for our experiments with the FDE partitioned with Chl, EtOAc, and MeOH.

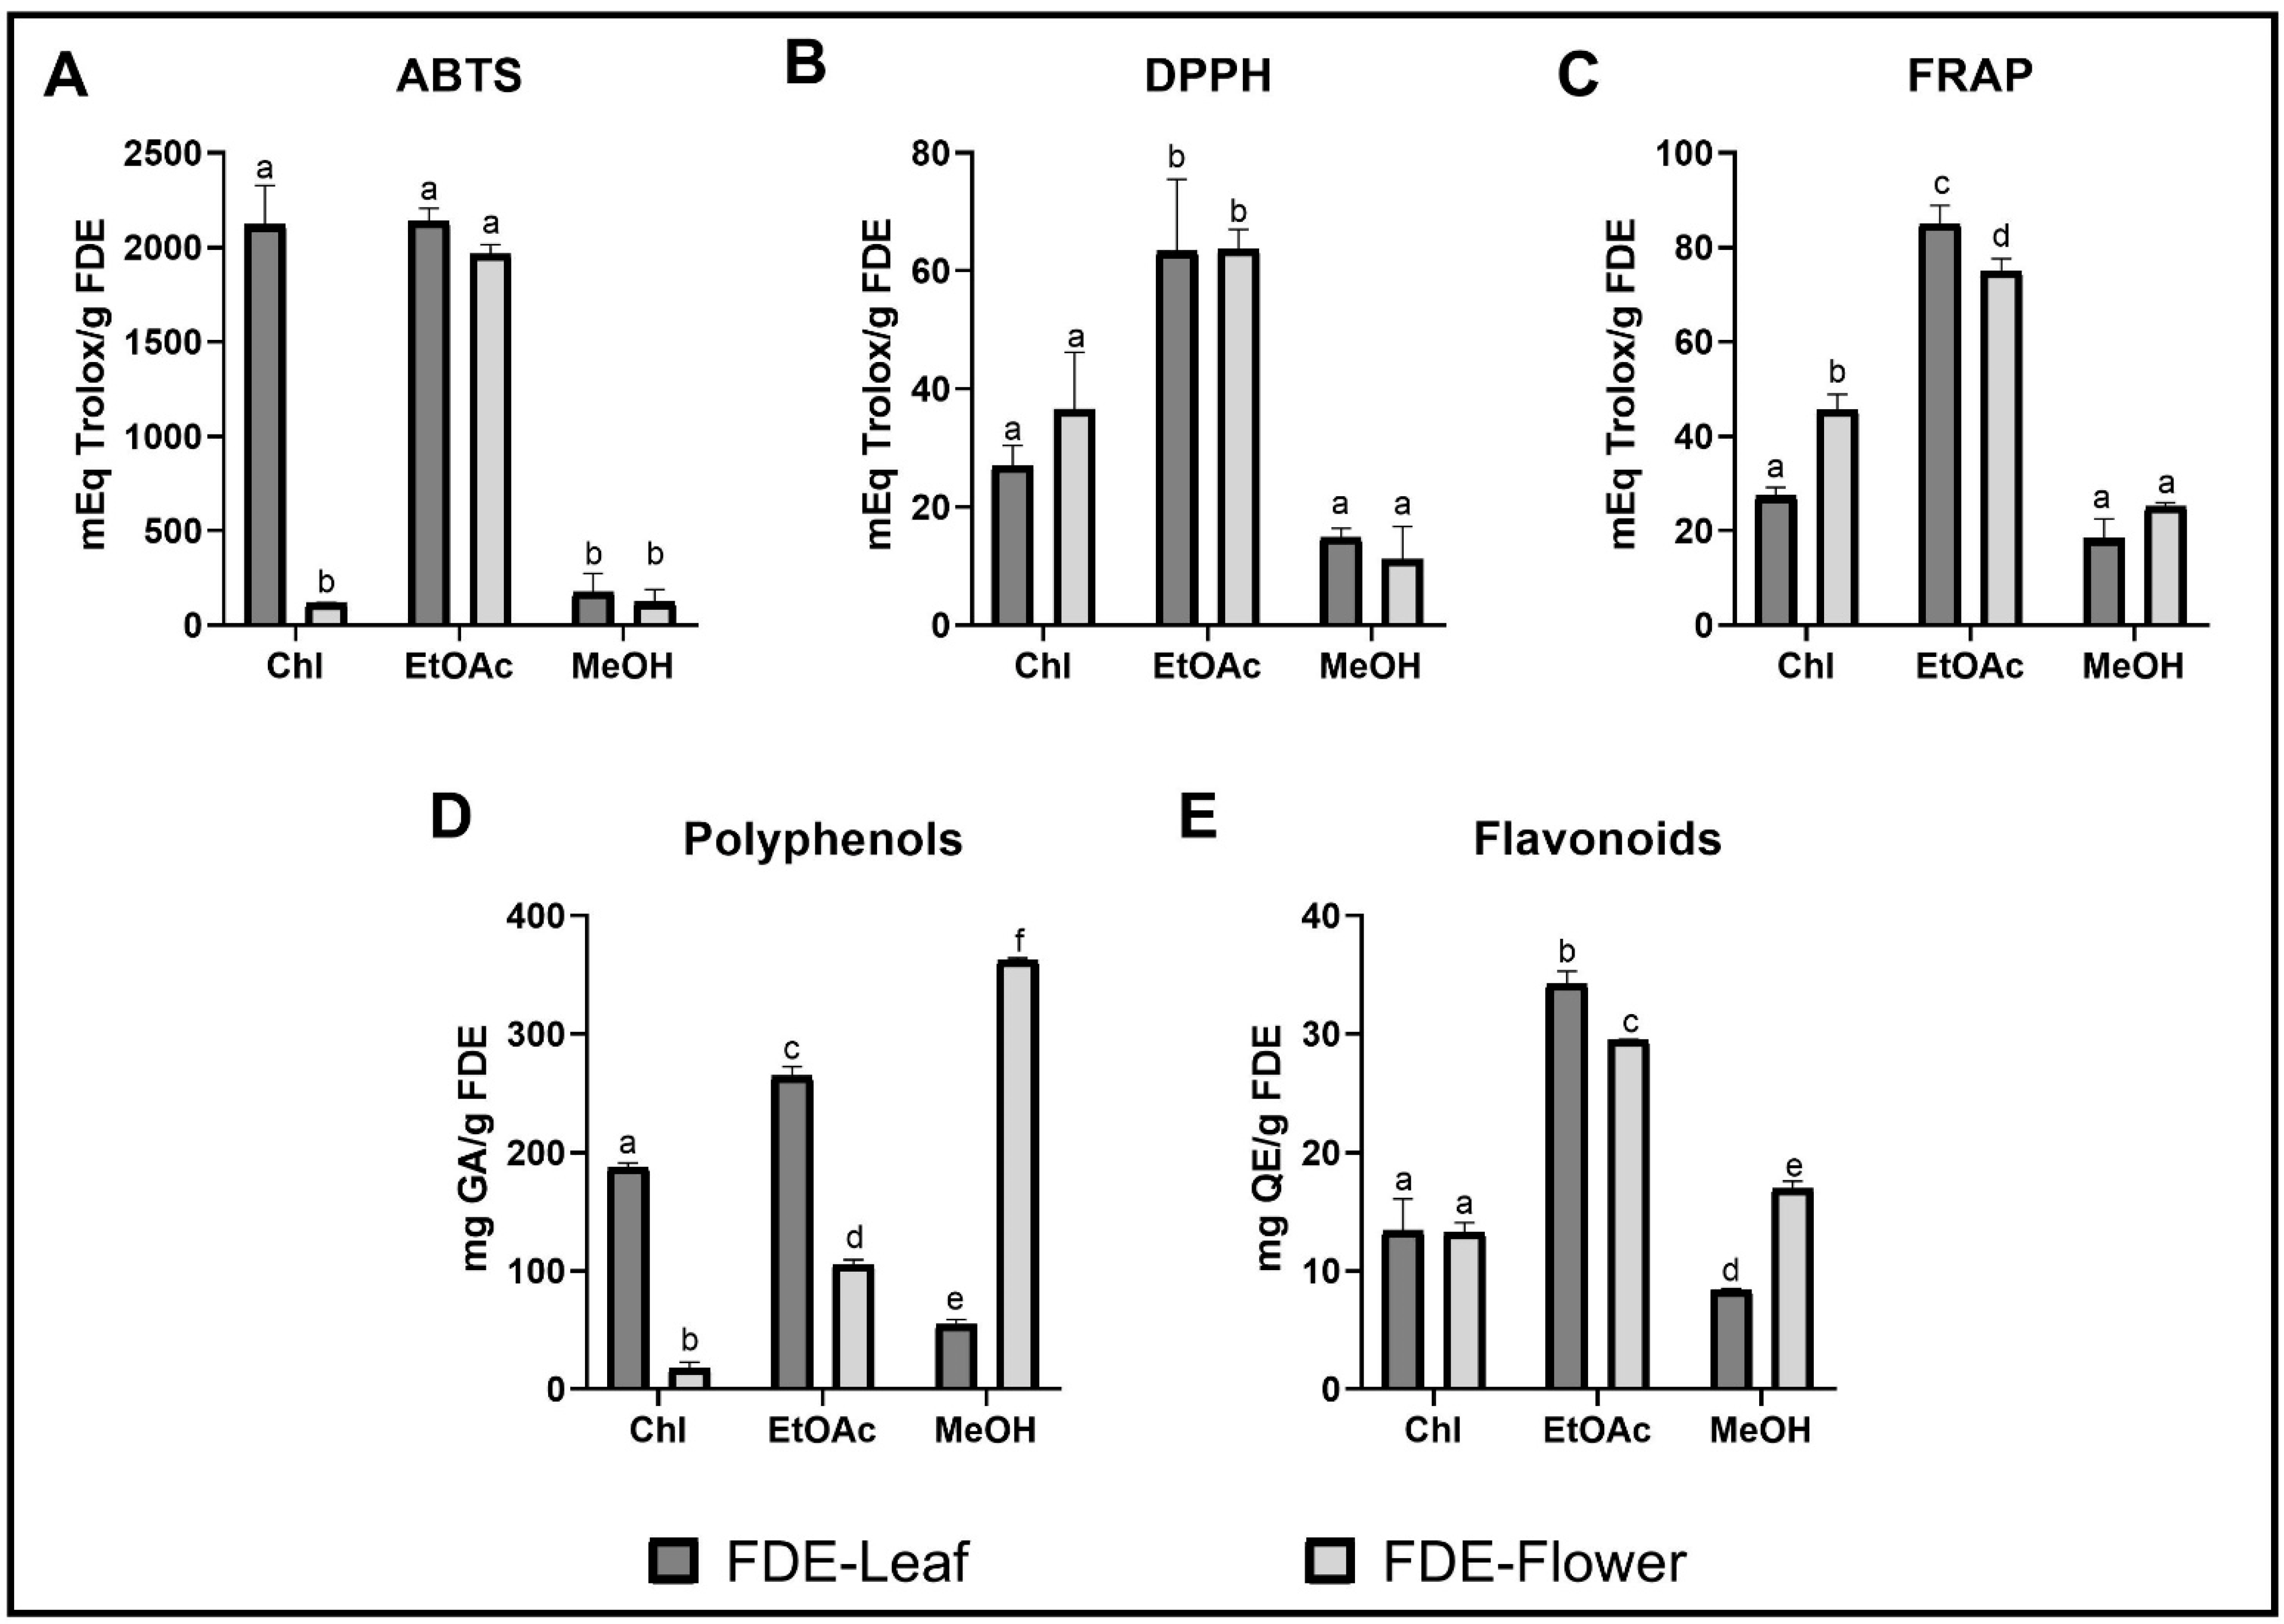
2.8. Antioxidant Activity of FDE-Flower and FDE-Leaf Partitioned Extracts

We analyzed the fractions extracted with the solvents using the three aforementioned antioxidant capacity measurement techniques. In all three methods used, the fractions with the highest antioxidant activity were those of FDE-Leaf and FDE-Flower partitioned with EtOAc (Lf-EtOAc and Fwr-EtOAc, respectively). The antioxidant activity values obtained with ABTS for the fractions Lf-EtOAc and Fwr-EtOAc had the highest Trolox equivalents per gram of lyophilisate extract (mEq Trolox/g FDE) being 2136.90 ± 68.79 and 1964.63 ± 48.41 mEq Trolox/g FDE. On the other hand, the fractions obtained by chloroform extraction for FDE-Leaf (Lf-Chl) and FDE-Flower (Fwr-Chl) showed significant differences in their antioxidant activity measured by ABTS. The activity of Lf-Chl was comparable to that of Lf-EtOAc and Fwr-EtOAc with a value of 2118.20 ± 209.55 mEq Trolox/g FDE.
Fwr-Chl had low activity compared to Lf-Chl (118.28 ± 1.22 mEq Trolox/g FDE). The fractions partitioned with MeOH, FDE-Leaf (Lf-MeOH), and FDE-Flower (Fwr-MeOH) did not present significant differences and had relatively low values concerning the EtOAc fractions, being 175.10 ± 19.77 and 121.27 ± 27.15 mEq Trolox/g FDE, for Lf-MeOH and Fwr-MeOH, respectively.
Regarding the other antioxidant capacity measurement methodologies, the trend indicated that for both methodologies (DPPH and FRAP), the fractions with the highest antioxidant activity were Lf-EtOAc and Fwr-EtOAc. The graphs of the reported antioxidant activities can be seen in Figure 3A–C. We decided to evaluate also the content of total phenols and flavonoids in these fractions. Interestingly, total polyphenols (Figure 3D), presented the highest values in the fractions Lf-EtOAc, Lf-Chl, and Fwr-MeOH, with 264.57 ± 7.73, 187.46 ± 3.86, and 362.33 ± 12.07 mg G.A./g FDE. Likewise, flavonoid content (Figure 3E) was quantified. On this occasion, Lf-EtOAc and Fw-EtOAc fractions had the highest concentration with 34.4 ± 1.06 and 29.45 ± 1.09 mg Q.E./g FDE. Tannins were not detectable in the measurements performed for all fractions. These results indicated that the Lf-EtOAc and Fwr-EtOAc fractions had the best profiles of antioxidant capacity, polyphenol, and flavonoid content.

2.9. M.I.C. of Lf-EtOAc and Fwr-EtOAc Fractions against Pathogenic Bacteria

Once the fractions antioxidant activities and phytochemical content were verified, we decided to evaluate the minimum inhibitory concentration (M.I.C.) against the pathogenic bacteria evaluated in the experiment with the FDEs. However, this time, we took advantage of the decrease in the complexity of the compound mixtures achieved by solvent partitioning. Among the fractions evaluated, it was clear that Lf-EtOAc and Fwr-EtOAc were by far the ones with the best minimum inhibitory concentration, reaching 31.2 µg/mL for S. aureus and 62.5 µg/mL for S. enterica. While for E. faecalis strain, the Fwr-EtOAc fraction presented 31.2 µg/mL of M.I.C. In contrast, the Lf-EtOAc fraction was twice as high at 62.5 µg/mL. It should be noted that the antimicrobial effect against S. marcescens was greatly diminished since both EtOAc fractions presented a M.I.C. of 500 µg/mL. The rest of the fractions presented high M.I.C. values; therefore, they were considered ineffective for antimicrobial inhibition. The data are summarized in Table 5.

2.10. GC-MS Analysis and IC50 of Lf-EtOAC and Fwr-EtOAC Fractions

This time, nine compounds were identified in the leaf fraction and 12 compounds in the Lf-EtOAc fraction. The main compounds were 1,2,3-Benzenetriol (Pyrogallol), with 77.38% of relative abundance in the Lf-EtOAc’s fraction and 71.24% in the Fwr-EtOAc fraction, followed by ethyl gallate (13.10%) in the Fwr-EtOAc fraction and (Z)-9-Octadecenamide (13.63% and 6.75%) in both fractions, Lf-EtOAc, and Fwr-EtOAc, respectively (Table 6). Additionally, we calculated the IC50 values for the Lf-EtOAc and Fwr-EtOAc fractions. The IC50 obtained for the Lf-EtOAc by ABTS was 27.15 ± 1.04 and 33.66 ± 1.50 µg/mL with the DPPH technique. On the other hand, values of 28.11 ± 1.3 and 52.69 ± 1.6 µg/mL of IC50 were obtained for the Fw-EtOAc fraction by ABTS and DPPH technique, respectively.

3. Discussion

The extracts of root, stem, leaf, flower, and bicolour flower of Pelargonium peltatum were obtained by hydroalcoholic maceration at 70%, and the chromatographic profile was analyzed. The phytochemical profile with the highest complexity was FDE-flower, which has been mentioned in phytochemical studies of other species belonging to the Pelargonium genus. However, it is essential to emphasize that species belonging to the Pelargonium genus, such as P. sidoides, have a high demand because of their use as a constituent in the formulation of phytopharmaceuticals. Due to its exploitation and the unfavorable factors in its habitat, P. sidoides is experiencing a decrease in its natural population and a deterioration of its biological niche. Thus, this research on the phytochemical and antioxidant profile of P. peltatum contributes to producing information to offer an alternative in the future as a possible source of bioactive components [35].
Polyphenols are compounds whose basic structure is hydroxyl groups attached to a phenyl ring. One of its qualities is its antioxidant activity, and in this study, a high content was detected in the FDE-Flower and FDE-Leaf. In work by Mona M. and co-workers [36] showed high polyphenol content in the extract of P. sidoides, as did Malek Ennaifer in P. graveolens, [37] and Gökçe Şeker Karatoprak and co-workers [38] in P. endlicherianum, indicating that a high content of polyphenolic compounds is a characteristic in common between the different species of the genus Pelargonium. Polyphenols are highly relevant for their beneficial impact on health since they inhibit factors that can cause cardiovascular diseases (v.g. hydroxytyrosol, quercetin, and resveratrol), give protection against different types of cancer (v.g. apigenin, quercetin, curcumin, resveratrol, EGCG, and kaempferol), and help inhibit inflammatory processes in chronic degenerative diseases (e.g., apigenin, epigallocatechin gallate, ellagic acid, and rutin) that have a high incidence in the world population [39,40]. The profiles obtained by GC/MS found that one of the major components of the polyphenols is pyrogallol, among others such as catechol, eugenol, vanillic acid, methyl, and ethyl gallate.
The antioxidant activities for the FDEs presented values of low antioxidant activity measured by IC50, except for those reported for FDE-Flower and FDE-Leaf, whose values ranged between (46.32–48.90 µg/mL for ABTS and 132.50–103.90 µg/mL for DPPH). IC50 values for extracts and essential oils of P. graveolens have been reported in the literature ranging from 711–1280 μg/mL for oils and 12.24–44.24 μg/mL for extracts measured by DPPH [21]. This places our results below the values obtained for oils and above those obtained for extracts. In comparison with other species, the IC50 values reported for Nepeta melissifolia (IC50 = 13.5 ± 0.4 μg/mL) [41] and Mentha pulegium (IC50 = 69.60 ± 1.72 μg/mL) [42] were in comparison to our measurements by DPPH much higher in their IC50. On the other hand, once the extracts were fractionated, the Lf-EtOAc and Fwr-EtOAc produced IC50 values ranging from 27.15–33.66 µg/mL for ABTS and 28.11–52.69 µg/mL for DPPH. Those values are closer to those reported in extracts of other plants with broad antioxidant power [43,44] and even relatively close to references in antioxidants of pure compounds such as BHT (18.5 ± 0.4 ug/mL) [45] but still distant from classical antioxidants such as ascorbic acid (3.9 ± 0.3 μg/mL) [46].
At least two antimicrobial compounds were detected in the Lf-EtOAc and Fwr-EtOAc fractions in the GC-MS analysis, the first one is pyrogallol (1,2,3-trihydroxybenzene) which has been reported several times as an antimicrobial and antioxidant compound. In the work reported by [47], they demonstrate that a dimer of this compound can produce a MIC value for Staphylococcus aureus and Escherichia coli of (8 μg/mL) and in its non-polymerized form of 512 and 256 μg/mL, respectively. This study was performed with a pure compound, while in our analysis a MIC value of 31.2 μg/mL was found in the analyzed fractions of EtOAc against S. aureus and of the Fwr-EtOAc fraction against E. faecalis. In fact, pyrogallol is classified as an allelochemical [48,49] and other polyphenolic compounds in conjunction with pyrogallol have been evaluated to potentiate the effect of known antibiotics [50]. It is important to mention, that there are new studies regarding the possibilities of the use of pyrogallol, in material sciences, and due to the complexity of its synthesis, extractions from the plant kingdom are still a suitable option for its isolation [51]. The other compound found in our study from acetate fractions is ethyl gallate. This compound has been reported with a MIC of 0.24 and 0.48 mg/mL in extracts of R. crenulata, against E. coli and S. aureus strains. Although these MIC concentrations are very high compared to the highest MIC values obtained in this study for acetate fractions (500 ug/mL), other reports have indicated the potential of its antioxidant and antimicrobial activity [52,53,54,55,56,57].
Interestingly, our analysis showed the presence of (Z)-9-Octadecenamide, in the acetate fractions, this compound has been known by the common name oleamide and has neurological activities, in fact, it is a lipid-like molecule that induces sleep [58], but it also has activities that regulate memory processes and antinociception [59]. Other reports have associated it with an algaecidal and fungicidal agent [60].
Finally, in the food industry, many molecules of synthetic origin, such as BHT and its derivatives, are used to improve processed foods’ quality and shelf life; however, these types of molecules can have adverse effects, leading to the development of tumor tissues [61]. That is why it is crucial to identify naturally occurring molecules with antioxidant activity. In this work, we detected 53 different compounds by GC/MS in the five FDE extracts, including furan derivatives, furfurans, polyphenols, fatty acids, and various esters of gallic acid. Interestingly, the fractions obtained by partitioning with ethyl acetate in flower and leaf reported excellent antimicrobial and antioxidant activities. Overall, the results obtained in this research suggest that P. peltatum is an excellent option for further studies, elucidating the compounds involved in the significant antioxidant capacity values and the promising potential of antimicrobial activities.

4. Materials and Methods

4.1. Reagents

All chemicals used were of analytical grade and were used as received without any further purification. All solutions were prepared with deionized water.

4.2. Preparation of Extracts

4.2.1. Harvesting and Identification of P. peltatum

Plant material was obtained from various nurseries in the city of Guadalajara Jalisco between February and June 2020, one of the specimens was used for taxonomic identification by Dr. Liberato Portillo of the Centro Universitario de Ciencias Biológicas y Agropecuarias (CUCBA) of the University of Guadalajara and stored in the IBUG (Herbarium Luz María Villareal de Puga) generating the ID: SIST-TRA-2020-2.

4.2.2. Cleaning and Drying of Collected Material

Plants were separated by their root, stem, leaf, and flower sections (in the case of flowers, they were subdivided into flowers of a single color and bicolored flowers), and then the general dirt was removed with potable water and rinsed with injectable water. The plant material was dried at room temperature in the absence of light, and the help of printing paper was changed every 24 h to avoid the accumulation of humidity.

4.2.3. Extracts Preparation

The dried plant material of root (158 g), stem (290 g), leaf (200 g), flower (150), and bicolor (144 g) was deposited in amber flasks, and 2 L of 70% ethanol was added to each sample. These flasks were kept under agitation for 15 days. Subsequently, the extracts obtained were filtered through Whatman’s paper three times. On each occasion, the filter was exchanged to remove the separated solids.

4.2.4. Concentration and Lyophilization of Extracts

The extracts were concentrated by rotary evaporation to obtain the aqueous phase in a Buchi R-200 equipment. The concentrated extracts were then placed in freeze-drying bottles, and with the help of acetone and CO2, the samples were frozen and immediately placed in a LABCONCO freeze-dryer for 24 h at −51 °C with a pressure of 0.090 mbar, protected from light. Once lyophilization was completed, the extracts were aliquoted in a laminar flow hood and stored under refrigeration at 4 °C until use.

4.3. Solubility Test

Next, 1 mg of the lyophilized material of the five hydroalcoholic extracts of P. peltatum were deposited in test tubes, and subsequently, the solubility was evaluated by adding 1 mL of different solvents (polar and non-polar). The results were expressed with the legend: (−) not soluble, (+) soluble (++), and very soluble.

4.4. Phytochemical Profiling by High-Performance Thin Layer Chromatography

The lyophilizates of each tissue were resuspended with distilled water to a concentration of 10 mg/mL. Then, 15 µL of these solutions were deposited in bands with a length of 8 mm each with a Camag syringe of 100 µL on aluminum support plates coated with silica gel 60F254 (20 × 10 cm) by an autosampler Camag Linomat 5.
The plates were then placed in a glass chamber previously saturated (30 min) with the mobile phase: water–methanol–ethyl acetate (10:14:76 v:v, respectively) [23]. Once the plates were dried, they were visualized in a U.V. chamber at two wavelengths of 254 and 366 nm. Additionally, T.L.C. plates were developed with specific solutions for each group of compounds: ferric chloride solution for tannin determination, trichloroacetic acid solution for glycosides, Dragendorff’s reaction for alkaloids, and aluminum chloride solution for flavonoids.
The retention factor was calculated using the following equation:
R f = D i s t a n c e   t h e   b a n d D i s t a n c e   o f   t h e   s o l v e n t

4.5. Antioxidant Activity

The antioxidant activity of the hydroalcoholic extract of P. peltatum was determined by DPPH, ABTS, and FRAP techniques and dilutions of the freeze-dried extracts of P. peltatum were prepared from 13 to 1000 µg/mL. These samples were used for antioxidant and phytochemical determinations. The half-maximal inhibitory concentration (IC50) was calculated with the statistical program Graph pad version 9 with simple ANOVA analysis.

4.5.1. 2,2-diphenyl-1-picrylhydrazyl Hydroxyl Radical (DPPH) Activity

The DPPH radical scavenging assay was carried out according to the methodology of Brand–Williams [62] with minor modifications. Briefly, the working solution of DPPH was prepared at 0.04% (w/v) in methanol and protected from light. In a microplate, 20 µL of the sample and 280 µL of the working solution were added in triplicate. The mixtures were incubated for 30 min at room temperature under the dark, and the absorbance was measured at 515 nm. Trolox was used as a standard with a curve between 0 and 1280 µg/mL. The results were expressed as percentage inhibition using the following equation:
I % = 1 A B c o n t r o l A B s a m p l e A B c o n t r o l 100

4.5.2. 2,2′-azino-bis-(3-ethylbenzothiazolin-6-sulfonic acid) (ABTS) Radical Scavenging Activity

The ABTS radical scavenging assay was performed by the technique reported by Li et al. [63] with minor modifications. A stock solution of 7 mM ABTS was prepared with 4 mM ammonium persulfate (P.S.A.) in distilled water. The solution was kept at 4 °C for 12 h to allow radical formation. The working solution was then prepared by adjusting the optical density to 0.7 ± 0.02 units at 750 nm. In a microplate, 280 µL of the working solution was placed in triplicate with 20 µL of each sample. The reaction was monitored at 750 nm for 30 min. Trolox was used as a standard with a curve between 0 and 400 µg/mL. The results were expressed as mg Trolox equivalents per g of dry extract. When indicated IC50 was determined.

4.5.3. Ferric Ion Reducing Activity (FRAP)

The ferric reducing antioxidant power was evaluated by the method described by Benzie et al. [64]. A working reagent was prepared by mixing: 2.5 mL of 2,4,6-Tris(2-pyridyl)-s-triazine (TPTZ) at 10 mM, 2.5 mL of Ferric chloride (FeCl3) at 20 mM, and 25 mL of 0.1 M acetate buffer at pH 3.7. The reaction was carried out in a microplate by placing 40 µL of the sample, followed by 40 µL of acetate buffer pH 4.7 with 150 µL of working reagent. Readings were taken at 595 nm after 30 min, and each sample was analyzed by triplicate. Trolox was used as a standard with a curve between 0 and 400 µg/mL. The results were expressed as mg of Trolox equivalents per g of dry extract.

4.5.4. Total Polyphenol Content

Total polyphenol content was determined spectrophotometrically, using Folin–Ciocalteu reagent and gallic acid as standard, following the procedure reported by Singleton [65]. To 125 µL of each sample, 750 µL of distilled water and 62.5 µL of Folin–Ciocalteu reagent were added; after 5 min of incubation in the dark, 250 µL of distilled water and 187.5 µL of 20% (w/v) Na2CO3 were added, and the mixture was incubated for 2 h in the dark. After that time, 200 µL of each reaction was placed in triplicate in microplates, and absorbance was measured at 750 nm. The calibration curve was made in the range 0 to 100 µg/mL of gallic acid. The results were expressed as mg of gallic acid equivalents per g of dry extract.

4.5.5. Total Tannin Content

The quantification of tannins was determined by the Broadhurst and Jones method [66]. A 4% vanillin solution in methanol (4 g/100 mL) was prepared. Then in an Eppendorf tube, 1 mL of the vanillin solution, 133 µL of extract, and 500 µL of concentrated hydrochloric acid were added. Solutions were mixed and incubated for 15 min and then 200 µL of the solution was dispensed by triplicate in a 96-well plate. Readings were taken at 500 nm of absorbance. A curve of catechin was made from 0 to 100 µg/mL. The results were expressed as mg of catechin equivalents per g of dry extract.

4.5.6. Total Flavonoid Content

The determination was performed by the aluminum trichloride (AlCl3) method, as reported by Zhishen et al. [67]. To 125 µL of each extract, 500 µL of distilled water, and 37.5 µL of 5% (w/v) sodium nitrite (NaNO2) was added and incubated at room temperature for 5 min. After this time, 37.5 µL of 10% (w/v) AlCl3 was added and incubated for 6 min. Finally, 300 µL of distilled water and 250 µL of 1 M sodium hydroxide (NaOH) were added. After 15 min, the mixture was homogenized, and 200 µL were transferred in triplicate to a microplate. Finally, the absorbance at 510 nm was determined. A quercetin standard curve was used in a range of concentrations between 0 and 1000 µg/mL. The results were expressed as µg quercetin equivalents per g of dry extract.

4.6. Antimicrobial Activity

Gram-negative (Salmonella enterica/Serratia marcescens) and Gram-positive (Enterococcus faecalis/Staphylococcus aureus) bacterial strains were used for the antimicrobial assays. Then, 5 mL of inoculum of each bacterial strain grown on Tripticasein Broth (T.S.B.) medium were placed at 37 °C in an incubator until reaching an optical density at 600 nm of 0.5 ± 0.02 units. Subsequently, 200 µL of these cultures were inoculated into 25 mL of molten T.S.B. agar. This agar was placed in Petri dishes and kept at room temperature until completely solidified. Each plate had 0.8 cm diameter wells, and each well was filled with 50 µL of each sample at a concentration of 5 mg/mL. As a positive control, 50 µL of kanamycin at 35 µg/mL was placed in the center. The plates were kept at 4 °C for 16 h to allow diffusion of the samples in agar. Subsequently, the plates were incubated at 37 °C for 36 h, and the inhibition halo was observed.

4.7. Gas Chromatography—Mass Spectrometry Analysis

The analysis of volatile and semi-volatile compounds of P. peltatum extracts was carried out with an Agilent 7890B gas chromatograph (G.C.), coupled with an Agilent 5977A mass selective detector (M.S.D.) (Agilent Technologies, Inc., Santa Clara, CA, USA), which used helium as the carrier gas with a flow of 1 mL/min. Then 20 mg of the samples were weighed and dissolved in 1 mL of HPLC-grade methanol, then filtered with a 45 μm PTFE microfilter, and 1 μL was injected into the G.C. inlet at 240 °C in splitless mode. The compounds were separated on a HP-5ms Ultra Inert capillary column (30 m × 250 μm × 0.25 μm), using the following G.C. oven temperature program: 3 min at 40 °C up to 280 °C during 2 min at 10 °C/min. The MS used electron ionization energy of 70 eV, scanning range of 30–550 uma, scan rate of 13.8 spectra/s, solvent delay of 3 min, ionization chamber temperature of 200 °C, and transfer line temperature of 250 °C. Data were processed with MassHunter Workstation software (Agilent Technologies, Inc., Santa Clara, CA, USA). Compounds were identified based on their mass spectra fragmentation patterns with the spectral database of the National Institute of Standards and Technology (NIST) and by comparing their Kovats indices (K.I.), calculated in relation to the retention times of a series of alkanes (C7–C40) using the calculator described by [68]. The relative quantities of each compound were expressed as the area percentage.

4.8. Kupchan Partitioning and Fractionation

The fractionation of the FDE-Leaf and Flower was performed by Emran et al.’s method [69] with minor modifications, 5 g of each extract were resuspended in 200 mL of ethanol 70%, then the solution was divided into four parts with 200 mL of different organic solvents varying its polarity (hexane, chloroform, ethyl acetate, and methanol). These new solutions were put under agitation for 10 min, and poured into a decantation funnel for the separation of their phases. Each found fraction was concentrated by the use of a rotary evaporator (Buchi-R200 Alemania) to remove the solvents. Once the fractions were concentrated, they were taken into a LABCONCO freeze-dryer for 24 h at −51 °C with a pressure of 0.090 mbar, and stored at 4 °C until further use.

4.9. Minimum Inhibitory Concentration

The minimum inhibitory concentration (MIC) was determined with a 96-well plate microdilution method based on resazurin (Elshikh et al., 2016). In a 96-well plate, 300 µL of the sample were placed by triplicate at 1 mg/mL dissolved in LB medium with DMSO at 2% (v/v), from this sample serial dilutions were made with 150 µL of the previous concentration and 150 µL of fresh medium until reaching a final concentration of 15.62 µg/mL. Subsequently, 15 µL of culture at 1 × 10⁶ CFU/mL of the aforementioned bacteria was added. The mix was incubated at 37 °C for 18 h. After this period, 30 µL of resazurin 0.015% was added to each well, and the plates were incubated for 1 h at 37 °C. The MIC was the lower concentration with no color change of resazurin, at the lowest concentration in which the color change of resazurin did not occur.

4.10. Statistical Analysis

One-way analysis of variance (ANOVA) was employed for analyzing the data and the mean difference between given treatments was intended for significance test at p > 0.05 level by Tukey’s HSD. The software GraphPad Prism 9 was used to statistical analysis.

Supplementary Materials

The following supporting information can be downloaded at: https://www.mdpi.com/article/10.3390/molecules27113436/s1, Figure S1: Thin layer chromatography of different freeze-dried extracts from P. peltatum; Figure S2: Evaluation of the antimicrobial activity of P. peltatum FDE against; Figure S3: Evaluation of the antimicrobial activity of FDE-flowers and FDE-Leaf fractions; Table S1: Solubility of P. peltatum freeze-dried extracts; Table S2: Inhibition zone growth (mm) of FDEs against different strains.

Author Contributions

Conceptualization, G.V.-J.; methodology, A.-M.A.; formal analysis, O.K.R.-M.; investigation, S.F.V.-R.; resources, A.M.P.-P.; data curation, V.Z.-M.; writing—original draft preparation, M.P.G.A. and J.-I.D.-S.; gas—chromatography analysis, R.E.S.-F.; writing—review and editing, G.V.-J. All authors have read and agreed to the published version of the manuscript.

Funding

This research received no external funding.

Institutional Review Board Statement

Not applicable.

Informed Consent Statement

Not applicable.

Data Availability Statement

Not applicable.

Acknowledgments

Alan-Misael is a student in Biothechnologic processes from University of Guadalajara and received a PhD scholarship numbered 971678 from CONACyT. We wish to express our deepest gratitude to Mario Iván Alemán-Duarte for helping with the design and creation of the graphical abstract.

Conflicts of Interest

The authors declare no conflict of interest.

References

  1. Kliebenstein, D.J.; Osbourn, A. Making New Molecules—Evolution of Pathways for Novel Metabolites in Plants. Curr. Opin. Plant Biol. 2012, 15, 415–423. [Google Scholar] [CrossRef] [PubMed]
  2. Isah, T. Stress and Defense Responses in Plant Secondary Metabolites Production. Biol. Res. 2019, 52, 39. [Google Scholar] [CrossRef] [PubMed] [Green Version]
  3. Rai, A.; Saito, K.; Yamazaki, M. Integrated Omics Analysis of Specialized Metabolism in Medicinal Plants. Plant J. 2017, 90, 764–787. [Google Scholar] [CrossRef] [PubMed]
  4. Erb, M.; Kliebenstein, D.J. Plant Secondary Metabolites as Defenses, Regulators, and Primary Metabolites: The Blurred Functional Trichotomy. Plant Physiol. 2020, 184, 39–52. [Google Scholar] [CrossRef]
  5. Platzer, M.; Kiese, S.; Herfellner, T.; Schweiggert-Weisz, U.; Miesbauer, O.; Eisner, P. Common Trends and Differences in Antioxidant Activity Analysis of Phenolic Substances Using Single Electron Transfer Based Assays. Molecules 2021, 26, 1244. [Google Scholar] [CrossRef]
  6. Durazzo, A.; Lucarini, M.; Souto, E.B.; Cicala, C.; Caiazzo, E.; Izzo, A.A.; Novellino, E.; Santini, A. Polyphenols: A Concise Overview on the Chemistry, Occurrence, and Human Health. Phyther. Res. 2019, 33, 2221–2243. [Google Scholar] [CrossRef] [Green Version]
  7. Gutiérrez-del-Río, I.; Fernández, J.; Lombó, F. Plant Nutraceuticals as Antimicrobial Agents in Food Preservation: Terpenoids, Polyphenols and Thiols. Int. J. Antimicrob. Agents 2018, 52, 309–315. [Google Scholar] [CrossRef]
  8. Mierziak, J.; Kostyn, K.; Kulma, A. Flavonoids as Important Molecules of Plant Interactions with the Environment. Molecules 2014, 19, 16240–16265. [Google Scholar] [CrossRef]
  9. Pizzi, A. Tannins: Prospectives and Actual Industrial Applications. Biomolecules 2019, 9, 344. [Google Scholar] [CrossRef] [Green Version]
  10. Flieger, J.; Flieger, W.; Baj, J.; Maciejewski, R. Antioxidants: Classification, Natural Sources, Activity/Capacity Measurements, and Usefulness for the Synthesis of Nanoparticles. Materials 2021, 14, 4135. [Google Scholar] [CrossRef]
  11. Du, L.; Liu, W. Occurrence, Fate, and Ecotoxicity of Antibiotics in Agro-Ecosystems. A Review. Agron. Sustain. Dev. 2012, 32, 309–327. [Google Scholar] [CrossRef] [Green Version]
  12. Ara, I.; Shinwari, M.M.A.; Rashed, S.A.; Bakir, M.A. Evaluation of Antimicrobial Properties of Two Different Extracts of Juglans Regia Tree Bark and Search for Their Compounds Using Gas Chromatohraphy-Mass Spectrum. Int. J. Biol. 2013, 5, 92–102. [Google Scholar] [CrossRef] [Green Version]
  13. Maree, J.; Kamatou, G.; Gibbons, S.; Viljoen, A.; Van Vuuren, S. The Application of GC-MS Combined with Chemometrics for the Identification of Antimicrobial Compounds from Selected Commercial Essential Oils. Chemom. Intell. Lab. Syst. 2014, 130, 172–181. [Google Scholar] [CrossRef]
  14. Valle, D.L.; Puzon, J.J.M.; Cabrera, E.C.; Rivera, W.L. Thin Layer Chromatography-Bioautography and Gas Chromatography-Mass Spectrometry of Antimicrobial Leaf Extracts from Philippine Piper Betle L. against Multidrug-Resistant Bacteria. Evidence-Based Complement. Altern. Med. 2016, 4976791, 4976791. [Google Scholar] [CrossRef] [Green Version]
  15. Wagner, K.; Roth, C.; Willför, S.; Musso, M.; Petutschnigg, A.; Oostingh, G.J.; Sclmabel, T. Identification of Antimicrobial Compounds in Different Hydrophilic Larch Bark Extracts. BioResources 2019, 14, 5807–5815. [Google Scholar] [CrossRef]
  16. Safdar, M.; Naqvi, S.A.; Anjum, F.; Pasha, I.; Shahid, M.; Waliullah; Jaskani, M.J.; Khan, I.A.; Aadil, R.M. Microbial Biofilm Inhibition, Antioxidants, and Chemical Fingerprints of Afghani Pomegranate Peel Extract Documented by Gas Chromatography–Mass Spectrometry and Fourier Transformation Infrared. J. Food Process. Preserv. 2021, 45, e15657. [Google Scholar] [CrossRef]
  17. Park, Y.J.; Baskar, T.B.; Yeo, S.K.; Arasu, M.V.; Al-Dhabi, N.A.; Lim, S.S.; Park, S.U. Composition of Volatile Compounds and in Vitro Antimicrobial Activity of Nine Mentha Spp. Springerplus 2016, 5, 1628. [Google Scholar] [CrossRef] [Green Version]
  18. Taherpour§, A.; Maroofi, H.; Kheradmand, K. Chemical Composition of the Essential Oil of Pelargonium Quercetorum Agnew. of Iran. Nat. Prod. Res. 2007, 21, 24–27. [Google Scholar] [CrossRef]
  19. Al-Nemari, R.; Al-Senaidy, A.; Semlali, A.; Ismael, M.; Badjah-Hadj-Ahmed, A.Y.; Ben Bacha, A. GC-MS Profiling and Assessment of Antioxidant, Antibacterial, and Anticancer Properties of Extracts of Annona Squamosa L. Leaves. BMC Complement. Med. Ther. 2020, 20, 296. [Google Scholar] [CrossRef]
  20. Viet, T.D.; Xuan, T.D.; Van, T.M.; Andriana, Y.; Rayee, R.; Tran, H.-D. Comprehensive Fractionation of Antioxidants and GC-MS and ESI-MS Fingerprints of Celastrus Hindsii Leaves. Medicines 2019, 6, 64. [Google Scholar] [CrossRef] [Green Version]
  21. Ben ElHadj Ali, I.; Tajini, F.; Boulila, A.; Jebri, M.A.; Boussaid, M.; Messaoud, C.; Sebaï, H. Bioactive Compounds from Tunisian Pelargonium Graveolens (L’Hér.) Essential Oils and Extracts: α-Amylase and Acethylcholinesterase Inhibitory and Antioxidant, Antibacterial and Phytotoxic Activities. Ind. Crops Prod. 2020, 158, 112951. [Google Scholar] [CrossRef]
  22. Guerrini, A.; Rossi, D.; Paganetto, G.; Tognolini, M.; Muzzoli, M.; Romagnoli, C.; Antognoni, F.; Vertuani, S.; Medici, A.; Bruni, A.; et al. Chemical Characterization (GC/MS and NMR Fingerprinting) and Bioactivities of South-African Pelargonium Capitatum (L.) L’ Her. (Geraniaceae) Essential Oil. Chem. Biodivers. 2011, 8, 624–642. [Google Scholar] [CrossRef]
  23. Maree, J.E.; Viljoen, A.M. Phytochemical Distinction between Pelargonium Sidoides and Pelargonium Reniforme—A Quality Control Perspective. S. Afr. J. Bot. 2012, 82, 83–91. [Google Scholar] [CrossRef] [Green Version]
  24. Theisen, L.L.; Gohrbandt, S.; Muller, C.P.; Luetteke, N. EPs® 7630 (Umckaloabo®), an Extract from Pelargonium Sidoides Roots, Exerts Anti-Influenza Virus Activity in Vitro and in Vivo. Int. J. Infect. Dis. 2012, 16, e95. [Google Scholar] [CrossRef] [Green Version]
  25. Kayser, O.; Kolodziej, H. Antibacterial Activity of Extracts and Constituents of Pelargonium Sidoides and Pelargonium Reniforme. Planta Med. 1997, 63, 508–510. [Google Scholar] [CrossRef]
  26. Lewu, F.B.; Grierson, D.S.; Afolayan, A.J. Extracts from Pelargonium Sidoides Inhibit the Growth of Bacteria and Fungi. Pharm. Biol. 2006, 44, 279–282. [Google Scholar] [CrossRef]
  27. Papies, J.; Emanuel, J.; Heinemann, N.; Kulić, Ž.; Schroeder, S.; Tenner, B.; Lehner, M.D.; Seifert, G.; Müller, M.A. Antiviral and Immunomodulatory Effects of Pelargonium Sidoides DC. Root Extract EPs® 7630 in SARS-CoV-2-Infected Human Lung Cells. Front. Pharmacol. 2021, 12, 757666. [Google Scholar] [CrossRef]
  28. Pereira, A.; Bester, M.; Soundy, P.; Apostolides, Z. Anti-Proliferative Properties of Commercial Pelargonium Sidoides Tincture, with Cell-Cycle G0/G1 Arrest and Apoptosis in Jurkat Leukaemia Cells. Pharm. Biol. 2016, 54, 1831–1840. [Google Scholar] [CrossRef] [Green Version]
  29. Terlizzi, M.; Colarusso, C.; Di Maio, U.; Bagnulo, A.; Pinto, A.; Sorrentino, R. Antioxidant and Antimicrobial Properties of Pelargonium Sidoides DC and Lactoferrin Combination. Biosci. Rep. 2020, 40, BSR20203284. [Google Scholar] [CrossRef]
  30. Kolodziej, H.; Kayser, O.; Radtke, O.A.; Kiderlen, A.F.; Koch, E. Pharmacological Profile of Extracts of Pelargonium Sidoides and Their Constituents. Phytomedicine 2003, 10, 18–24. [Google Scholar] [CrossRef]
  31. Jeiter, J.; Hilger, H.H.; Smets, E.F.; Weigend, M. The Relationship between Nectaries and Floral Architecture: A Case Study in Geraniaceae and Hypseocharitaceae. Ann. Bot. 2017, 120, 791–803. [Google Scholar] [CrossRef] [PubMed]
  32. Bakker, F.T.; Culham, A.; Hettiarachi, P.; Touloumenidou, T.; Gibby, M. Phylogeny of Pelargonium (Geraniaceae) Based on DNA Sequences from Three Genomes. Taxon 2004, 53, 17. [Google Scholar] [CrossRef]
  33. Ullah, A.; Munir, S.; Badshah, S.L.; Khan, N.; Ghani, L.; Poulson, B.G.; Emwas, A.H.; Jaremko, M. Important Flavonoids and Their Role as a Therapeutic Agent. Molecules 2020, 25, 5243. [Google Scholar] [CrossRef] [PubMed]
  34. Ghannadi, A.; Bagherinejad, M.R.; Abedi, D.; Jalali, M.; Absalan, B.; Sadeghi, N. Antibacterial Activity and Composition of Essential Oils from Pelargonium Graveolens L’Her and Vitex Agnus-Castus L. Iran. J. Microbiol. 2012, 4, 171–176. [Google Scholar]
  35. Williams, V.L.; Victor, J.E.; Crouch, N.R. Red Listed Medicinal Plants of South Africa: Status, Trends, and Assessment Challenges. South African J. Bot. 2013, 86, 23–35. [Google Scholar] [CrossRef] [Green Version]
  36. Ibrahim, M.M.; El Ghani, S.A.; El-Moez, S.I.A. Phytochemical Analysis and Antimicrobial Activities of Different Callus Extracts of Pelargonium Sidoides DC. against Food Borne Pathogenic Bacteria. J. Appl. Pharm. Sci. 2018, 8, 109–118. [Google Scholar] [CrossRef] [Green Version]
  37. Ennaifer, M.; Bouzaiene, T.; Chouaibi, M.; Hamdi, M. Pelargonium Graveolens Aqueous Decoction: A New Water-Soluble Polysaccharide and Antioxidant-Rich Extract. Biomed Res. Int. 2018, 2018, 2691513. [Google Scholar] [CrossRef] [Green Version]
  38. Karatoprak, G.Ş.; Göger, F.; Yerer, M.B.; Koşar, M. Chemical Composition and Biological Investigation of Pelargonium Endlicherianum Root Extracts. Pharm. Biol. 2017, 55, 1608–1618. [Google Scholar] [CrossRef]
  39. Leri, M.; Scuto, M.; Ontario, M.L.; Calabrese, V.; Calabrese, E.J.; Bucciantini, M.; Stefani, M. Healthy Effects of Plant Polyphenols: Molecular Mechanisms. Int. J. Mol. Sci. 2020, 21, 1250. [Google Scholar] [CrossRef] [Green Version]
  40. Asuzu, P.C.; Besong, S.A.; Aryee, A.N. Polyphenols and Other Phytochemicals in Cancer Prevention and Management. FASEB J. 2019, 33, 802.43. [Google Scholar] [CrossRef]
  41. Proestos, C.; Varzakas, T. Aromatic Plants: Antioxidant Capacity and Polyphenol Characterisation. Foods 2017, 6, 28. [Google Scholar] [CrossRef] [Green Version]
  42. Abdelli, M.; Moghrani, H.; Aboun, A.; Maachi, R. Algerian Mentha Pulegium L. Leaves Essential Oil: Chemical Composition, Antimicrobial, Insecticidal and Antioxidant Activities. Ind. Crops Prod. 2016, 94, 197–205. [Google Scholar] [CrossRef]
  43. Xu, D.P.; Li, Y.; Meng, X.; Zhou, T.; Zhou, Y.; Zheng, J.; Zhang, J.J.; Li, H. Bin Natural Antioxidants in Foods and Medicinal Plants: Extraction, Assessment and Resources. Int. J. Mol. Sci. 2017, 18, 96. [Google Scholar] [CrossRef]
  44. Yong-Bing, X.; Gui-Lin, C.; Ming-Quan, G. Antioxidant and Anti-Inflammatory Activities of the Crude Extracts of Moringa Oleifera from Kenya and Their Correlations with Flavonoids. Antioxidants 2019, 8, 296. [Google Scholar] [CrossRef] [Green Version]
  45. Hsu, F.L.; Huang, W.J.; Wu, T.H.; Lee, M.H.; Chen, L.C.; Lu, H.J.; Hou, W.C.; Lin, M.H. Evaluation of Antioxidant and Free Radical Scavenging Capacities of Polyphenolics from Pods of Caesalpinia Pulcherrima. Int. J. Mol. Sci. 2012, 13, 6073–6088. [Google Scholar] [CrossRef]
  46. Okoh, S.O.; Asekun, O.T.; Familoni, O.B.; Afolayan, A.J. Antioxidant and Free Radical Scavenging Capacity of Seed and Shell Essential Oils Extracted from Abrus Precatorius (L). Antioxidants 2014, 3, 278–287. [Google Scholar] [CrossRef] [Green Version]
  47. Cynthia; Florence, I.; Hery, S.; Akhmad, D. Antibacterial and Antioxidant Activities of Pyrogallol and Synthetic Pyrogallol Dimer. Res. J. Chem. Environ. 2018, 22, 39–47. [Google Scholar]
  48. Kocaçalişkan, I.; Talan, I.; Terzi, I. Antimicrobial Activity of Catechol and Pyrogallol as Allelochemicals. Z. Naturforsch. Sect. C J. Biosci. 2006, 61, 639–642. [Google Scholar] [CrossRef]
  49. Shao, J.; Wu, Z.; Yu, G.; Peng, X.; Li, R. Allelopathic Mechanism of Pyrogallol to Microcystis Aeruginosa PCC7806 (Cyanobacteria): From Views of Gene Expression and Antioxidant System. Chemosphere 2009, 75, 924–928. [Google Scholar] [CrossRef]
  50. Lima, V.N.; Oliveira-Tintino, C.D.M.; Santos, E.S.; Morais, L.P.; Tintino, S.R.; Freitas, T.S.; Geraldo, Y.S.; Pereira, R.L.S.; Cruz, R.P.; Menezes, I.R.A.; et al. Antimicrobial and Enhancement of the Antibiotic Activity by Phenolic Compounds: Gallic Acid, Caffeic Acid and Pyrogallol. Microb. Pathog. 2016, 99, 56–61. [Google Scholar] [CrossRef]
  51. Shin, M.; Park, E.; Lee, H. Plant-Inspired Pyrogallol-Containing Functional Materials. Adv. Funct. Mater. 2019, 29, 1903022. [Google Scholar] [CrossRef]
  52. Johnstone, D.B.; Little, J.E. Bacteriostatic, Bactericidal, and Drug Resistance Studies of Ethyl Gallate on Mycobacterium Tuberculosis. J. Bacteriol. 1953, 66, 320–323. [Google Scholar] [CrossRef] [Green Version]
  53. Mink, S.N.; Jacobs, H.; Gotes, J.; Kasian, K.; Cheng, Z.Q. Ethyl Gallate, a Scavenger of Hydrogen Peroxide That Inhibits Lysozyme-Induced Hydrogen Peroxide Signaling in Vitro, Reverses Hypotension in Canine Septic Shock. J. Appl. Physiol. 2011, 110, 359–374. [Google Scholar] [CrossRef] [Green Version]
  54. Oladimeji, O.H.; Igboasoiyi, A. Isolation, Characterization and Antimicrobial Analysis of Ethyl Gallate and Pyrogallol from Acalypha Wilkesiana Var. Lace-Acalypha (Muell &Arg.). Afr. J. Pharmacol. Ther. 2014, 3, 79–84. [Google Scholar]
  55. Ooshiro, A.; Hiradate, S.; Kawano, S.; Takushi, T.; Fujii, Y.; Natsume, M.; Abe, H. Identification and Activity of Ethyl Gallate as an Antimicrobial Compound Produced by Geranium Carolinianum. Weed Biol. Manag. 2009, 9, 169–172. [Google Scholar] [CrossRef]
  56. Hall, G.; Le, T.T.T.; Stanford, J.B.; Sugden, J.K. Hydroxyl Radical Scavenging by Ethyl Gallate and Related Compounds: A Method for Rapid Evaluation. Pharm. Acta Helv. 1996, 71, 221–224. [Google Scholar] [CrossRef]
  57. Hausen, B.M.; Beyer, W. The Sensitizing Capacity of the Antioxidants Propyl, Octyl, and Dodecyl Gallate and Some Related Gallic Acid Esters. Contact Dermatitis 1992, 26, 253–258. [Google Scholar] [CrossRef] [PubMed]
  58. Osman, A.; Hamed, A.; Mohamed, S.; Ayoub, H. Chemical Composition and Antimicrobial Activity of Sudanese Lupinus Termis L. root extracts. Pharma Innov. J. 2015, 4, 1–4. [Google Scholar]
  59. Driscoll, W.J.; Chaturvedi, S.; Mueller, G.P. Oleamide Synthesizing Activity from Rat Kidney: Identification as Cytochrome C. J. Biol. Chem. 2007, 282, 22353–22363. [Google Scholar] [CrossRef] [PubMed] [Green Version]
  60. Nischitha, R.; Shivanna, M.B. Antimicrobial Activity and Metabolite Profiling of Endophytic Fungi in Digitaria Bicornis (Lam) Roem. and Schult. and Paspalidium Flavidum (Retz.) A. Camus. 3 Biotech 2021, 11, 53. [Google Scholar] [CrossRef]
  61. Lourenço, S.C.; Moldão-Martins, M.; Alves, V.D. Antioxidants of Natural Plant Origins: From Sources to Food Industry Applications. Molecules 2019, 24, 4132. [Google Scholar] [CrossRef] [Green Version]
  62. Brand-Williams, W.; Cuvelier, M.E.; Berset, C. Use of a Free Radical Method to Evaluate Antioxidant Activity. LWT Food Sci. Technol. 1995, 28, 25–30. [Google Scholar] [CrossRef]
  63. Li, H.-B.; Wong, C.C.; Cheng, K.W.; Chen, F. Antioxidant Properties in Vitro and Total Phenolic Contents in Methanol Extracts from Medicinal Plants. LWT Food Sci. Technol. 2008, 41, 385–390. [Google Scholar] [CrossRef]
  64. Benzie, I.F.F.; Strain, J.J. The Ferric Reducing Ability of Plasma (FRAP) as a Measure of “Antioxidant Power”: The FRAP Assay. Anal. Biochem. 1996, 239, 70–76. [Google Scholar] [CrossRef] [Green Version]
  65. Singleton, V.L.; Orthofer, R.; Lamuela-Raventós, R.M. [14] Analysis of Total Phenols and Other Oxidation Substrates and Antioxidants by Means of Folin-Ciocalteu Reagent. In Methods in Enzymology; Elsevier: Amsterdam, The Netherlands, 1999; Volume 299, pp. 152–178. [Google Scholar] [CrossRef]
  66. Broadhurst, R.B.; Jones, W.T. Analysis of Condensed Tannins Using Acidified Vanillin. J. Sci. Food Agric. 1978, 29, 788–794. [Google Scholar] [CrossRef]
  67. Zhishen, J.; Mengcheng, T.; Jianming, W. The Determination of Flavonoid Contents in Mulberry and Their Scavenging Effects on Superoxide Radicals. Food Chem. 1999, 64, 555–559. [Google Scholar] [CrossRef]
  68. Lucero, M.; Estell, R.; Tellez, M.; Fredrickson, E. A Retention Index Calculator Simplifies Identification of Plant Volatile Organic Compounds. Phytochem. Anal. 2009, 20, 378–384. [Google Scholar] [CrossRef]
  69. Reza, A.S.M.A.; Haque, M.A.; Sarker, J.; Nasrin, M.S.; Rahman, M.M.; Tareq, A.M.; Khan, Z.; Rashid, M.; Sadik, M.G.; Tsukahara, T.; et al. Antiproliferative and Antioxidant Potentials of Bioactive Edible Vegetable Fraction of Achyranthes Ferruginea Roxb. in Cancer Cell Line. Food Sci. Nutr. 2021, 9, 3777–3805. [Google Scholar] [CrossRef]
Figure 1. Quantification of secondary metabolites from P. peltatum FDE. (A) total polyphenols, (B) tannins, and (C) flavonoids in hydroalcoholic extract of P. peltatum. The histogram shows the values of the means ± S.D. of three independent experiments and the Tukey L.S.D. test showing homogeneous groups with a p < 0.005. Different lowercase letters (a, b, c, d and e) on the top of columns represent significant difference (p < 0.05).
Molecules 27 03436 g001
Figure 2. Venn diagram showing the volatile and semi-volatile compounds unique and shared between the FDEs of Pelargonium peltatum.
Molecules 27 03436 g002
Figure 3. Antioxidant activity and quantification of secondary metabolites in the different fractions of P. peltatum. The antioxidant activity was determined by (A) ABTS, (B) DPPH, and (C) FRAP. The quantified secondary metabolites were (D) polyphenols and (E) flavonoids. Chl: Chloroform fraction, EtOAc: ethyl acetate fraction, MeOH: methanol fraction. The histogram shows the values of the means ± S.D. of three independent experiments and the Tukey L.S.D. test showing homogeneous groups with a p < 0.005. Different lowercase letters (a, b, c, d and e) on the top of columns represent significant difference (p < 0.05).
Molecules 27 03436 g003
Table 1. Freeze-dried extract yields of P. peltatum.
SampleDry Weight
(g)
Lyophilized Weight (g)Yield
(%)
FDE-Root15018.1612.10
FDE-Stem29019.36.65
FDE-Leaf20046.0423.01
FDE-Flower15837.2223.55
FDE-Bicolour15243.2428.47
Table 2. Retention factors (R.F.) revealed FDEs for tannins and flavonoids.
CompoundsFDE-RootFDE-StemFDE-LeafFDE-FlowerFDE-Flower
(Bicolour)
0.0150.0150.015
0.0150.0360.0360.036
Tannins0.0150.0360.640.640.64
0.0360.830.660.820.82
0.85
0.07
0.210.21
0.260.26
0.070.270.32
0.080.300.34
0.070.070.360.40.43
Flavonoids0.100.720.520.420.45
0.730.730.540.450.56
0.870.690.530.65
0.780.550.7
0.64
0.67
0.76
Table 3. Antioxidant activity and IC50 of FDE from P. peltatum.
SampleABTS
IC50 (µg/mL)
DPPH
IC50 (µg/mL)
FRAP
µM TE
FDE-Root77.47 ± 6.92 b209.50 ± 26.20 b44.03 ± 3.79 a
FDE-Stem75.02 ± 10.57 b293.40 ± 24.75 c120.08 ± 3.79 b
FDE-Leaf46.32 ± 1.84 a132.50 ± 19.15 a274.00 ± 3.70 d
FDE-Flower48.90 ± 3.36 a103.90 ± 19.20 a258.70 ± 2.46 c
FDE-Bicolour55.36 ± 1.96 a215.60 ± 21.05 b249.29 ± 1.19 c
Average of three replicates ± standard deviations. The letters in superscript denote the significant difference between samples at 95% confidence determined with ANOVA and Tukey’s test. Comparisons were made between the different extracts within the same group of methodology.
Table 4. Volatile and semi-volatile compounds identified in FDEs of Pelargonium peltatum by GC-MS.
% Area
#NameMFMWFDE-RootsFDE-
Leaf
FDE-
Stem
FDE-FlowerFDE-BicolourKIexp (1)KIlit (2)
12-Hydroxy-propanoic acid, ethyl esterC5H10O3118.1 4.11 821.7821
2FurfuralC5H4O296.00.41 0.140.15856.5852
32-FuranmethanolC5H6O298.00.27 0.09 874.7875
4Cyclopent-4-ene-1,3-dioneC5H4O296.00.10 894.5880
52-AcetylfuranC6H6O2110.00.560.050.280.260.31921.4921
65-Methyl-2-furancarboxaldehydeC6H6O2110.00.230.010.070.090.11972.5970
72,4-Dihydroxy-2,5-dimethyl-3(2H)-furan-3-oneC6H8O4144.00.710.060.49 0.20986.5989
82-methyl-1,3-CyclopentanedioneC6H8O2112.00.51 0.290.091003.61003
9FuraneolC6H8O3128.10.150.050.200.070.101071.61073
102-Furancarboxylic acidC5H4O3112.0 0.310.35 1091.01088
11Phenylethyl alcoholC8H10O122.1 0.05 1120.81117
122,3-dihydro-3,5-dihydroxy-6-methyl-4H-pyran-4-oneC6H8O4144.010.600.263.031.351.421153.91153
13Benzoic acidC7H6O2122.10.720.29 1175.21178
14CatecholC6H6O2110.10.02 1215.31219
152,3-dihydro-BenzofuranC8H8O120.1 0.300.383.633.311226.71226
165-HydroxymethylfurfuralC6H6O3126.01.48 1235.21234
17Benzeneacetic acidC8H8O2136.1 0.23 1259.51257
18Malic acidC4H6O5134.0 1.03 1.191.521266.8MS (3)
19IndoleC8H7N117.0 0.03 1301.61300
202-Methoxy-4-vinylphenolC9H10O2150.1 0.800.180.080.051319.91317
21EugenolC10H12O2164.1 0.300.200.380.371362.91362
221,2,3-BenzenetriolC6H6O3126.0 23.8713.4528.3127.151398.51386
233-hydroxy-4-methoxy-BenzaldehydeC8H8O3152.00.64 1404.61401
242-methoxyphenyl-EthanolC9H12O2152.10.31 1439.51421
252,4-di-tert-butylphenolC14H22O206.20.52 1512.11513
264-hydroxy-Benzoic acidC7H6O3138.00.56 0.220.590.581537.31538
27Dodecanoic acidC12H24O2200.1 0.17 1557.91557
283-Methoxy-4-Hydroxybenzoic acid (Vanillic acid)C8H8O4168.01.38 0.270.300.541572.51570
294-hydroxy-3-methoxy-Benzoic acid, ethyl esterC10H12O4196.1 0.03 1590.11589
30Tridecanoic acidC13H26O2214.217.76 1652.41662
31Tetradecanoic acidC14H28O2228.20.51 0.36 1755.31761
326-Hydroxy-4,4,7a-trimethyl-5,6,7,7a-tetrahydrobenzofuran-2(4H)-one (Loliolide)C11H16O3196.1 0.21 1784.81784
334-Acetoxycinnamic acidC11H10O4206.1 0.740.221805.9MS
34Pentadecanoic acidC15H30O2242.2 0.20 1854.01857
352-methyl-Undecanoic acid, methyl esterC13H26O2214.2 0.06 1884.9MS (3)
36Methyl gallateC8H8O5184.0 1.793.241914.6MS (3)
37n-Hexadecanoic acidC16H32O2256.210.210.316.381.403.011960.31957
38Ethyl gallateC9H10O5198.29.8460.2524.4938.6336.681978.0MS (3)
39Hexadecanoic acid, ethyl ester (Ethyl palmitate)C18H36O2284.35.23 1985.01984
40Heptadecanoic acidC17H34O2270.3 0.23 2054.32065
41PhytolC20H40O296.3 0.181.800.250.522108.32112
42(Z,Z)-9,12-Octadecadienoic acidC18H32O2280.23.07 2.800.71 2131.42130
43(Z,Z,Z)-9,12,15-Octadecatrienoic acidC18H30O2278.2 1.382135.42143
449-Octadecenoic acidC18H34O2282.32.91 3.60 2139.72141
45Linoleic acid ethyl esterC20H36O2308.33.38 4.261.062.172155.72155
469-Octadecenoic acid, ethyl esterC20H38O2310.33.22 2.35 2160.92171
47(Z,Z,Z)-9,12,15-Octadecatrienoic acid, ethyl esterC20H34O2306.30.59 1.640.400.772163.22169
48Octadecanoic acidC18H36O2284.30.680.190.300.550.952174.52172
49Octadecanoic acid, ethyl esterC20H40O2312.30.740.60 2183.12188
50(Z)-9-OctadecenamideC18H35NO281.39.001.653.525.579.332364.02375
51Eicosanoic acid, ethyl esterC22H44O2340.31.30 0.570.200.412382.22394
52Hexadecanoic acid, 2-hydroxy-1-(hydroxymethyl)ethyl esterC19H38O4330.33.25 0.73 0.492501.62498
53Docosanoic acid, ethyl esterC24H48O2368.6 0.51 2586.32594
(1) KIexp: Kovats indices calculated from retention time data on a HP-5ms capillary column. (2) KIlit: Kovats indices from literature (NIST). (3) The Kovats index was not reported on a HP-5ms capillary column, the identification was made by comparison with M.S. mass spectra.
Table 5. M.I.C. of FDE-Flower and FDE-Leaf partitioned extracts.
Solvent
StrainChlEtOAcMeOHFDE
S. aureus250 µg/mL31.2 µg/mL>1000 µg/mLLeaf
1000 µg/mL31.2 µg/mL1000 µg/mLFlower
S. enterica1000 µg/mL62.5 µg/mL>1000 µg/mLLeaf
250 µg/mL62.5 µg/mL1000 µg/mLFlower
E. faecalis1000 µg/mL62.5 µg/mL>1000 µg/mLLeaf
500 µg/mL31.2 µg/mL1000 µg/mLFlower
S. marcescens>1000 µg/mL500 µg/mL>1000 µg/mLLeaf
1000 µg/mL500 µg/mL>1000 µg/mLFlower
Table 6. Volatile and semi-volatile compounds identified in leaf and flower ethyl acetate fractions of Pelargonium peltatum by GC-MS.
#NameMFMW% AreaKIexp (1)KIlit (2)
LeafFlower
1FurfuralC5H4O296.0 0.11855.1852
23-methyl-2,5-furandioneC5H4O3112.00.020.03952.0949
3AcetophenoneC8H8O120.00.04 1070.41066
42-methoxy-PhenolC7H8O2124.1 0.061091.51090
5NonanalC9H18O142.10.07 1114.71112
6CatecholC6H6O2110.0 0.131200.21208
72,3-dihydro-BenzofuranC8H8O120.10.041.591222.41226
85-HydroxymethylfurfuralC6H6O3126.0 0.101256.41261
92-Methoxy-4-vinylphenolC9H10O2150.10.020.021314.51317
10EugenolC10H12O2164.1 0.051358.11362
111,2,3-BenzenetriolC6H6O3126.077.3871.241387.41386
122,4-di-tert-butylphenolC14H22O206.20.09 1505.91513
13Ethyl gallateC9H10O5198.1 13.101951.3MS
14Octadecanoic acidC18H36O2284.31.440.542167.22172
15(Z)-9-OctadecenamideC18H35NO281.313.636.752364.02375
(1) KIexp: Kovats indices calculated from retention time data on a HP-5ms capillary column. (2) KIlit: Kovats indices from literature (NIST). The Kovats index was not reported on a HP-5ms capillary column, the identification was made by comparison with M.S. (mass spectra).
Publisher’s Note: MDPI stays neutral with regard to jurisdictional claims in published maps and institutional affiliations.

