Article

An Investigation towards Coupling Molecular Dynamics with Computational Fluid Dynamics for Modelling Polymer Pyrolysis

by
Timothy Bo Yuan Chen
1,
Ivan Miguel De Cachinho Cordeiro
1,
Anthony Chun Yin Yuen
1,*,
Wei Yang
2,
Qing Nian Chan
1,
Jin Zhang
1,
Sherman C. P. Cheung
3 and
Guan Heng Yeoh
1,4
1
School of Mechanical and Manufacturing Engineering, University of New South Wales, Sydney, NSW 2052, Australia
2
School of Energy, Materials and Chemical Engineering, Hefei University, 99 Jinxiu Avenue, Hefei 230601, China
3
School of Aerospace, Mechanical and Manufacturing Engineering, RMIT University, Melbourne, VIC 3083, Australia
4
Australian Nuclear Science and Technology Organization (ANSTO), Locked Bag 2001, Kirrawee DC, NSW 2232, Australia
*
Author to whom correspondence should be addressed.
Molecules 2022, 27(1), 292; https://doi.org/10.3390/molecules27010292
Submission received: 30 July 2021 / Revised: 21 December 2021 / Accepted: 27 December 2021 / Published: 4 January 2022
(This article belongs to the Special Issue New Prospects in Flame-Retardant Materials)

Abstract

:
Building polymers implemented into building panels and exterior façades have been determined as the major contributor to severe fire incidents, including the 2017 Grenfell Tower fire incident. To gain a deeper understanding of the pyrolysis process of these polymer composites, this work proposes a multi-scale modelling framework comprising of applying the kinetics parameters and detailed pyrolysis gas volatiles (parent combustion fuel and key precursor species) extracted from Molecular Dynamics models to a macro-scale Computational Fluid Dynamics fire model. The modelling framework was tested for pure and flame-retardant polyethylene systems. Based on the modelling results, the chemical distribution of the fully decomposed chemical compounds was realised for the selected polymers. Subsequently, the identified gas volatiles from solid to gas phases were applied as the parent fuel in the detailed chemical kinetics combustion model for enhanced predictions of toxic gas, charring, and smoke particulate predictions. The results demonstrate the potential application of the developed model in the simulation of different polymer materials without substantial prior knowledge of the thermal degradation properties from costly experiments.

1. Introduction

Fire risks associated with lightweight building materials have continuously threatened building occupants, the environment, and properties [1,2]. The rise in material complexity has also generated new challenges and requirements concerning fire safety protection systems. Subsequently, it has driven significant interest in developing robust numerical tools to effectively assess the fire behaviours and performance of these combustible materials in fire investigation studies and establish safe use guidelines, especially for the rapid development of flame retardants, prediction of toxicity emissions and self-extinguishing behaviours.
The application of Computational Fluid Dynamic (CFD) modelling on building fires has gained massive adoption due to the rapid advancement of computational power and offers a cost-effective method to analyse material fire performance compared to conventional fire testing [3,4,5,6,7]. Specifically. Large-eddy simulation (LES)-based fire field modelling has become dominant in numerical studies of fire dynamics, with generalised fire codes, such as Fire Dynamics Simulator (FDS) [8], FireFOAM [9] and several others [10,11]. Typically, thermogravimetric analysis (TGA) is applied to extract the decomposition kinetics of polymers [12], while the flammability and ignitability of the material can be studied via Cone Calorimetry [3]. Through analysing the thermal degradation at multiple heating conditions (i.e., constant heating rates) [13,14], the resultant pyrolysis rate can be expressed in the form of Arrhenius expression, similar to those applied for gas-phase reactions. For other structural properties, there are Scanning Electron Microscopy and Transmission Electron Microscopy, X-ray Photoelectron Spectroscopy and Small-angle Neutron Scattering [15,16,17]. There are many successful CFD studies on the fire behaviour of polymer materials. Nguyen et al. [18] investigated the fire resistance of glass fibre reinforced polymer composite via a methodology incorporating experimental (TGA, cone calorimetry and single item burn test) and numerical simulation. The experimental results were used as input parameters and validation to construct the numerical model. The model then provided more detailed insight into the burning process and flame spread behaviour. Dutta et al. [19] conducted a numerical study on natural fibre composites. The pyrolysis kinetics were extracted from TGA experiments and applied in an FDS model of the Cone Calorimeter under horizontal and vertical orientations. More recently, Yuen et al. [4,20] coupled an in-house pyrolysis model with kinetics data extracted via a genetic algorithm to study the thermal decomposition of flame-retardant polyurethane foams. The authors highlighted that a more detailed pyrolysis breakdown of gas products from thermal decomposition could improve the accuracy of smoke and Carbon Monoxide predictions. CFD modelling of polymer pyrolysis is also extensively applied in hybrid rocket engines [21]. Tyurenkova et al. [22,23,24,25] conducted a comprehensive series of numerical studies on solid fuel pyrolysis in hybrid rocket engines and investigated the regression behaviour in different flow regimes. It has been found that turbulent transfer coefficients, such as Prandtl number play an essential role to model the gas-solid surface interactions and the regression rate.
Although CFD techniques are widely used to simulate the burning of building materials, there are still many limiting factors from current modelling frameworks. For instance, obtaining material input parameters is one of the major difficulties in conducting fire modelling. It requires quality and reliable data obtained through multiple fire experiments, which are costly and destructive. Furthermore, there are limited techniques to extract the actual chemical composition of emitted volatiles to properly characterise the combustion chemistry in the gas phase and model the solid pyrolysis process [26]. Consequently, single-step gas-phase combustion reactions are often applied instead of detailed chemical kinetics mechanisms [27]. Detailed chemical kinetics would enable a more comprehensive description of gas species and intermediate reactions but are more computationally intensive. As such, molecular dynamics (MD) simulations with a reactive force field (ReaxFF) have significant potential to be applied to gain a more in-depth knowledge of pyrolysis breakdown of material and extract the key input data required for fire modelling.
ReaxFF proposed by van Duin et al. [28] is an empirical bond-order-based reactive forcefield capable of explicitly describing detailed bond breaking, bond formation, and subsequent complex chemical reactions within a molecular system. Owing to the consideration of bond disassociation and bond formation, ReaxFF is a computationally efficient approach to investigate detailed pyrolysis mechanisms of the thermal decomposition process. It can also provide formation pathways of different primary products and extract pyrolysis kinetics in thermal decomposition simulations. Therefore, the adoption of MD simulation would benefit the investigation of polymers’ thermal degradation at atomistic levels. For example, Chen et al. [29] characterised the pyrolysis process of three common engineered polymers (high-density polyethylene, poly (methyl methacrylate) and high impact polystyrene) through ReaxFF simulations, obtained detailed pyrolysis kinetics and char formation that was in good agreement with the experimental result. Varri and Paajanen [30] have carried out a ReaxFF based MD simulation to explore the effect of aluminium trihydroxide (ATH) on the thermal decomposition of polyethylene. The simulations replicated the endothermic decomposition of ATH into alumina and water. The simulations also revealed the chemical reaction between polyethylene and ATH, such as hydrogen abstraction, water production and enhanced charring. Rahmani et al. [31] examined both non-isothermal and isothermal decomposition of polyethylene oxide using reactive molecular dynamics simulation. The polyethylene oxide was loaded with different concentrations of pristine graphene and graphene oxide nanoplatelets. The result of the MD studies identified improvement in thermal stability by introducing pristine graphene to the polymers. Lan et al. [32] utilised MD simulations to investigate the atomistic behaviours of ammonium polyphosphate filled flame retarded polypropylene composites. The compatibility of flame retardants in the polymer matrix was optimised with different additives, which agrees with experimental data.
All the reviewed works demonstrated MD simulations as a viable tool for investigating the pyrolysis chemistry of polymer systems and highlights the capability to identify the detailed decomposition process from solid to gas phases, which could further act as the precursors of combustible fuel gases in CFD combustion models. Although it is suggested that the turbulent transfer coefficients also plays an essential role, surpassing the molecular transfer coefficients in the numerical investigations [22,23,24,25]. MD simulations are able to identify the pyrolysis behaviour and flame retardancy mechanism at the molecular level. This study proposes a multi-scale modelling approach by applying the kinetics parameters and detailed pyrolysis gas volatiles (i.e., parent combustion fuel, key precursor species) extracted from MD to enable detailed chemistry modelling in CFD (see Figure 1). This methodology will deliver a more accurate prediction on polymer degradation, toxicity and smoke emission compared to current assumed CFD models. To investigate the validity of the proposed approach, numerical simulations will be performed on both polyethylene and flame retardant polyethylene. This work is expected to contribute towards future studies investigating the viability of coupling MD with CFD pyrolysis modelling and creating the framework for a fully coupled interactive fire model.

2. Results and Discussion

In order to model the pyrolysis process, the CFD model requires (i) the thermal properties of the material, (ii) the thermal degradation rate and (iii) gas-phase volatile releases involved during the pyrolytic process. Accordingly, instead of extracting these key data from a number of different fire experiments or empirical expressions for the estimation of these quantities, MD (ReaxFF) is employed. Specifically, MD simulations are performed to calculate (i) the thermal conductivity of the polymer system, (ii) the pyrolysis reaction kinetics and (iii) identify the detailed distribution of combustible volatiles of the polymer composites. The data were applied as inputs into a three-dimensional LES fire model comprising of (i) solid pyrolysis, (ii) gas-phase combustion, (iii) radiation heat exchange between fire source, walls, and gaseous products, (iv) soot formation, and (v) sub-grid scale (SGS) turbulence models. Finally, the simulation results are validated against experimental data from cone calorimetry.

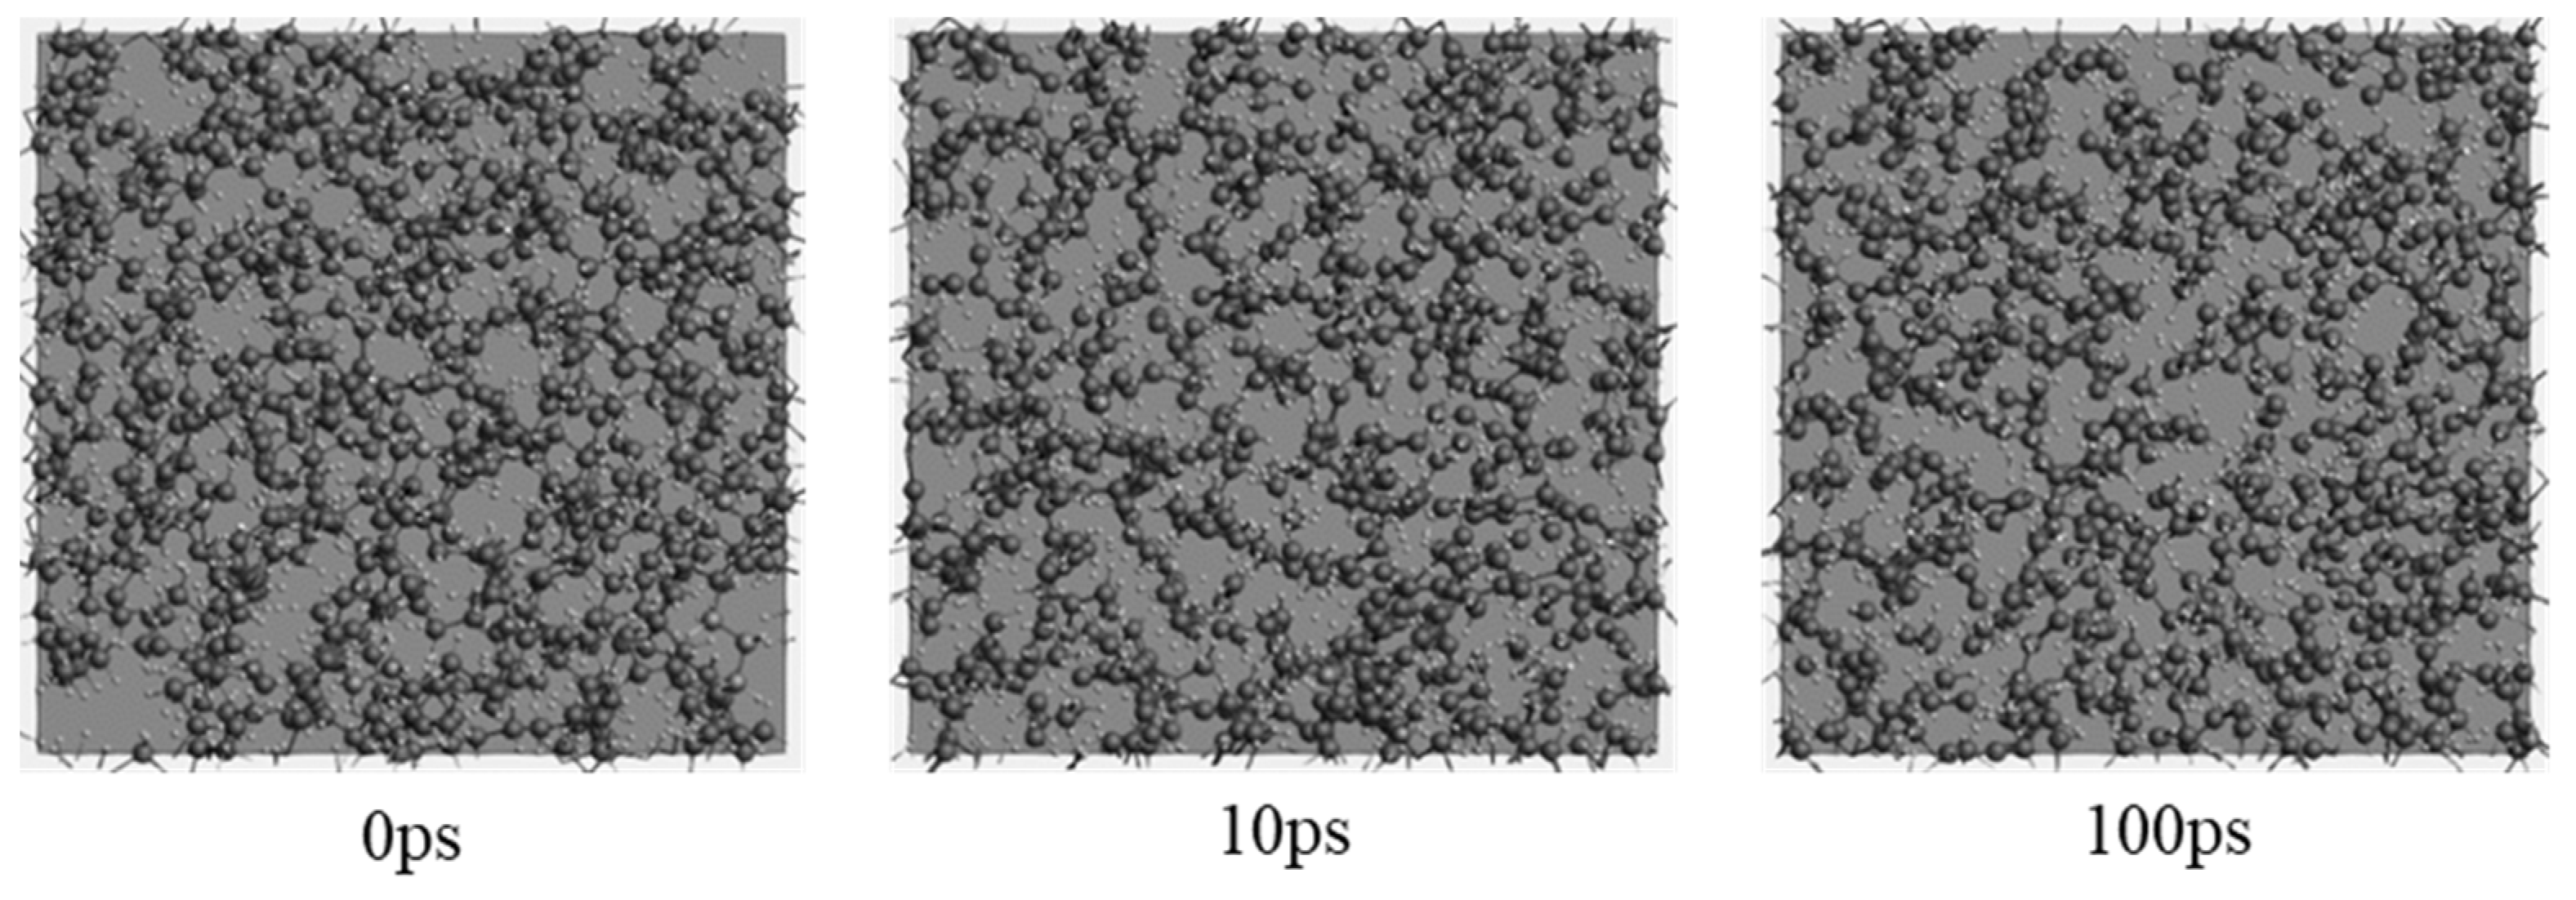
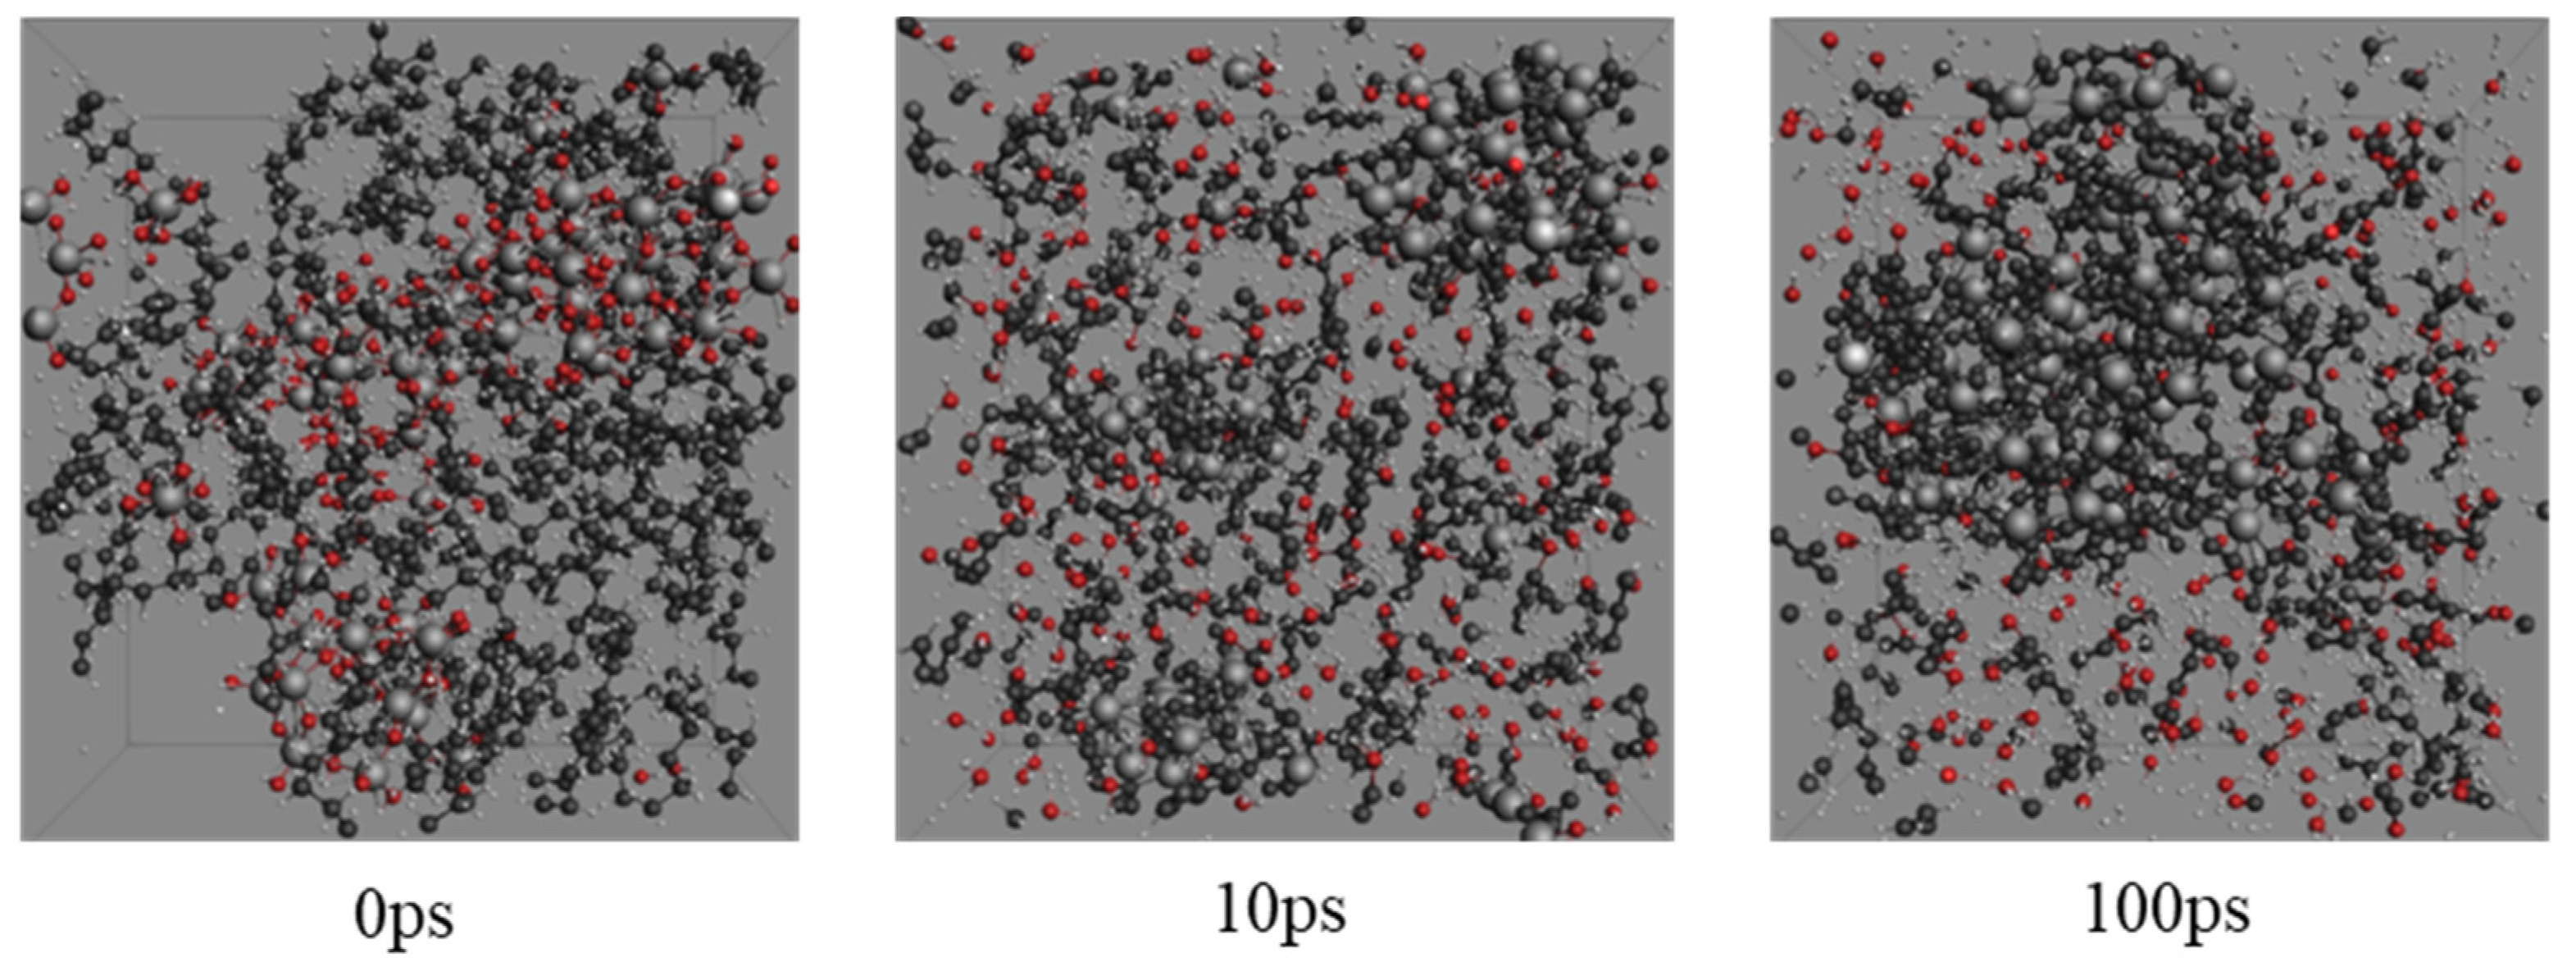
2.1. Molecular Systems

Figure 2 and Figure 3 reveal the snapshots of the atomic configurations of pure PE and PE filled with 25 mass percentage (wt%) ATH during the MD simulations at 3000 K. As can be seen from the snapshots, the detailed disassociation and formation of chemical bonds from the pyrolysis process can be observed at an atomic level over time. In the case of pure PE (Figure 2), the initial status of the simulation begins with the packed amorphous structure in the periodic domain. The bonding force between monomers begins disassociation when sufficient heat energy is applied to the system. Over an instantaneous time (i.e., 10 ps), it can be observed that the polymer structure initiates the breakdown process, where smaller molecular compounds are formed. With a longer duration of simulation time, there will be a further amount of minor chemical compounds forming. While for the ATH filled PE system (Figure 3), H2O molecules are formed owing to the existence of OH anions from the ATH. Except for the yields of water, it can also be observed that the breakdown of the PE grain is relatively slower than the pure PE system. The results highlight the capabilities of MD to analyse the detailed temporal distribution of the detailed pyrolysis breakdown gas products from thermal decomposition.

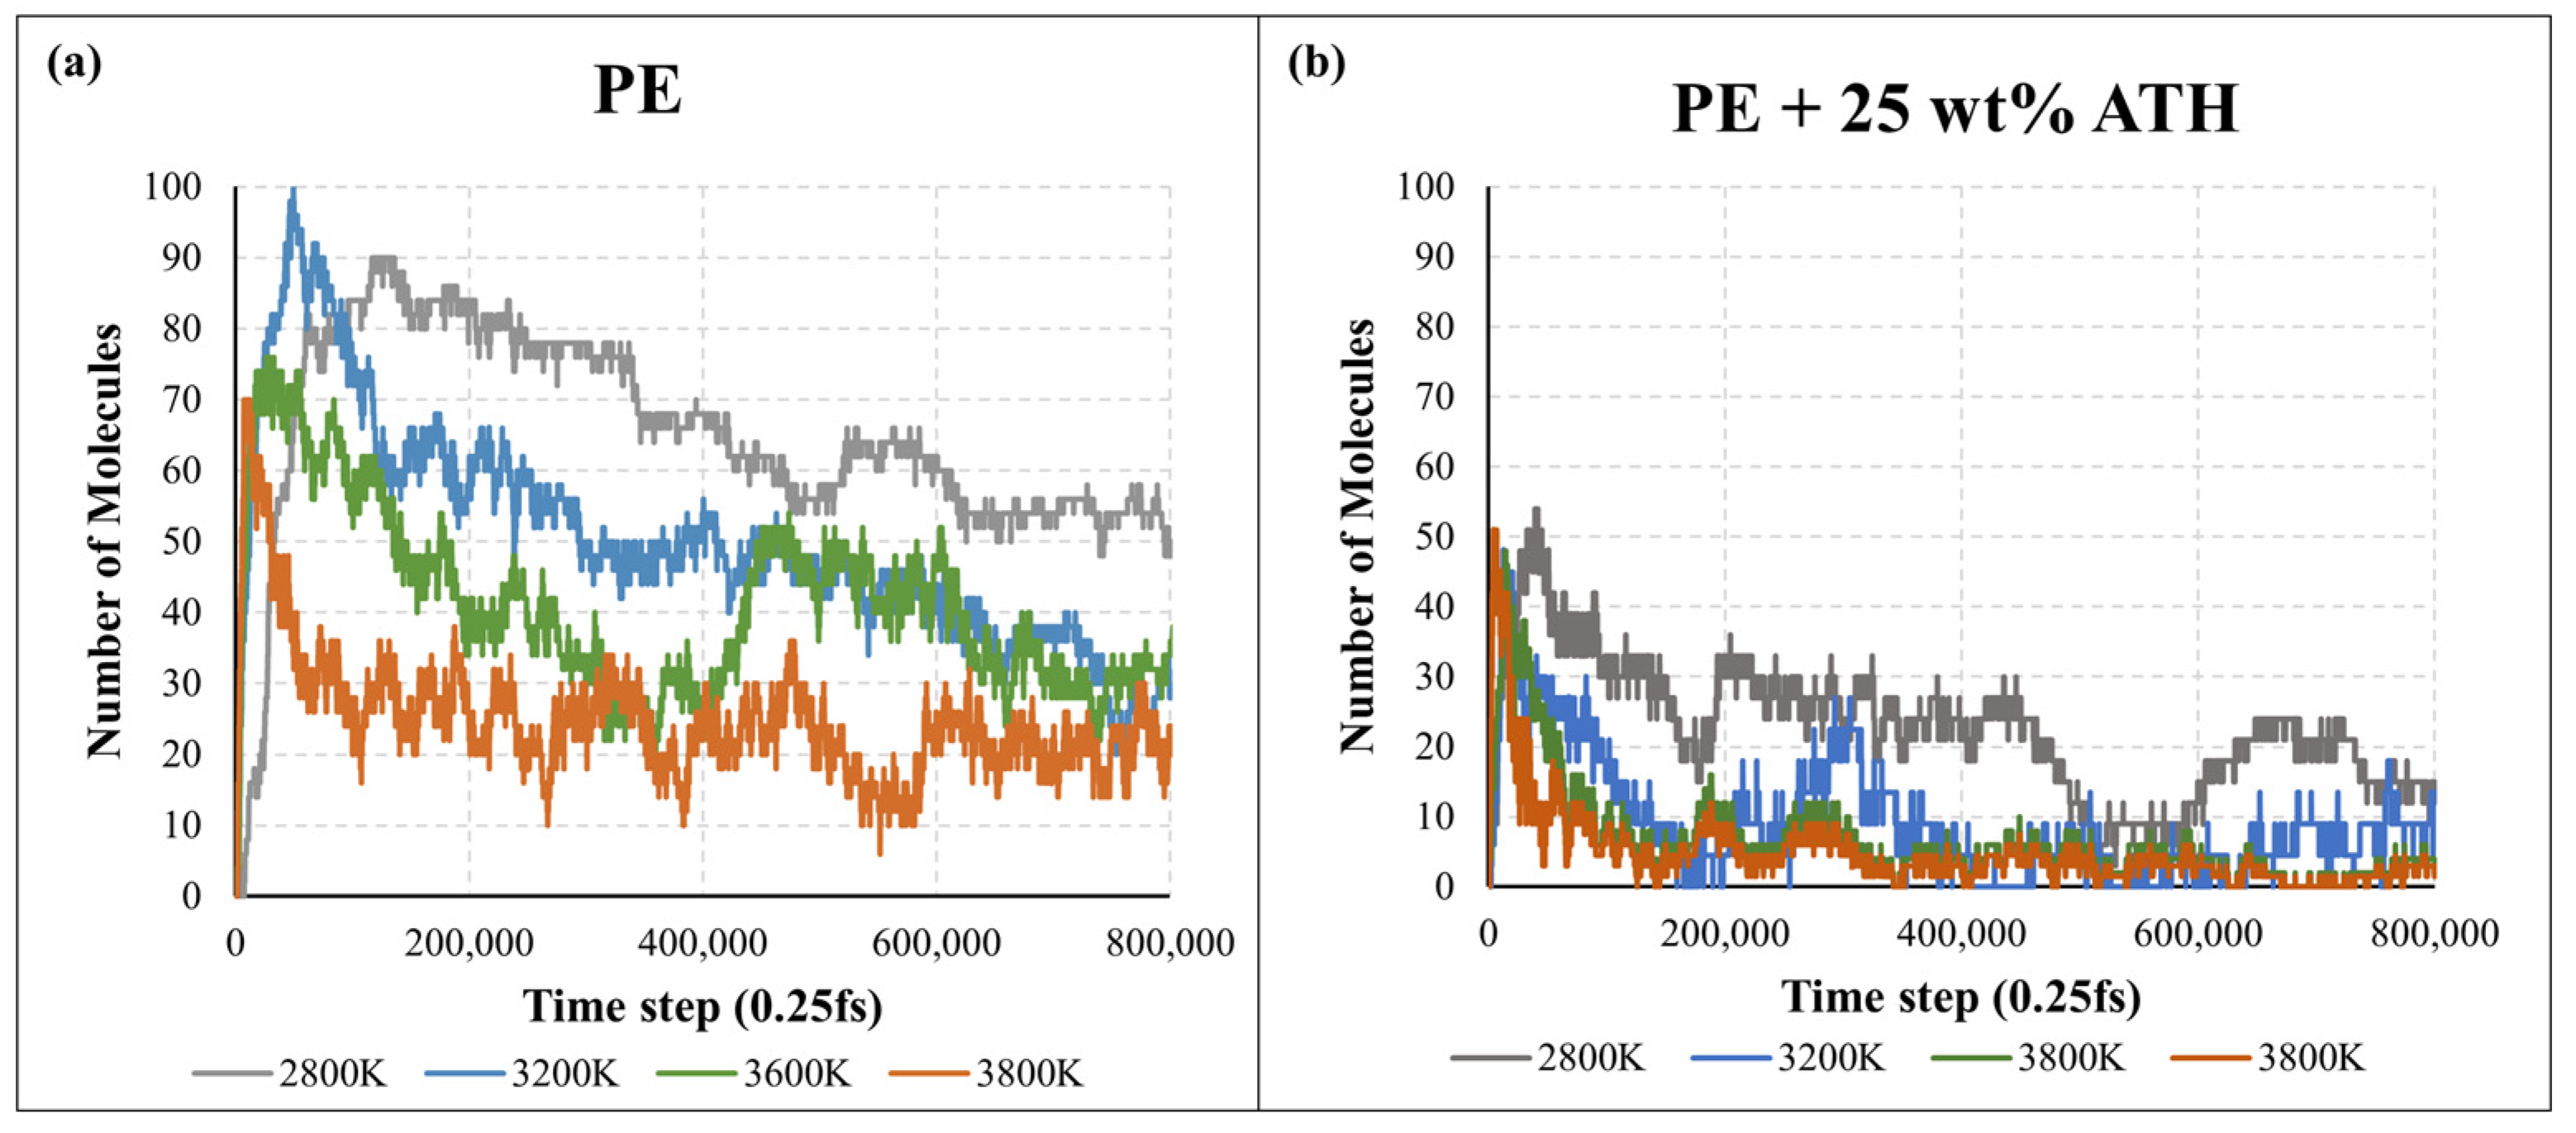
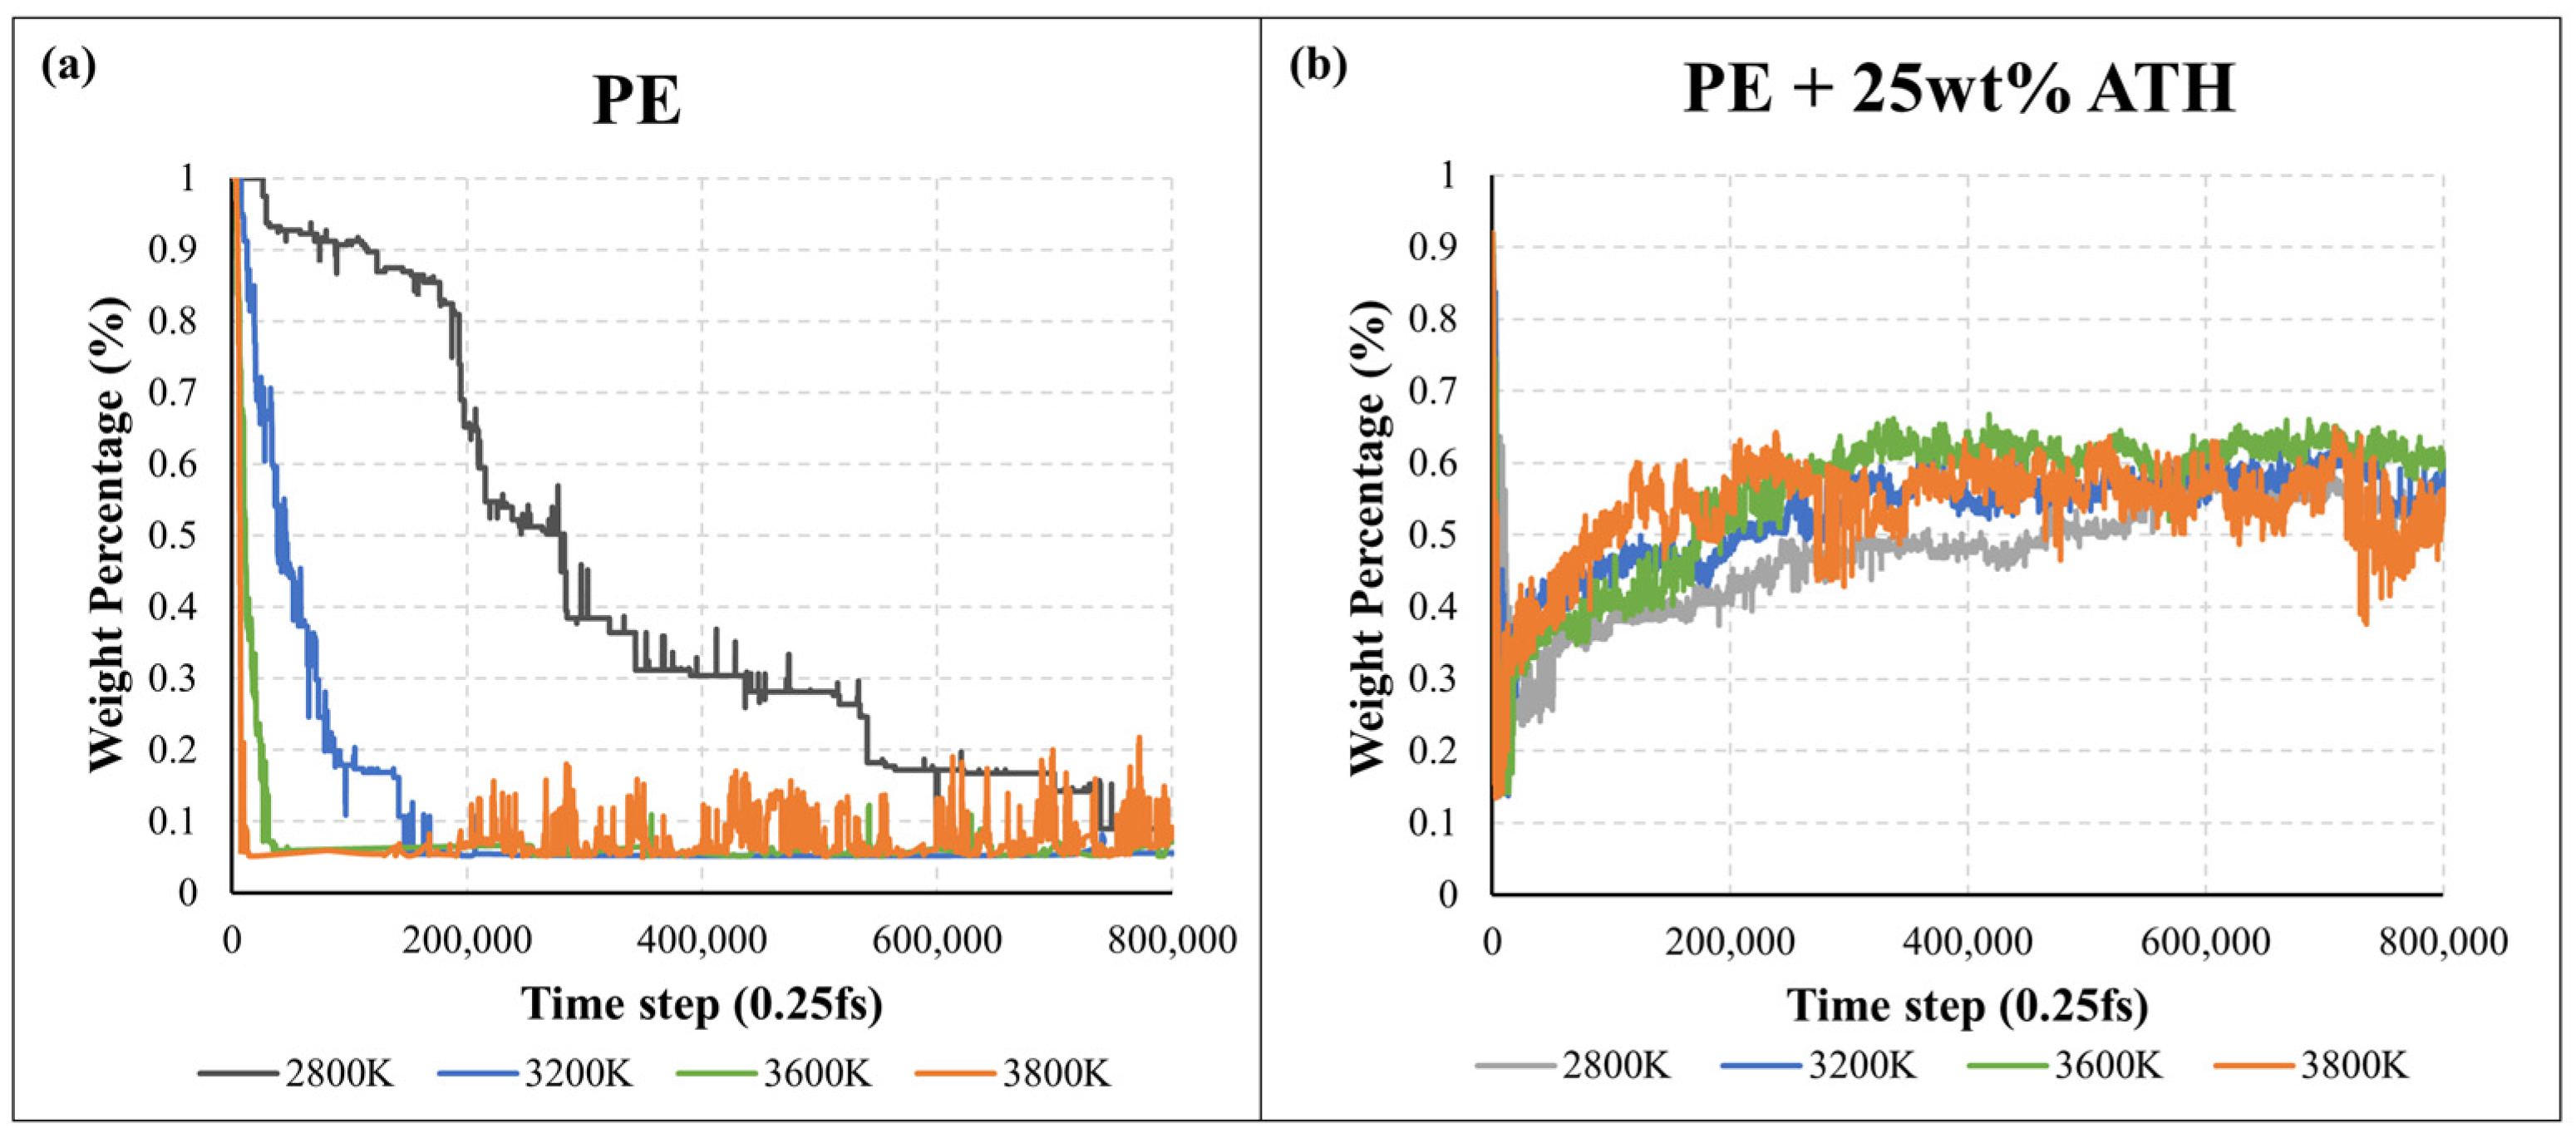
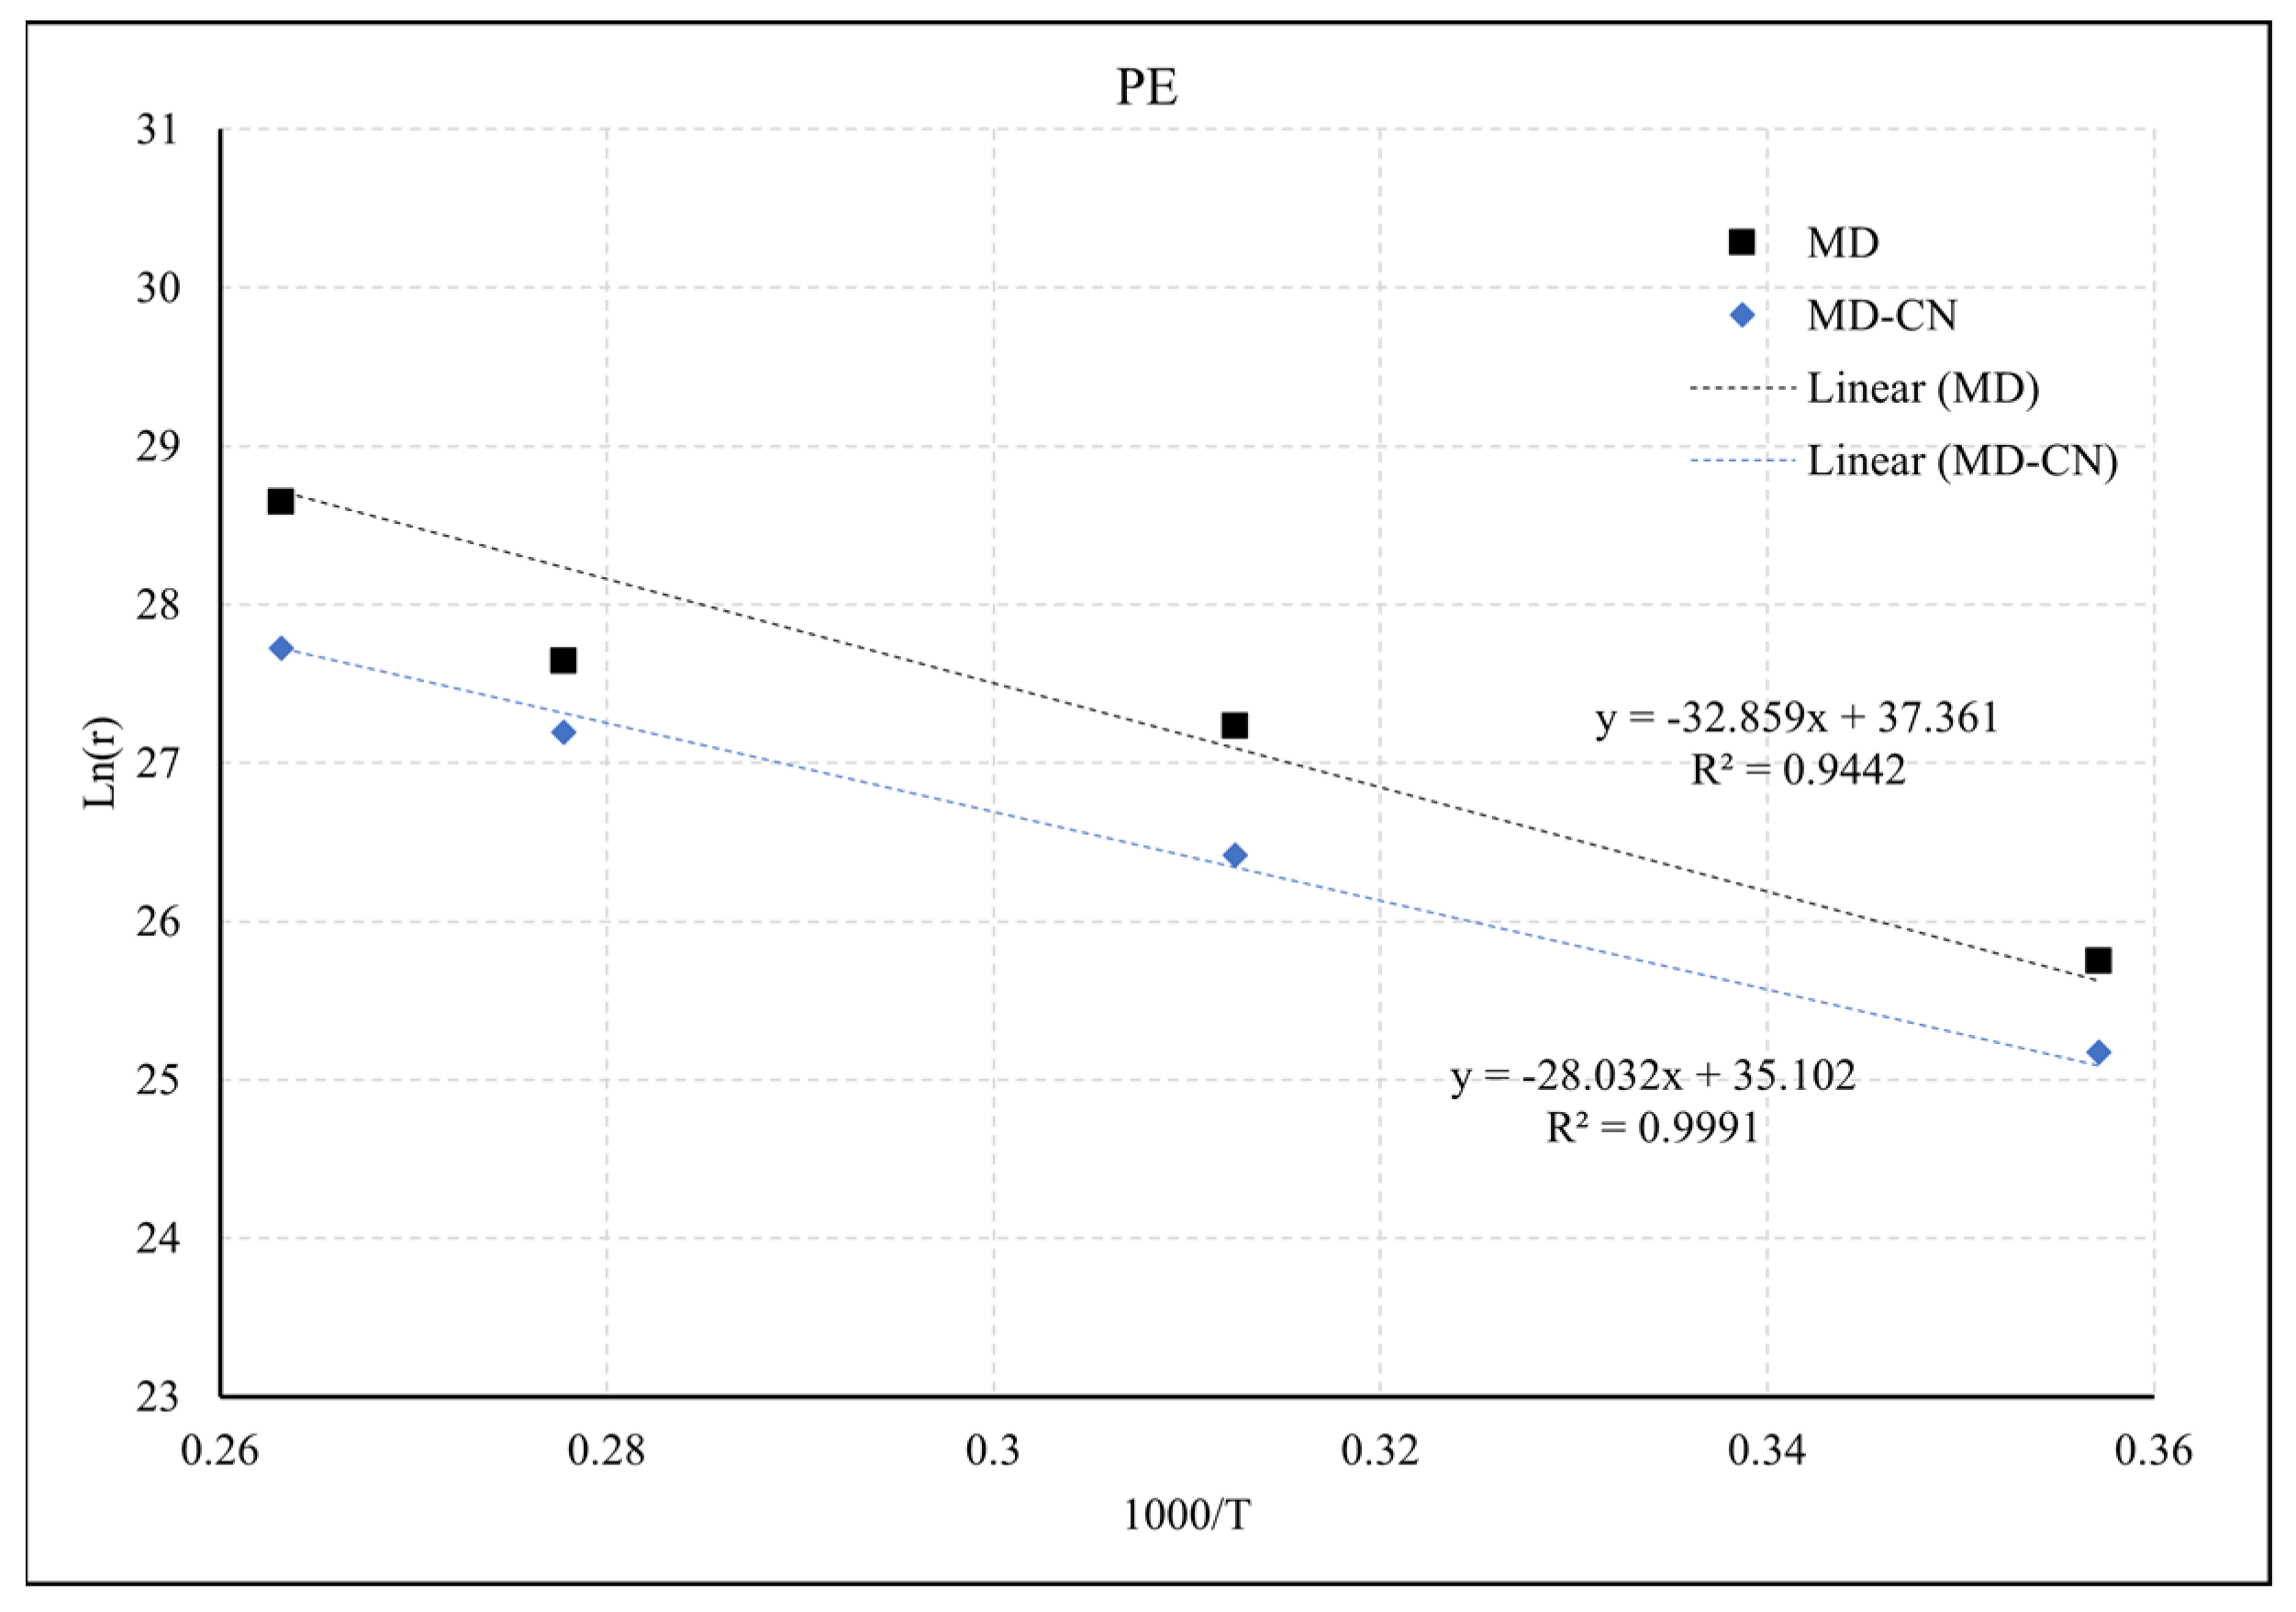
2.2. Pyrolysis Kinetic Analysis

In the past few years, there are a few methods that have been investigated to approximate the thermal decomposition of polymers in MD. These include kinetics analysis on (i) the number of monomer molecules [33,34], and (ii) the approximation of mass loss by applying a threshold or cut-off based on carbon (C) number [35,36] or molecular weight [37,38,39]. This study determined the first-order pyrolysis kinetics by two different analysis approaches. The first approach (MD) analysed the molecular number of the backbone monomer (e.g., ethylene (C2H4)) at a temperature ranging from 2800 K–3800 K. While in the second approach (MD-CN), the kinetics were estimated by adopting a molecular weight cut-off filter at the temperature ranging from 2800 K–3800 K. Fletcher et al. suggested that the pyrolysis fragments can be classified as char species/residues (C40+), tar species (C5–40) and gas species (C0–5) based on the containing number of carbon atoms [40]. Figure 4 and Figure 5 demonstrate the time profile of the number of ethylene monomers and weight percentage of C40+ residues in the PE and PE + 25 wt% ATH simulations at different temperatures for the first 200 ps.
In Figure 4, a sharp increase in the number of ethylene monomers can be generally observed at the start, indicating the initial breakdown of the polymer into its monomer components. It is followed by a gradual decrease as the monomers break down into subsequent pyrolysis products. It can be clearly seen that the total numbers of ethylene in PE/ATH are less than PE, indicating the polymeric degradation rate of PE/ATH was slower. Figure 5 reveals the weight percentage of C40+ for the PE and PE/ATH during the molecular dynamics simulation. For pure PE (except 2800 K), the weight percentage of the pyrolysis fragment was rapidly degraded to 10% within the first 50 ps, indicating the violent decomposition of the polymers without any FR additives. While for PE/ATH (Figure 5b), the weight percentages of C40+ raised after the initial breakdown of PE during the first 50 ps, indicating the char formation led by the ATH additives.
As mentioned previously, the pyrolysis kinetics for solid decomposition reaction can be expressed in the form of Arrhenius expression:
r = A   e x p ( E a R T ) ( Y ) n
where r is the reaction rate, E a is the activation energy, A is the pre-exponential, R is the universal gas constant, T is the reaction temperature, Y is the mass fraction of the solid material and n is an exponential factor for the mass fraction. The pyrolysis kinetic parameters E a and A were determined by analysing the correlation between the reaction rate r i and the corresponding pyrolysis temperature T i , where i denotes the range of temperature. A linear relationship can be established between ln ( r i ) and ( 1 / T i ) . The theoretical linear relationship between the two terms can be expressed as:
ln ( r i ) = ln ( A ) E a R ( 1 T i )
As illustrated in Figure 6, utilising Equation (2), the pyrolysis kinetic parameters E a and A can be extracted from the slope ( E a / R ) and intercept ( ln ( A ) ) of the fitted line. The results are listed in Table 1. As can be seen, the results derived from MD were aligned with values obtained from TGA and also in the range of the values reported in Sinfronio et al. [41] of 227.33–269.04 for E a and 2.4 × 10¹³–1.8 × 10¹⁶ for A . Similarly, these approaches can also be used to extract the reactions for PE/ATH.
For the PE + 25% ATH case, it can be observed that the breakdown rate of the ethylene of the system was reduced due to the existence of ATH. As illustrated in Figure 7, the formation of H2O has significantly occurred in the PE + ATH simulations, which further consumed hydrogen atoms and reduced the formation of other alkane fuel species (e.g., methane CH4, ethylene C2H4 and propane C3H6) that requires hydrogen atoms. It can be noticed that the mass fraction of these alkane fuels in PE/ATH is significantly lower than in the pure PE simulations.

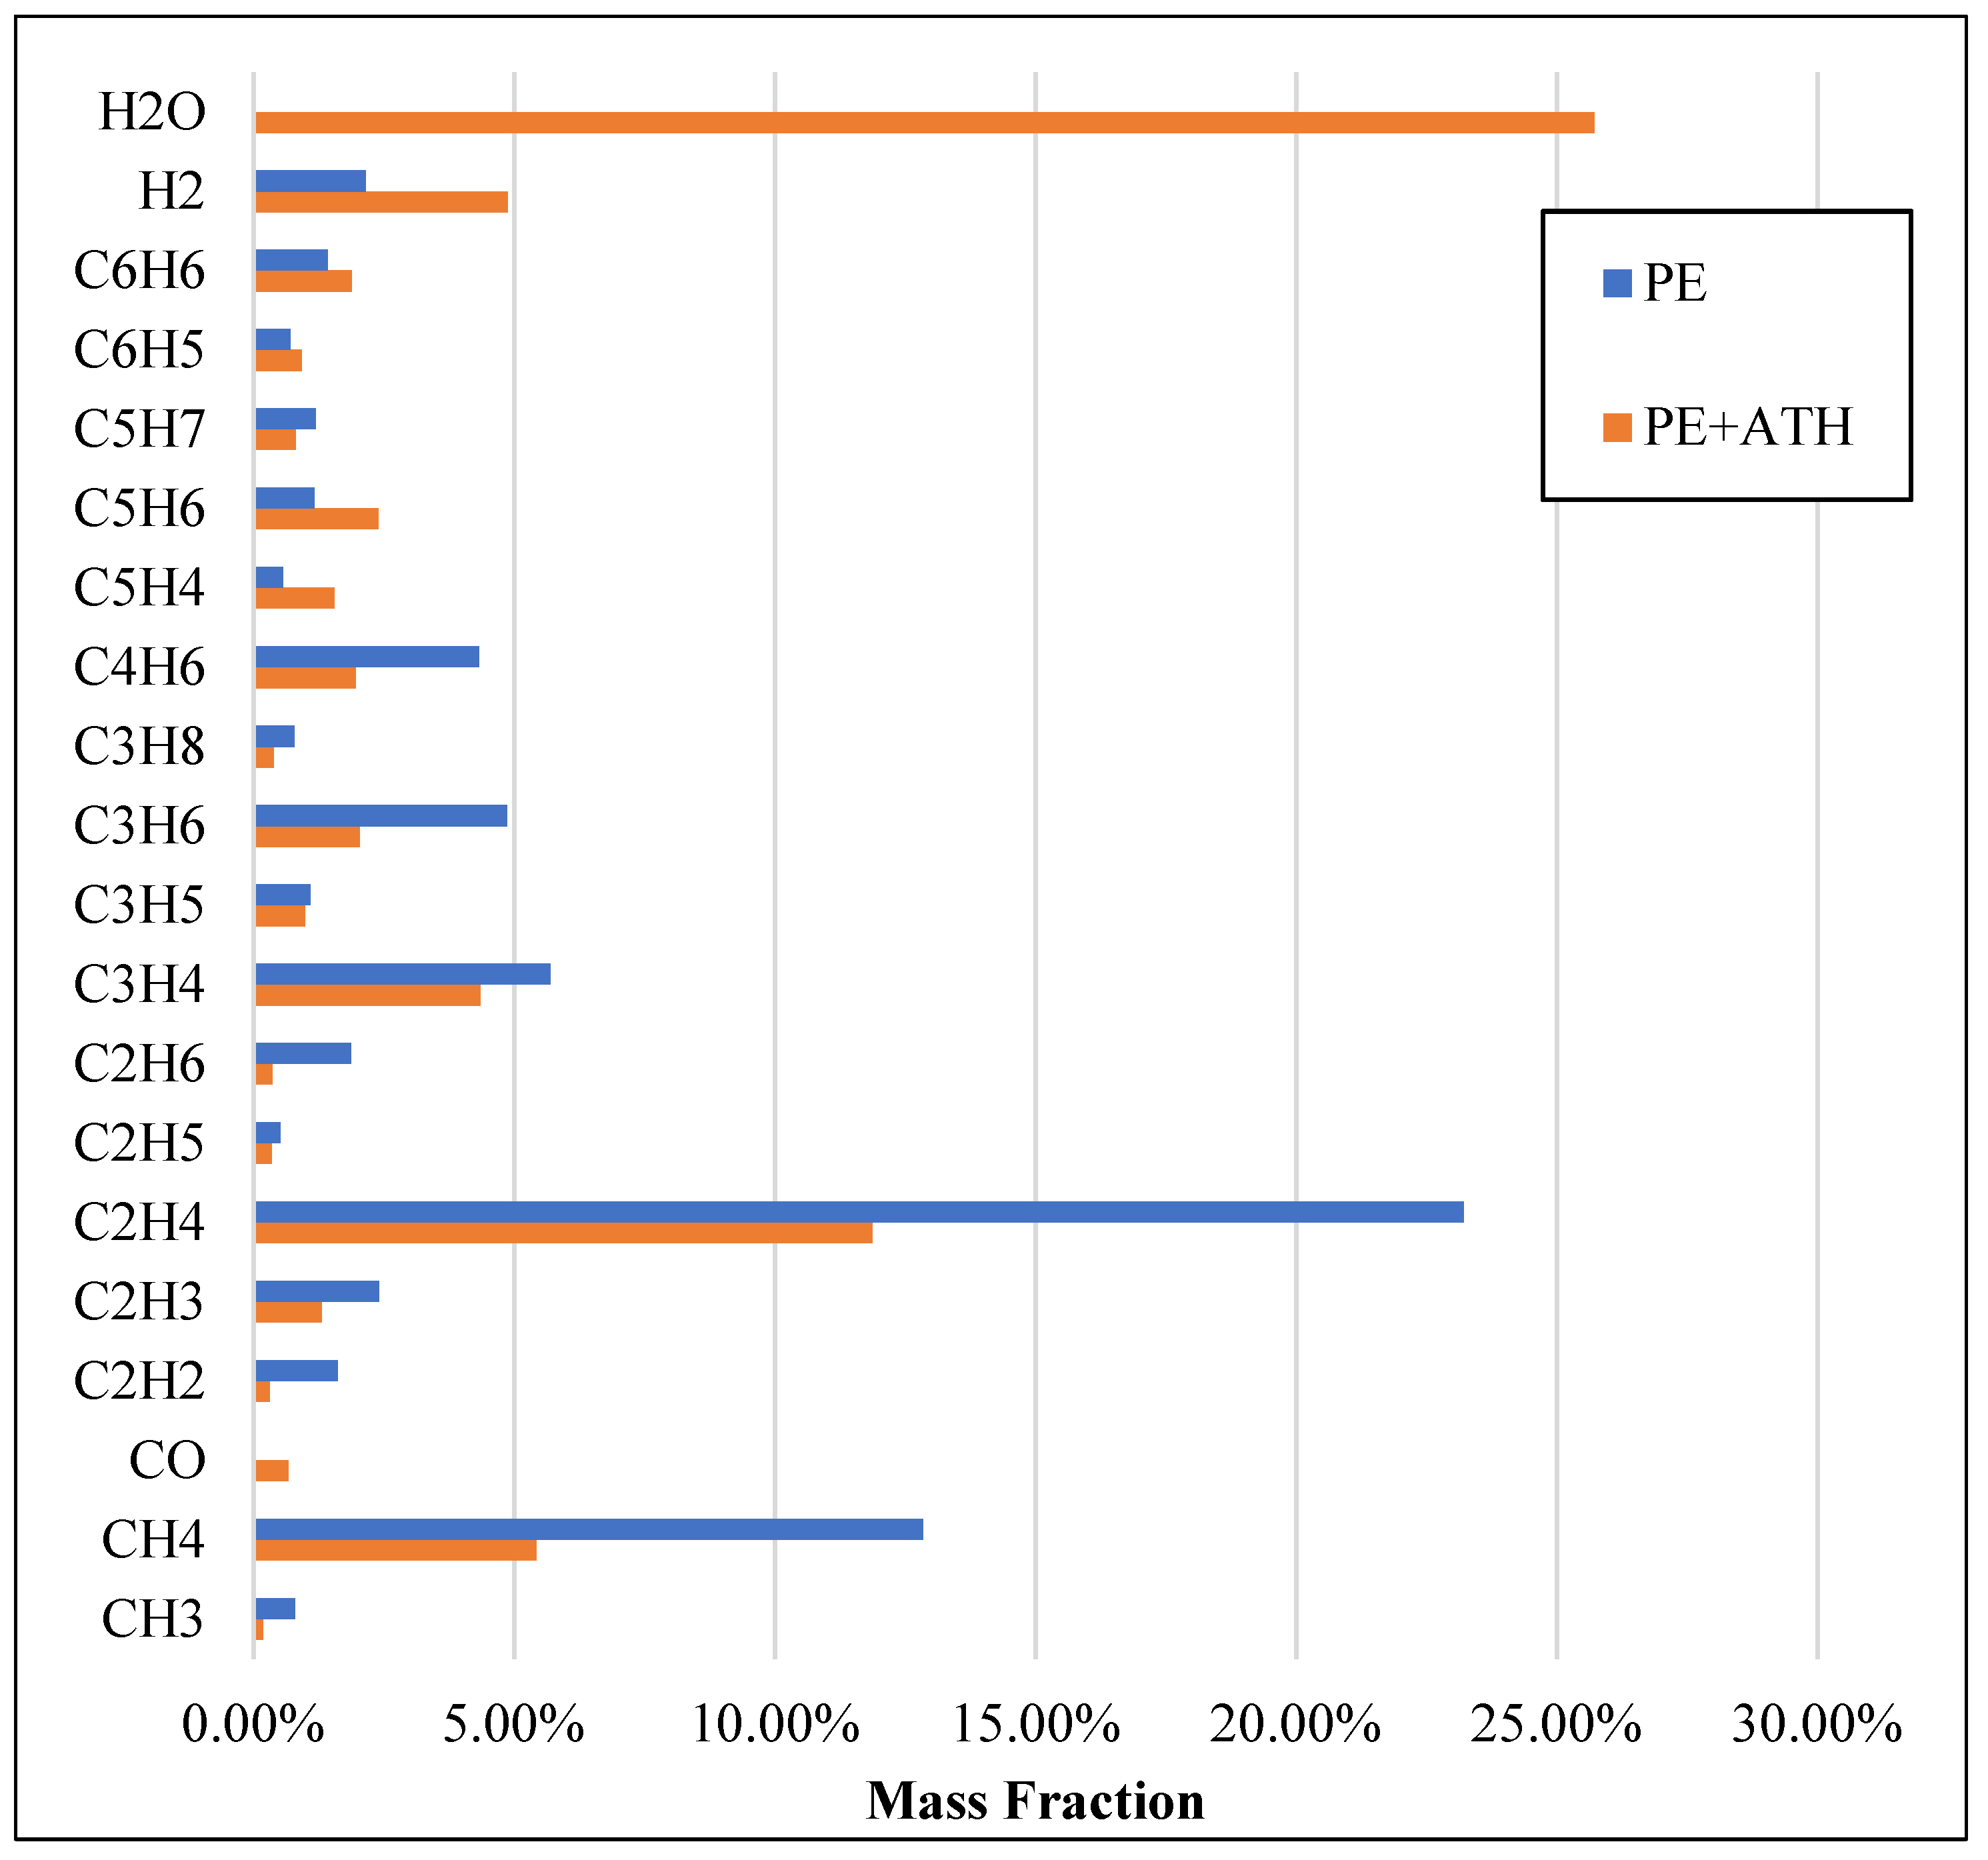
2.3. Incorporating MD into Detailed Chemistry Kinetics

The detailed chemical reaction mechanism GRI-Mech 3.0 [32] and CHEMKIN 19.2 [33] were used to generate the flamelet library for the combustion model. The initial 53 species flamelet library was reduced to 16 species by applying a mixture fraction cut-off to optimise the computational efficiency of the detailed chemistry model. The list of species includes H2, H, O, O2, OH, H2O, HO2, CH3, CH4, CH2O, CO, CO2, C2H2, C2H4, C2H6, C3H6, N2. The major selective combustion and toxic species at the maximum and minimum scalar dissipation rates for the three cases are displayed in Figure 8. From the flamelet profiles, it can be observed that the mass fraction of major combustion products, such as CO2 and H2O is at a maximum at around the stoichiometric where complete combustion occurs, passing the stoichiometric results in intermediate species, such as CO and as incomplete combustion occurs.
Figure 8a,b shows the flamelet profiles generated using 100% C2H4 as the parent fuel and the volatiles gas mixture characterised via MD simulation, respectively. Comparing both profiles, it can be seen that the flamelet profiles from MD simulation resulted in a noticeable decrease in both CO and CO2 and an increase in H2O and H2. More specifically, applying pure C2H4 as the parent fuel would result in little to no H2 formations, which is unrealistic since it is widely known that significant hydrogen is produced from the polymer pyrolysis process. Subsequently, many fire codes implement a prescribed H2 yield to overcome this issue. Another side point to note is that the scalar dissipation rate close to flame extinction is approximately 176 for pure C2H4 and decreases to approximately 150 when the MD gas mixture was applied. The scalar dissipation represents the level of flame straining/stretching caused by turbulence, leading to the non-uniformity of the mixture fraction from the chemical equilibrium. Focusing on Figure 8c, which shows the flamelets profiles for PE/ATH, it can be seen that there is a further decrease in CO and CO2 formations and is replaced with a significant increase in H2O formation. As previously identified from the MD simulation, ATH operates by a dehydration mechanism that releases water vapour (H2O), causing a dilution of combustible gas and oxygen concentration. This dilution effect from ATH is reflected in the combustion flamelet profiles, with reduced combustion resulting in less CO and CO2 formation.

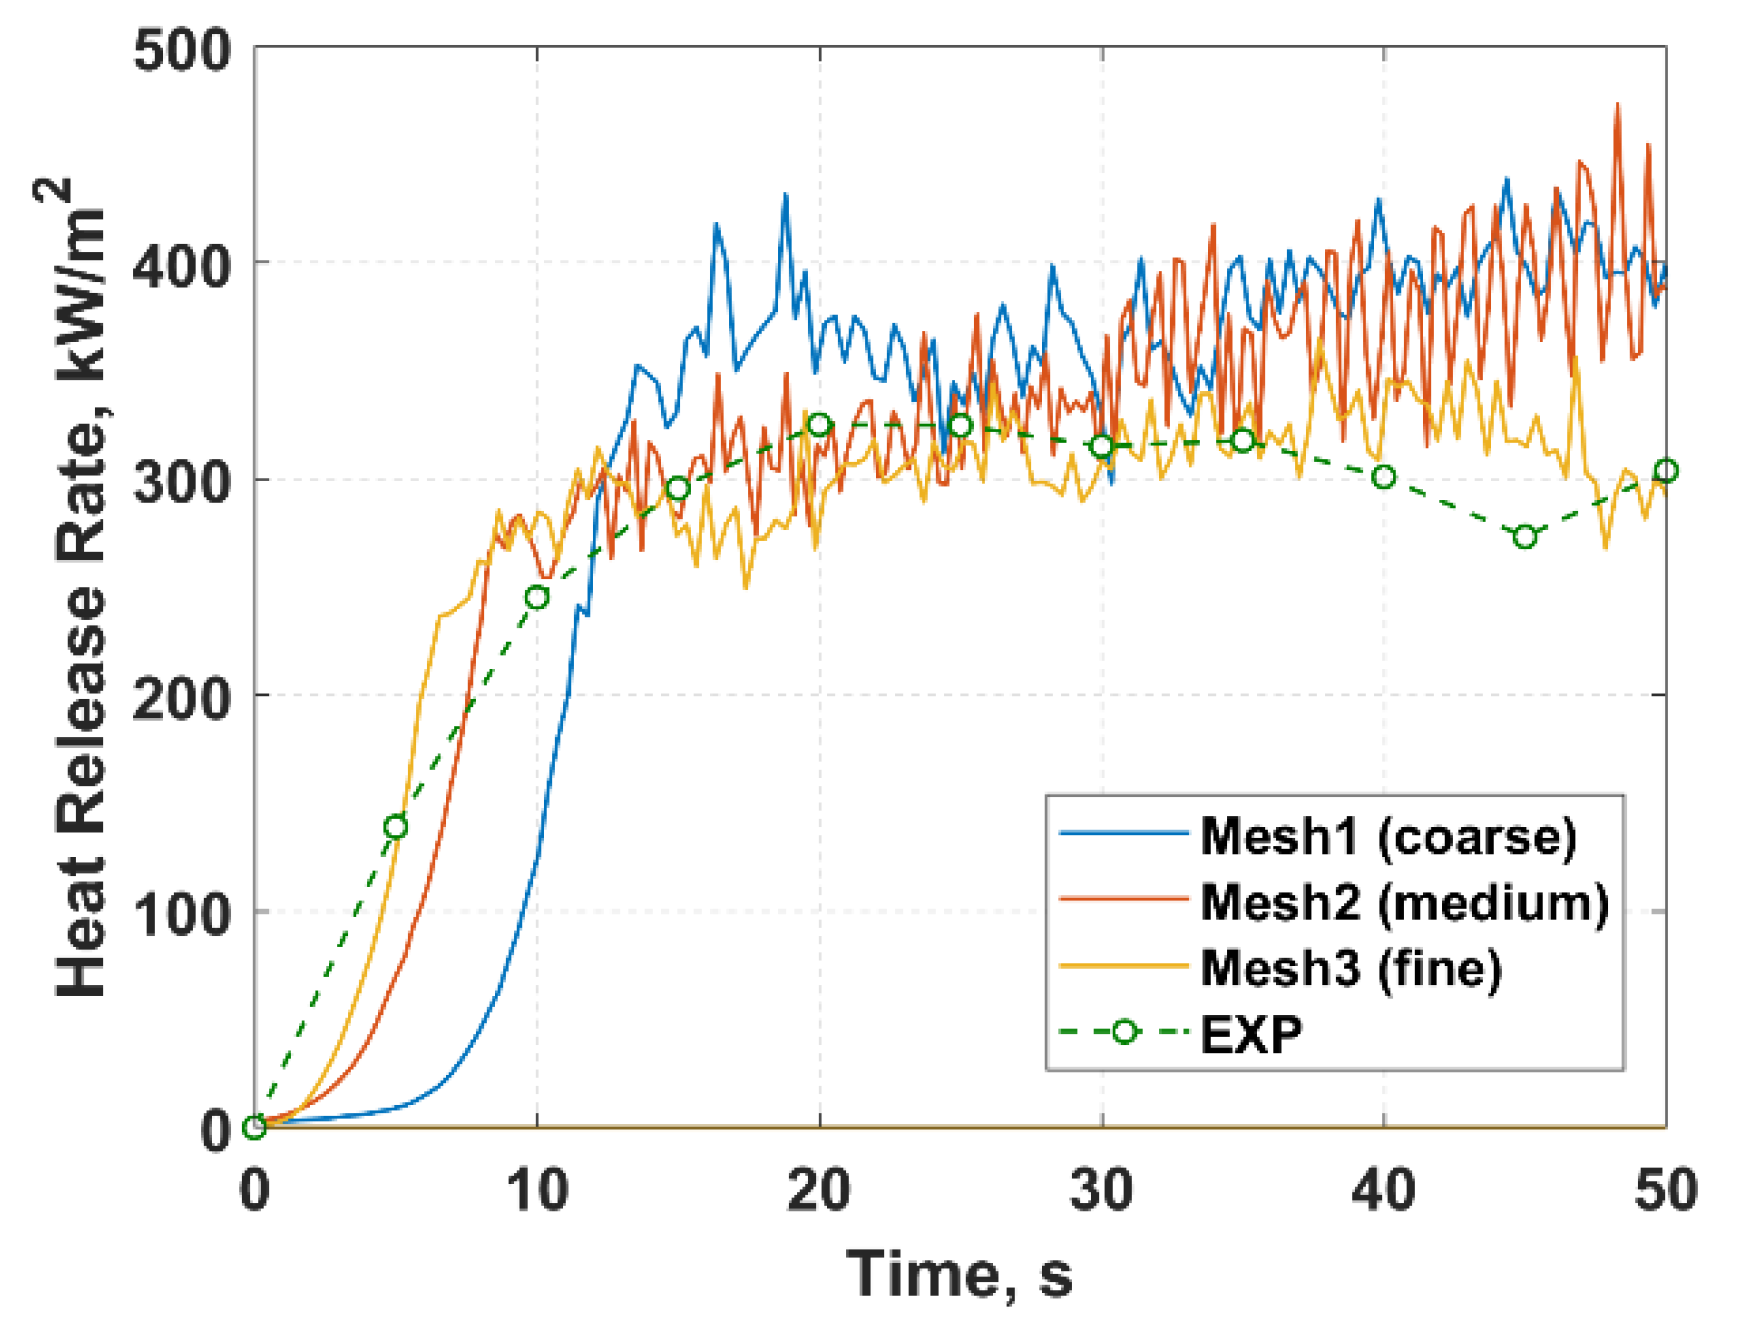
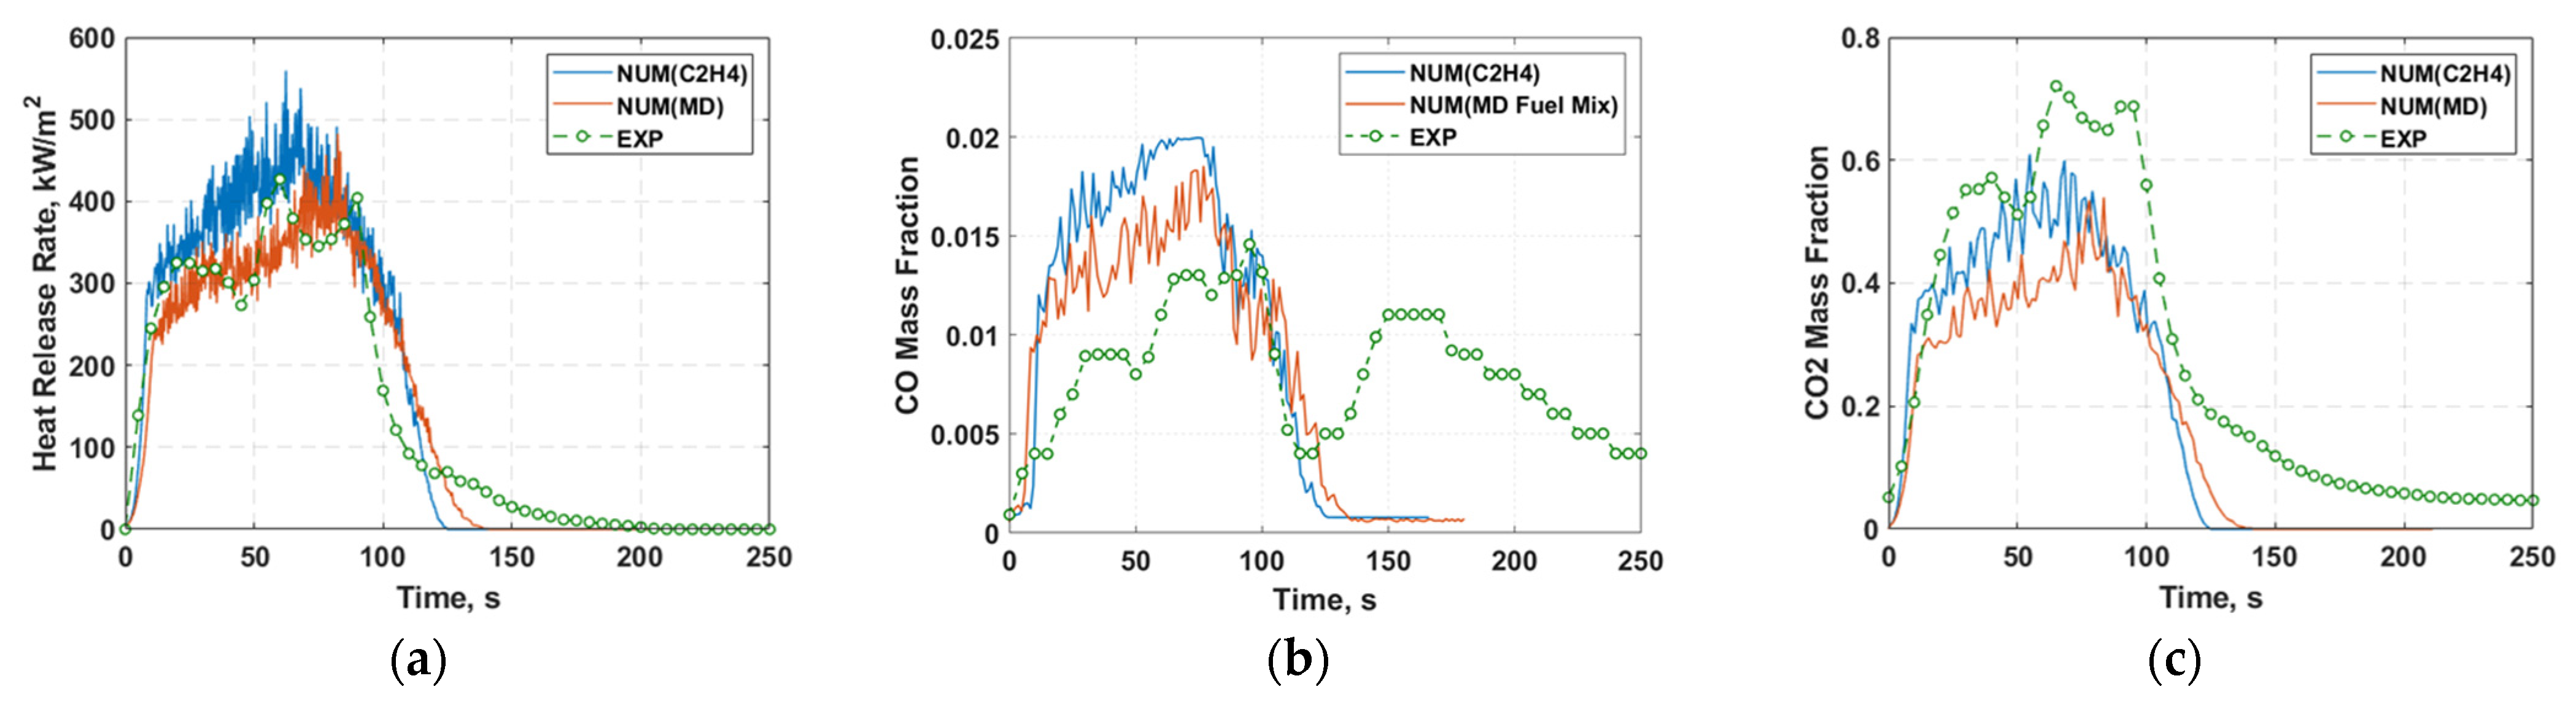
2.4. Cone Calorimeter Simulation

For validation and verification, numerical simulations have been performed based on the cone calorimeter experiment with computational geometry illustrated in Figure 9. The computational domain consists of the cone geometry, and a 60 mm long cylindrical extended region was applied from the cone outlet with a diameter of 90 mm.
A grid sensitivity analysis was performed on three mesh systems constructed based on the characteristic length analysis [42], detailed in Table 2. The heat release rate profile was used for comparison, as presented in Figure 10. The heat release rate for the first 50 s was used to analyse mesh convergence to reduce the computational time required for the test. The results show that the ignition time changed significantly from approximately 5.50 s for the coarse mesh to 2.37 s for the medium mesh (56.9% difference). Comparing the medium to fine mesh, the ignition time further converged from 2.37 s to 2.12 s with a difference of 6.3%. Furthermore, it can be observed that the mesh refinement resulted in a decrease in the overall heat release rate and converged to match more closely with the experimental data. Considering the convergence results, the 1.5 mm uniform mesh was adopted in this numerical simulation.
Figure 11a presents the numerically predicted heat release rate (HRR) profiles of the polyethylene cone simulations incorporating pure C2H4 (ethylene) and volatiles gas mixture from molecular dynamics simulation as the combustion chemical kinetics fuel precursors. The overall experimental trend of the heat release rate profiles was successfully captured in the numerical simulations. The single heat release rate peak predicted by the numerical model was in agreement with experimental data. Furthermore, considering the evaluated fuel gas volatile composition resulting from the MD pyrolysis breakdown delivers a more realistic HRR profile that closely matches the cone calorimeter experiment. In contrast, the assumption that pure C2H4 as the parent fuel yielded an overestimation of the HRR profile since the purity of the combustible volatile by right should not be 100% after the pyrolytic reactions, which this behaviour can be reflected in the MD model.
Figure 11b,c show the concentrations of the carbon monoxide (CO) and carbon dioxide (CO2) contents at the top cone outlet of the computational domain compared to experimental measurements. The results present the effects of changing the parent fuel based on molecular dynamics simulation on the formation of toxic by-products. It can be observed that by assuming the combustion fuel precursor to be purely C2H4, the amount of CO/CO2 concentrations generated is greater than that compared to the cases with the MD inputs.
Figure 12 illustrates the numerically predicted heat release rate profiles of the simulations between PE and PE/ATH based on MD input. As shown in Figure 12a, the peak heat release rate was reduced by 34.2% compared to pure PE. It can be observed that the reduction in heat release rate led by the addition of ATH flame retardant is replicated in the cone simulations.
The concentration of H2O species for the PE/ATH simulation applying C2H4 and MD inputs as the parent fuel is depicted in Figure 13. The generation of H2O species translates to water vapour formation, which is generally recognised as one of the major fire suppression mechanisms. As can be seen from the figure, the amount of H2O content significantly increases from PE/ATH when the MD inputs were applied compared to a pure reaction fuel. As mentioned previously, the intrinsic vaporisation properties of ATH when incorporated into PE promote a supplementary chemical pathway for rapid vaporisation, leading to increased moisture level after the pyrolytic process. Therefore, before exhibiting the combustion process, there was a considerable H2O content. In addition, the increased formation of H2O will also result in a reduction in combustible fuel gas volatile, thus further lowering the heat release rate during the burning process. The result demonstrates the application of the proposed MD framework to extract the flame retardant mechanisms to the CFD combustion model and provide a better representation of the gas decomposition process. It allows the CFD model to simulate the underlying flame retardant mechanism offered by ATH that suppresses the peak heat release rate.

3. Materials and Methods

The mathematical models and characterisation methods are presented in the following sections.

3.1. Molecular Dynamics

ReaxFF is an empirical bond-order-based reactive forcefield and can explicitly describe chemical reactions within complex systems. It is commonly applied to describe the general relationship between bond distance and bond order and between bond order and bond energy. This complex interaction leads to the proper dissociation of bonds to separated atoms. The molecular movement and inter-atomic interactions are governed by Newton’s second law:
F = m a = m d v d t = m d 2 x d t 2
F = E
where F is the instantaneous force acting on a particle with mass m, acceleration a, v and x are the instantaneous particle velocity and position respectively, and t is the time. E the potential energy function and is the differential operator. MD is based on the general relationship between bond distance and bond order and the bond energy that leads to the dissociation of bonds to separate atoms. The energy function can be determined by:
E s y s t e m = E b o n d + E o v e r + E u n d e r + E v a l + E p e n + E t o r s + E c o n j + E v d W a a l s + E C o u l o m b
where all the E terms present the energy associated with the bond, over-and under-coordinated atom, valence angle term, penalty energy, torsion energy, conjugation effects to molecular energy, nonbonded van der Waals interaction and Coulomb interaction, respectively. The LAMMPS Molecular Dynamics Simulator [43] was applied to perform the numerical simulations. The reac/c package [44] was used to compute the ReaxFF potentials.

Molecular System Configuration and Simulation Details

In the current study, two materials were considered in the ReaxFF simulations, namely PE and aluminium trihydroxide (ATH). Owing to the existence of aluminium atoms, the reactive forcefield “AlCHO” proposed by Hong et al. was adopted [45]. Firstly, the molecular structure of PE was constructed by the compression of linear polymer chains, followed by an annealing process to form an amorphous structure, where the initial structures were slowly heated from 300 K to 600 K and rapidly quenched to 300 K. The subsequently annealed geometries were then relaxed using a conjugate gradient minimisation scheme. The initial model structure was created by PACKMOL [46] comprising of 4 linear PE chains (n = 50) in a 20 nm × 20 nm × 4 nm simulation box (200 carbon atoms in total), with a density of 0.93 g/cm3. Similar to the approach adopted by Varri and Paajanen [30], Gibbsite was introduced to represent the crystal structure of ATH, where two dioctahedral layers are related horizontally. The monoclinic unit cell comprised of two planes has 16 Al(OH)3 units. Five unit cells (80 Al(OH)3 units, 560 atoms) were then implemented through PACKMOL to achieve the proposed weight percentage in the current study (25 wt%). The final structures of the PE and PE/ATH are shown in Figure 14. For the thermal decomposition simulations involving pure PE and PE/ATH composites, the temperature and pressure of the system were regulated using the Nose-Hoover thermostat and barostat with a damping coefficient of 100 fs [47]. Various MD-ReaxFF studies on polymer degradation have suggested high artificial temperatures to promote sufficient atomic motion and molecular collision, with reasonable computational cost [29,36,48,49,50,51]. Hence, the simulations were carried out for 200 ps in a range of artificial temperature from 2800 K to 3800 K for PE and PE/ATH composites pyrolysis analysis.

3.2. Computational Fluid Dynamics

The fire model was developed using ANSYS Fluent version 19.2, extending a three-dimensional porous media pyrolysis model from previous work [4]. The solid pyrolysis model was developed with user-defined functions (UDF) which describe the solid thermal degradation process and porous properties of the sample. UDF allows customization for boundary conditions [52], material properties [53,54], source terms [4] and model parameters [55,56]. The Wall-Adapting Local Eddy-viscosity was employed to resolve the subgrid-scale eddies, and the Moss-Brookes semi-empirical soot model was implemented to handle the soot concentration within the cone computational domain [57]. The complex fluid motion and heat transfer of a turbulent reacting non-premixed diffusion flame is governed by the equations of mass, momentum and energy. Conservation of scalar properties, such as gas chemical species is governed by a transport equation. For practical simulation of a weak buoyancy-driven flame, several assumptions are made including (i) the low Mach number flow equations are considered, (ii) the thermophysical properties are constant and (iii) the ratio between mass and thermal diffusivity (Lewis number) is unity [58,59]. Accordingly, the following form of the governing equations are utilised in this simulation study:
Mass conservation equation:
ρ t + ( ρ u ) = S m  
Momentum conservation equation:
ρ ¯ u i ˜ t + x i ( ρ ¯ u i ˜ u j ˜ ) = p ¯ x i τ ¯ i j x j τ i j s g s x j + ρ ¯ g + m ˙ b u b , i ˜ ¯  
The term m ˙ b u b , i represents the bulk source term and τ i j s g s are the subgrid-scale stresses.
Energy conservation equation:
t ( ρ h s ) + · ( ρ h s u ) = D p ¯ D t + Q ˙ c Q ˙  
where Q ˙ c represents the heat release rate per unit volume from a combustion reaction and Q ˙ denotes the conductive, diffusive, and radiative heat fluxes:
Q ˙ = k T α h s , α ρ D α Z α + Q ˙ r  
where k is the thermal conductivity and D α is the diffusivity of species α .

3.2.1. Pyrolysis Model

For the pyrolysis model, it is assumed that: (i) the release of fuel is instantaneous, (ii) there are no porosity and moisture effects, and (iii) the fuel is injected at the surface of the pyrolysing solid. The pyrolysis process is driven by the solid fuel temperature T s .computed by the one-dimensional heat conduction equation at the direction to the depth of the solid fuel:
ρ s c s T s t = x [ k s T s x ] + Q ˙ p + Q ˙ r  
The source terms Q ˙ p and Q ˙ r refers to the net heat gain due to chemical reactions during pyrolysis and radiation absorption, respectively. The pyrolysis source term can be determined by the equation:
Q ˙ p = ρ s i = 1 N R r i H r , i
where H r , i is the heat of reaction and r i is the thermal degradation rate computed in the form of the Arrhenius expression:
r i = c i ( ρ s ρ s 0 ) n i A i e x p ( E a , i R T S )
As thermal degradation can consist of multiple parallel reaction mechanisms, the i subscript denotes the individual reaction components with the corresponding mass fraction c i and pyrolysis kinetic parameters E a , i and A i . The total thermal degradation rate is determined by the sum of all reaction components and the amount of fuel releases m ˙ f u e l released at the material surface is provided as:
m ˙ f u e l = ρ s V i = 1 N R r i  
where V is the unit cell volume. It is assumed that the mass loss is fully converted into the parent fuel of the combustion model.

3.2.2. Turbulence

The Wall-Adapting Local Eddy-viscosity (WALE) model developed Nicoud and Ducros [60], is based on the Smagorinsky [61] LES framework but is more effective at near-wall conditions and wall-bounded flows. The turbulent viscosity μ T is given by:
μ T = ρ L s 2 ( S i j d S i j d ) 3 2 ( S i j S i j ¯ ) 5 2 + ( S i j d S i j d ) 5 4
The mixing length for sub-grid scales L s and rate-of-strain tensor S i j d are determined in the following equations:
L s = min ( κ d , C w Δ )
S i j d = 1 2 ( g ˜ i j 2 + g ˜ j i 2 ) 1 3 δ i j , g ˜ i j 2 = u ˜ i x j
C w is the WALE model constant, prescribed as 0.5 validated previously for various fire simulation studies [62,63]. WALE detects the turbulent structure by the combination of strain and rotations rate so that the turbulent viscosity term will be null naturally at the wall boundary without the inclusion of a damping function.

3.2.3. Detailed Chemistry Combustion

The strained laminar flamelet model for non-premixed combustion has been adopted. It assumes the fuel burns instantly when mixed with the oxidiser. The combustion chemical source term which appears in the energy equation is calculated based on a fast-chemistry mixture fraction model. In this model, the detailed chemical kinetics of the oxidation process of the parent fuel was considered using the strained laminar flamelet approach. The temperature and chemical species generation (denoted by m) is determined by the multiple flamelets (M) as a function of mixture fraction f , fluctuation of mixture fraction f , and scalar dissipation term χ :
m = M ( f ,   χ )   P ( f , χ , f )   d f d χ
where P is the corresponding beta probability density function (PDF). The scalar dissipation χ is introduced to depict the level of flame straining/stretching leading to the non-uniformity of mixture fraction from the chemical equilibrium. The scalar dissipation is given by:
χ = C x ( μ + μ T ) ρ σ T | f | 2
The amount of heat generation via combustion is thus determined by the summation of species mass fraction multiplying its heat of formation.
Q ˙ c = 1 2 ρ χ i = 1 N [ 0 1 ( h s i 2 M i ζ 2 P ( ζ , ζ , χ ) ) d ζ ]
where h s i depicts the heat of formation of the corresponding i-th species. The detailed chemical reaction mechanism GRI-Mech 3.0 [64] and CHEMKIN 19.2 [65] was used to generate the flamelet library for the combustion model. GRI-Mech 3.0 is very well-validated and shown to produce accurate and reliable results for alkane fuels [11,55,58].

3.2.4. Soot Formation

The Moss-Brookes semi-empirical soot model [57] was implemented where acetylene is considered as the soot precursor. Numerical studies have shown that the Moss-Brookes soot model combined with detailed kinetics results in significant improvements in the prediction of soot volume fraction [66,67]. This model is a two-equation semi-empirical soot model where acetylene is considered as the soot precursor and solves transport equations for normalised radical nuclei concentration b n u c * and soot mass fraction Y s o o t :
t ( ρ Y s o o t ) + · ( ρ Y s o o t u ˜ ) = · ( μ t σ s o o t Y s o o t ) + d M s o o t d t
t ( ρ b n u c * ) + · ( ρ b n u c * u ˜ ) = · ( μ t b n u c * b n u c * ) + 1 10 15   d N s o o t d t
where M s o o t is the soot mass concentration, N s denotes soot particle number density.

3.2.5. Radiation

The radiative heat transfer was modelled using the filtered radiative transfer equations (FRTE) for non-scattering gray gas solved by the discrete ordinates method (DOM) with the S4 quadrature scheme [68]. The discrete radiation source term Q ˙ r that appears in the energy equation is determined as:
Q ˙ r = 4 k ¯ a E b + j = 1 24 w j k ¯ a I ¯ j
where the blackbody radiation is represented by E b = σ T 4 , σ is the Stefan-Boltzmann constant and I ¯ j is the radiation intensities that span over the solid angles range of 4 π around a point in space. The filtered gas absorption coefficient k ¯ a was determined as a summation of the gas absorption coefficient approximated using the Weighted Sum of Gray Gases Model [69] and soot [70].

3.3. Experiment

3.3.1. Thermogravimetry

Thermogravimetry is a proven method to study the thermal decomposition of a material. The thermal gravimetric (TGA) analysis was carried out on a Netzsch TG 209 F3 Tarsus thermoanalyser instrument (Netzsch, Selb, Germany) from room temperature (21 °C) to 1000 °C in a nitrogen atmosphere under three different heating rates, namely 5, 10 and 20 K/min. The specimens were approximately 10 mg in mass, and each test was performed twice to ensure consistency of the data.

3.3.2. Cone Calorimetry

The flammability (i.e., heat release) of the material samples was examined via Cone Calorimetry according to ISO 5660 standards to study the flaming behaviour (i.e., ignition time, heat release rate and burn duration) and their corresponding smoke, CO2 and CO production. The tests were performed on an iCone Classic Calorimeter (Fire Testing Technology, East Grinstead, UK). All samples were cut to 100 mm × 100 mm, then wrapped in aluminium foil with the upper surface exposed. The distance between the cone heater and test surface was set as 25 cm. The measurements were carried out by mounting the sample holder in the horizontal position under atmospheric conditions with a nominal exhaust fan airflow rate of 0.0026 m3/s for all experiments. Three samples of each material were examined under 35 kW/m2 incident heat flux.

4. Conclusions

The fundamental thermal degradation process from solid fuel to gas volatiles is still one of the major challenges in the field of pyrolysis modelling. A multi-scale modelling approach was proposed to address this significant knowledge gap by applying the kinetics parameters and detailed pyrolysis gas volatiles (i.e., parent combustion fuel, key precursor species) extracted from Molecular Dynamics (MD) to enable a more realistic detailed chemistry combustion in Computational Fluid Dynamics (CFD) fire model. This multi-scale modelling is a potential technique for the simulation of combustible polymer materials, as it allows to describe them without the need of performing costly experiments. In this study, the key properties associated with the burning behaviour of pure polyethylene (PE) and polyethylene with aluminium trihydroxide (PE/ATH) were analysed by molecular dynamics simulations. The microscopic pyrolysis behaviours of the polymers investigated by molecular dynamics were in agreement with the TGA data. The pyrolysis reaction kinetics were successfully calculated by analysing the breakdown rate of the underlying monomer structures at different temperatures. Focusing on the PE with ATH, the MD simulations were able to show the pyrolysis process as the ATH component leads to the increased formation of H2O molecules. Subsequently, it leads to a reduced amount of combustible fuel gas volatile, thus reducing the combustion by-products and heat release rate.
From the MD simulations, the material kinetics parameters were directly applied as inputs into a CFD pyrolysis model to simulate cone calorimeter experiments. The model incorporates strained laminar combustion modelling with detailed chemical kinetics, soot formation, subgrid scale turbulence, and radiation models. Furthermore, the detailed pyrolysis gas volatiles from MD was applied to generate the flamelet library for the combustion model. The overall trend of the heat release rate profiles was successfully captured in the numerical simulation. The carbon dioxide and carbon monoxide comparisons were also aligned with experimental results. Furthermore, considering the evaluated fuel gas volatile composition resulting from the molecular dynamics pyrolysis breakdown delivers a more realistic heat release rate profile that closely matches the cone calorimeter experiment than using a single parent fuel.
To summarise, the utilisation of the MD model delivers an in-depth understanding of the pyrolysis and chemical decomposition of molecules of the polymer composites. This allows us to realise the composition of fuel gas volatiles and incorporate them into CFD simulations models with a detailed chemistry combustion sub-module to interpret the data. The underlying flame retardant mechanisms can be described from a fundamental chemistry standpoint through this proposed framework. For instance, the rapid vaporisation effect offered by ATH was studied and its influence on the heat release rate reductions and chemical by-products formations were identified.

Author Contributions

Conceptualization, T.B.Y.C. and A.C.Y.Y.; methodology, T.B.Y.C., I.M.D.C.C. and A.C.Y.Y.; software, T.B.Y.C. and I.M.D.C.C.; validation, T.B.Y.C. and I.M.D.C.C.; formal analysis, T.B.Y.C., I.M.D.C.C. and W.Y.; resources, S.C.P.C., Q.N.C., J.Z. and G.H.Y.; data curation, T.B.Y.C. and I.M.D.C.C.; writing—original draft preparation, T.B.Y.C., I.M.D.C.C. and A.C.Y.Y.; writing—review and editing, A.C.Y.Y. and Q.N.C.; visualization, T.B.Y.C. and I.M.D.C.C.; supervision, A.C.Y.Y. and G.H.Y.; project administration, A.C.Y.Y. and G.H.Y.; funding acquisition, G.H.Y. All authors have read and agreed to the published version of the manuscript.

Funding

This research was funded by the Australian Research Council (ARC Industrial Training Transformation Centre, grant number: IC170100032) and the Australian Government Research Training Program Scholarship. All financial and technical supports are greatly appreciated.

Institutional Review Board Statement

Not applicable.

Informed Consent Statement

Not applicable.

Data Availability Statement

The data presented in this study are not available from the authors.

Conflicts of Interest

The authors declare no conflict of interest.

Nomenclature

AExponential factor
aAcceleration
b n u c * Normalised radical nuclei concentration
ciMass fraction
C w WALE model constant
DDiffusivity
E a Activation energy
EsystemSystem energy
EbondBond energy
EoverOver-coordinated atom energy
EunderUnder-coordinated atom energy
EvalValence angle term
EpenPenalty energy
EtorsTorsion energy
EconjConjugation effects to molecular energy
EvdWaalsNonbonded van der Waals interaction
ECoulombCoulomb interaction
FInstantaneous force
f Mixture fraction variance
gGravity
HEnthalpy
H R Heat of reaction
h s i Heat of formation
I ¯ j Radiation intensities
KThermal conductivity
k ¯ a Summation of the gas absorption coefficient
L s Mixing length for sub-grid scales
M s o o t Soot mass concentration
mMass
m ˙ f u e l Fuel released at material surface
N s o o t Number density of soot particles
niReaction order of the reaction
PPressure
QHeat released by the fluid combustion
Q ˙ p Net heat gain due to chemical reactions during pyrolysis
Q ˙ r Net heat gain due to chemical reactions via radiation absorption
q r Flux equation of thermal radiation
RGas constant
R i Pyrolysis reaction rates
S i j d Rate-of-strain tensor
TAbsolute temperature
TsSolid fuel temperature
ttime
uvelocity
χ Scalar dissipation
xInstantaneous particle position
YsootMass fraction of soot
ZElemental mass fraction
ρ Density
τ i j s g s Subgrid-scale stresses
μ t Turbulent viscosity
κ d Von Kármán constant

Abbreviations

ATHAluminium (tri)hydroxide
CCarbon
CFDComputational Fluid Dynamics
COCarbon Monoxide
CO2Carbon Dioxide
C2H4Ethylene
FDSFire Dynamic Simulator
HRRHeat Release Rate
H2OWater
LESLarge Eddy Simulation
MDMolecular Dynamics
MD-CNMoleculary Dynamics Carbon Number Approach
PEPolyethylene
ReaxFFReactive Forcefield
TGAThermogravimetric Analysis
WALEWall Adapting Local Eddy-viscosity
wt%weight percentage

References

  1. Evegren, F.; Hertzberg, T. Fire safety regulations and performance of fibre-reinforced polymer composite ship structures. Proc. Inst. Mech. Eng. Part M J. Eng. Marit. Environ. 2017, 231, 46–56. [Google Scholar] [CrossRef]
  2. Morgan, A.B.; Gilman, J.W. An overview of flame retardancy of polymeric materials: Application, technology, and future directions. Fire Mater. 2013, 37, 259–279. [Google Scholar] [CrossRef] [Green Version]
  3. Yuen, A.C.Y.; Chen, T.B.Y.; Yeoh, G.H.; Yang, W.; Cheung, S.C.-P.; Cook, M.; Yu, B.; Chan, Q.N.; Yip, H.L. Establishing pyrolysis kinetics for the modelling of the flammability and burning characteristics of solid combustible materials. J. Fire Sci. 2018, 36, 494–517. [Google Scholar] [CrossRef] [Green Version]
  4. Yuen, A.C.Y.; Chen, T.B.Y.; Wang, C.; Wei, W.; Kabir, I.; Vargas, J.B.; Chan, Q.N.; Kook, S.; Yeoh, G.H. Utilising genetic algorithm to optimise pyrolysis kinetics for fire modelling and characterisation of chitosan/graphene oxide polyurethane composites. Compos. Part B Eng. 2020, 182, 107619. [Google Scholar] [CrossRef]
  5. Mallet, V.; Keyes, D.E.; Fendell, F.E. Modeling wildland fire propagation with level set methods. Comput. Math. Appl. 2009, 57, 1089–1101. [Google Scholar] [CrossRef] [Green Version]
  6. Rochoux, M.C.; Delmotte, B.; Cuenot, B.; Ricci, S.; Trouvé, A. Regional-scale simulations of wildland fire spread informed by real-time flame front observations. Proc. Combust. Inst. 2013, 34, 2641–2647. [Google Scholar] [CrossRef]
  7. Chen, T.B.Y.; Yuen, A.C.Y.; Yeoh, G.H.; Timchenko, V.; Cheung, S.C.P.; Chan, Q.N.; Yang, W.; Lu, H. Numerical study of fire spread using the level-set method with large eddy simulation incorporating detailed chemical kinetics gas-phase combustion model. J. Comput. Sci. 2018, 24, 8–23. [Google Scholar] [CrossRef]
  8. McGrattan, K.B.; McDermott, R.J.; Weinschenk, C.G.; Forney, G.P. Fire Dynamics Simulator Technical Reference Guide; National Institute of Standards and Technology: Gaithersburg, MD, USA, 2017.
  9. Ding, Y.; Wang, C.; Lu, S. Modeling the pyrolysis of wet wood using FireFOAM. Energy Convers. Manag. 2015, 98, 500–506. [Google Scholar] [CrossRef]
  10. Yuen, R.K.K.; Yeoh, G.H.; de Vahl Davis, G.; Leonardi, E. Modelling the pyrolysis of wet wood—I. Three-dimensional formulation and analysis. Int. J. Heat Mass Transf. 2007, 50, 4371–4386. [Google Scholar] [CrossRef]
  11. Chen, T.B.Y.; Yuen, A.C.Y.; Wang, C.; Yeoh, G.H.; Timchenko, V.; Cheung, S.C.P.; Chan, Q.N.; Yang, W. Predicting the fire spread rate of a sloped pine needle board utilizing pyrolysis modelling with detailed gas-phase combustion. Int. J. Heat Mass Transf. 2018, 125, 310–322. [Google Scholar] [CrossRef]
  12. Rein, G.; Lautenberger, C.; Fernandez-Pello, A.C.; Torero, J.L.; Urban, D.L. Application of genetic algorithms and thermogravimetry to determine the kinetics of polyurethane foam in smoldering combustion. Combust. Flame 2006, 146, 95–108. [Google Scholar] [CrossRef] [Green Version]
  13. Mishra, G.; Kumar, J.; Bhaskar, T. Kinetic studies on the pyrolysis of pinewood. Bioresour. Technol. 2015, 182, 282–288. [Google Scholar] [CrossRef] [PubMed]
  14. Ma, Z.; Chen, D.; Gu, J.; Bao, B.; Zhang, Q. Determination of pyrolysis characteristics and kinetics of palm kernel shell using TGA–FTIR and model-free integral methods. Energy Convers. Manag. 2015, 89, 251–259. [Google Scholar] [CrossRef]
  15. Yang, H.; Wang, X.; Yuan, H.; Song, L.; Hu, Y.; Yuen, R.K.K. Fire performance and mechanical properties of phenolic foams modified by phosphorus-containing polyethers. J. Polym. Res. 2012, 19, 9831. [Google Scholar] [CrossRef]
  16. Zhao, Q.; Zhang, B.; Quan, H.; Yam, R.C.M.; Yuen, R.K.K.; Li, R.K.Y. Flame retardancy of rice husk-filled high-density polyethylene ecocomposites. Compos. Sci. Technol. 2009, 69, 2675–2681. [Google Scholar] [CrossRef]
  17. Yuen, A.C.Y.; Chen, T.B.Y.; Lin, B.; Yang, W.; Kabir, I.I.; De Cachinho Cordeiro, I.M.; Whitten, A.E.; Mata, J.; Yu, B.; Lu, H.-D.; et al. Study of structure morphology and layer thickness of Ti3C2 MXene with Small-Angle Neutron Scattering (SANS). Compos. Part C Open Access 2021, 5, 100155. [Google Scholar] [CrossRef]
  18. Nguyen, Q.T.; Tran, P.; Ngo, T.D.; Tran, P.A.; Mendis, P. Experimental and computational investigations on fire resistance of GFRP composite for building façade. Compos. Part B Eng. 2014, 62, 218–229. [Google Scholar] [CrossRef]
  19. Dutta, S.; Kim, N.K.; Das, R.; Bhattacharyya, D. Effects of sample orientation on the fire reaction properties of natural fibre composites. Compos. Part B Eng. 2019, 157, 195–206. [Google Scholar] [CrossRef]
  20. Lin, B.; Yuen, A.C.Y.; Chen, T.B.Y.; Yu, B.; Yang, W.; Zhang, J.; Yao, Y.; Wu, S.; Wang, C.H.; Yeoh, G.H. Experimental and numerical perspective on the fire performance of MXene/Chitosan/Phytic acid coated flexible polyurethane foam. Sci. Rep. 2021, 11, 4684. [Google Scholar] [CrossRef]
  21. Di Martino, G.D.; Carmicino, C.; Mungiguerra, S.; Savino, R. The Application of Computational Thermo-Fluid-Dynamics to the Simulation of Hybrid Rocket Internal Ballistics with Classical or Liquefying Fuels: A Review. Aerospace 2019, 6, 56. [Google Scholar] [CrossRef] [Green Version]
  22. Tyurenkova, V.; Smirnova, M.J. Material combustion in oxidant flows: Self-similar solutions. Acta Astronaut. 2016, 120, 129–137. [Google Scholar] [CrossRef]
  23. Betelin, V.; Kushnirenko, A.; Smirnov, N.; Nikitin, V.; Tyurenkova, V.; Stamov, L. Numerical investigations of hybrid rocket engines. Acta Astronaut. 2018, 144, 363–370. [Google Scholar] [CrossRef]
  24. Tyurenkova, V.V.; Stamov, L.I. Flame propagation in weightlessness above the burning surface of material. Acta Astronaut. 2019, 159, 342–348. [Google Scholar] [CrossRef]
  25. Kushnirenko, A.; Stamov, L.; Tyurenkova, V.; Smirnova, M.; Mikhalchenko, E. Three-dimensional numerical modeling of a rocket engine with solid fuel. Acta Astronaut. 2021, 181, 544–551. [Google Scholar] [CrossRef]
  26. Yuen, A.C.Y.; Chen, T.B.Y.; Li, A.; De Cachinho Cordeiro, I.M.; Liu, L.; Liu, H.; Lo, A.L.P.; Chan, Q.N.; Yeoh, G.H. Evaluating the fire risk associated with cladding panels: An overview of fire incidents, policies, and future perspective in fire standards. Fire Mater. 2021, 45, 663–689. [Google Scholar] [CrossRef]
  27. Ciottoli, P.P.; Malpica Galassi, R.; Lapenna, P.E.; Leccese, G.; Bianchi, D.; Nasuti, F.; Creta, F.; Valorani, M. CSP-based chemical kinetics mechanisms simplification strategy for non-premixed combustion: An application to hybrid rocket propulsion. Combust. Flame 2017, 186, 83–93. [Google Scholar] [CrossRef]
  28. Van Duin, A.C.; Dasgupta, S.; Lorant, F.; Goddard, W.A. ReaxFF: A reactive force field for hydrocarbons. J. Phys. Chem. A 2001, 105, 9396–9409. [Google Scholar] [CrossRef] [Green Version]
  29. Chen, T.B.Y.; Yuen, A.C.Y.; Lin, B.; Liu, L.; Lo, A.; Chan, Q.N.; Zhang, J.; Cheung, S.C.P.; Yeoh, G.H. Characterisation of pyrolysis kinetics and detailed gas species formations of engineering polymers via reactive molecular dynamics (ReaxFF). J. Anal. Appl. Pyrolysis 2020, 153, 104931. [Google Scholar] [CrossRef]
  30. Vaari, J.; Paajanen, A. Evaluation of the reactive molecular dynamics method for Research on flame retardants: ATH-filled polyethylene. Comput. Mater. Sci. 2018, 153, 103–112. [Google Scholar] [CrossRef]
  31. Rahmani, F.; Mahdavi, M.; Nouranian, S.; Al-Ostaz, A. Confinement effects on the thermal stability of poly (ethylene oxide)/graphene nanocomposites: A reactive molecular dynamics simulation study. J. Polym. Sci. Part B Polym. Phys. 2017, 55, 1026–1035. [Google Scholar] [CrossRef]
  32. Lan, Y.; Li, D.; Yang, R.; Liang, W.; Zhou, L.; Chen, Z. Computer simulation study on the compatibility of cyclotriphosphazene containing aminopropylsilicone functional group in flame retarded polypropylene/ammonium polyphosphate composites. Compos. Sci. Technol. 2013, 88, 9–15. [Google Scholar] [CrossRef]
  33. Stoliarov, S.I.; Westmoreland, P.R.; Nyden, M.R.; Forney, G.P. A reactive molecular dynamics model of thermal decomposition in polymers: I. Poly(methyl methacrylate). Polymer 2003, 44, 883–894. [Google Scholar] [CrossRef]
  34. Stoliarov, S.I.; Lyon, R.E.; Nyden, M.R. A reactive molecular dynamics model of thermal decomposition in polymers. II. Polyisobutylene. Polymer 2004, 45, 8613–8621. [Google Scholar] [CrossRef]
  35. Liu, X.; Li, X.; Liu, J.; Wang, Z.; Kong, B.; Gong, X.; Yang, X.; Lin, W.; Guo, L. Study of high density polyethylene (HDPE) pyrolysis with reactive molecular dynamics. Polym. Degrad. Stab. 2014, 104, 62–70. [Google Scholar] [CrossRef]
  36. Wan, Y.; Yu, S.; Jiang, S.; Pei, Q.; Xu, S.; Cao, W.; Liu, X.; Lan, Y. Microscopic pyrolysis mechanism on the octyphenylsiloxane flame retarded polycarbonate by reactive molecular dynamics. J. Anal. Appl. Pyrolysis 2021, 158, 105274. [Google Scholar] [CrossRef]
  37. Li, G.-Y.; Li, A.-Q.; Zhang, H.; Wang, J.-P.; Chen, S.-Y.; Liang, Y.-H. Theoretical study of the CO formation mechanism in the CO2 gasification of lignite. Fuel 2018, 211, 353–362. [Google Scholar] [CrossRef]
  38. Xu, F.; Liu, H.; Wang, Q.; Pan, S.; Zhao, D.; Liu, Q.; Liu, Y. ReaxFF-based molecular dynamics simulation of the initial pyrolysis mechanism of lignite. Fuel Process. Technol. 2019, 195, 106147. [Google Scholar] [CrossRef]
  39. Hong, D.; Li, P.; Si, T.; Guo, X.J.E. ReaxFF simulations of the synergistic effect mechanisms during co-pyrolysis of coal and polyethylene/polystyrene. Energy 2021, 218, 119553. [Google Scholar] [CrossRef]
  40. Fletcher, T.H.; Kerstein, A.R.; Pugmire, R.J.; Solum, M.S.; Grant, D.M. Chemical percolation model for devolatilization. 3. Direct use of carbon-13 NMR data to predict effects of coal type. Energy Fuels 1992, 6, 414–431. [Google Scholar] [CrossRef]
  41. Sinfrônio, F.S.M.; Santos, J.C.O.; Pereira, L.G.; Souza, A.G.; Conceiçăo, M.; Fernandes, V.J., Jr.; Fonseca, V.M. calorimetry, Kinetic of thermal degradation of low-density and high-density polyethylene by non-isothermal thermogravimetry. J. Therm. Anal. Calorim. 2005, 79, 393–399. [Google Scholar] [CrossRef]
  42. DiNenno, P.J.; Drysdale, D.; Beyler, C.L.; Walton, D.W. SFPE Handbook of Fire Protection Engineering, 3rd ed.; National Fire Protection Association: Quincy, MA, USA, 2002. [Google Scholar]
  43. Plimpton, S. Fast Parallel Algorithms for Short-Range Molecular Dynamics. J. Comput. Phys. 1995, 117, 1–19. [Google Scholar] [CrossRef] [Green Version]
  44. Aktulga, H.M.; Fogarty, J.C.; Pandit, S.A.; Grama, A.Y. Parallel reactive molecular dynamics: Numerical methods and algorithmic techniques. Parallel Comput. 2012, 38, 245–259. [Google Scholar] [CrossRef] [Green Version]
  45. Hong, S.; Van Duin, A.C. Atomistic-scale analysis of carbon coating and its effect on the oxidation of aluminum nanoparticles by ReaxFF-molecular dynamics simulations. J. Phys. Chem. C 2016, 120, 9464–9474. [Google Scholar] [CrossRef]
  46. Martínez, L.; Andrade, R.; Birgin, E.G.; Martínez, J.M. PACKMOL: A package for building initial configurations for molecular dynamics simulations. J. Comput. Chem. 2009, 30, 2157–2164. [Google Scholar] [CrossRef]
  47. Hoover, W.G. Canonical dynamics: Equilibrium phase-space distributions. Phys. Rev. A 1985, 31, 1695–1697. [Google Scholar] [CrossRef] [Green Version]
  48. Salmon, E.; van Duin, A.C.; Lorant, F.; Marquaire, P.-M.; Goddard, W.A., III. Early maturation processes in coal. Part 2: Reactive dynamics simulations using the ReaxFF reactive force field on Morwell Brown coal structures. Org. Geochem. 2009, 40, 1195–1209. [Google Scholar] [CrossRef]
  49. Salmon, E.; van Duin, A.C.; Lorant, F.; Marquaire, P.-M.; Goddard, W.A., III. Thermal decomposition process in algaenan of Botryococcus braunii race L. Part 2: Molecular dynamics simulations using the ReaxFF reactive force field. Org. Geochem. 2009, 40, 416–427. [Google Scholar] [CrossRef]
  50. Chenoweth, K.; Cheung, S.; Van Duin, A.C.; Goddard, W.A.; Kober, E.M. Simulations on the thermal decomposition of a poly (dimethylsiloxane) polymer using the ReaxFF reactive force field. J. Am. Chem. Soc. 2005, 127, 7192–7202. [Google Scholar] [CrossRef] [Green Version]
  51. Diao, Z.; Zhao, Y.; Chen, B.; Duan, C.; Song, S. ReaxFF reactive force field for molecular dynamics simulations of epoxy resin thermal decomposition with model compound. J. Anal. Appl. Pyrolysis 2013, 104, 618–624. [Google Scholar] [CrossRef]
  52. Risberg, D.; Risberg, M.; Westerlund, L. CFD modelling of radiators in buildings with user-defined wall functions. Appl. Therm. Eng. 2016, 94, 266–273. [Google Scholar] [CrossRef]
  53. De Cachinho Cordeiro, I.M.; Liu, H.; Yuen, A.C.Y.; Chen, T.B.Y.; Li, A.; Cao, R.F.; Yeoh, G.H. Numerical investigation of expandable graphite suppression on metal-based fire. Heat Mass Transf. 2021. [Google Scholar] [CrossRef]
  54. De Cachinho Cordeiro, I.M.; Liu, H.; Yuen, A.C.Y.; Chen, T.B.Y.; Li, A.; Yeoh, G.H. Numerical assessment of LES subgrid-scale turbulence models for expandable particles in fire suppression. Exp. Comput. Multiph. Flow 2021. [Google Scholar] [CrossRef]
  55. e Silva, V.B.R.; Cardoso, J. Computational Fluid Dynamics Applied to Waste-to-Energy Processes: A Hands-on Approach; Butterworth-Heinemann: Cambridge, MA, USA, 2020. [Google Scholar]
  56. Mochizuki, H. Verification of neutronics and thermal-hydraulics coupling method for FLUENT code using the MSRE pump startup, trip data. Nucl. Eng. Des. 2021, 378, 111191. [Google Scholar] [CrossRef]
  57. Brookes, S.J.; Moss, J.B. Predictions of soot and thermal radiation properties in confined turbulent jet diffusion flames. Combust. Flame 1999, 116, 486–503. [Google Scholar] [CrossRef]
  58. Yuen, A.C.Y.; Yeoh, G.H. Numerical simulation of an enclosure fire in a large test hall. Comput. Therm. Sci. 2013, 5, 459–471. [Google Scholar] [CrossRef]
  59. Yuen, A.C.Y.; Yeoh, G.H.; Yuen, R.K.K.; Chen, T. Numerical Simulation of a Ceiling Jet Fire in a Large Compartment. Procedia Eng. 2013, 52, 3–12. [Google Scholar]
  60. Nicoud, F.; Ducros, F. Subgrid-Scale Stress Modelling Based on the Square of the Velocity Gradient Tensor. Flow Turbul. Combust. 1999, 62, 183–200. [Google Scholar] [CrossRef]
  61. Smagorinsky, J. General circulation experiments with the primitive equations, i. the basic experiment. Mon. Weather Rev. 1963, 91, 99–164. [Google Scholar] [CrossRef]
  62. Yuen, A.C.Y.; Yeoh, G.H.; Timchenko, V.; Cheung, S.C.P.; Chen, T. Study of three LES subgrid-scale turbulence models for predictions of heat and mass transfer in large-scale compartment fires. Numer. Heat Transf. Part A 2016, 69, 1223–1241. [Google Scholar] [CrossRef]
  63. Chen, Q.; Chen, T.B.Y.; Yuen, A.C.Y.; Wang, C.; Chan, Q.N.; Yeoh, G.H. Investigation of door width towards flame tilting behaviours and combustion species in compartment fire scenarios using large eddy simulation. Int. J. Heat Mass Transf. 2020, 150, 119373. [Google Scholar] [CrossRef]
  64. Smith, G.P.; Golden, D.M.; Frenklach, M.; Moriarty, N.W.; Eiteneer, B.; Goldenberg, M.; Bowman, C.T.; Hanson, R.K.; Song, S.; Gardiner, W.C., Jr.; et al. GRI-Mech, Version 3.0. 2000. Available online: http://www.me.berkeley.edu/gri_mech/ (accessed on 11 June 2021).
  65. Kee, R.J.; Rupley, F.M.; Miller, J.A.; Coltrin, M.E.; Grcar, J.F.; Meeks, E. CHEMKIN Collection, Release 3.6; Reaction Design, Inc.: San Diego, CA, USA, 2000. [Google Scholar]
  66. Yuen, A.C.Y.; Yeoh, G.H.; Timchenko, V.; Chen, T.B.Y.; Chan, Q.N.; Wang, C.; Li, D.D. Comparison of detailed soot formation models for sooty and non-sooty flames in an under-ventilated ISO room. Int. J. Heat Mass Transf. 2017, 115, 717–729. [Google Scholar] [CrossRef]
  67. Yuen, A.C.Y.; Yeoh, G.H.; Timchenko, V.; Cheung, S.C.P.; Barber, T.J. Importance of detailed chemical kinetics on combustion and soot modelling of ventilated and under-ventilated fires in compartment. Int. J. Heat Mass Transf. 2016, 96, 171–188. [Google Scholar] [CrossRef]
  68. Jamaluddin, A.S.; Smith, P.J. Predicting Radiative Transfer in Rectangular Enclosures Using the Discrete Ordinates Method. Combust. Sci. Technol. 1988, 59, 321–340. [Google Scholar] [CrossRef]
  69. Beer, J.M.; Foster, P.J.; Siddall, R.G. Calculation Methods of Radiation Heat Transfer; HFTS Design Report No. 22; AEA Technology: Burlington, MA, USA, 1971. [Google Scholar]
  70. Kent, J.; Honnery, D. A soot formation rate map for a laminar ethylene diffusion flame. Combust. Flame 1990, 79, 287–298. [Google Scholar] [CrossRef]
Figure 1. Multi-scale modelling framework incorporating molecular dynamics simulation with computational fluid dynamics.
Molecules 27 00292 g001
Figure 2. Snapshots of the evolving pyrolysis fragments at 3200 K for the polyethylene (PE) system.
Molecules 27 00292 g002
Figure 3. Snapshots of the evolving pyrolysis fragments at 3200 K for the polyethylene with 25 mass percentage aluminium trihydroxide (PE + 25 wt% ATH) system.
Molecules 27 00292 g003
Figure 4. Numbers of C2H4 molecules for the (a) polyethylene (PE) and (b) polyethylene with 25% aluminium trihydroxide (PE + 25 wt% ATH) during the molecular dynamics’ simulation.
Molecules 27 00292 g004
Figure 5. Weight percentage of C40+ for the (a) polyethylene (PE) and (b) polyethylene with 25% aluminium trihydroxide (PE + 25 wt% ATH) during the molecular dynamics simulation.
Molecules 27 00292 g005
Figure 6. Fitted rate constant versus inverse temperature obtained from the MD simulations based on molecular number of C2H4 (MD) and cut-off filter by carbon number C40+ (MD-CN).
Molecules 27 00292 g006
Figure 7. Detailed breakdown of the pyrolysis products for polyethylene (PE) and polyethylene with 25% aluminium trihydroxide (PE + ATH) arranged by mass fraction.
Molecules 27 00292 g007
Figure 8. Flamelet profiles for selective major combustion species and carbon monoxide (CO) and carbon dioxide (CO2) at different scalar dissipation rates for (a) Polyethylene case with pure C2H4 (ethylene) parent fuel, (b) Polyethylene case with volatiles gas mixture from molecular dynamics simulation as the parent fuel and (c) polyethylene with 25% aluminium trihydroxide (PE + 25 wt% ATH) case with volatiles gas mixture from molecular dynamics simulation as the parent fuel.
Molecules 27 00292 g008
Figure 9. Diagram of (a) the cone calorimeter geometry with dimensions and (b) the meshed computational domain.
Molecules 27 00292 g009
Figure 10. Mesh sensitivity comparison of the heat release rate profile for the three mesh systems.
Molecules 27 00292 g010
Figure 11. Comparison of numerical results against experimental (a) heat release rate (HRR), (b) carbon monoxide (CO) and (c) carbon dioxide (CO2) profile from cone calorimetry under a heat flux of 35 kW/m2 for (i) Polyethylene case with pure ethylene (C2H4) parent fuel, and (ii) Polyethylene case with volatiles gas mixture from molecular dynamics (MD) simulation as the parent fuel.
Molecules 27 00292 g011
Figure 12. Comparison of numerical results against experimental (a) heat release rate (HRR), (b) Carbon Monoxide (CO) and (c) Carbon Monoxide (CO2) profile from cone calorimetry under a heat flux of 35 kW/m2 for (i) Polyethylene (PE) and (ii) polyethylene with aluminium trihydroxide (PE/ATH) case with volatiles gas mixture from molecular dynamics (MD) simulation as the parent fuel.
Molecules 27 00292 g012
Figure 13. Numerical results for H2O mass fraction profile from cone calorimetry under a heat flux of 35 kW/m2 for polyethylene with aluminium trihydroxide (PE/ATH) case with (i) pure C2H4 (ethylene) and (ii) volatiles gas mixture from molecular dynamics (MD) simulation as the parent fuel.
Molecules 27 00292 g013
Figure 14. Amorphous structure of the (a) PE and (b) PE + ATH system.
Molecules 27 00292 g014
Table 1. Pyrolysis kinetic parameters extracted from MD compared with experiments.
Polymer Type Ea (kJ/mol)A (1/s)
PE MD273.251.798 × 1016
MD-CN233.061.76 × 1013
TGA Experiment266.741.52 × 1016
PE + ATHMD325.435.0291 × 1011
MD-CN285.415.03 × 1013
Table 2. Details of the mesh systems used in the mesh sensitivity analysis.
MeshMesh Size (mm)Total Number of Cells
Mesh 1 (coarse)5676,875
Mesh 2 (medium)21,353,750
Mesh 3 (fine)1.53,210,000
Publisher’s Note: MDPI stays neutral with regard to jurisdictional claims in published maps and institutional affiliations.

