Abstract
Background: Zinc binding proteins make up a significant proportion of the proteomes of most organisms and, within those proteins, zinc performs rôles in catalysis and structure stabilisation. Identifying the ability to bind zinc in a novel protein can offer insights into its functions and the mechanism by which it carries out those functions. Computational means of doing so are faster than spectroscopic means, allowing for searching at much greater speeds and scales, and thereby guiding complimentary experimental approaches. Typically, computational models of zinc binding predict zinc binding for individual residues rather than as a single binding site, and typically do not distinguish between different classes of binding site—missing crucial properties indicative of zinc binding. Methods: Previously, we created ZincBindDB, a continuously updated database of known zinc binding sites, categorised by family (the set of liganding residues). Here, we use this dataset to create ZincBindPredict, a set of machine learning methods to predict the most common zinc binding site families for both structure and sequence. Results: The models all achieve an MCC ≥ 0.88, recall ≥ 0.93 and precision ≥ 0.91 for the structural models (mean MCC = 0.97), while the sequence models have MCC ≥ 0.64, recall ≥ 0.80 and precision ≥ 0.83 (mean MCC = 0.87), with the models for binding sites containing four liganding residues performing much better than this. Conclusions: The predictors outperform competing zinc binding site predictors and are available online via a web interface and a GraphQL API.
1. Introduction
Many proteins require a cofactor to function correctly, and present a region of their surface which has an affinity for that cofactor. Of the metallic cofactors, zinc is one of the most common. Approximately 10% of proteins require zinc to function [1] and so have at least one zinc binding site, making it the second-most prevalent metal in biological systems, after iron. In proteins, it typically performs either a rôle in catalysis (despite, or more likely because of, its lack of variable redox states), or in stabilising a region of the protein [2].
While there are many proteins which are known to bind zinc because the full three-dimensional structure of the protein has been solved in the presence of zinc, leading to the identification of a zinc binding site, it would be useful to be able to determine whether a protein binds zinc without needing to do this. There are experimental means of doing so, but computational approaches offer a more convenient means of performing initial searches at greater scale and speed. These would take either the protein’s sequence, or a structure of some kind (either a hypothetical model, an experimental structure generated in the absence of zinc, or an experimental structure solved at low resolution where a zinc cannot be identified, perhaps because of the presence of heavy metals used for isomorphous replacement) and try to predict whether the protein binds zinc, and, if so, where.
There have been numerous studies in this area in the past. Early attempts at predicting zinc binding from sequence were largely done manually, such as by identifying the ‘C…C…H…H’ (cys-cys-his-his) motif as being a characteristic indicator of zinc binding [3,4], or by identifying approximate spacing patterns typical of catalytic binding sites—the so-called ‘short and long spacers’ [5]. As the number of available sequences grew and this manual approach became infeasible, sequence alignment with known zinc binding proteins became a useful tool for discovering new zinc binding sites [6,7]. Resources such as PROSITE [8] provide a refinement of manual motif searching by providing motifs for zinc binding in a number of homologous families. At the time of writing, there are 70 motifs for zinc fingers, one for zinc-containing alcohol dehydrogenases, two for copper/zinc superoxide dismutase signature, two for zinc carboxypeptidases and one for the zinc import ATP-binding protein znuC family.
By the early 2000s, machine learning became the typical approach for identifying possible metal binding sites—a collection of algorithms which are trained on a dataset of known zinc binding sites in order to identify for themselves what the characteristic properties of zinc binding are, rather than having a human manually identify what those properties might be. Typical algorithms used in the past include Support Vector Machines (SVMs) [9,10,11] and Random Forests [12,13]. In recent years, deep learning, which relies on multi-layer neural networks to represent the inputs at multiple layers of abstraction, has been used more widely [14,15].
Predicting zinc binding from structure has proceeded in a similar fashion, although the nature of structural data means that it has taken longer for there to be enough data to justify the use of machine learning techniques. Early efforts relied on human-observed characteristics of zinc binding sites, such as the ‘hydrophobicity contrast function’, which used the fact that metal binding sites tend to be composed of an inner shell of hydrophilic atoms such as nitrogen and sulphur, which was, in turn, surrounded by a stabilising shell of hydrophobic atoms [16,17]. As the number of available structures grew, geometric patterns were also observed—both by humans and by machine learning algorithms [17,18,19,20]. As with the sequence prediction models, the complexity of the algorithms, and of the zinc binding site features, has grown with the increase in available training data.
One recurring feature, particularly in the sequence-based predictive models, is the focus on zinc binding residues rather than zinc binding sites. In most cases, the entity examined by the predictive model is the individual residue, often with a surrounding linear sequence ‘window’ of residues. The model then assigns a probability as to whether that residue is a zinc binding residue. As outlined above, this approach has had a measure of success, but it is a somewhat artificial concept. There is, after all, no such thing as a zinc-binding residue in isolation. The individual residues of a high-affinity zinc binding site of the kind considered here are only zinc-binding when the other residues are present, and conversely many non-zinc-binding residues could bind zinc if other residues were present in the correct locations. It is particular combinations of residues, not individual residues, which are zinc binding—an important fact not usually considered in research of this kind.
Another commonality is the treatment of zinc binding sites as a single category, and the presumption of properties that are common to them all regardless of the residues of which they are comprised. This may well be sufficient—particularly as there are essentially only four residues that make up the vast majority of zinc binding sites—but it is possible that properties used for prediction have much tighter distributions within particular sub-categories of zinc binding sites.
Previously, we created ZincBindDB [21], a database of zinc binding sites. This resource continuously collates all zinc atoms found in the Protein Data Bank [22], identifies their binding sites (where appropriate), and stores them in a centralised database along with useful properties such as their protein sequence and how different sites cluster together. Sites are classified into ‘families’, not based on homology, but based on the residue composition of the site—the C4 family contains binding sites with four cysteines, H3 those with three histidines, and so on. These data are available over the web via a web ‘application programming interface’ (API), and using a web interface which provides three dimensional graphical representations of all the binding sites. As of July 2020, there were 35,811 zinc binding sites in ZincBind, originating from 16,635 PDB structures.
We have now used this single, definitive dataset of zinc binding sites to train predictive models of zinc binding. Here, we present models which are trained to detect entire zinc binding sites, rather than just zinc binding residues, and each predictive model is trained to detect a particular family of zinc binding sites. There are distinct models for sequence and for structure, and predictions can be made via the ZincBind website, or via the ZincBindPredict GraphQL API.
2. Results and Discussion
2.1. Deployment
The trained predictive models are available via a simple web interface at https://zincbind.bioinf.org.uk/predict/ (see Figure 1). This takes a sequence or an uploaded PDB file and scans it against each of the models, reporting whether any of them suggest a zinc binding site. Alternatively, the ZincBindPredict GraphQL API may be accessed directly. A GraphQL request can be sent with either a protein sequence or protein structure, and a job ID will be returned. This can then be polled for results as the protein or sequence is searched using each model in turn, with the identified binding sites returned as a list with the associated probability.
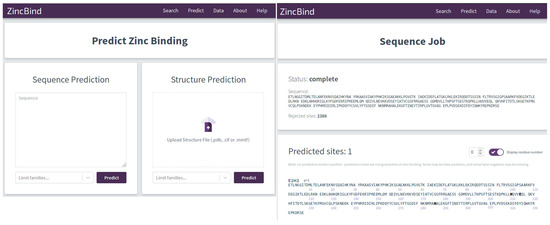
Figure 1.
The graphical interface for the predictors is shown on the left. The user can enter a protein sequence, or upload a structure file. In both cases, the user has the option of limiting the zinc binding families for which the predictor will search, which can save a considerable amount of time. Results of the prediction are shown on the right with the residues predicted to form a binding site shown in bold. This interface consumes the ZincBindPredict GraphQL application programming interface (API), which is also publicly available.
2.2. Training
For all twenty datasets (sequence and structure sets each with 10 different combinations of liganding residues), the ratio of positive samples (actual binding sites) to negative samples (combinations of residues matching a zinc-binding site family, but which are known not to bind zinc) was approximately 1:1. The dataset sizes ranged from 804 to 15,332 samples for the sequence datasets, and from 407 to 3232 samples from the structure datasets.
2.3. Models
Model effectiveness was measured using recall, precision, F1 score, and Matthews Correlation Coefficient (MCC) for all twenty models (10 structural and 10 sequence).
For the structural models, the lowest MCC score was 0.88 (for the E1H1 model). This, and the D1H1 model (MCC = 0.91), relies on the geometry between just two residues, which makes creating a distinct separation between the two classes somewhat more difficult—though their performance is still very close behind that of the three- and four-residue family models. The structure models had an average MCC of 0.97 (see Table 1).

Table 1.
Results for structure models, sorted by Matthews Correlation Coefficient (MCC). The two-residue families’ performance was lower than the others as there are essentially just the measurements between two centres to perform the classification, but still scored relatively highly. Four-residue sites in particular were found to have very high performance.
The sequence models also had high scores, though were more variable. The four residue sites in particular had highly conserved patterns of residue spacing and flanking hydrophobicity despite being from several homologous families. The average MCC for the sequence models was 0.87, with the lowest MCC being 0.61 for the E1H1 model and 0.74 for the D1H1 model—again the two two-residue models were somewhat behind the MCC of 0.84 for the C3 model (see Table 2).
Table 2.
Results for sequence models, sorted by Matthews Correlation Coefficient (MCC).
While the training is affected by dataset size, this does not appear to be a significant limiting factor for most of the models. Figure 2 shows the model performance (as MCC) for the sequence and structure models. The performance of the sequence models falls off as the training set size falls below ∼4000, while the performance of the structural models falls off below around 1000 data points. The lowest three performing structural models were also the lowest three in dataset size (C3, E1H1, D1H1), but two of these have only two residues so, as discussed above, the performance might not be expected to be very good. Learning curves (Figure 3) using fractions of the datasets show a correlation with dataset size for the sequence models, but above around 1000 sequences, the structure models do not improve with larger datasets.
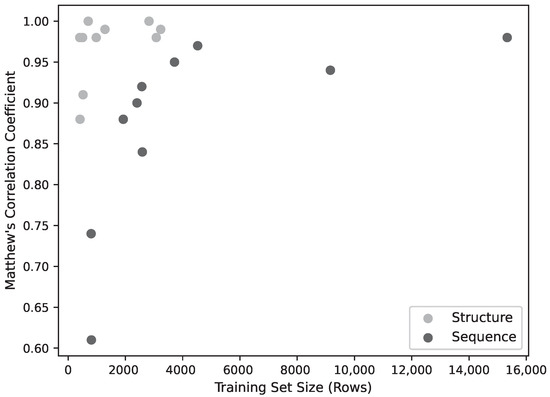
Figure 2.
Model Performance (MCC) as a function of training set size. Below ∼4000 training patterns, performance declines sharply, though above this threshold there ceases to be a strong correlation between performance and training set size.
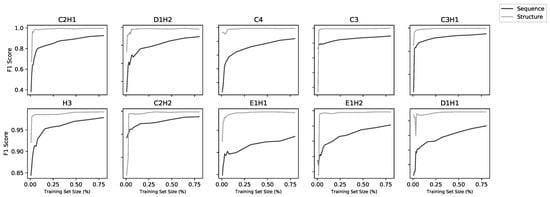
Figure 3.
Learning curves for all 20 models (10 structural and 10 sequence). Each model was trained on increasing subsets of the overall training set using five-fold cross-validation. Sequence models improved with increasing dataset size whereas, above a low threshold, structure models did not improve with more data.
The level of abstraction used to describe both sequences and structures (see Section 3 Methods) made it unlikely that any homology between data in the training and testing sets would artificially improve the performance. The features are largely calculated from residues around the binding residues, rather than the sequence in which they occur. Nonetheless, we confirmed that this was true.
Different sequence identity thresholds were used for clustering with CD-HIT and, where possible, a dataset of the same size was selected at random from each set of resulting clusters. No significant effect on performance was seen. When clustering at 40% sequence identity, there was slightly lower performance (see Supplementary File clustering.txt), but clustering at this level did result in much smaller datasets. As indicated previously, this is a major determinant of the performance of the sequence models.
In order to identify whether this lowered performance was because the models performed worse without the possibility of homologous sequences between the training and test sets, or whether it was a result of the smaller training set, for each zinc-binding site family, a classifier was trained on 20%, 30%, 40%, 50%, 60%, 70%, 80%, 90% and 100% of the original, unclustered data, and additional classifiers were trained on data with sequences clustered at 40%, 50%, 60%, 70%, 80%, 90% sequence identity and with no clustering. The performance of the models was then plotted against the resulting dataset sizes as shown in Figure 4. This demonstrates that it is dataset size that determines model performance, regardless of any similarity of the sequences between the training and testing datasets.
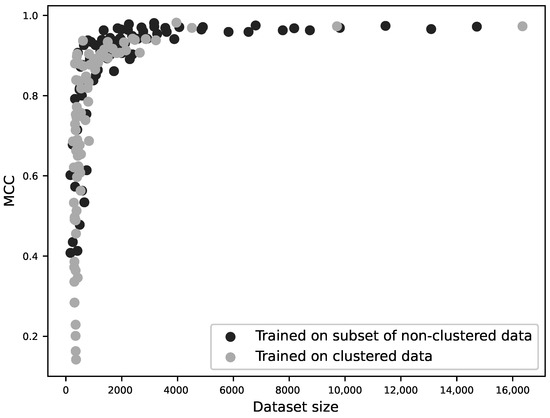
Figure 4.
MCC as a function of dataset size for 160 different sequence-based models. For each of the ten zinc-binding site families, 9 classifiers were trained using 20–100% of the original, unclustered data (10 × 9 models); additional classifiers were trained using sequences clustered at 40–100% sequence identity (10 × 7 models). The performance (MCC) is plotted against the size of the training dataset. The two modes of dataset reduction are shown by different shades and it can be seen that the curves are not significantly different. This suggests that homology between training and test sets does not influence a model’s performance; rather, performance is a function of training dataset size.
For reference, the performance of the sequence models was compared with using BLAST for predicting zinc-binding sites. For each zinc-binding site family, a BLAST database was created using 80% of the available zinc-binding sequences, and BLAST’s ability to identify zinc binding sites from the remaining 20% was compared against an equivalently sized negative set. The results are shown in Table 3. With the exception of C2H2, using BLAST to find zinc binding based on homology performs much worse than the models presented here. Even in the case of C2H2, which seems to have much more similar sequences in its dataset, the ZincBindPredict model still narrowly outperforms BLAST.
Table 3.
Predictive ability of BLAST to identify zinc binding sites in protein sequences using homology alone.
The performance scores of our predictors also compare favourably with recent comparable predictive models based on structure and sequence—most notably the ‘SVM and Sample-Weighted Probabilistic Neural Network’ (MCC = 0.80) [11], the ‘meta-zinc predictor’ (MCC = 0.79) [23] and ZincExplorer (MCC = 0.78) [24].
However, the models presented here are not intended to be general-purpose zinc binding predictors that detect common properties of all zinc binding sites—they are zinc-binding site family-specific predictors based on the principle that common, specific types of zinc binding site have more identifiable, consistent properties than do zinc binding sites in general. As a result, they will not readily detect binding sites of uncommon zinc-binding families. This abstract predictiveness has been deliberately discarded to create highly effective models for specific, common families of zinc binding sites. It is also noteworthy that the binding site itself is a useful unit of prediction using this methodology—even for sequences—rather than individual binding residues. The models are therefore identifying something biologically real (a zinc binding site) rather than something which does not actually exist in isolation (a single zinc binding residue), but which is a useful heuristic in some circumstances.
A demonstration of this can be seen by applying the sequence models to bacterial genomes to measure the proportion of typical genomes that the models predict to be zinc binding, as shown for a range of bacterial genomes in Table 4. For most genomes, fewer than 10% of proteins are flagged as zinc binding, with the average for the genomes examined being 8.46%. Given that the zinc-binding families for which predictors have been generated represent 67.0% of binding sites in ZincBindDB (the others being unusual sites), this would imply a ‘true’ predicted proportion of 12.6%, which is a little higher than the widely cited figure of 10%.
Table 4.
Percentage of protein sequences encoded in the genome predicted to be zinc binding by ZincBindPredict for an assortment of bacterial genomes. Genomes were acquired from ensembl [25] in the form of translated polypeptide sequences, with a sequence labelled as zinc binding if any of the ten models finds at least one zinc binding site for that sequence/family combination. See Supplementary File genomes.zip for the full results.
3. Materials and Methods
3.1. Dataset Creation
The datasets used to train the predictive models were derived from ZincBindDB.
For the sequence models, for each family of zinc binding sites, all examples were downloaded with the associated sequences, and those with more than one sequence (those sites split across multiple chains) were discarded. The resulting sequences were turned into feature vectors which contained the number of residues between each pair of binding residues, the average hydrophobicity of residues either side of the binding residues, using the features described in Table 5. This created a dataset of positive samples. For the negative samples, for each zinc-binding site family, a sequence was chosen at random from the set of all unique sequences in UniProtKB and a combination of residues within that sequence matching the zinc-binding site family (e.g., C2H2), but not a known binding site, was selected—this was done repeatedly until a list of negative samples was built up equal in size to the positive dataset. The two datasets were combined into a single dataset for each zinc-binding site family.
Table 5.
Details of how features are calculated for residue combinations in structure and sequence models. Hydrophobicity of sequence residues is defined using Wimley and White’s scale [26], charge is the count of charged residues (aspartate, glutamate, arginine, histidine and lysine).
For the structural data, for each zinc-binding site family, all relevant zinc binding sites belonging to a PDB structure with resolution better than 2 Ångströms were downloaded, and grouped by the PDB entry to which they belonged. For each PDB entry, the structure was downloaded and parsed using the Python library atomium [27], assembled into the correct biological assembly, and then each binding site was turned into a feature vector using the features described in Table 5. Since the distances used are all the pairwise combinations of the atoms involved, the number of distances depends on the number of liganding residues: H3 sites will have three inter C distances, C4 sites will have six, and so on. The ‘hydrophobicity contrast function’ is calculated at the centre of the C atoms with a radius of 4 Ångströms as described in the original paper by Yamashita et al. [16]. This algorithm is a measure of how much outer atoms in a sphere are more hydrophobic than inner atoms, with higher values previously shown to be associated with centres of metal binding [16,17].
For example, given a C2H2 site, in a sequence model, there would be three inter-residue gaps for which the number of residues per gap would be used together with the mean hydrophobicity and charge of the 4 interacting residues (i.e., a window of 1), the 4 interacting residues plus one sequence neighbour on each side (window of 3) and the 4 interacting residues plus two sequence neighbours on each side (window of 5). For the structural model, there would be 6 inter-C and 6 inter-C distances, from which the mean, maximum, minimum and standard deviation would be calculated as well as the hydrophobicity contrast function.
To generate the negative samples, for each positive sample, a random arrangement of residues matching the zinc-binding site family in question was obtained from a randomly chosen, non-zinc-binding PDB structure, and a feature vector created from that non-binding combination. In this case, only residue combinations that could feasibly form a binding site (those where there are no inter-C distances greater than 30 Ångströms) were used.
While the abstraction of sequence and structure suggests that homology is unlikely to influence the results (i.e., homologues between training and testing sets are unlikely to over-rate the performance), this was tested using datasets with similar sequences removed. CD-HIT [28] was used with sequence identity cutoffs ranging from 100% down to 40% (the lowest identity threshold for the standard version of CD-HIT).
3.2. Predictive Model Training
The Random Forest algorithm [29] was used to train the predictive model for each of the 20 datasets (a dataset of sequence features and a dataset of structural features for each of the ten zinc binding site families), which provided superior results to K-Nearest Neighbours, and vastly superior results to Support Vector Machines even when the dataset was balanced. Random Forests apply the bagging concept (where multiple models are trained on random sub-samples of the data to avoid over-fitting to the training data) to decision trees (classification algorithms which divide the input space into the categories based on sequential binary splits).
The hyper-parameters for each model were selected separately using 5-fold cross validation of the training set. The hyper-parameters explored were the impurity measure (gini vs. entropy—the algorithm used to split individual trees at each node), the maximum depth that the component trees could have (4, 6, 8 or no maximum), the number of trees in the forest (10, 100 or 1000), and the means of determining the best number of features at each split (either the square root of the number of features, or the log of the number of features). Once optimal hyper-parameters were identified (determined by which combination produced the best F1 score in the cross-validation), the models were trained with those hyper-parameters using the entire training dataset.
For the trained model, the metrics recall (how effective at finding true binding sites the models are), precision (how effective at ignoring non-binding sites they are), the F1 score (the harmonic mean of recall and precision) and Matthews Correlation Coefficient (another summary of the true positives, true negatives, false positives and false negatives generally considered the best overall metric [30]) were calculated using the separate test datasets (the test–train split being 20:80). The accuracy metric was not used as it is not relevant for unbalanced datasets. Training was performed using the Python scikit-learn library [31].
For performance comparison, homology searching was performed using the NCBI BLAST program [32] using an expectation value threshold of 0.1.
4. Conclusions
Zinc binding sites can be divided into distinct families based on the residues of which they are comprised. These zinc-binding site families follow a power law distribution, with a small number of families being highly represented. By training models for individual zinc-binding site families, rather than for zinc binding sites in general, very high recall and precision levels can be achieved. It is worth noting that a zinc-binding site family is a completely different concept from a homologous family as it is the result of convergent evolution potentially spanning many different homologous families. The high performance suggests that, for both sequence and structure, zinc binding properties are more tightly distributed within zinc binding site families than for zinc binding sites generally. The resulting predictor outperforms other general zinc binding predictors.
Supplementary Materials
The following are available online.
Author Contributions
Conceptualization, A.C.R.M.; methodology, S.M.I. and A.C.R.M.; software, S.M.I.; validation, S.M.I. and A.C.R.M.; formal analysis, S.M.I.; investigation, S.M.I.; resources, A.C.R.M.; data curation, S.M.I.; writing—original draft preparation, S.M.I.; writing—review and editing, A.C.R.M.; visualization, S.M.I.; supervision, A.C.R.M.; project administration, A.C.R.M.; funding acquisition, S.M.I. and A.C.R.M. All authors have read and agreed to the published version of the manuscript.
Funding
This research was funded by a Wellcome Trust PhD Studentship to S.M.I. (grant number 203756/Z/16/A).
Institutional Review Board Statement
Not applicable.
Informed Consent Statement
Not applicable.
Data Availability Statement
The resource may be accessed at https://zincbind.bioinf.org.uk/predict/ and the source code at https://github.com/samirelanduk/ZincBindPredict.
Conflicts of Interest
The authors declare no conflict of interest. The funders had no role in the design of the study; in the collection, analyses, or interpretation of data; in the writing of the manuscript, or in the decision to publish the results.
Abbreviations
The following abbreviations are used in this manuscript:
| API | Application Programming Interface |
| SVM | Support Vector Machine |
| PDB | Protein Data Bank |
| MCC | Matthews Correlation Coefficient |
References
- Andreini, C.; Banci, L.; Bertini, I.; Rosato, A. Counting the zinc-proteins encoded in the human genome. J. Proteome Res. 2006, 5, 196–201. [Google Scholar] [CrossRef] [PubMed]
- Vallee, B.L.; Auld, D.S. Zinc coordination, function, and structure of zinc enzymes and other proteins. Biochemistry 1990, 29, 5647–5659. [Google Scholar] [CrossRef]
- Miller, J.; McLachlan, A.; Klug, A. Repetitive zinc-binding domains in the protein transcription factor IIIA from Xenopus oocytes. EMBO J. 1985, 4, 1609–1614. [Google Scholar] [CrossRef]
- Barbosa, M.S.; Lowy, D.R.; Schiller, J.T. Papillomavirus polypeptides E6 and E7 are zinc-binding proteins. J. Virol. 1989, 63, 1404–1407. [Google Scholar] [CrossRef] [PubMed]
- Vallee, B.L.; Auld, D.S. Short and long spacer sequences and other structural features of zinc binding sites in zinc enzymes. FEBS Lett. 1989, 257, 138–140. [Google Scholar] [CrossRef]
- Bishop, W.R.; Kirschmeier, P.; George, S.J.; Cramer, S.P.; Hendrickson, W.A. Identification and characterization of zinc binding sites in protein kinase C. Science 1991, 254, 1776–1779. [Google Scholar]
- Furukawa, Y.; Lim, C.; Tosha, T.; Yoshida, K.; Hagai, T.; Akiyama, S.; Watanabe, S.; Nakagome, K.; Shiro, Y. Identification of a novel zinc-binding protein, C1orf123, as an interactor with a heavy metal-associated domain. PLoS ONE 2018, 13, e0204355. [Google Scholar] [CrossRef] [PubMed]
- Sigrist, C.J.A.; de Castro, E.; Cerutti, L.; Cuche, B.A.; Hulo, N.; Bridge, A.; Bougueleret, L.; Xenarios, I. New and continuing developments at PROSITE. Nucleic Acids Res. 2012, 41, D344–D347. [Google Scholar] [CrossRef]
- Lin, H.; Han, L.; Zhang, H.; Zheng, C.; Xie, B.; Cao, Z.W.; Chen, Y.Z. Prediction of the functional class of metal-binding proteins from sequence derived physicochemical properties by support vector machine approach. BMC Bioinform. 2006, 7, S13. [Google Scholar] [CrossRef]
- Srivastava, A.; Kumar, M. Prediction of zinc binding sites in proteins using sequence derived information. J. Biomol. Struct. Dyn. 2018, 36, 4413–4423. [Google Scholar] [CrossRef]
- Li, H.; Pi, D.; Chen, C.; Li, H. A Novel Prediction Method for Zinc-Binding Sites in Proteins by an Ensemble of SVM and Sample-Weighted Probabilistic Neural Network. IEEE Access 2019, 7, 186147–186157. [Google Scholar] [CrossRef]
- Zheng, C.; Wang, M.; Takemoto, K.; Akutsu, T.; Zhang, Z.; Song, J. An Integrative Computational Framework Based on a Two-Step Random Forest Algorithm Improves Prediction of Zinc-Binding Sites in Proteins. PLoS ONE 2012, 7, e49716. [Google Scholar] [CrossRef] [PubMed]
- Kumar, S. Prediction of Metal Ion Binding Sites in Proteins from Amino Acid Sequences by Using Simplified Amino Acid Alphabets and Random Forest Model. Genom. Inform. 2017, 15, 162–169. [Google Scholar] [CrossRef] [PubMed]
- Karimi, M.; Wu, D.; Wang, Z.; Shen, Y. DeepAffinity: Interpretable deep learning of compound–protein affinity through unified recurrent and convolutional neural networks. Bioinformatics 2019, 35, 3329–3338. [Google Scholar] [CrossRef]
- Haberal, I.; Ogul, H. Prediction of Protein Metal Binding Sites Using Deep Neural Networks. Mol. Inform. 2019, 38, 1800169. [Google Scholar] [CrossRef]
- Yamashita, M.M.; Wesson, L.; Eisenman, G.; Eisenberg, D. Where metal ions bind in proteins. Proc. Natl. Acad. Sci. USA 1990, 87, 5648–5652. [Google Scholar] [CrossRef] [PubMed]
- Gregory, D.S.; Martin, A.C.R.; Cheetham, J.C.; Rees, A.R. The prediction and characterization of metal binding sites in proteins. Protein Eng. Des. Sel. 1993, 6, 29–35. [Google Scholar] [CrossRef]
- Wallace, A.C.; Borkakoti, N.; Thornton, J.M. TESS: A geometric hashing algorithm for deriving 3D coordinate templates for searching structural databases. Application to enzyme active sites. Protein Sci. 1997, 6, 2308–2323. [Google Scholar] [CrossRef] [PubMed]
- Zhao, W.; Xu, M.; Liang, Z.; Ding, B.; Niu, L.; Liu, H.; Teng, M. Structure-based de novo prediction of zinc-binding sites in proteins of unknown function. Bioinformatics 2011, 27, 1262–1268. [Google Scholar] [CrossRef]
- Liu, Z.; Wang, Y.; Zhou, C.; Xue, Y.; Zhao, W.; Liu, H. Computationally characterizing and comprehensive analysis of zinc-binding sites in proteins. Biochim. Biophys. Acta Proteins Proteom. 2014, 1844, 171–180. [Google Scholar] [CrossRef]
- Ireland, S.M.; Martin, A.C.R. ZincBind—The database of zinc binding sites. Database 2019, 2019, baz006. [Google Scholar] [CrossRef] [PubMed]
- Berman, H.M. The Protein Data Bank. Nucleic Acids Res. 2000, 28, 235–242. [Google Scholar] [CrossRef]
- Li, H.; Pi, D.; Liang, Y.; Chen, C.; Liu, Y. Integrative computing method for the prediction of zinc-binding sites in proteins. In Proceedings of the 2017 International Joint Conference on Neural Networks (IJCNN), Anchorage, AK, USA, 14–19 May 2017. [Google Scholar] [CrossRef]
- Chen, Z.; Wang, Y.; Zhai, Y.F.; Song, J.; Zhang, Z. ZincExplorer: An accurate hybrid method to improve the prediction of zinc-binding sites from protein sequences. Mol. Biosyst. 2013, 9, 2213. [Google Scholar] [CrossRef] [PubMed]
- Yates, A.D.; Achuthan, P.; Akanni, W.; Allen, J.; Allen, J.; Alvarez-Jarreta, J.; Amode, M.R.; Armean, I.M.; Azov, A.G.; Bennett, R.; et al. Ensembl 2020. Nucleic Acids Res. 2019. [Google Scholar] [CrossRef] [PubMed]
- Wimley, W.C.; White, S.H. Experimentally determined hydrophobicity scale for proteins at membrane interfaces. Nat. Struct. Biol. 1996, 3, 842–848. [Google Scholar] [CrossRef] [PubMed]
- Ireland, S.M.; Martin, A.C.R. Atomium—A Python structure parser. Bioinformatics 2020, 36, 2750–2754. [Google Scholar] [CrossRef]
- Fu, L.; Niu, B.; Zhu, Z.; Wu, S.; Li, W. CD-HIT: Accelerated for clustering the next-generation Sequencing data. Bioinformatics 2012, 28, 3150–3152. [Google Scholar] [CrossRef]
- Breiman, L. Random Forests. Mach. Learn. 2001, 45, 5–32. [Google Scholar] [CrossRef]
- Chicco, D.; Jurman, G. The advantages of the Matthews correlation coefficient (MCC) over F1 score and accuracy in binary classification evaluation. BMC Genom. 2020, 21, 6. [Google Scholar] [CrossRef]
- Pedregosa, F.; Varoquaux, G.; Gramfort, A.; Michel, V.; Thirion, B.; Grisel, O.; Blondel, M.; Prettenhofer, P.; Weiss, R.; Dubourg, V.; et al. Scikit-learn: Machine Learning in Python. J. Mach. Learn. Res. 2011, 12, 2825–2830. [Google Scholar]
- Madeira, F.; mi Park, Y.; Lee, J.; Buso, N.; Gur, T.; Madhusoodanan, N.; Basutkar, P.; Tivey, A.R.N.; Potter, S.C.; Finn, R.D.; et al. The EMBL-EBI search and sequence analysis tools APIs in 2019. Nucleic Acids Res. 2019, 47, W636–W641. [Google Scholar] [CrossRef] [PubMed]
Publisher’s Note: MDPI stays neutral with regard to jurisdictional claims in published maps and institutional affiliations. |
© 2021 by the authors. Licensee MDPI, Basel, Switzerland. This article is an open access article distributed under the terms and conditions of the Creative Commons Attribution (CC BY) license (http://creativecommons.org/licenses/by/4.0/).