
Characterization of Microbial Degradation Products of Steviol Glycosides

 , ,
, , 
Abstract
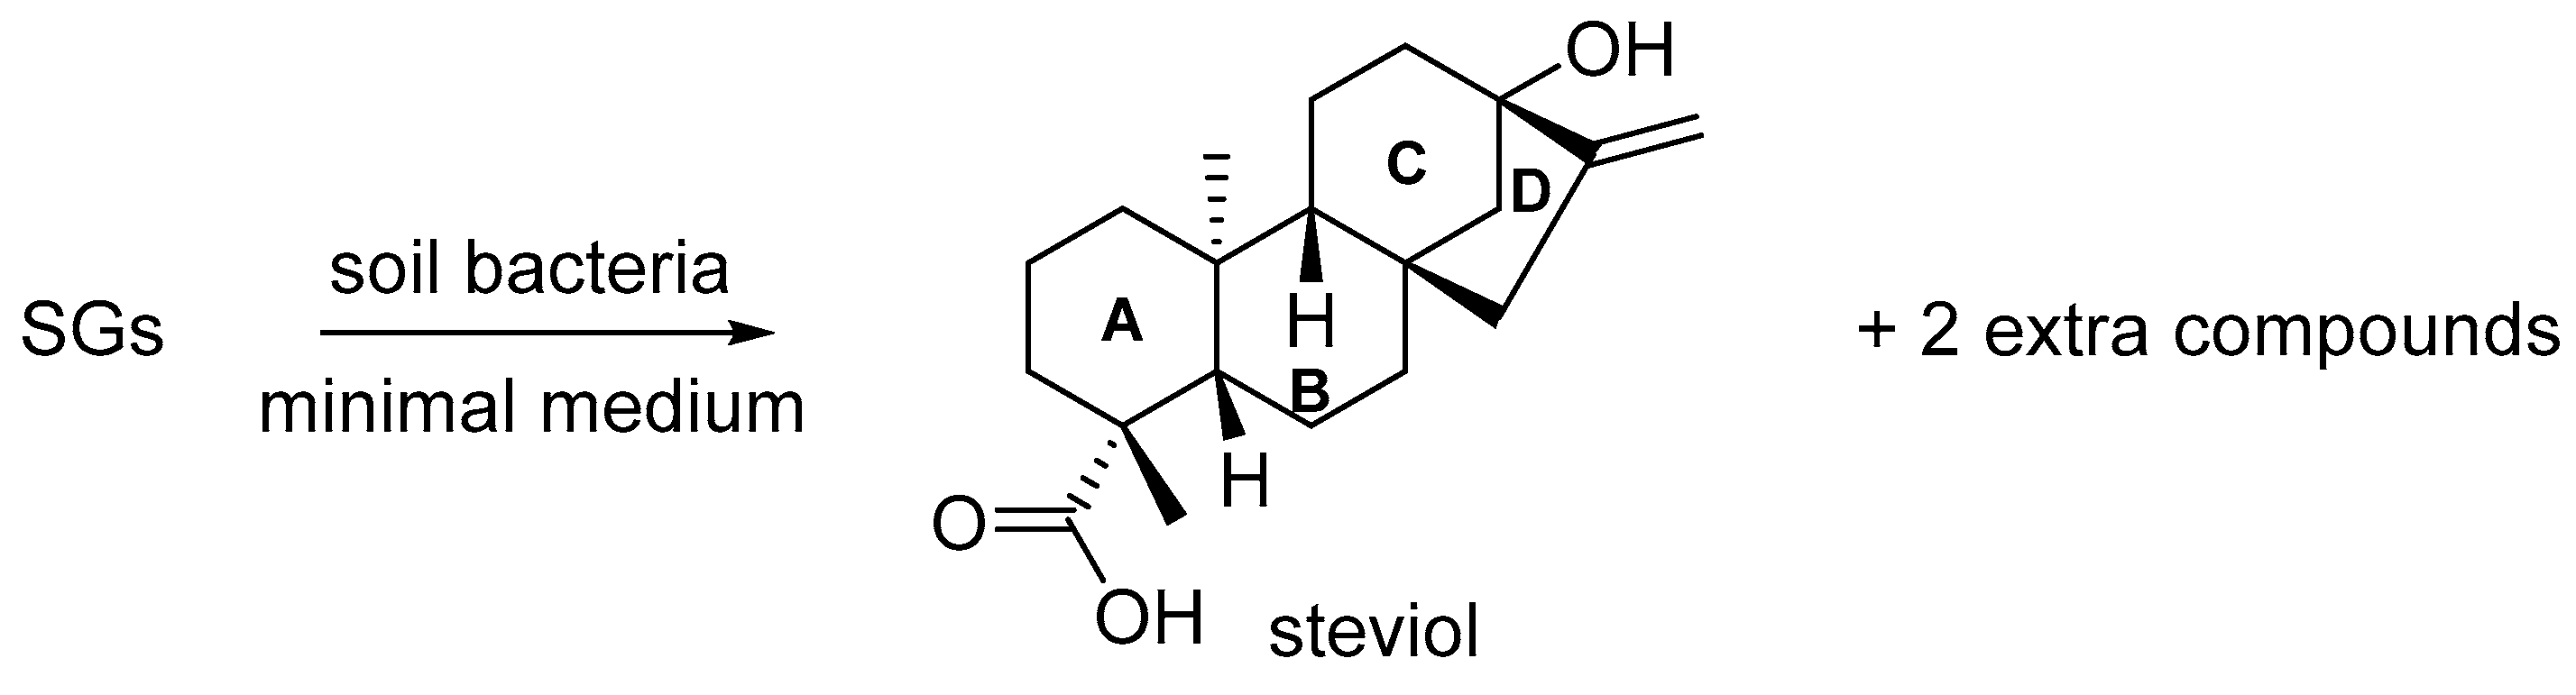
:1. Introduction
2. Results and Discussion
2.1. Preparation
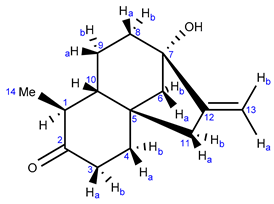
2.2. Characterization of the First Compound: Monicanone
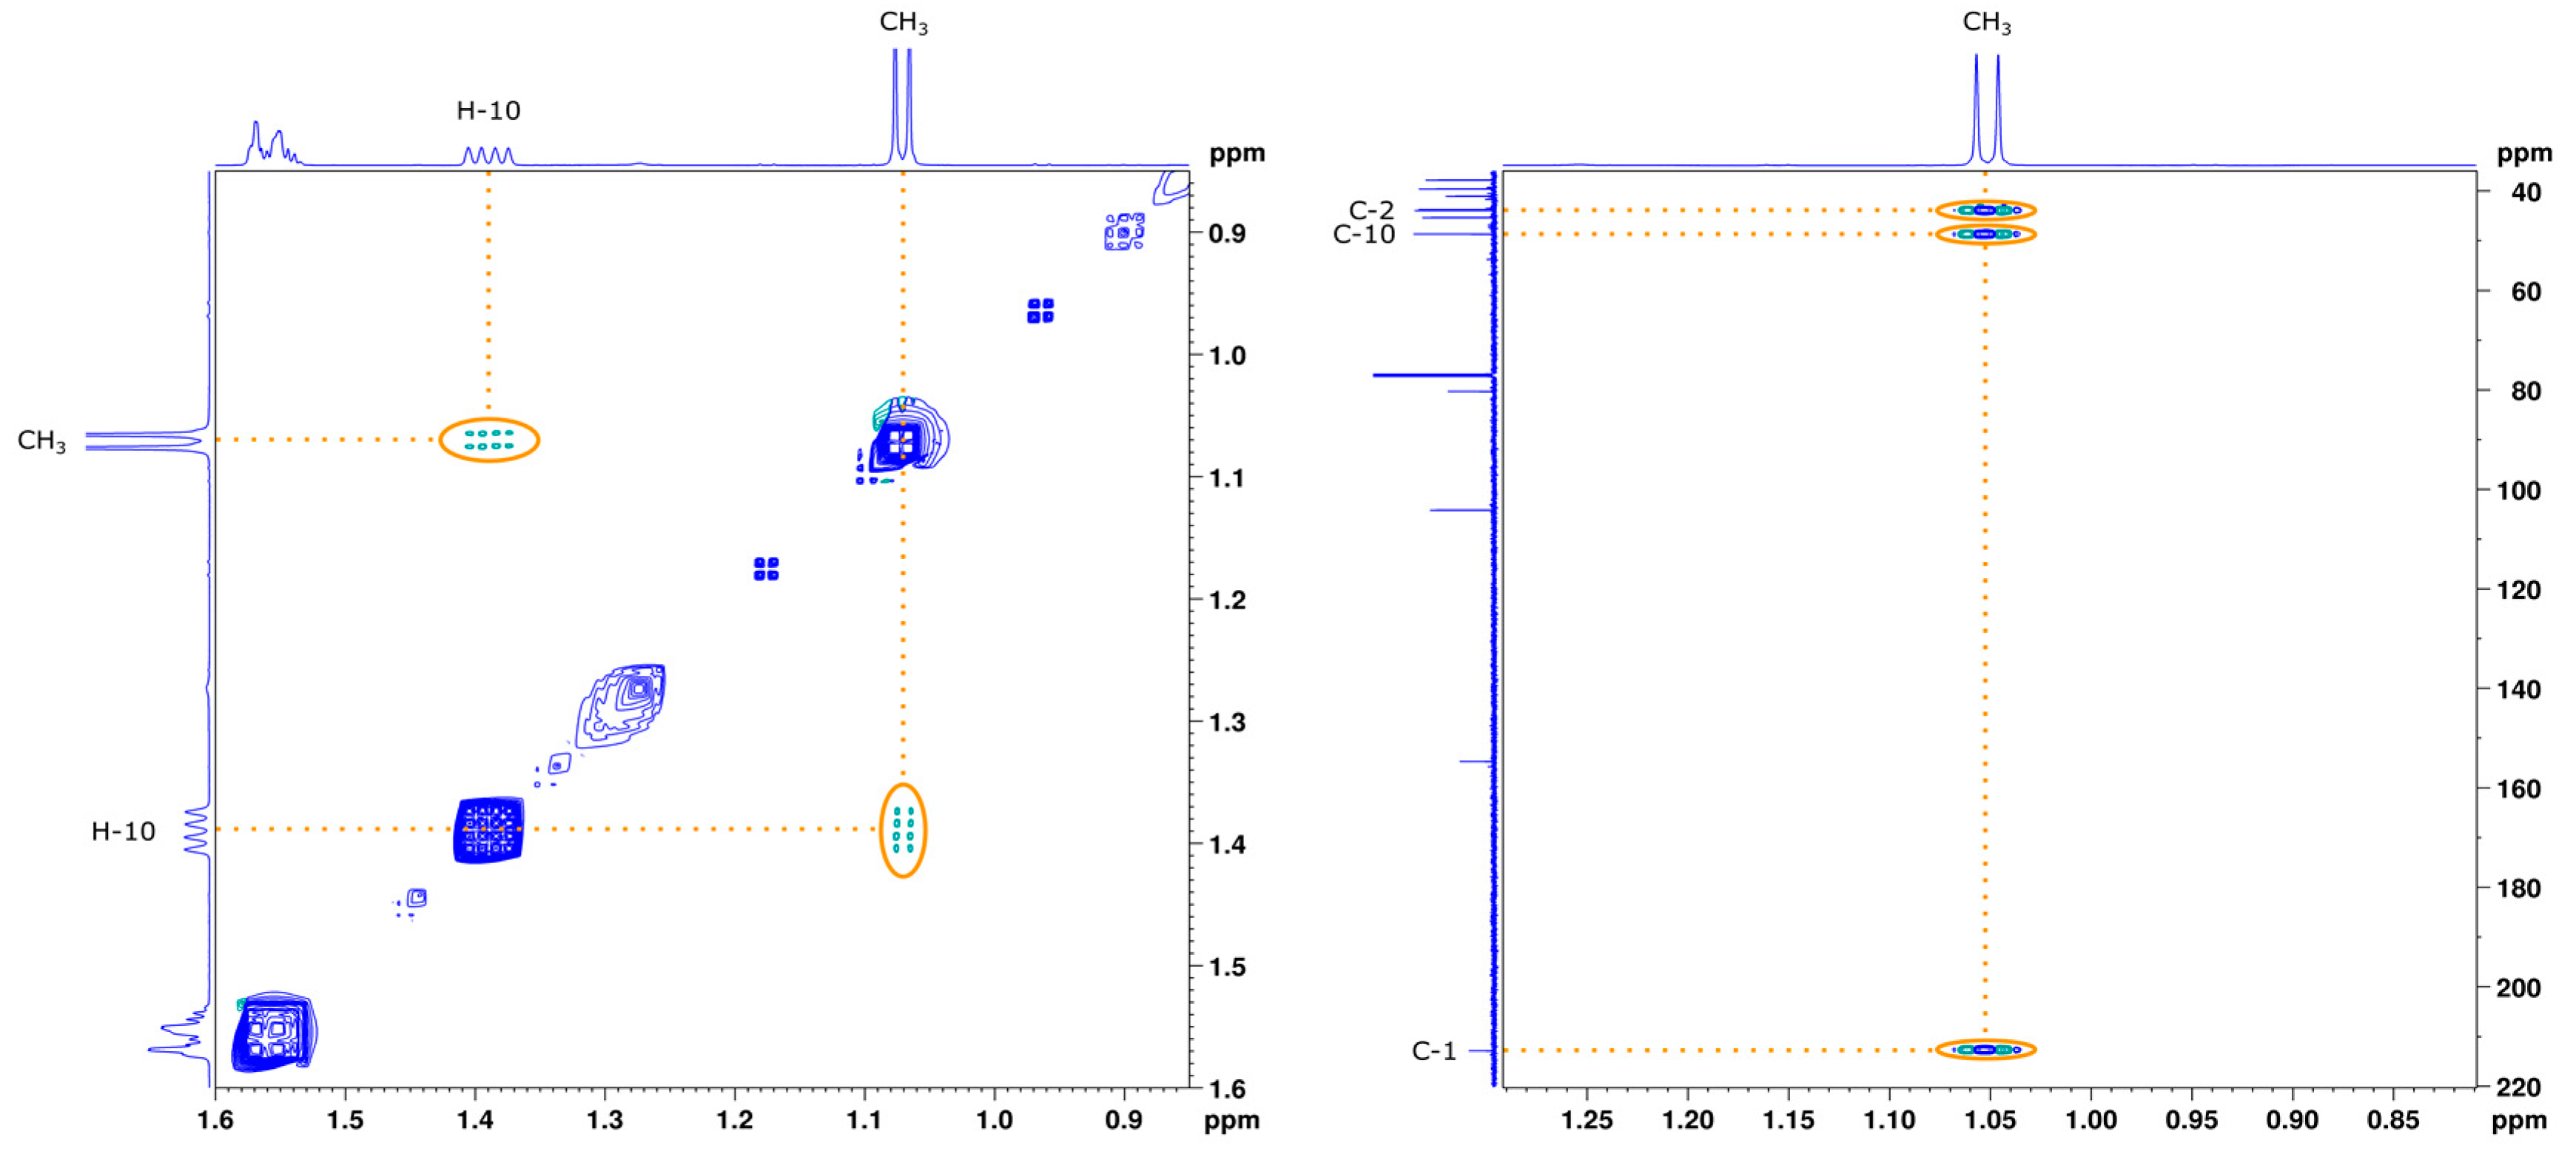
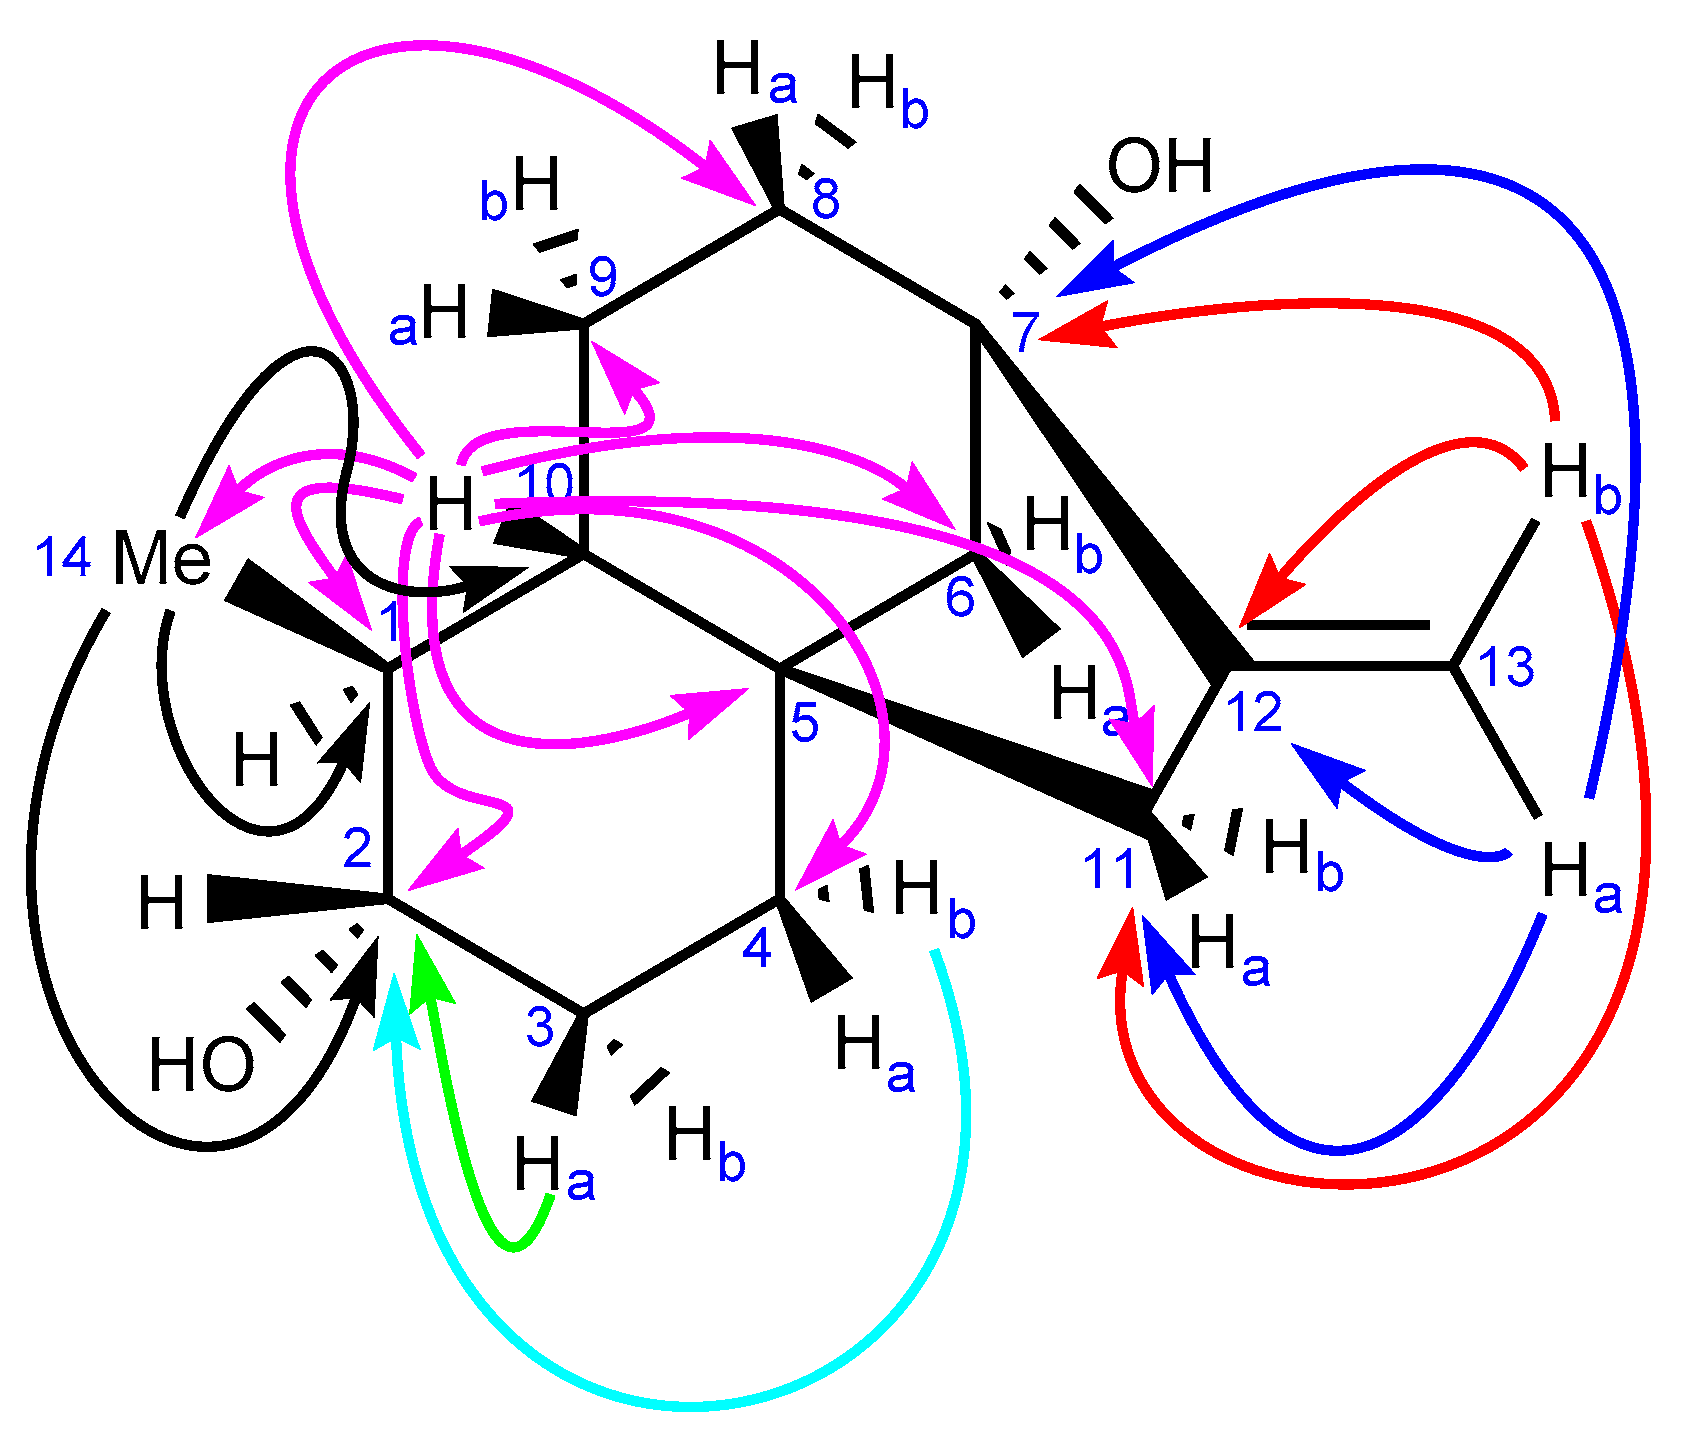
2.2.1. NMR Analysis
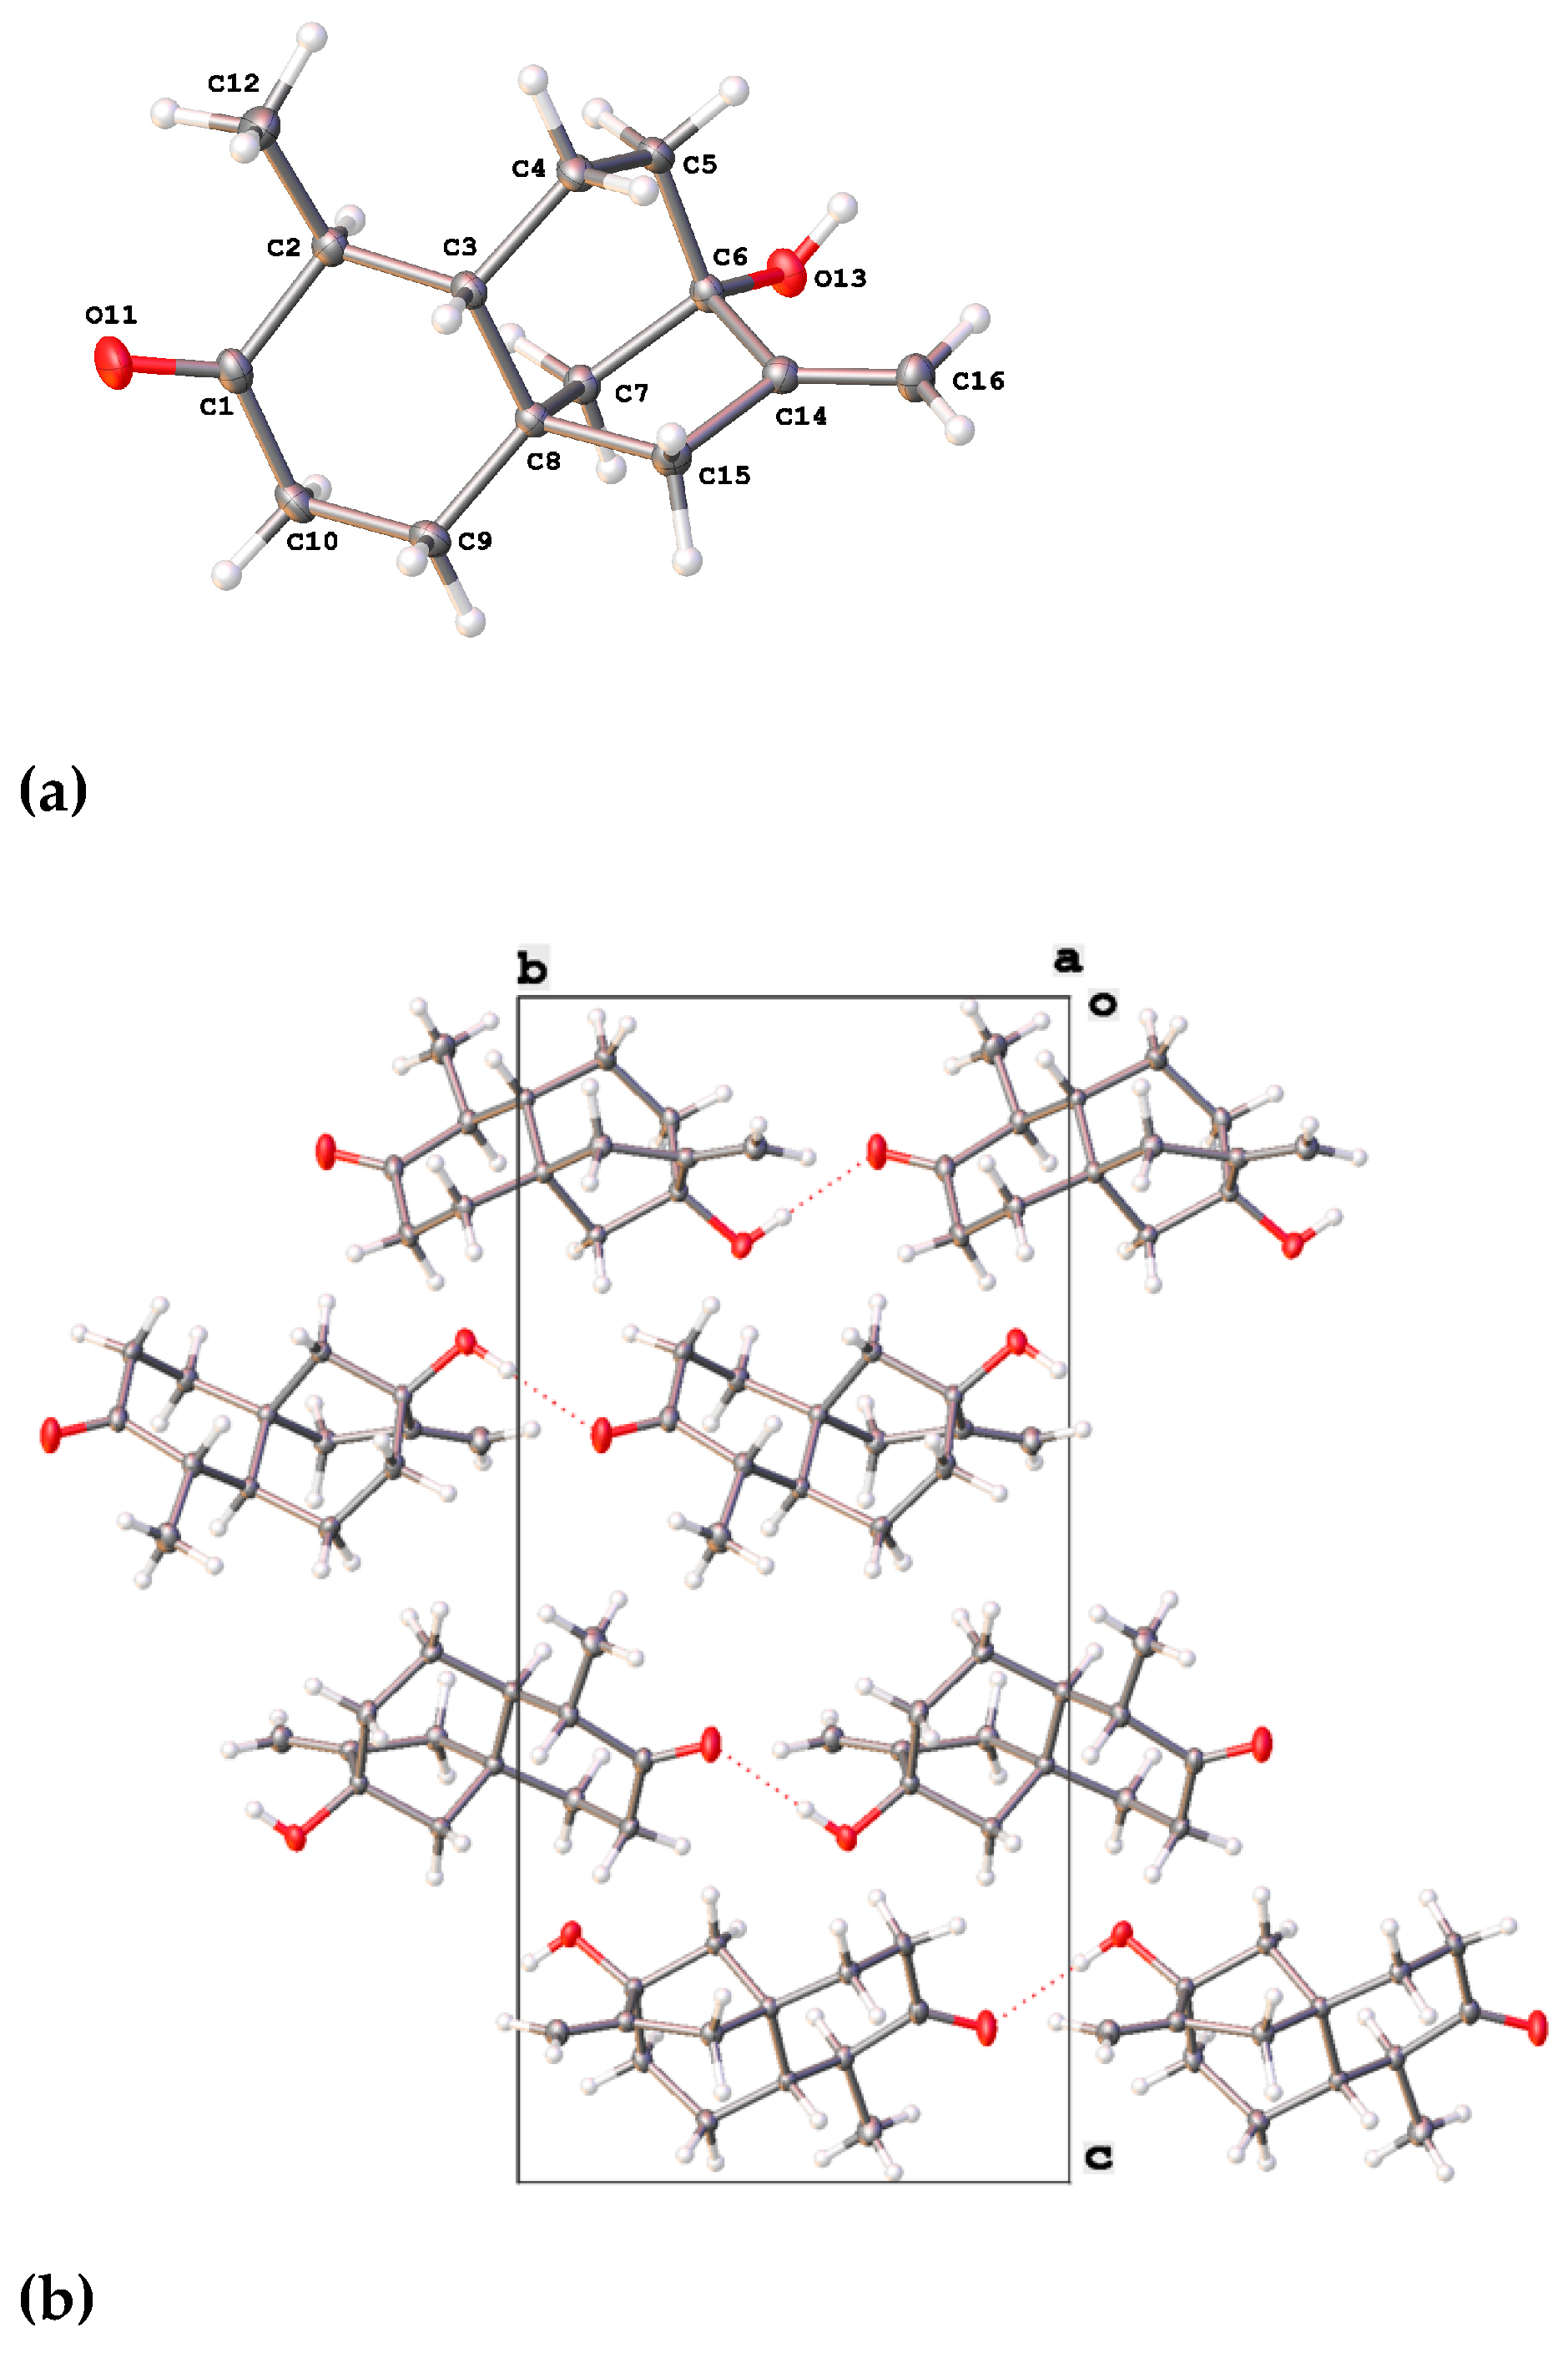
2.2.2. X-ray Analysis
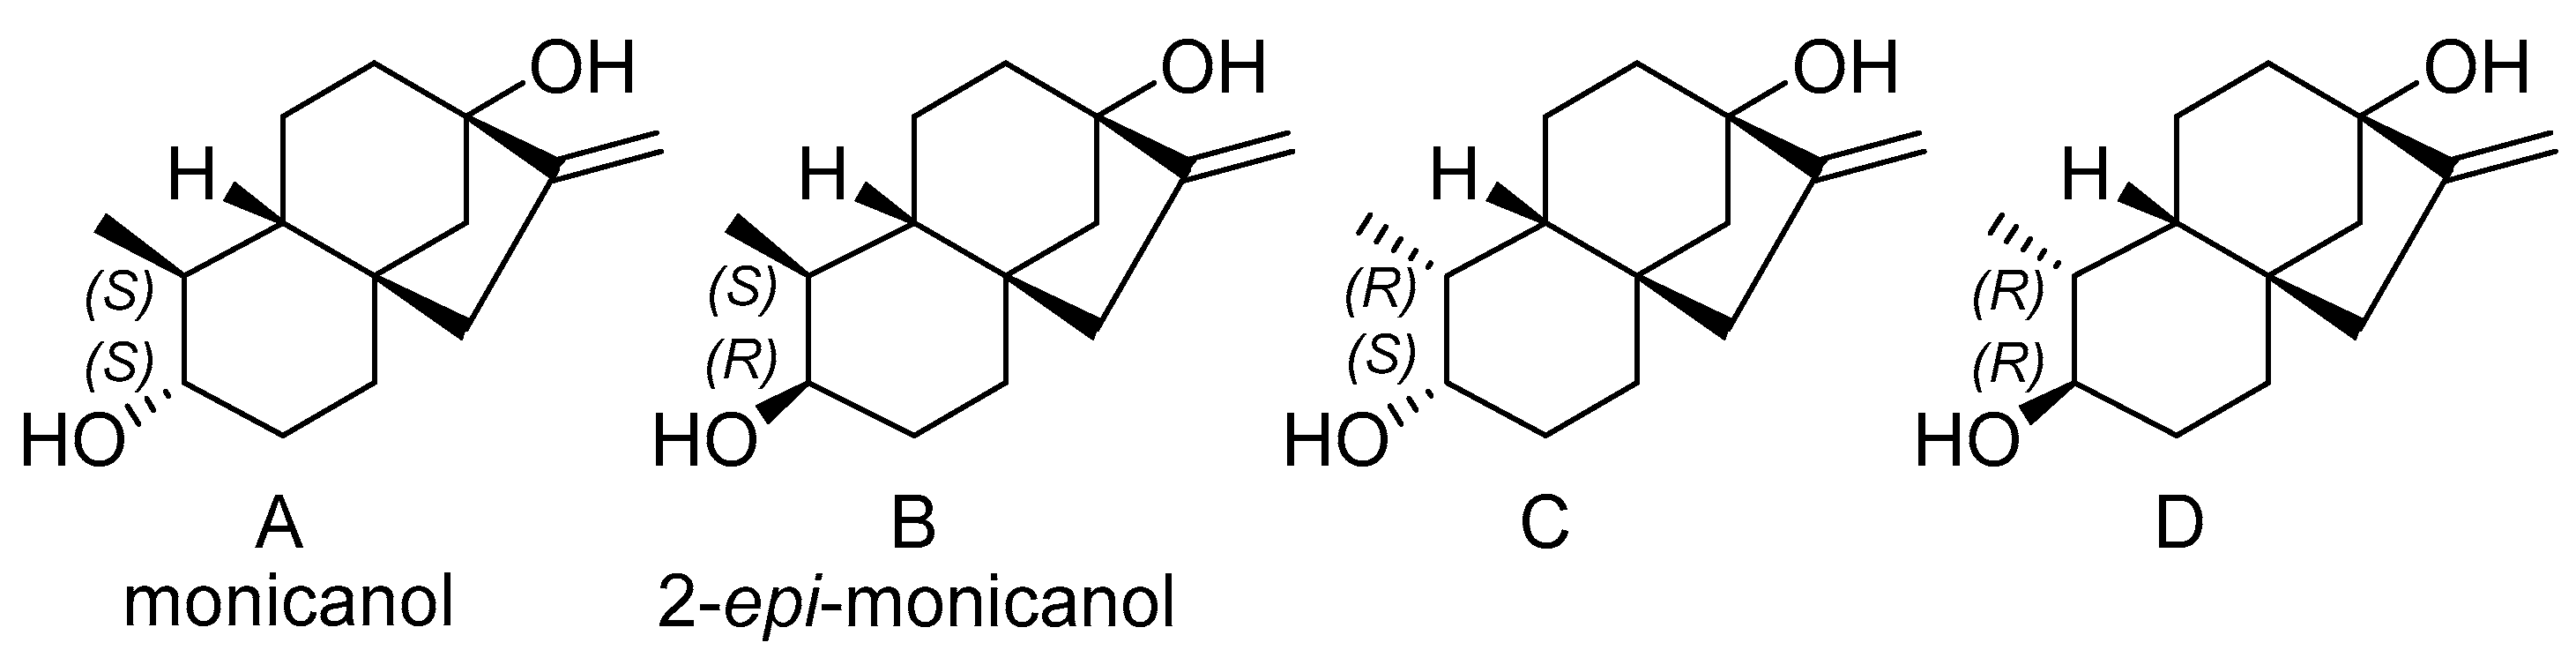
2.3. Characterization of the Second Compound: Monicanol
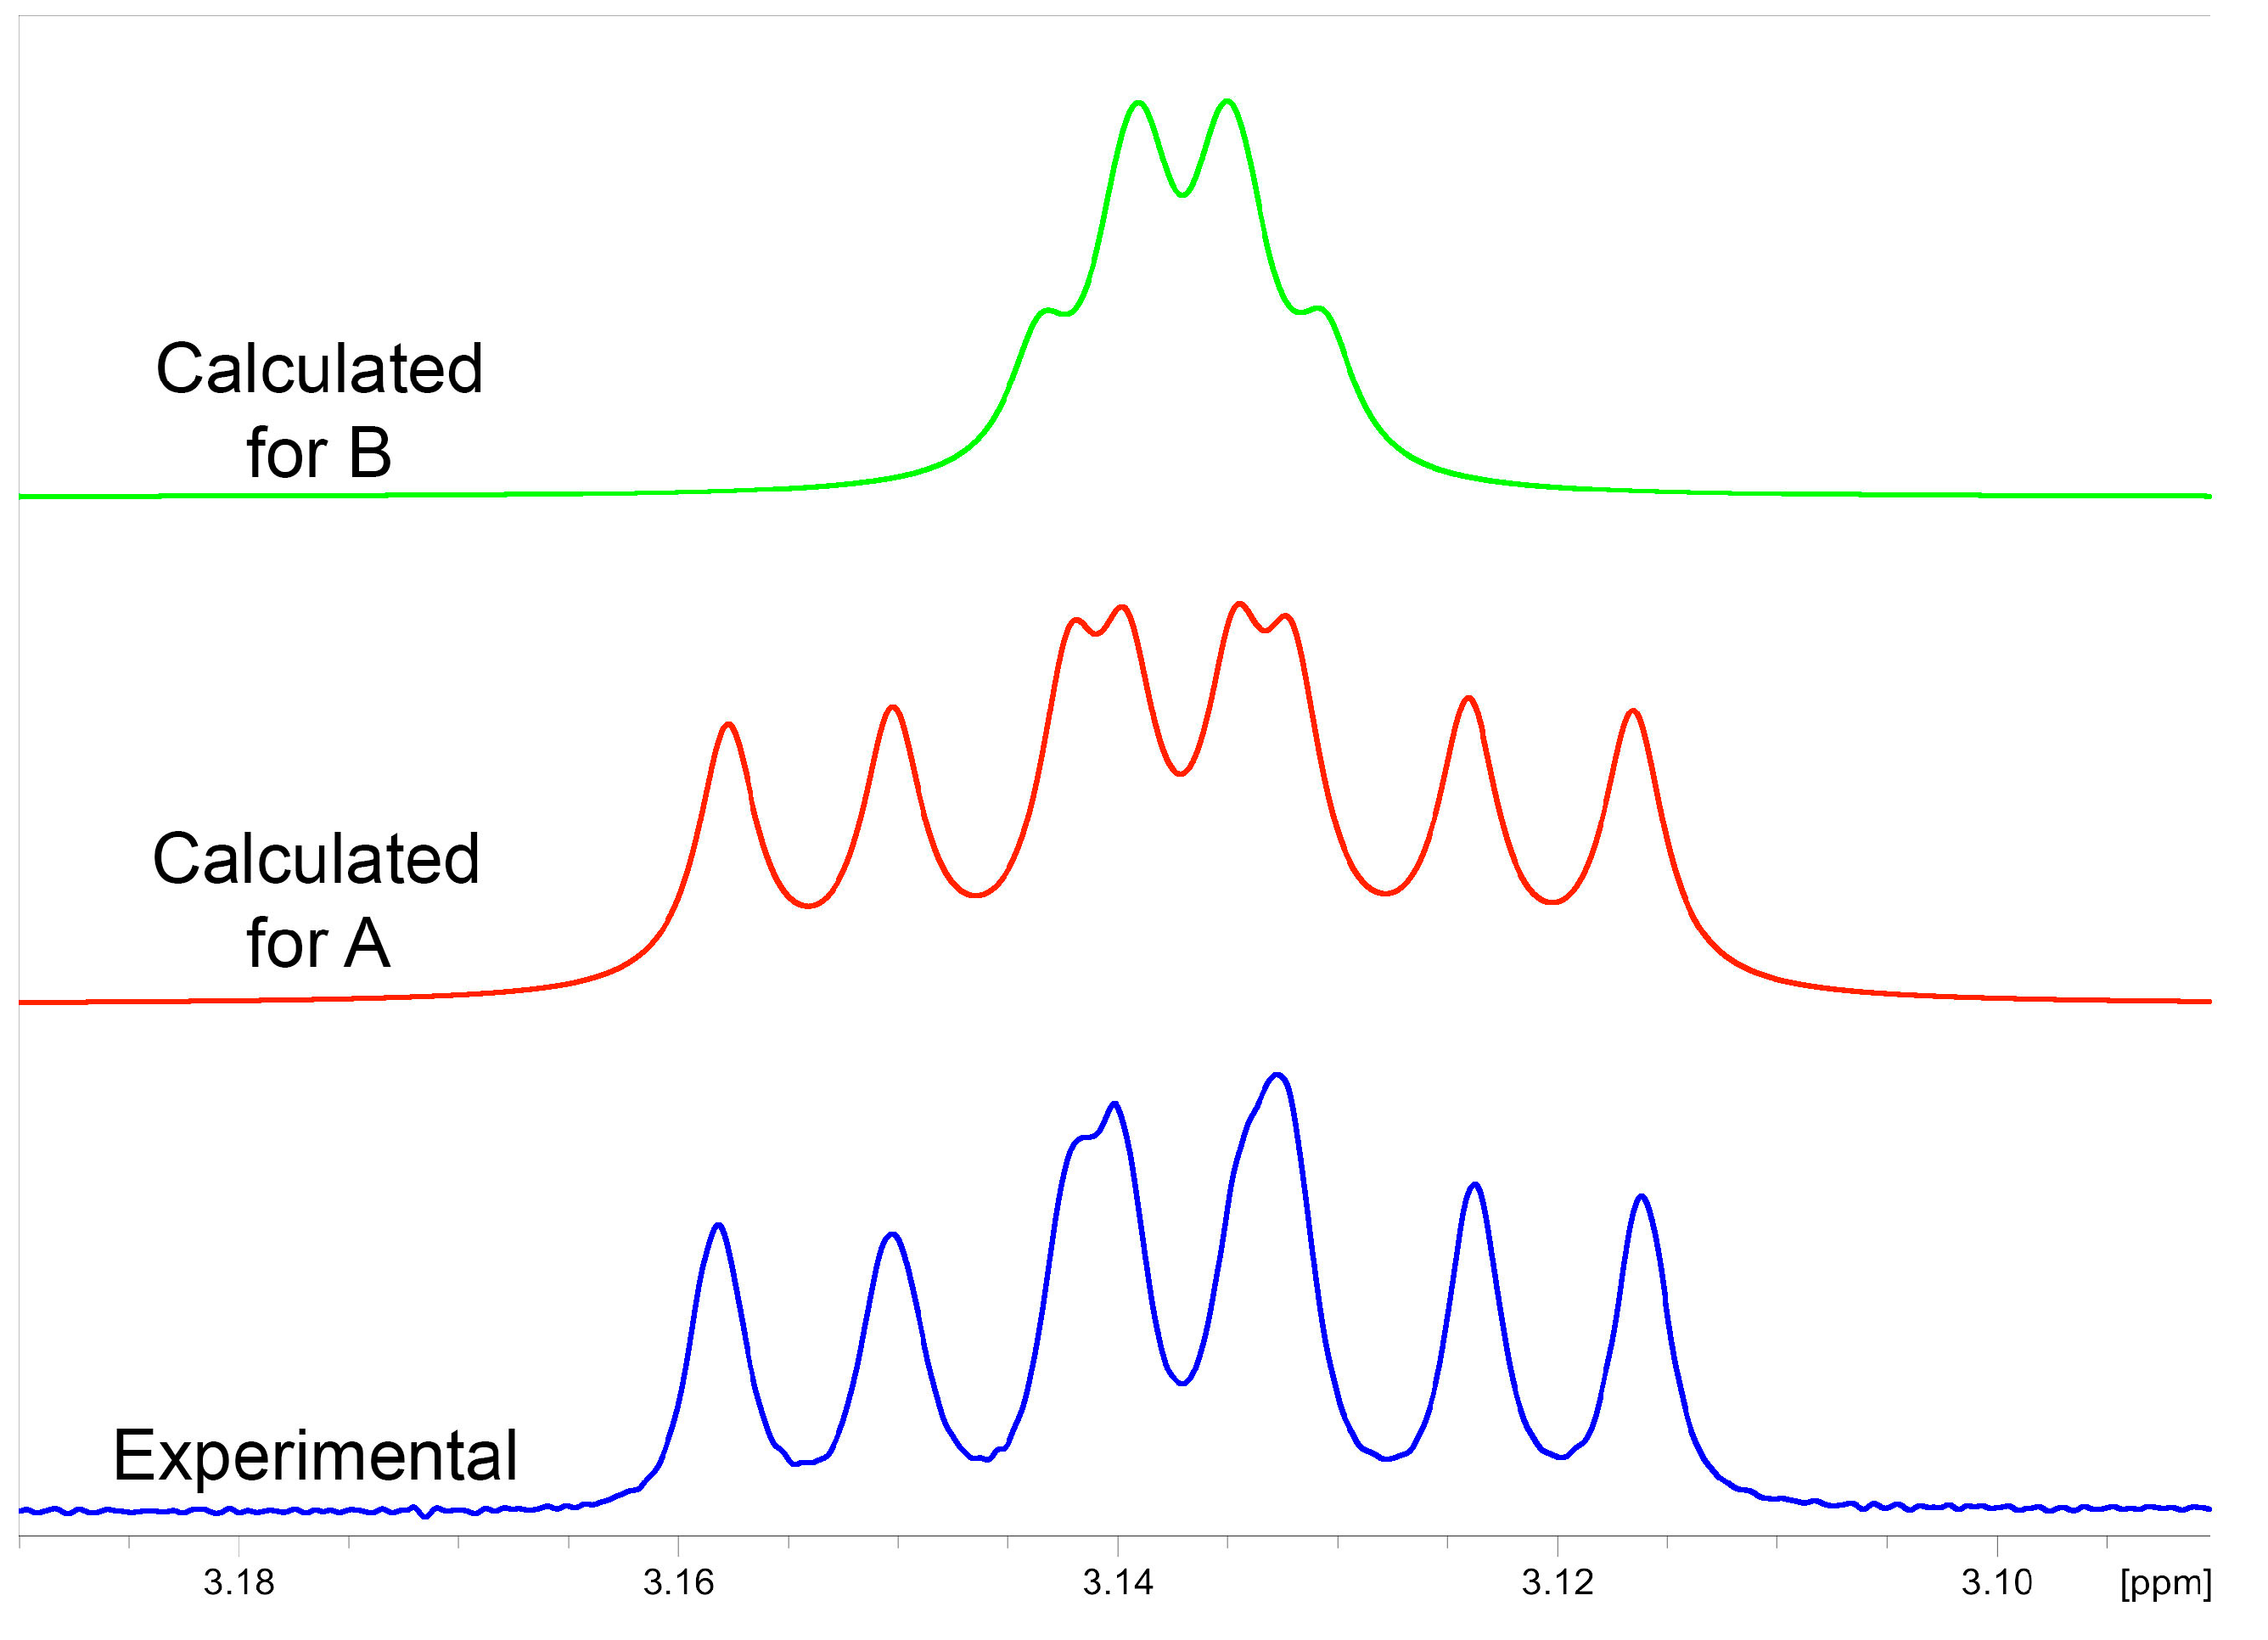
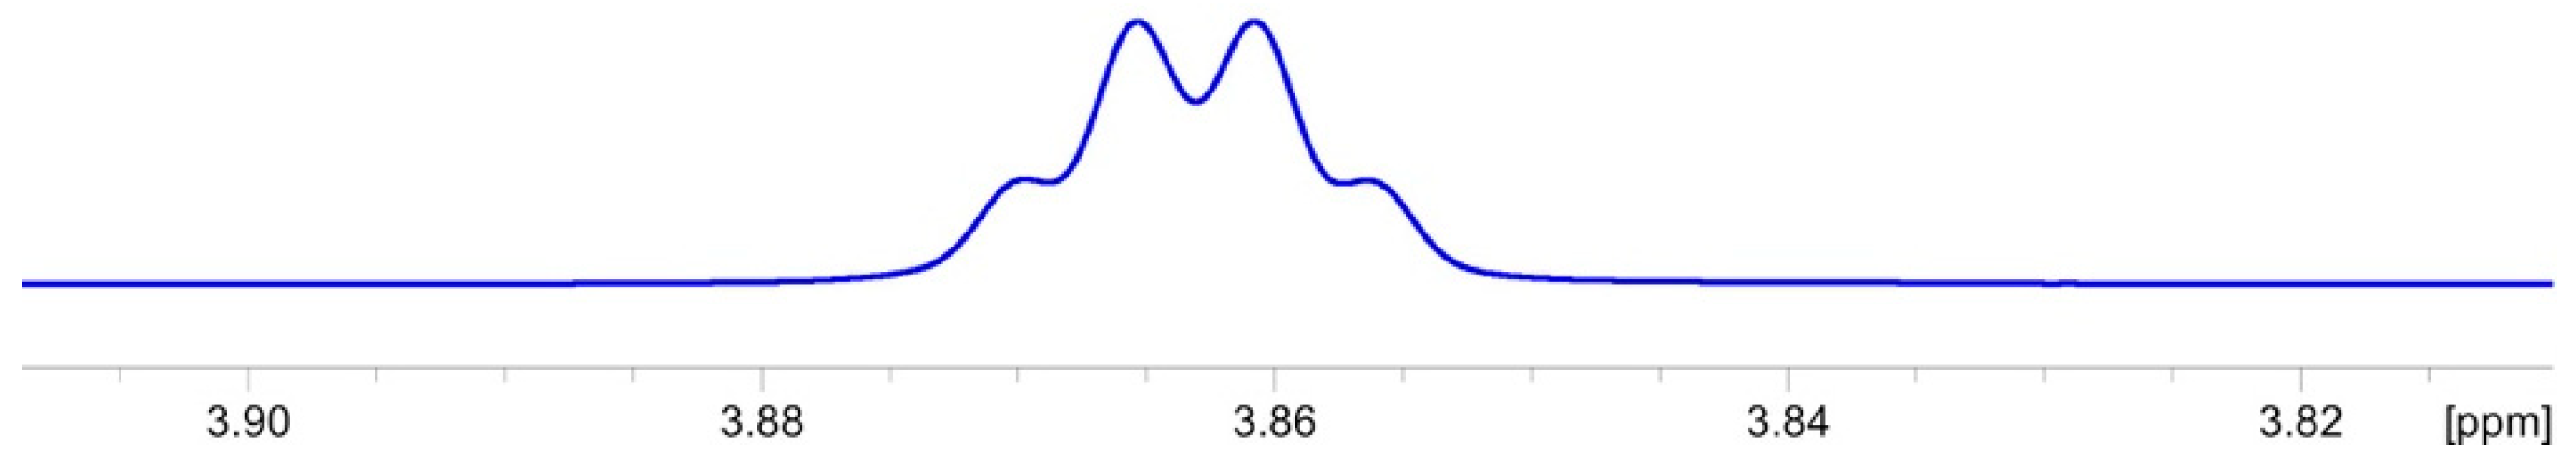
2.3.1. NMR Analysis
2.3.2. Chemical Synthesis of Monicanol and 2-epi-Monicanol
3. Experimental Section
3.1. Reagents and Materials
3.2. Methods
3.2.1. Thin-Layer Chromatography
3.2.2. Column Chromatography
3.2.3. Preparative High-Performance Liquid Chromatography
3.2.4. Nuclear Magnetic Resonance Spectroscopy
3.2.5. Infrared Spectroscopy
3.2.6. Ultraviolet/Visible Light Spectroscopy
3.2.7. Circular Dichroism Spectroscopy
3.2.8. High-Resolution Mass Spectrometry
3.2.9. Low-Resolution Mass Spectrometry
3.2.10. Single-Crystal X-ray Crystallography
3.2.11. NMR Calculations
3.2.12. Reduction of Monicanone—Synthesis of Monicanol and 2-epi-Monicanol
Supplementary Materials
Author Contributions
Funding
Institutional Review Board Statement
Informed Consent Statement
Data Availability Statement
Acknowledgments
Conflicts of Interest
References
- Geuns, J.M.C.; Buyse, J.; Vankeirsbilck, A.; Temme, E.H.M. Metabolism of stevioside by healthy subjects. Exp. Biol. Med. 2007, 232, 164–173, PMID: 17202597. [Google Scholar] [PubMed]
- Perera, W.H.; McChesney, J.D. Approaches toward the Separation, Modification, Identification and Scale up Purification of Tetracyclic Diterpene Glycosides from Stevia rebaudiana (Bertoni) Bertoni. Molecules. 2021, 26, 1915. [Google Scholar] [CrossRef] [PubMed]
- Ceunen, S.; Geuns, J.M.C. Steviol Glycosides: Chemical Diversity, Metabolism, and Function. J. Nat. Prod. 2013, 76, 1201–1228. [Google Scholar] [CrossRef] [PubMed]
- Meesschaert, B.; Moons, N.; Steurs, G.; Monballiu, A.; Amery, R.; Jooken, E.; Geuns, J. Degradation of steviol glycosides via steviol and Monicanone by soil microorganisms and UASB effluent. J. Env. Chem. Eng. 2021, 9, 106342. [Google Scholar] [CrossRef]
- Geuns, J.M.C.; Buyse, J.; Vankeirsbilck, A.; Temme, E.H.M.; Compernolle, F.; Toppet, S. Identification of Steviol Glucuronide in Human Urine. J. Agr. Food Chem. 2006, 54, 2794–2798. [Google Scholar] [CrossRef]
- Bally, T.; Rablen, P.R. Quantum-Chemical Simulation of 1H NMR Spectra. 2. Comparison of DFT-Based Procedures for Computing Proton–Proton Coupling Constants in Organic Molecules. J. Org. Chem. 2011, 76, 4818–4830. [Google Scholar] [CrossRef]
- CrysAlis PRO; Agilent Technologies UK Ltd.: Oxfordshire, UK, 2012.
- Dolomanov, O.V.; Bourhis, L.J.; Gildea, R.J.; Howard, J.A.K.; Puschmann, H. OLEX2: A complete structure solution, refinement and analysis program. J. Appl. Crystallogr. 2009, 42, 339–341. [Google Scholar] [CrossRef]
- Sheldrick, G.M. SHELXT—Integrated space-group and crystal-structure determination. Acta Crystallogr. Sect. A 2015, 71, 3–8. [Google Scholar] [CrossRef] [PubMed]
- Sheldrick, G.M. Crystal structure refinement with SHELXL. Acta Crystallogr. Sect. C Struct. Chem. 2015, 71, 3–8. [Google Scholar] [CrossRef]
- Frisch, M.J.; Trucks, G.W.; Schlegel, H.B.; Scuseria, G.E.; Robb, M.A.; Cheeseman, J.R.; Scalmani, G.; Barone, V.; Petersson, G.A.; Nakatsuji, H.; et al. Gaussian 16 Rev. A.03; Gaussian: Wallingford, UK, 2016. [Google Scholar]
- Lodewyk, M.W.; Siebert, M.R.; Tantillo, D.J. Computational Prediction of 1H and 13C Chemical Shifts: A Useful Tool for Natural Product, Mechanistic, and Synthetic Organic Chemistry. Chem. Rev. 2012, 112, 1839–1862. [Google Scholar] [CrossRef]

| Position | Monicanone | |
|---|---|---|
| 1 | 2.51 (dq, J = 12.3, 6.5 Hz) | 43.91 |
| 2 | 212.89 | |
| 3 | a: 2.40 (m) b: 2.44 (tdd, J = 13.8, 6.1, 1.0 Hz) | 39.61 |
| 4 | a: 1.86 (td, J = 13.8, 5.4 Hz) b: 1.72 (m) | 37.83 |
| 5 | 41.05 | |
| 6 | a: 1.54 (m) b: 2.21 (dd, J = 10.6, 2.5 Hz) | 45.37 |
| 7 | 80.31 | |
| 8 | a: 1.53 (m) b: 1.81 (m) | 35.72 |
| 9 | a: 1.71 (m) b: 1.78 (m) | 23.06 |
| 10 | 1.37 (dd, J = 12.3, 6.1 Hz) | 48.68 |
| 11 | a: 2.25 (ddd, J = 17.0, 2.5, 2.1 Hz) b: 2.36 (dt, J = 17.0, 2.7 Hz) | 43.74 |
| 12 | 154.72 | |
| 13 | a: 4.91 (t, J = 2.1 Hz) b: 5.07 (t, J = 2.7 Hz) | 104.17 |
| 14 | 1.05 (d, J = 6.5 Hz) | 11.92 |
| Isolated | Diastereomer A | Diastereomer B | Diastereomer C | Diastereomer D | ||||
|---|---|---|---|---|---|---|---|---|
| 15.63 | 14.14 | 1.49 | 15.77 | 0.14 | 9.39 | 6.24 | 15.56 | 0.07 |
| 21.88 | 22.98 | 1.10 | 22.88 | 1.00 | 26.60 | 4.72 | 25.89 | 4.01 |
| 32.63 | 33.82 | 1.19 | 32.24 | 0.39 | 29.29 | 3.34 | 28.02 | 4.61 |
| 36.18 | 35.62 | 0.56 | 33.04 | 3.14 | 36.44 | 0.26 | 31.72 | 4.46 |
| 36.45 | 38.27 | 1.82 | 36.06 | 0.39 | 41.50 | 5.05 | 38.28 | 1.83 |
| 38.26 | 38.91 | 0.65 | 38.96 | 0.70 | 42.07 | 3.81 | 41.63 | 3.37 |
| 41.03 | 43.96 | 2.93 | 41.26 | 0.23 | 43.29 | 2.26 | 42.17 | 1.14 |
| 44.56 | 44.66 | 0.10 | 44.00 | 0.56 | 43.96 | 0.60 | 43.38 | 1.18 |
| 45.90 | 45.35 | 0.55 | 44.93 | 0.97 | 46.06 | 0.16 | 46.52 | 0.62 |
| 46.27 | 46.97 | 0.70 | 45.13 | 1.14 | 47.03 | 0.76 | 46.85 | 0.58 |
| 76.57 | 74.93 | 1.64 | 72.31 | 4.26 | 73.13 | 3.44 | 72.75 | 3.82 |
| 80.48 | 80.85 | 0.37 | 80.95 | 0.47 | 80.81 | 0.33 | 80.89 | 0.41 |
| 103.44 | 102.41 | 1.03 | 102.43 | 1.01 | 102.47 | 0.97 | 102.02 | 1.42 |
| 155.72 | 158.36 | 2.64 | 158.75 | 3.03 | 158.18 | 2.46 | 158.40 | 2.68 |
| Sum of differences | 16.77 | 17.43 | 34.40 | 30.20 | ||||

| Position | Monicanol | 2-epi-monicanol | ||
|---|---|---|---|---|
| 1 | 1.54 (m) | 38.26 | 1.77 (dqd, J = 12.1, 6.8, 2.8 Hz) | 34.16 |
| 2 | 3.13 (ddd, J = 10.9, 9.7, 4.7 Hz) | 76.57 | 3.84 (dd, J = 5.8, 2.8 Hz) | 71.88 |
| 3 | a: 1.87 (m) b: 1.47 (m) | 32.63 | a: 1.76 (ddd, J = 14.2, 5.8, 3.8 Hz) b: 1.66 (tdd, J = 14.2, 4.3, 2.7 Hz) | 30.80 |
| 4 | a: 1.55 (td, J = 12.8, 2.9 Hz) b: 1.41 (dt, J = 12.8, 3.2 Hz) | 36.18 | a: 1.87 (ddd, J = 14.2, 13.2, 3.8 Hz) b: 1.15 (ddd, J = 13.2, 4.3, 2.7 Hz) | 32.16 |
| 5 | 41.03 | 41.26 | ||
| 6 | a: 1.30 (ddd, J = 10.8, 3.2, 1.2 Hz) b: 2.00 (dd, J = 10.8, 2.7 Hz) | 45.90 | a: 1.27 (ddd, J = 10.8, 3.1, 1.1 Hz) b: 1.98 (dd, J = 10.8, 2.3 Hz) | 45.34 |
| 7 | 80.48 | 80.56 | ||
| 8 | a: 1.44 (dddd, J = 11.3, 5.3, 3.2, 1.7 Hz) b: 1.69 (ddd, J = 13.7, 11.3, 4.9 Hz) | 36.45 | a: 1.44 (m) b: 1.67 (m) | 36.38 |
| 9 | a: 1.59 (m) b: 1.80 (ddt, J = 14.2, 4.9, 1.7 Hz) | 21.88 | a: 1.62 (m) b: 1.68 (m) | 21.64 |
| 10 | 0.98 (dd, J = 11.5, 6.5 Hz) | 46.27 | 1.45 (dd, J = 12.1, 6.1 Hz | 40.57 |
| 11 | a: 2.17 (ddd, J = 17.0, 4.6, 2.3 Hz) b: 2.24 (dt, J = 17.0, 2.7 Hz) | 44.56 | a: 2.25 (ddd, J = 17.1, 4.5, 2.3 Hz) b: 2.21 (dt, J = 17.1, 2.7 Hz) | 44.95 |
| 12 | 155.72 | 156.00 | ||
| 13 | a: 4.85 (ddt, J = 2.6, 1.9, 0.7 Hz) b: 5.00 (ddd, J = 3.0, 2.3, 0.7 Hz) | 103.44 | a: 4.85 (ddt, J = 2.7, 2.3, 0.7 Hz b: 4.98 (ddd, J = 2.7, 2.3, 0.7 Hz) | 103.25 |
| 14 | 1.03 (d, J = 6.3 Hz) | 15.63 | 0.99 (d, J = 6.8 Hz) | 16.43 |
Publisher’s Note: MDPI stays neutral with regard to jurisdictional claims in published maps and institutional affiliations. |
© 2021 by the authors. Licensee MDPI, Basel, Switzerland. This article is an open access article distributed under the terms and conditions of the Creative Commons Attribution (CC BY) license (https://creativecommons.org/licenses/by/4.0/).
Share and Cite
Steurs, G.; Moons, N.; Van Meervelt, L.; Meesschaert, B.; De Borggraeve, W.M. Characterization of Microbial Degradation Products of Steviol Glycosides. Molecules 2021, 26, 6916. https://doi.org/10.3390/molecules26226916
Steurs G, Moons N, Van Meervelt L, Meesschaert B, De Borggraeve WM. Characterization of Microbial Degradation Products of Steviol Glycosides. Molecules. 2021; 26(22):6916. https://doi.org/10.3390/molecules26226916
Chicago/Turabian StyleSteurs, Gert, Nico Moons, Luc Van Meervelt, Boudewijn Meesschaert, and Wim Michel De Borggraeve. 2021. "Characterization of Microbial Degradation Products of Steviol Glycosides" Molecules 26, no. 22: 6916. https://doi.org/10.3390/molecules26226916
APA StyleSteurs, G., Moons, N., Van Meervelt, L., Meesschaert, B., & De Borggraeve, W. M. (2021). Characterization of Microbial Degradation Products of Steviol Glycosides. Molecules, 26(22), 6916. https://doi.org/10.3390/molecules26226916