
Valorization Potentials of Rapeseed Meal in a Biorefinery Perspective: Focus on Nutritional and Bioactive Components

 ,
,  ,
, 
 ,
,  ,
,  ,
,
Abstract
: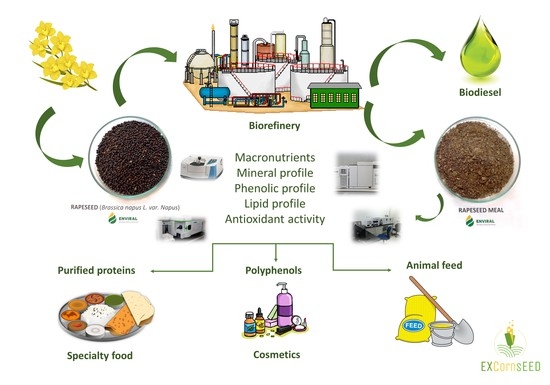
1. Introduction
2. Results and Discussion
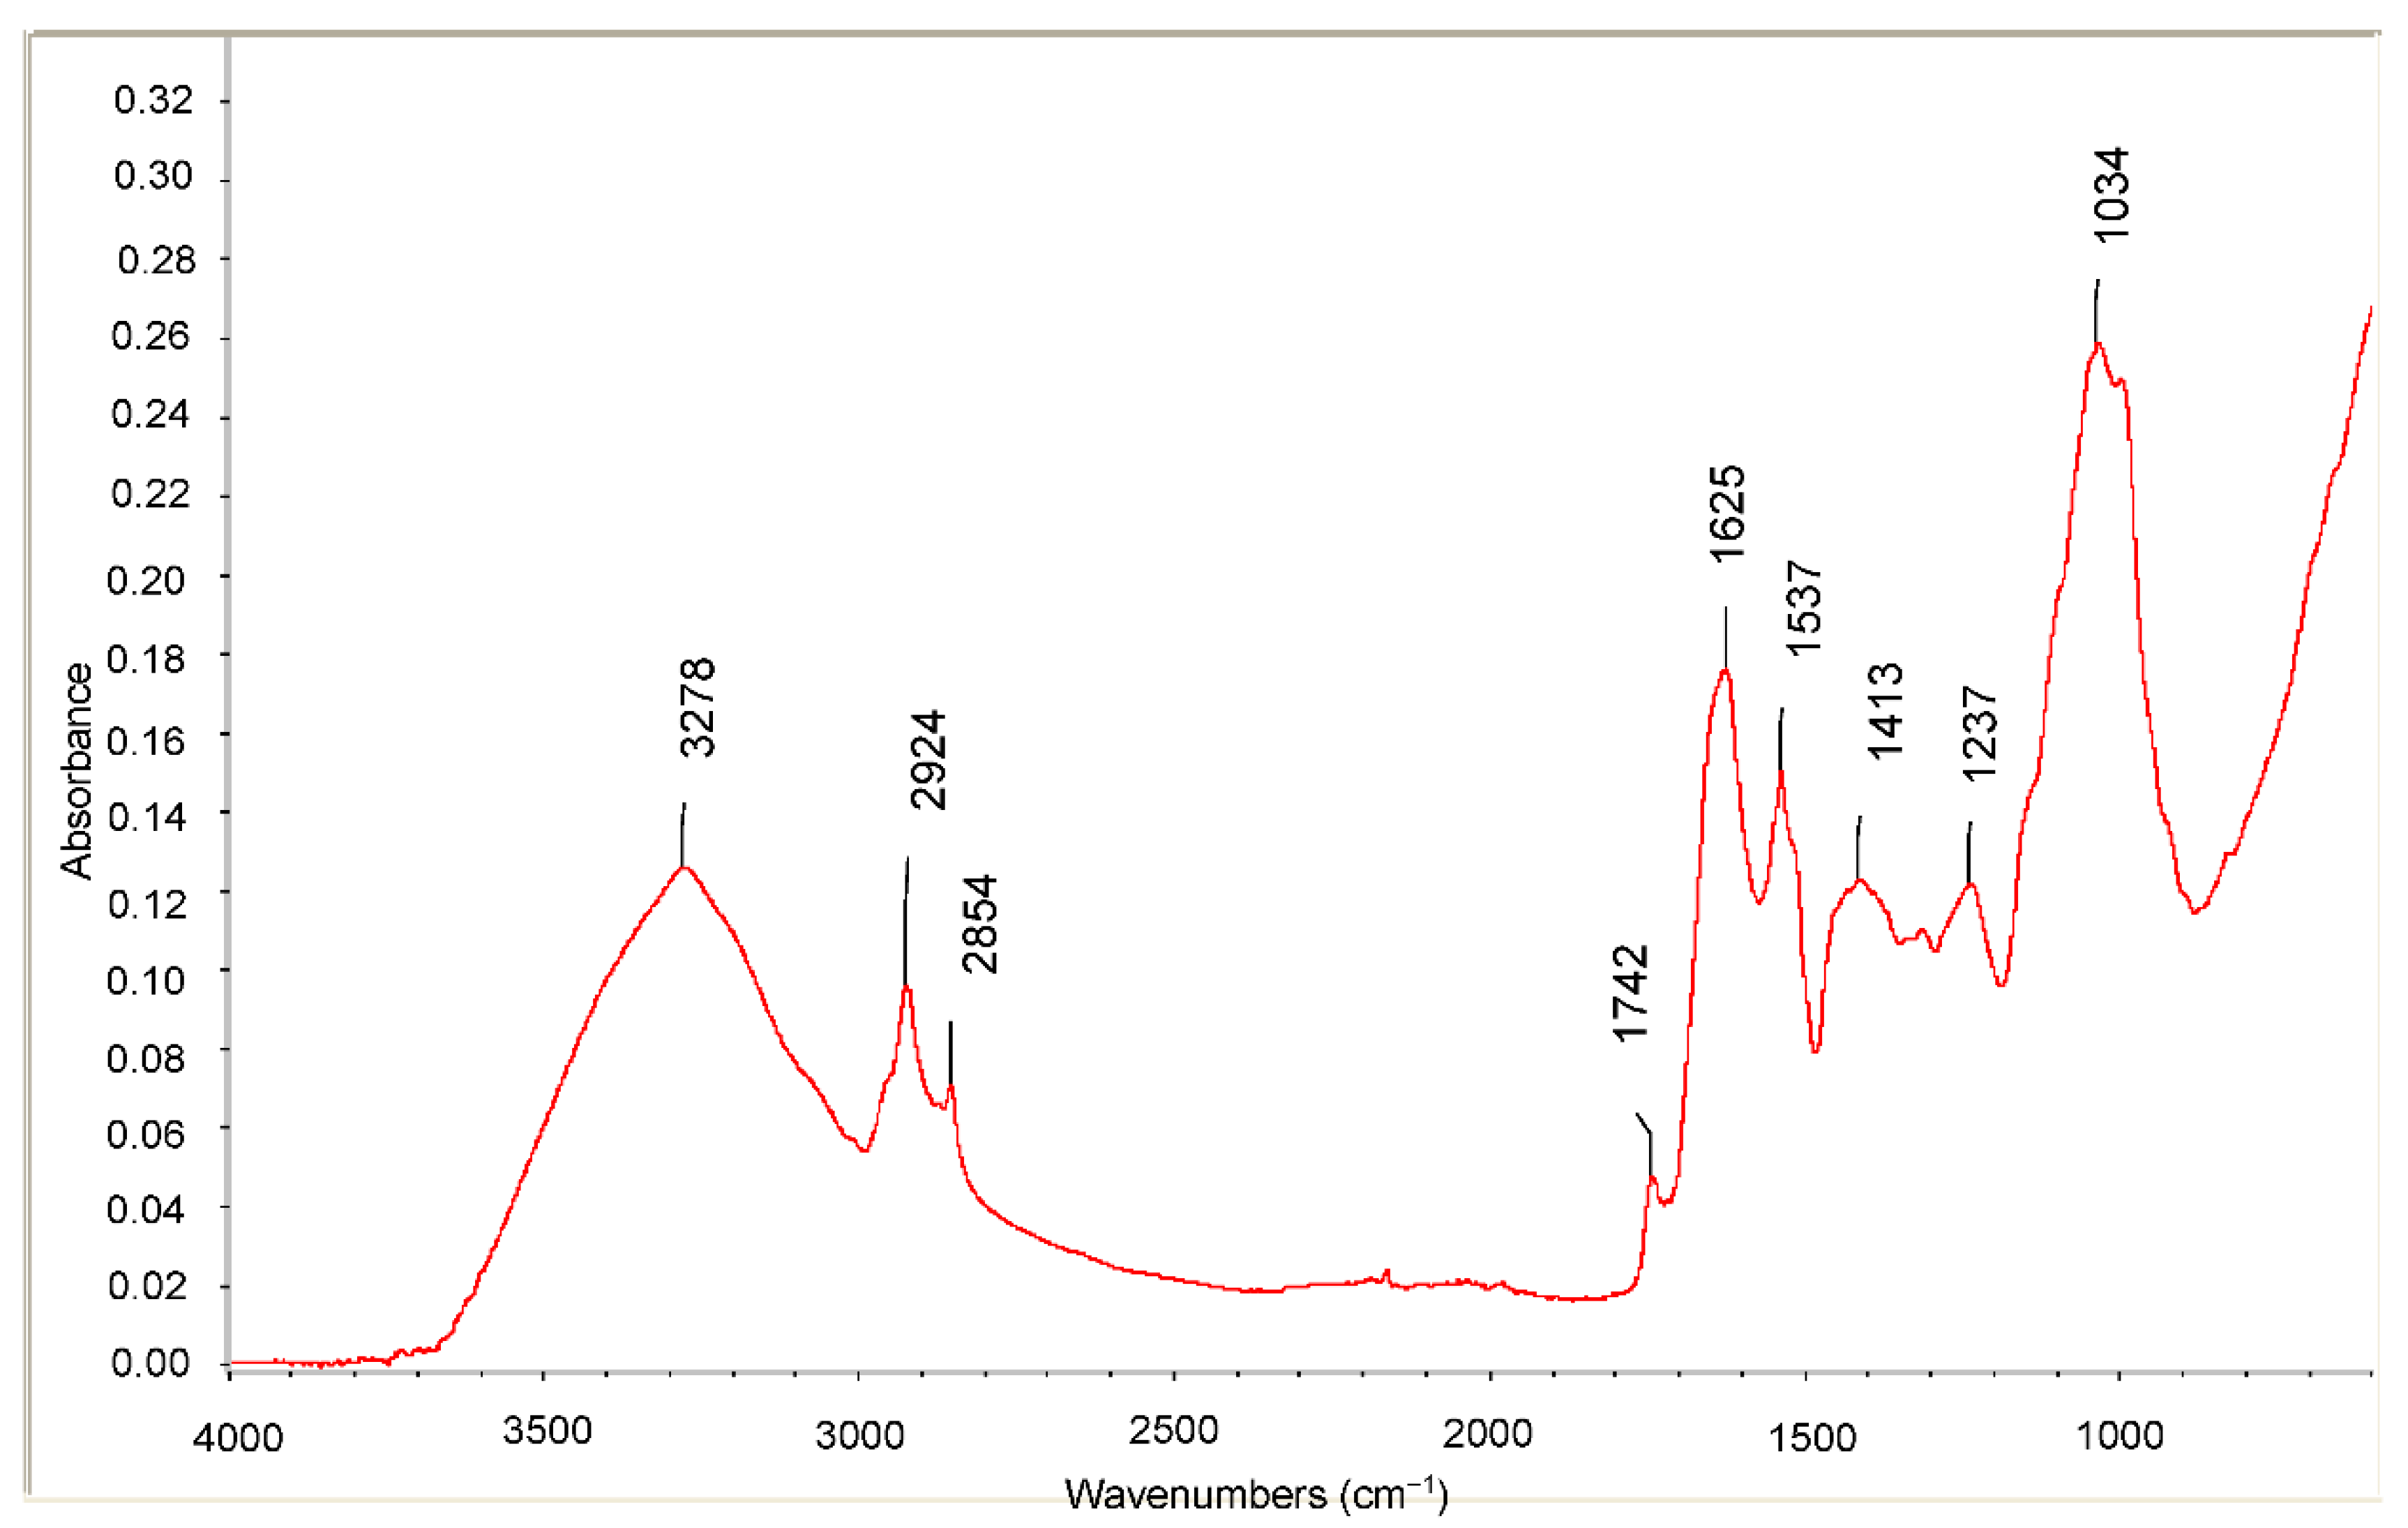
2.1. Qualitative Analysis of Main Functional Groups: The Fourier Transform Infrared-Attenuated Total Reflection (FTIR-ATR) Approach
2.2. Macronutrients and Minerals
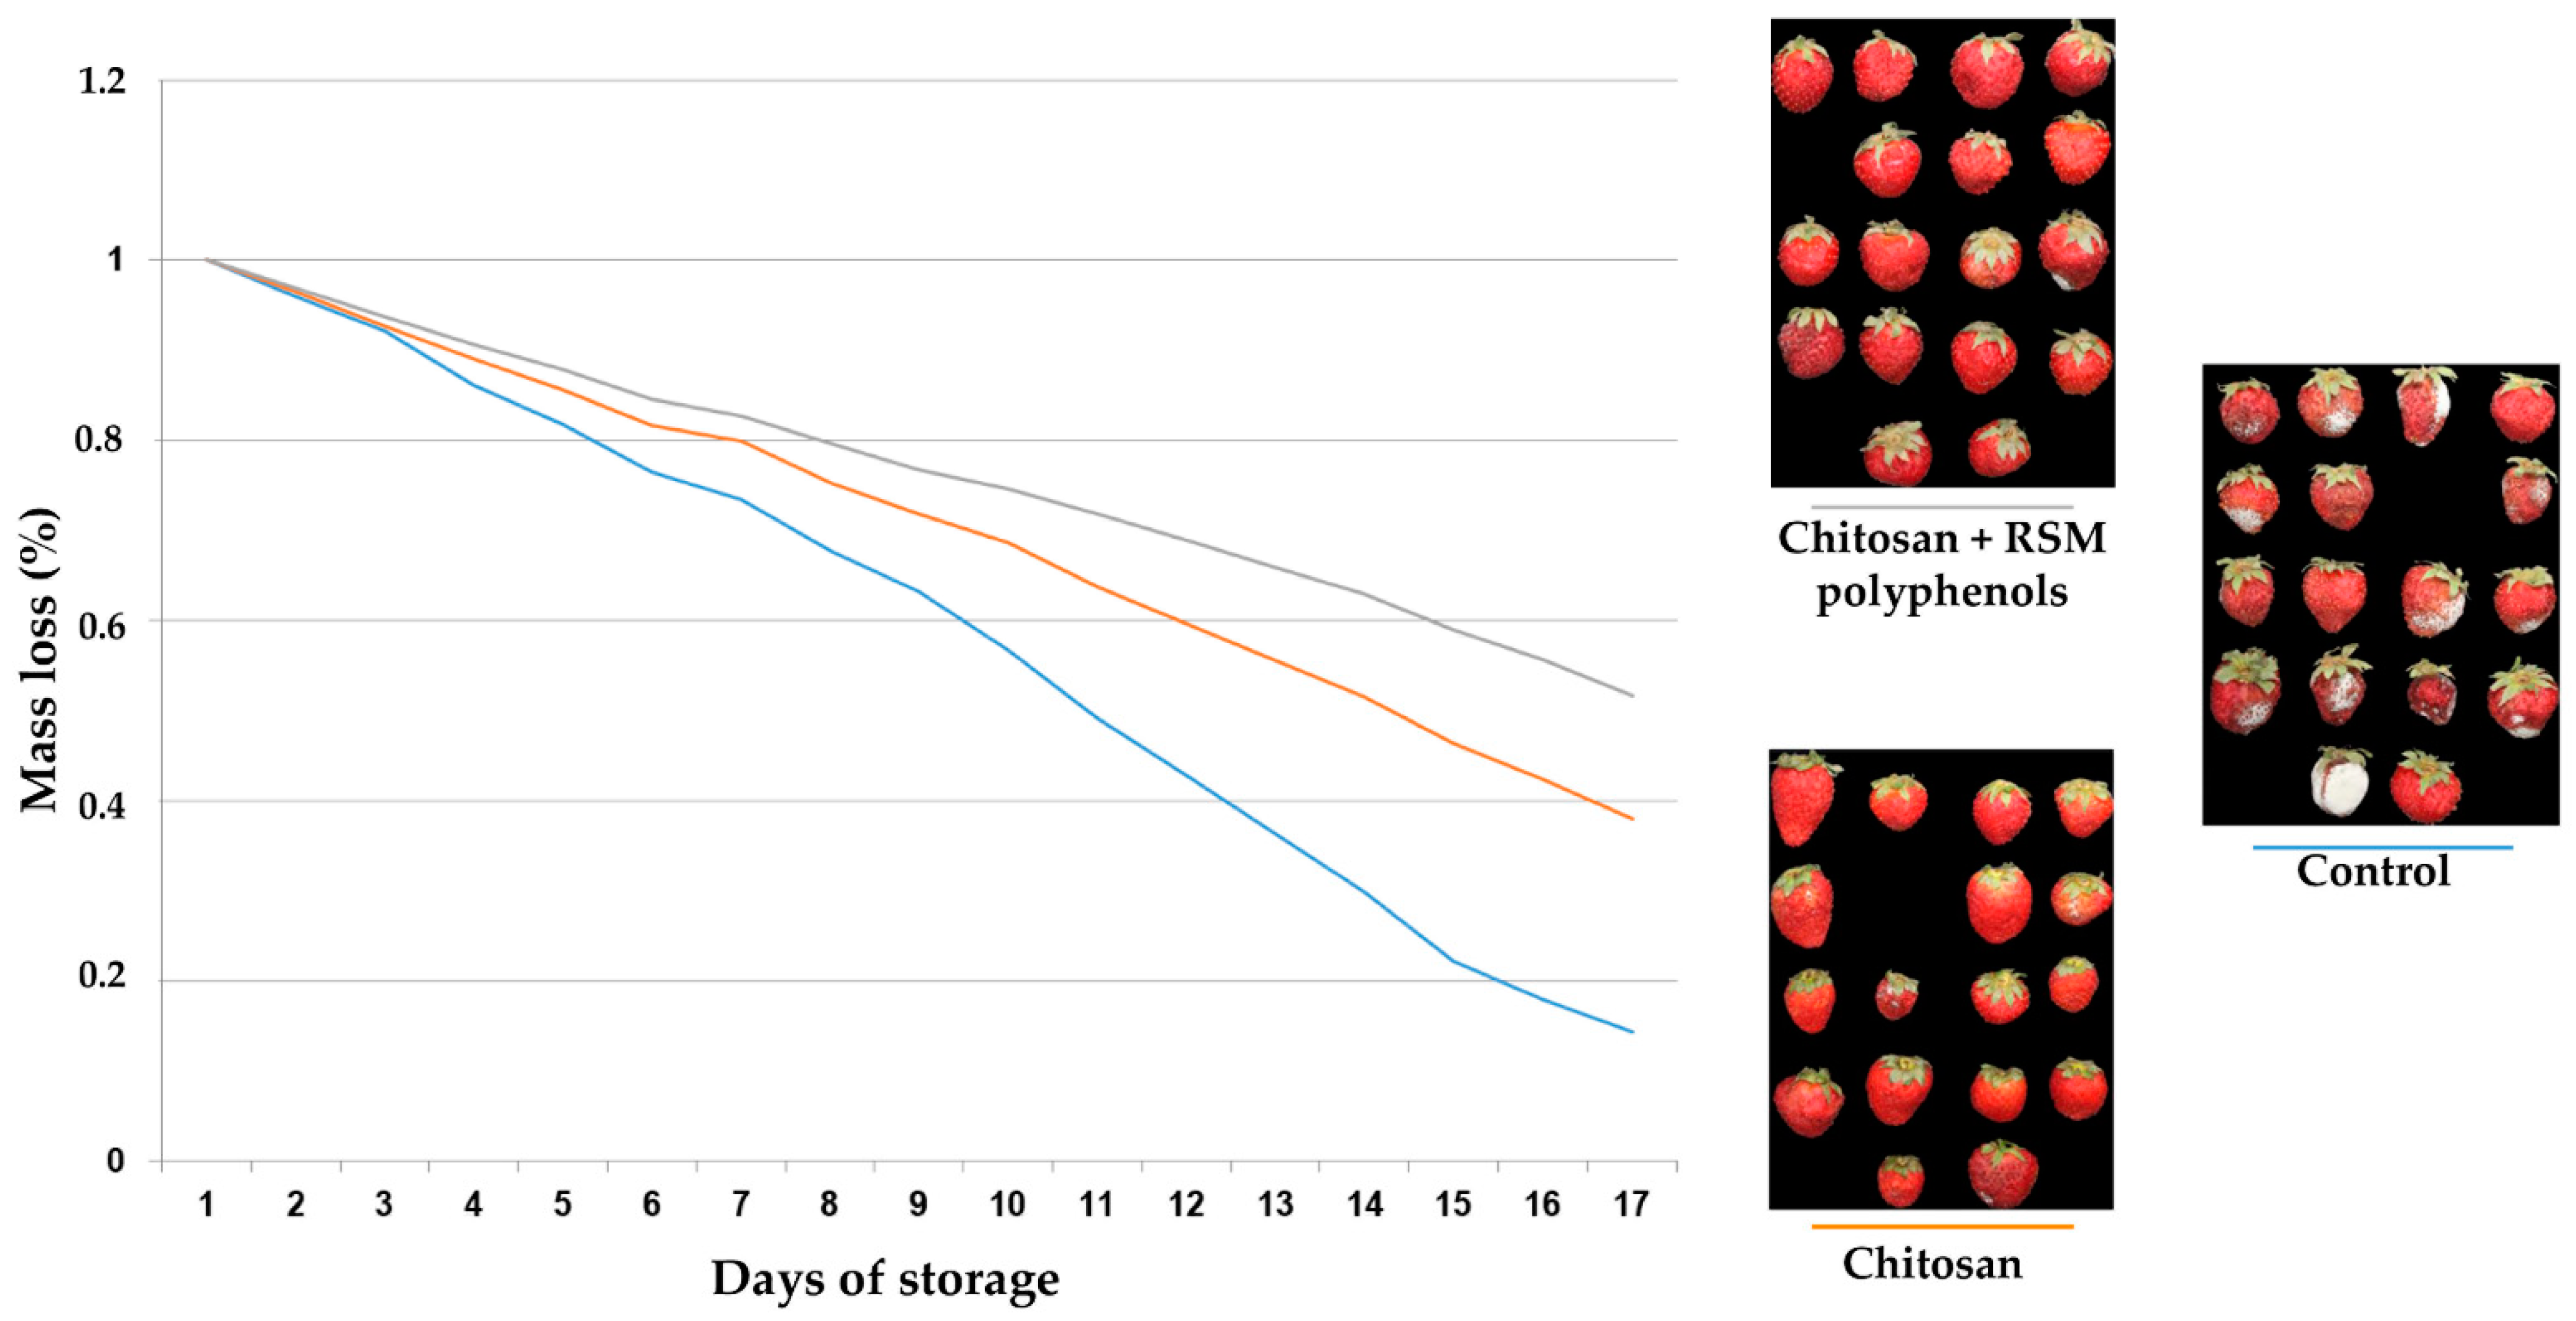
2.3. Polyphenols
2.4. Lipid Fraction Profile: Fatty Acids and Unsaponifiables
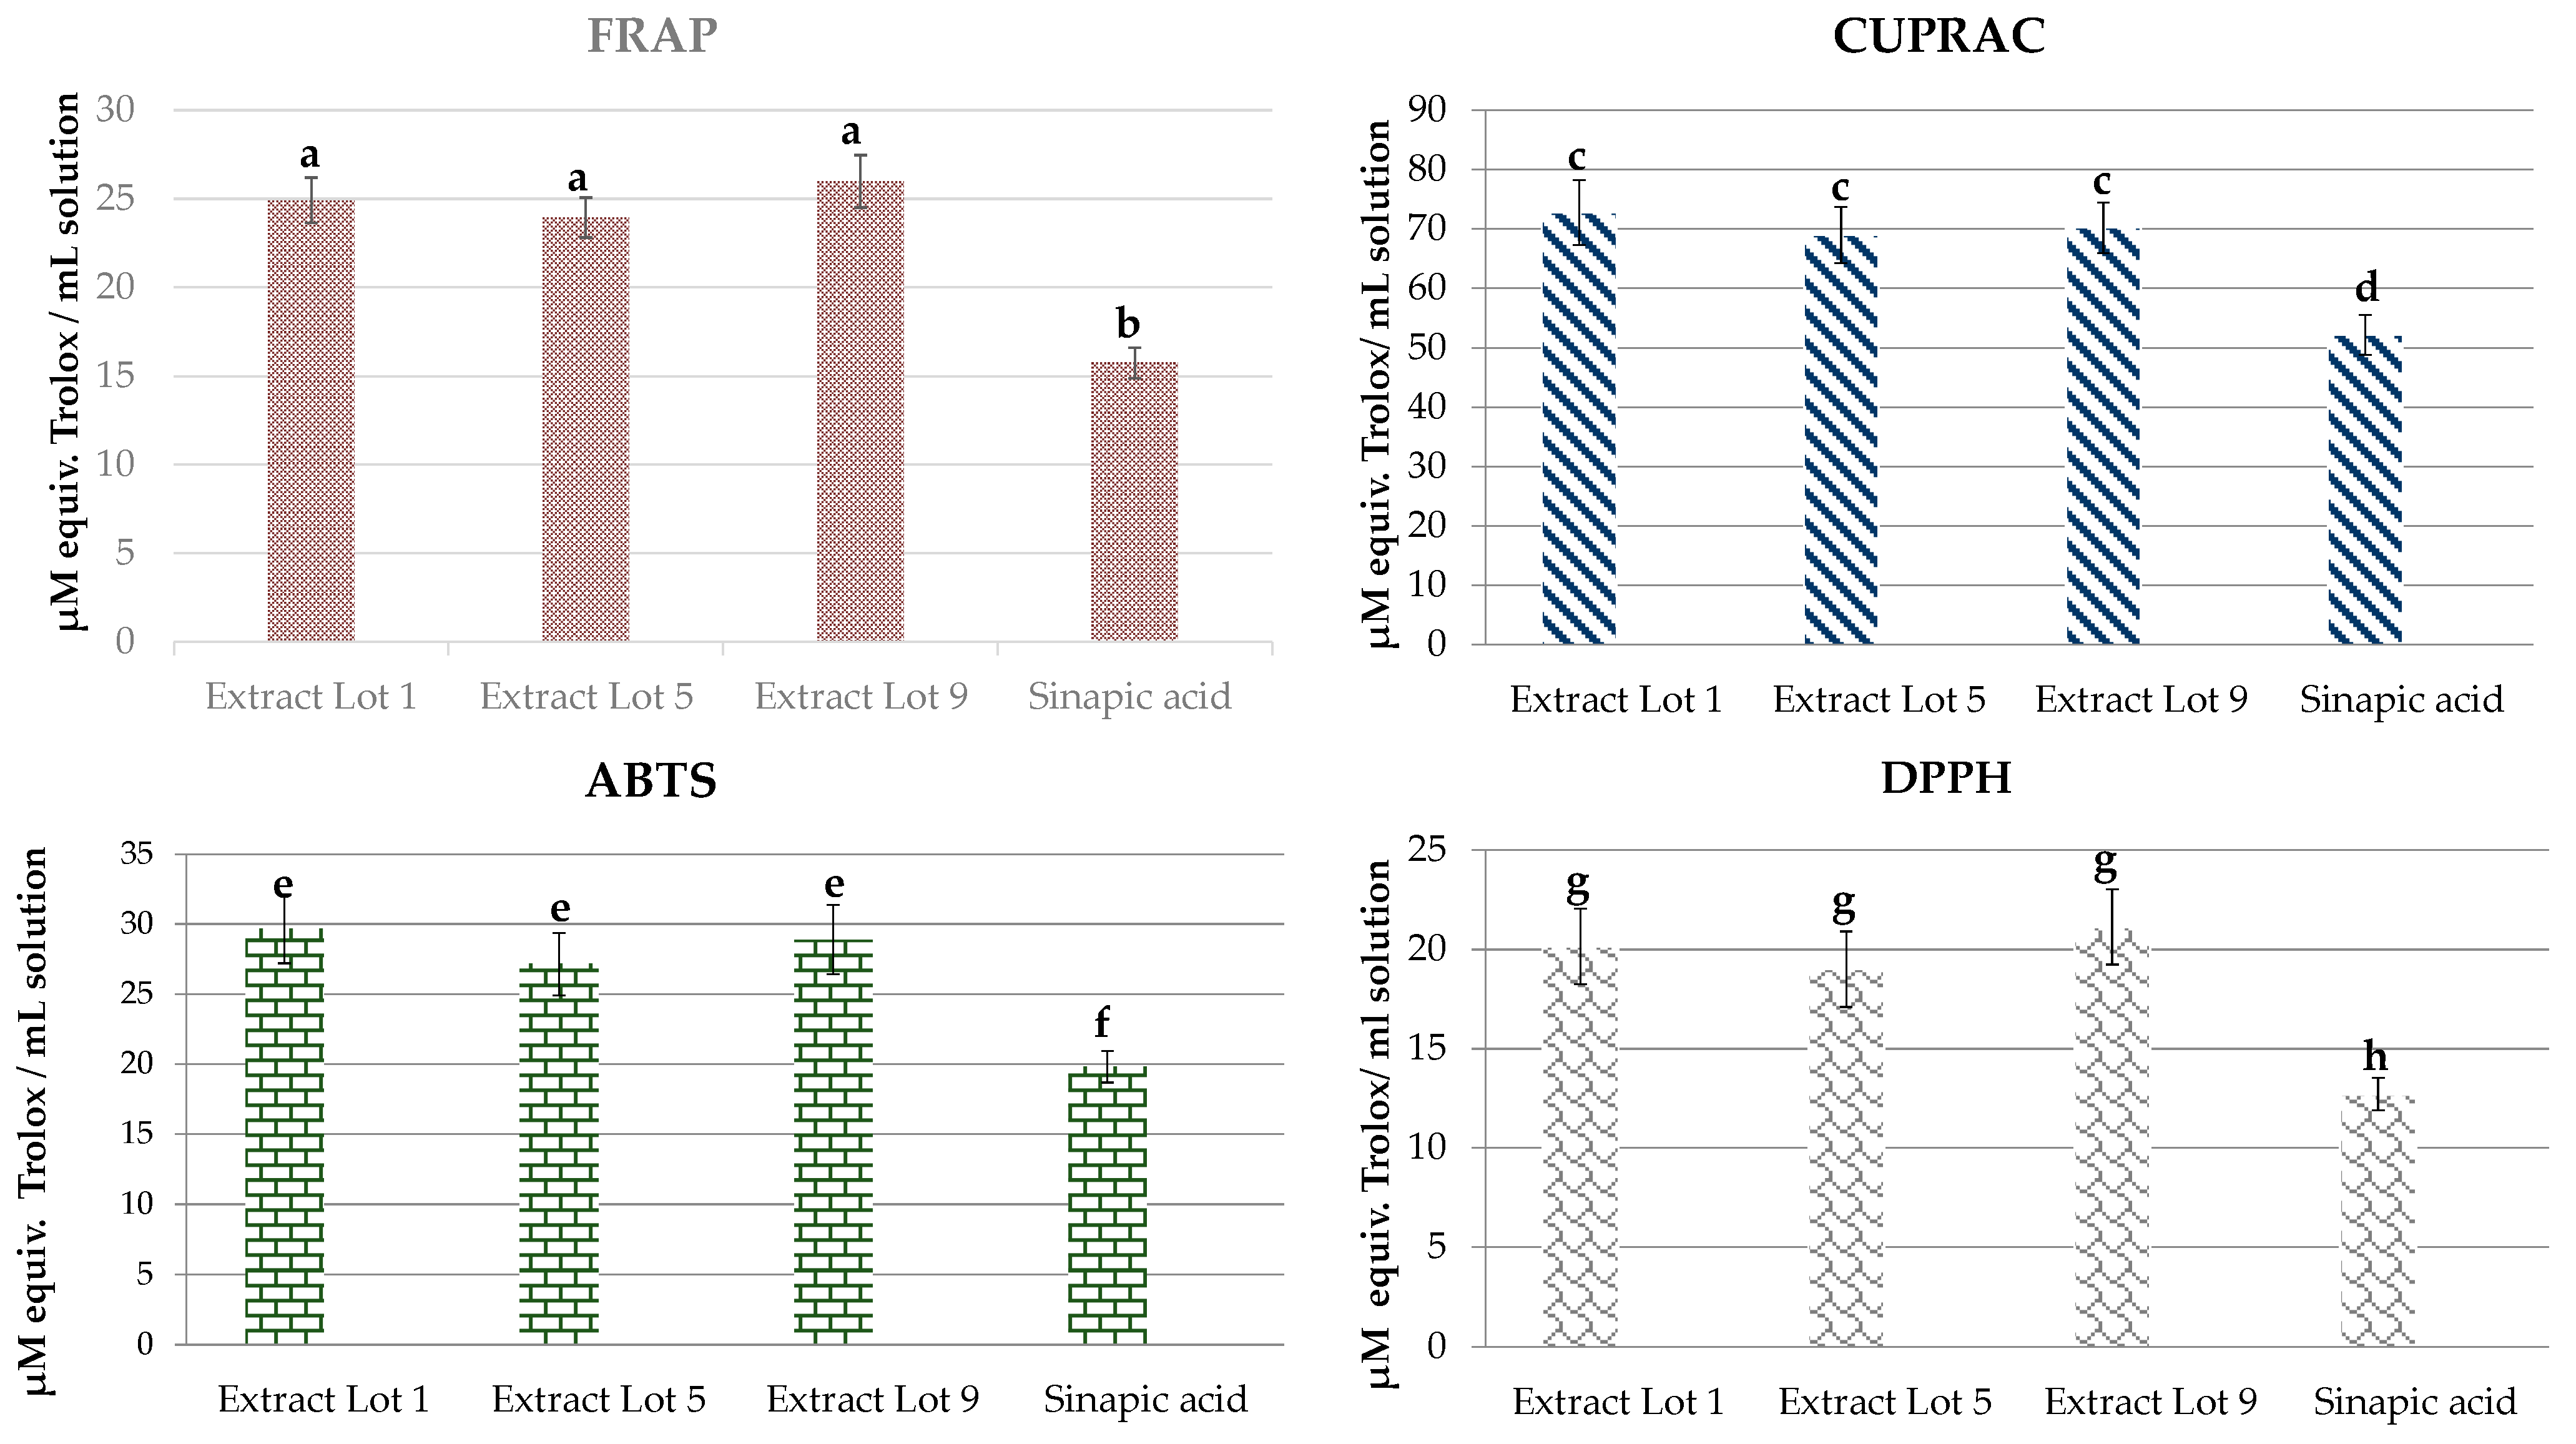
2.5. Antioxidant Activity
3. Materials and Methods
3.1. Rapeseed Origin
3.2. Rapeseed Meal Production and Quality Check at the Factory
3.3. Rapeseed Meal Sampling
3.4. Chemicals
3.5. Analytical Methods
3.5.1. FTIR-ATR Analysis
3.5.2. Macronutrients and Minerals
3.5.3. Phenolic Compounds
3.5.4. Total Lipids and Fatty Acids
3.5.5. Unsaponifiable Lipid Fraction
3.5.6. Antioxidant Activity
3.5.7. Quality Assurance
3.5.8. Data Treatment
4. Conclusions
Supplementary Materials
Author Contributions
Funding
Institutional Review Board Statement
Informed Consent Statement
Data Availability Statement
Acknowledgments
Conflicts of Interest
References
- Production Volume of Rapeseed Oil Worldwide from 2012/13 to 2020/21. Available online: https://www.statista.com/statistics/613487/rapeseed-oil-production-volume-worldwide (accessed on 31 August 2021).
- Future Market Insights (2018) Rapeseed Oil Market: Industrial Applications of Rapeseed Oil in Biodiesel Production to Compete with Its Use in Food Processing: Global Industry Analysis (2013–2017) & Opportunity Assessment (2018–2027). Available online: https://www.futuremarketinsights.com/reports/rapeseed-oil-market (accessed on 25 June 2021).
- European Commission. Directive 2009/28/EC of the European Parliament and of the Council of 23 April 2009 on the promotion of the use of energy from renewable sources and amending and subsequently repealing Directives 2001/77/EC and 2003/30/EC. Off. J. Eur. Union 2009, 2009, 5. [Google Scholar]
- European Commission. Directive 2009/30/EC of The European Parliament and of the Council of 23 April 2009 Amending Directive 98/70/EC as Regards the Specification of Petrol, Diesel and Gas-Oil and Introducing a Mechanism to Monitor and Reduce Greenhouse Gas Emissions and Amending Council Directive 1999/32/EC as Regards the Specification of Fuel Used by Inland Waterway Vessels and Repealing Directive 93/12/EEC, 2009. Off. J. Eur. Union 2009, L144/88. Available online: https://eur-lex.europa.eu/LexUriServ/LexUriServ.do?uri=OJ:L:2009:140:0088:0113:EN:PDF (accessed on 5 November 2021).
- European Commission. Directive (EU) 2015/1513 of the European Parliament and of the Council of 9 September 2015 Amending Directive 98/70/EC Relating to the Quality of Petrol and Diesel Fuels and Amending Directive 2009/28/EC on the Promotion of the Use of Energy from Renewable Sources. Off. J. Eur. Union 2015, L239/1. Available online: https://eur-lex.europa.eu/legal-content/EN/TXT/?uri=celex%3A32015L1513 (accessed on 5 November 2021).
- European Parliament. Report on a European Strategy for the Promotion of Protein Crops–Encouraging the Production of Protein and Leguminous Plants in the European Agriculture Sector (2017/2116(INI)). Committee on Agriculture and Rural Development, European Parliament. Available online: https://www.europarl.europa.eu/doceo/document/TA-8-2018-0095_EN.html (accessed on 16 April 2021).
- USDA United States Department of Agriculture. Foreign Agricultural Service, Oilseeds and Products Annual, EU Oilseeds Report Annual 2020, Global Agricultural Information Network, Vienna 15 April 2021. Report Number: E42021-0036. Available online: https://www.fas.usda.gov/data/european-union-oilseeds-and-products-annual-1 (accessed on 18 June 2021).
- Di Lena, G.; del Pulgar, J.S.; Lombardi Boccia, G.; Casini, I.; Ferrari Nicoli, S. Corn Bioethanol Side Streams: A Potential Sustainable Source of Fat-Soluble Bioactive Molecules for High-Value Applications. Foods 2020, 9, 1788. [Google Scholar] [CrossRef] [PubMed]
- Di Lena, G.; Ondrejíčková, P.; del Pulgar, J.S.; Cyprichová, V.; Ježovič, T.; Lucarini, M.; Lombardi Boccia, G.; Nicoli, S.F.; Gabrielli, P.; Aguzzi, A.; et al. Towards a valorization of corn bioethanol side streams: Chemical characterization of post fermentation corn oil and thin stillage. Molecules 2020, 25, 3549. [Google Scholar] [CrossRef]
- Arrutia, F.; Binner, E.; Williams, P.; Waldron, K.W. Oilseeds beyond oil: Press cakes and meals supplying global protein requirements. Trends Food Sci. Technol. 2020, 100, 88–102. [Google Scholar] [CrossRef]
- Mattila, P.H.; Pihlava, J.-M.; Hellström, J.; Nurmi, M.; Eurola, M.; Mäkinen, S.; Jalava, T.; Pihlanto, A. Contents of phytochemicals and antinutritional factors in commercial protein-rich plant products. Food Qual. Saf. 2018, 2, 213–219. [Google Scholar] [CrossRef]
- Jia, W.; Rodriguez-Alonso, E.; Bianeis, M.; Keppler, J.K.; van der Goot, A.J. Assessing functional properties of rapeseed protein concentrate versus isolate for food applications. Innov. Food Sci. Emerg. Technol. 2021, 68, 102636. [Google Scholar] [CrossRef]
- Szydłowska-Czerniak, A. Rapeseed and its products--sources of bioactive compounds: A review of their characteristics and analysis. Crit. Rev. Food Sci. Nutr. 2013, 53, 307–330. [Google Scholar] [CrossRef]
- Du, Y.; Jiang, X.; Lv, G.; Li, X.; Chi, Y.; Yan, J.; Liu, X.; Buekens, A. TG-pyrolysis and FTIR analysis of chocolate and biomass waste. J. Therm. Anal. Calorim. 2014, 117, 343–353. [Google Scholar] [CrossRef]
- Sajdak, M.; Kotyczka-Morańska, M. Development and validation of a fast method based on infrared spectroscopy for biochar quality assessment. Biom. Bioenerg. 2018, 112, 99–109. [Google Scholar] [CrossRef]
- Durango Padilla, E.R.; Nakashima, G.T.; Santiago Hansted, A.L.; Ricardo Oliveira Santos, L.R.; de Barros, J.L.; Cressoni De Conti, A.; Yamaji, F.B. Thermogravimetric and Ftir Analyzes Of Corn Cob Pyrolysis. Quim. Nova 2019, 42, 566–569. [Google Scholar] [CrossRef]
- Lucarini, M.; Durazzo, A.; Romani, A.; Campo, M.; Lombardi-Boccia, G.; Cecchini, F. Bio-Based Compounds from Grape Seeds: A Biorefinery Approach. Molecules 2018, 23, 1888. [Google Scholar] [CrossRef] [Green Version]
- Hssaini, L.; Razouk, R.; Charafi, J.; Houmanat, K.; Hanine, H. Fig seeds: Combined approach of lipochemical assessment using gas chromatography and FTIR-ATR spectroscopy using chemometrics. Vibrat. Spectrosc. 2021, 114, 103251. [Google Scholar] [CrossRef]
- Smith, B.C. Infrared Spectra Interpretation. A Systematic Approach, 1st ed.; CRC Press LLC: Boca Raton, FL, USA, 1999. [Google Scholar]
- Hishikawa, Y.; Inoue, S.; Magoshi, J.; Kondo, T. Novel tool for characterization of noncrystalline regions in cellulose: A FTIR deuteration monitoring and generalized two-dimensional correlation spectroscopy. Biomacromolecules 2005, 6, 2468–2473. [Google Scholar] [CrossRef]
- Yang, Y.P.; Zhang, Y.; Lang, Y.X.; Yu, M.H. Structural ATR-IR analysis of cellulose fibers prepared from a NaOH complex aqueous solution. IOP Conf. Ser. Mater. Sci. Eng. 2017, 213, 012039. [Google Scholar] [CrossRef] [Green Version]
- Garside, P.; Wyeth, P. Identification of Cellulosic Fibres by FTIR Spectroscopy—Thread and Single Fibre Analysis by Attenuated Total Reflectance. Stud. Conserv. 2003, 48, 269–275. [Google Scholar] [CrossRef] [Green Version]
- Wang, L.P.; Shen, Q.R.; Yu, G.H.; Ran, W.; Xu, Y.C. Fate of biopolymers during rapeseed meal and wheat bran composting as studied by two-dimensional correlation spectroscopy in combination with multiple fluorescence labeling techniques. Biores. Technol. 2012, 105, 88–94. [Google Scholar] [CrossRef] [PubMed]
- Campbell, L.; Rempel, C.B.; Wanasundara, J.P.D. Canola/rapeseed protein: Future opportunities and directions—Workshop proceedings of IRC 2015. Plants 2016, 5, 17. [Google Scholar] [CrossRef]
- Chmielewska, A.; Kozłowska, M.; Rachwał, D.; Wnukowski, P.; Amarowicz, R.; Nebesny, E.; Rosicka-Kaczmarek, J. Canola/rapeseed protein–nutritional value, functionality and food application: A review. Crit. Rev. Food Sci. Nutr. 2020. [Google Scholar] [CrossRef]
- Aider, M.; Barbana, C. Canola proteins: Composition, extraction, functional properties, bioactivity, applications as a food ingredient and allergenicity-A practical and critical review. Trends Food Sci. Technol. 2011, 22, 21–39. [Google Scholar] [CrossRef]
- Yoshie-Stark, Y.; Wada, Y.; Wäsche, A. Chemical composition, functional properties, and bioactivities of rapeseed protein isolates. Food Chem. 2008, 107, 32–39. [Google Scholar] [CrossRef]
- Zhang, S.B.; Wang, Z.; Xu, S.Y. Antioxidant and antithrombotic activities of rapeseed peptides. JAOCS 2008, 85, 521–527. [Google Scholar] [CrossRef]
- Dai, C.; Zhang, W.; He, R.; Xiong, F.; Ma, H. Protein breakdown and release of antioxidant peptides during simulated gastrointestinal digestion and the absorption by everted intestinal sac of rapeseed proteins. LWT 2017, 86, 424–429. [Google Scholar] [CrossRef]
- Wang, Y.; Li, Y.; Ruan, S.; Lu, F.; Tian, W.; Ma, H. Antihypertensive effect of rapeseed peptides and their potential in improving the effectiveness of captopril. J. Sci. Food Agric. 2021, 101, 3049–3055. [Google Scholar] [CrossRef] [PubMed]
- Nevara, G.A.; Muhammad, S.K.S.; Zawawi, N.; Mustapha, N.A.; Karim, R. Dietary Fiber: Fractionation, Characterization and Potential Sources from Defatted Oilseeds. Foods 2021, 10, 754. [Google Scholar] [CrossRef] [PubMed]
- Ancuţa, P.; Sonia, A. Oil press-cakes and meals valorization through circular economy approaches: A review. Appl. Sci. 2020, 10, 7432. [Google Scholar] [CrossRef]
- Ermosh, L.G.; Prisuhina, N.V.; Koch, D.A.; Eremina, E.V. The use of oilseed cake for supplementation of bakery products. IOP Conf. Series Earth Environ. Sci. 2021, 677, 022090. [Google Scholar] [CrossRef]
- McCance & Widdowson’s The Composition of Foods Integrated Dataset (CoFID) 2021 [United Kingdom]. Available online: https://www.gov.uk/government/publications/composition-of-foods-integrated-dataset-cofid (accessed on 2 November 2021).
- Lombardi-Boccia, G.; Schlemmer, U.; Cappelloni, M.; Di Lullo, G. The inhibitory effect of albumin extracts from white beans (Phaseolus vulgaris L.) on in vitro iron and zinc dialysability: Role of phytic acid. Food Chem. 1998, 63, 1–7. [Google Scholar] [CrossRef]
- Vucenik, I. Anticancer properties of inositol hexaphosphate and inositol: An overview. J. Nutrit. Sci. Vitaminol. 2019, 65, S18–S22. [Google Scholar] [CrossRef] [Green Version]
- Feizollahi, E.; Mirmahdi, R.S.; Zoghi, A.; Zijlstra, R.T.; Roopesh, M.S.; Vasanthan, T. Review of the beneficial and anti-nutritional qualities of phytic acid, and procedures for removing it from food products. Food Res. Int. 2021, 143, 110284. [Google Scholar] [CrossRef] [PubMed]
- Yates, K.; Pohl, F.; Busch, M.; Mozer, A.; Watters, L.; Shiryaev, A.; Kong Thoo Lin, P. Determination of sinapine in rapeseed pomace extract: Its antioxidant and acetylcholinesterase inhibition properties. Food Chem. 2019, 276, 768–775. [Google Scholar] [CrossRef]
- Naczk, M.; Amarowicz, R.; Sullivan, A.; Shahidi, F. Current research developments on polyphenolics of rapeseed/canola: A review. Food Chem. 1998, 62, 489–502. [Google Scholar] [CrossRef]
- Thiyam, U.; Kuhlmann, A.; Stöckmann, H.; Schwarz, K. Prospects of rapeseed oil by-products with respect to antioxidative potential. Comp. Rendus Chim. 2004, 7, 611–616. [Google Scholar] [CrossRef]
- Pohl, F.; Goua, M.; Bermano, G.; Russell, W.R.; Scobbie, L.; Maciel, P.; Kong Thoo Lin, P. Revalorisation of rapeseed pomace extracts: An in vitro study into its anti-oxidant and DNA protective properties. Food Chem. 2018, 239, 323–332. [Google Scholar] [CrossRef] [PubMed] [Green Version]
- Pohl, F.; Teixeira-Castro, A.; Costa, M.D.; Lindsay, V.; Fiúza-Fernandes, J.; Goua, M.; Bermano, G.; Russell, W.; Maciel, P.; Lin, P.K.T. Gst-4-dependent suppression of neurodegeneration in c. Elegans models of parkinson’s and machado-joseph disease by rapeseed pomace extract supplementation. Front. Neurosci. 2019, 13, 1091. [Google Scholar] [CrossRef]
- Ng, H.E.; Raj, S.S.A.; Wong, S.H.; Tey, D.; Tan, H.M. Estimation of fungal growth using the ergosterol assay: A rapid tool in assessing the microbiological status of grains and feeds. Lett. Appl. Microbiol. 2008, 46, 113–118. [Google Scholar] [CrossRef]
- Witaszak, N.; Stępień, Ł.; Bocianowski, J.; Waśkiewicz, A. Fusarium species and mycotoxins contaminating veterinary diets for dogs and cats. Microorganisms 2019, 7, 26. [Google Scholar] [CrossRef] [Green Version]
- Schwartz, H.; Ollilainen, V.; Piironen, V.; Lampi, A.-M. Tocopherol, tocotrienol and plant sterol contents of vegetable oils and industrial fats. J. Food Comp. Anal. 2008, 21, 152–161. [Google Scholar] [CrossRef]
- Riaz, A.; Aadil, R.M.; Amoussa, A.M.O.; Bashari, M.; Abid, M.; Hashim, M.M. Application of chitosan-based apple peel polyphenols edible coating on the preservation of strawberry (Fragaria ananassa cv Hongyan) fruit. J. Food Proc. Pres. 2021, 45, e15018. [Google Scholar] [CrossRef]
- Taofiq, O.; González-Paramás, A.M.; Barreiro, M.F.; Ferreira, I.C.F.R. Hydroxycinnamic Acids and Their Derivatives: Cosmeceutical Significance, Challenges and Future Perspectives, a Review. Molecules 2017, 22, 281. [Google Scholar] [CrossRef]
- Silva, E.D.; Batista, R. Ferulic Acid and Naturally Occurring Compounds Bearing a Feruloyl Moiety: A Review on Their Structures, Occurrence, and Potential Health Benefits. Compr. Rev. Food Sci. Food Saf. 2017, 16, 580–616. [Google Scholar] [CrossRef] [PubMed] [Green Version]
- Neelam; Khatkar, A.; Sharma, K.K. Phenylpropanoids and its derivatives: Biological activities and its role in food, pharmaceutical and cosmetic industries. CRC Cr. Rev. Food Sci. 2020, 60, 2655–2675. [Google Scholar] [CrossRef] [PubMed]
- Peyrot, C.; Mention, M.M.; Brunissen, F.; Allais, F. Sinapic acid esters: Octinoxate substitutes combining suitable uv protection and antioxidant activity. Antioxidants 2020, 9, 782. [Google Scholar] [CrossRef]
- Ghosh, S.; Basak, P.; Dutta, S.; Chowdhury, S.; Sil, P.C. New insights into the ameliorative effects of ferulic acid in pathophysiological conditions. Food Chem. Toxicol. 2017, 103, 41–55. [Google Scholar] [CrossRef] [PubMed]
- Vinayagam, R.; Jayachandran, M.; Xu, B. Anti-diabetic effects of simple phenolic acids: A comprehensive review. Phytotherapy Res. 2016, 30, 184–199. [Google Scholar] [CrossRef]
- Alam, M.A. Anti-hypertensive Effect of Cereal Antioxidant Ferulic Acid and Its Mechanism of Action. Front. Nutr. 2019, 6, 121. [Google Scholar] [CrossRef]
- Szwajgier, D.; Borowiec, K.; Pustelniak, K. The neuroprotective effects of phenolic acids: Molecular mechanism of action. Nutrients 2017, 9, 477. [Google Scholar] [CrossRef] [PubMed] [Green Version]
- Coman, V.; Vodnar, D.C. Hydroxycinnamic acids and human health: Recent advances. J. Sci. Food Agric. 2020, 100, 483–499. [Google Scholar] [CrossRef]
- Chaudhary, A.; Jaswal, V.S.; Choudhary, S.; Sonika, S.A.; Beniwal, V.; Tuli, H.S.; Sharma, S. Ferulic Acid: A Promising Therapeutic Phytochemical and Recent Patents Advances. Recent Pat. Inflamm. Allerg. Drug Discov. 2019, 13, 115–123. [Google Scholar] [CrossRef]
- Cunha, F.V.M.; Coelho, A.G.; Azevedo, P.S.d.S.; da Silva, A.A.; Oliveira, F.d.A.; Nunes, L.C.C. Systematic review and technological prospection: Ethyl ferulate, a phenylpropanoid with antioxidant and neuroprotective actions. Expert Opin. Ther. Pat. 2019, 29, 73–83. [Google Scholar] [CrossRef]
- Government Decree of Slovak Republic Regulation 438/2006—Government Ordinance on undesired Substances in Animal Feed and on Other Indicators of Safety and Usefulness of Animal Feed. Available online: https://www.slov-lex.sk/static/pdf/2006/2006c161.pdf (accessed on 5 November 2021).
- European Commission. Regulation (EC) No 396/2005 of the European Parliament and of the Council of 23 February 2005 on Maximum Residue Levels of Pesticides in or on Food and Feed of Plant and Animal Origin and Amending Council Directive 91/414/EEC. Off. J. Eur. Union 2005, L70/1. Available online: https://eur-lex.europa.eu/legal-content/EN/TXT/?uri=celex%3A32005R0396 (accessed on 5 November 2021).
- ISO 21528-2:2004 Microbiology of Food and Animal Feeding Stuffs—Horizontal Methods for the Detection and Enumeration of Enterobacteriaceae—Part 2: Colony-Count Method. Available online: https://www.iso.org/standard/34566.html (accessed on 5 November 2021).
- ISO 6579-1:2017 Microbiology of the Food Chain—Horizontal Method for the Detection, Enumeration and Serotyping of Salmonella—Part 1: Detection of Salmonella spp. Available online: https://www.iso.org/standard/76671.html (accessed on 5 November 2021).
- ISO 21527-2: 2008 Microbiology of Food and Animal Feeding Stuffs—Horizontal Method for the Enumeration of Yeasts and Moulds—Part 2: Colony Count Technique in Products with Water Activity Less Than or Equal to 0.95. Available online: https://www.iso.org/standard/38276.html (accessed on 5 November 2021).
- Association of Official Analytical Chemists. Official Methods of Analysis, 19th ed.; Association of Official Analytical Chemists: Arlington, VA, USA, 2012. [Google Scholar]
- Prosky, L.; Asp, N.G.; Schweizer, T.F.; DeVries, J.W.; Furda, I. Determination of insoluble, soluble, and total dietary fiber in foods and food products: Interlaboratory study. J. AOAC 1988, 71, 1017–1023. [Google Scholar] [CrossRef]
- Pacifico, D.; Musmesci, S.; Sanchez del Pulgar, J.; Onofri, C.; Parisi, B.; Sasso, R.; Mandolino, G.; Lombardi-Boccia, G. Caffeic Acid and α-Chaconine Influence the Resistance of Potato Tuber to Phthorimaea operculella (Lepidoptera: Gelechiidae). Amer. J. Potato Res. 2019, 4, 403–4013. [Google Scholar] [CrossRef]
- Bligh, E.G.; Dyer, W.J. A rapid method of total lipid extraction and purification. Canad. J. Biochem. Physiol. 1959, 37, 911–917. [Google Scholar] [CrossRef]
- Metcalfe, L.D.; Schmitz, A.A. The rapid preparation of fatty acid esters for gas chromatographic analysis. Analytical Chem. 1961, 33, 363–364. [Google Scholar] [CrossRef]
- Singleton, V.L.; Orthofer, R.; Lamuela-Raventós, R.M. Analysis of total phenols and other oxidation substrates and antioxidants by means of Folin-Ciocalteu reagent. In Methods in Enzymology; Academic Press: London, UK, 1999; Volume 299, pp. 152–178. [Google Scholar]
- Benzie, I.F.F.; Strain, J.J. [2] Ferric reducing/antioxidant power assay: Direct measure of total antioxidant activity of biological fluids and modified version for simultaneous measurement of total antioxidant power and ascorbic acid concentration. Methods Enzymol. 1999, 299, 15–27. [Google Scholar]
- Meng, J.; Fang, Y.; Zhang, A.; Chen, S.; Xu, T.; Ren, Z.; Han, G.; Liu, J.; Li, H.; Zhang, Z. Phenolic content and antioxidant capacity of Chinese raisins produced in Xinjiang Province. Food Res. Int. 2011, 44, 2830–2836. [Google Scholar] [CrossRef]
- Proestos, C.; Lytoudi, K.; Mavromelanidou, O.K.; Zoumpoulakis, P.; Sinanoglou, V.J. Antioxidant capacity of selected plant extracts and their essential oils. Antioxidants 2013, 2, 11–22. [Google Scholar] [CrossRef]
- Dudonné, S.; Vitrac, X.; Coutière, P.; Woillez, M.; Mérillon, J.-M. Comparative Study of Antioxidant Properties and Total Phenolic Content of 30 Plant Extracts of Industrial Interest Using DPPH, ABTS, FRAP, SOD, and ORAC Assays. J. Agr. Food Chem. 2009, 57, 1768–1774. [Google Scholar] [CrossRef] [PubMed]
- Lan, W.; Zhang, R.; Ahmed, S.; Qin, W.; Liu, Y. Effects of various antimicrobial polyvinyl alcohol/tea polyphenol composite films on the shelf life of packaged strawberries. LWT Food Sci. Technol. 2019, 113, 108297. [Google Scholar] [CrossRef]
- Savin, S.; Craciunescu, O.; Oancea, A.; Ilie, D.; Ciucan, T.; Antohi, L.S.; Toma, A.; Nicolescu, A.; Deleanu, C.; Oancea, F. Antioxidant, Cytotoxic and Antimicrobial Activity of Chitosan Preparations Extracted from Ganoderma Lucidum Mushroom. Chem. Biod. 2020, 17, e2000175. [Google Scholar] [CrossRef]

| Lot 1 | Lot 2 | Lot 3 | Lot 4 | Lot 5 | Lot 6 | Lot 7 | Lot 8 | Lot 9 | Lot 10 | Mean | sd | Min | Max | |
|---|---|---|---|---|---|---|---|---|---|---|---|---|---|---|
| pH | - | 6.17 | 5.84 | 6.16 | 6.39 | 6.07 | 6.24 | 6.10 | 6.02 | 6.06 | 6.12 | 0.15 | 5.84 | 6.39 |
| g kg−1 | ||||||||||||||
| Dry matter | 871.60 | 874.47 | 876.97 | 893.50 | 866.53 | 880.23 | 873.43 | 866.87 | 874.50 | 872.90 | 875.10 | 7.68 | 866.53 | 893.50 |
| Water content | 128.40 | 125.53 | 123.03 | 106.50 | 133.47 | 119.77 | 126.57 | 133.13 | 125.50 | 127.10 | 124.90 | 7.68 | 106.50 | 133.47 |
| Total N | 50.93 | 52.57 | 54.27 | 54.07 | 51.27 | 51.83 | 53.77 | 48.90 | 48.50 | 49.88 | 51.60 | 2.09 | 48.50 | 54.27 |
| Crude protein | 318.40 | 328.55 | 339.13 | 337.95 | 320.27 | 324.09 | 336.02 | 305.43 | 302.98 | 311.76 | 322.46 | 13.11 | 302.98 | 339.13 |
| Nonprotein N | 3.18 | 3.77 | 5.54 | 5.54 | 3.68 | 4.94 | 4.18 | 3.83 | 5.01 | 4.21 | 4.39 | 0.82 | 3.18 | 5.54 |
| Ash | 68.00 | 56.83 | 54.83 | 58.07 | 58.33 | 57.60 | 55.00 | 56.43 | 62.63 | 64.30 | 59.20 | 4.34 | 54.83 | 68.00 |
| Crude Fat | 31.90 | 25.27 | 14.23 | 17.33 | 33.33 | 18.36 | 14.13 | 17.17 | 19.73 | 21.97 | 21.34 | 6.82 | 14.13 | 33.33 |
| Total dietary fiber | 371.93 | 400.77 | 368.30 | 368.50 | 337.30 | 340.00 | 334.90 | 362.35 | 342.50 a | 315.00 b | 354.16 | 24.69 | 315.00 | 400.77 |
| Carbohydrates | 81.37 | 62.64 | 97.53 | 111.01 | 118.22 | 139.42 | 133.64 | 122.84 | 145.25 | 158.52 | 117.04 | 29.77 | 62.64 | 158.52 |
| Lot 1 | Lot 2 | Lot 3 | Lot 4 | Lot 5 | Lot 6 | Lot 7 | Lot 8 | Lot 9 | Lot 10 | Mean | sd | Min | Max | |
|---|---|---|---|---|---|---|---|---|---|---|---|---|---|---|
| g kg−1 | ||||||||||||||
| K | 10.57 | 10.44 | 11.12 | 10.87 | 10.14 | 11.45 | 9.84 | 10.01 | 11.45 | 13.28 | 10.92 | 1.01 | 9.84 | 13.28 |
| P | 8.98 | 9.05 | 8.29 | 8.82 | 8.89 | 8.36 | 8.22 | 8.19 | 8.68 | 9.43 | 8.69 | 0.42 | 8.19 | 9.43 |
| Ca | 6.08 | 6.24 | 5.75 | 6.80 | 6.51 | 6.62 | 6.24 | 6.74 | 7.33 | 6.82 | 6.51 | 0.45 | 5.75 | 7.33 |
| Mg | 3.64 | 4.12 | 4.03 | 4.69 | 4.38 | 4.49 | 4.28 | 4.17 | 3.50 | 3.86 | 4.11 | 0.37 | 3.50 | 4.69 |
| Na | 1.15 | 1.15 | 0.15 | 0.03 | 1.03 | 0.14 | 0.05 | 0.04 | 0.09 | 0.06 | 0.39 | 0.50 | 0.03 | 1.15 |
| mg kg−1 | ||||||||||||||
| Fe | 88.40 | 101.35 | 78.10 | 106.61 | 89.14 | 86.59 | 95.35 | 78.19 | 69.23 | 72.91 | 86.59 | 12.19 | 69.23 | 106.61 |
| Zn | 52.76 | 52.71 | 55.48 | 53.68 | 49.40 | 49.20 | 55.57 | 49.85 | 49.36 | 57.13 | 52.52 | 2.95 | 49.20 | 57.13 |
| Mn | 52.69 | 62.26 | 52.99 | 60.99 | 56.96 | 56.93 | 54.70 | 54.68 | 37.77 | 45.68 | 53.56 | 7.22 | 37.77 | 62.26 |
| Cu | 3.77 | 5.33 | 4.31 | 3.25 | 3.62 | 3.42 | 4.00 | 3.89 | 3.26 | 4.83 | 3.97 | 0.68 | 3.25 | 5.33 |
| Lot 1 | Lot 2 | Lot 3 | Lot 5 | Lot 6 | Lot 7 | Lot 8 | Lot 9 | Mean | sd | Min | Max | |
|---|---|---|---|---|---|---|---|---|---|---|---|---|
| mg kg−1 | ||||||||||||
| Gallic acid | 1.41 | 1.44 | 1.60 | 1.43 | 1.62 | 1.59 | 1.78 | 1.63 | 1.56 | 0.13 | 1.41 | 1.78 |
| Protocatechuic acid | 13.25 | 15.10 | 14.66 | 14.12 | 16.02 | 13.42 | 15.23 | 15.14 | 14.62 | 0.96 | 13.25 | 16.02 |
| 4-Hydroxybenzoic acid | 13.59 | 12.77 | 14.62 | 14.60 | 13.99 | 13.56 | 14.19 | 12.83 | 13.77 | 0.72 | 12.77 | 14.62 |
| Vanillic acid | 3.44 | 2.79 | 3.97 | 3.31 | 3.30 | 3.28 | 3.69 | 3.16 | 3.37 | 0.35 | 2.79 | 3.97 |
| Chlorogenic acid | 1.96 | 2.17 | 2.08 | 1.90 | 2.07 | 2.08 | 1.98 | 2.02 | 2.03 | 0.09 | 1.90 | 2.17 |
| Neochlorogenic acid | 3.03 | 3.08 | 2.98 | 3.02 | 3.00 | 2.99 | 2.83 | 2.90 | 2.98 | 0.08 | 2.83 | 3.08 |
| Caffeic acid | 2.55 | 2.66 | 2.69 | 2.40 | 3.00 | 2.68 | 2.57 | 2.89 | 2.68 | 0.19 | 2.40 | 3.00 |
| Syringic acid | 2.31 | 1.64 | 2.76 | 2.41 | 2.68 | 2.37 | 3.12 | 2.41 | 2.46 | 0.43 | 1.64 | 3.12 |
| Cryptochlorogenic acid | 2.08 | 2.21 | 2.32 | 2.12 | 0.79 | 0.69 | 0.57 | 0.67 | 1.43 | 0.81 | 0.57 | 2.32 |
| p-Coumaric acid | 2.44 | 2.27 | 2.51 | 2.07 | 2.46 | 2.18 | 1.57 | 1.75 | 2.16 | 0.34 | 1.57 | 2.51 |
| Ferulic acid | 10.82 | 10.36 | 11.36 | 10.72 | 11.43 | 10.34 | 10.03 | 11.27 | 10.79 | 0.53 | 10.03 | 11.43 |
| Sinapic acid | 378.68 | 348.03 | 348.89 | 356.81 | 348.68 | 339.20 | 366.73 | 370.11 | 357.14 | 13.46 | 339.20 | 378.68 |
| Cinnamic acid | 0.95 | 1.09 | 0.94 | 1.2 | 1.08 | 1.01 | 0.83 | 1.03 | 1.02 | 0.11 | 0.83 | 1.20 |
| Σ phenolic acids | 436.51 | 405.62 | 411.38 | 416.12 | 410.11 | 395.38 | 425.11 | 427.81 | 416.01 | 13.27 | 395.38 | 436.51 |
| Lot 1 | Lot 2 | Lot 3 | Lot 5 | Lot 6 | Lot 7 | Lot 8 | Lot 9 | Mean | sd | Min | Max | |
|---|---|---|---|---|---|---|---|---|---|---|---|---|
| % of total fatty acids | ||||||||||||
| Lauric acid (C12:0) | 0.00 | 0.02 | 0.01 | 0.06 | 0.06 | 0.05 | 0.00 | 0.00 | 0.03 | 0.03 | 0.00 | 0.06 |
| Myristic acid (C14:0) | 0.15 | 0.16 | 0.12 | 0.17 | 0.17 | 0.18 | 0.24 | 0.24 | 0.18 | 0.04 | 0.12 | 0.24 |
| Pentadecylic acid (C15:0) | 0.00 | 0.07 | 0.12 | 0.00 | 0.00 | 0.00 | 0.00 | 0.00 | 0.02 | 0.04 | 0.00 | 0.12 |
| Palmitic acid (C16:0) | 11.10 | 11.18 | 9.15 | 8.94 | 10.73 | 8.74 | 8.81 | 8.60 | 9.66 | 1.13 | 8.60 | 11.18 |
| Palmitoleic acid (C16:1 n-7) | 0.47 | 0.75 | 0.63 | 0.99 | 0.87 | 0.80 | 0.88 | 1.12 | 0.81 | 0.20 | 0.47 | 1.12 |
| Hexadecadienoic acid (C16:2, n-4) | 0.00 | 0.20 | 0.23 | 0.19 | 0.18 | 0.23 | 0.00 | 0.17 | 0.17 | 0.08 | 0.00 | 0.23 |
| Margaric acid (C17:0) | 0.09 | 0.07 | 0.08 | 0.07 | 0.05 | 0.05 | 0.09 | 0.00 | 0.06 | 0.03 | 0.00 | 0.09 |
| Stearic acid (C18:0) | 1.92 | 1.96 | 1.30 | 0.82 | 0.84 | 0.67 | 0.76 | 0.63 | 1.11 | 0.55 | 0.63 | 1.96 |
| Oleic acid (C18:1n-9) | 51.79 | 50.81 | 54.64 | 54.22 | 52.96 | 55.16 | 54.35 | 56.99 | 53.86 | 1.96 | 50.81 | 56.99 |
| Linoleic acid (C18:2 n-6) | 29.75 | 29.90 | 29.25 | 29.54 | 28.57 | 29.32 | 29.70 | 27.30 | 29.17 | 0.86 | 27.30 | 29.90 |
| α-Linolenic acid (C18:3 n-3) | 4.20 | 4.32 | 4.16 | 4.48 | 4.54 | 4.56 | 4.93 | 5.04 | 4.53 | 0.32 | 4.16 | 5.04 |
| Arachidic acid (C20:0) | 0.21 | 0.26 | 0.14 | 0.21 | 0.41 | 0.24 | 0.25 | 0.00 | 0.25 | 0.08 | 0.14 | 0.41 |
| Gondoic acid (C20:1 n-9) | 0.20 | 0.20 | 0.08 | 0.23 | 0.62 | 0.00 | 0.00 | 0.00 | 0.27 | 0.21 | 0.08 | 0.62 |
| Eicosadienoic acid (C20:2 n-6) | 0.00 | 0.04 | 0.01 | 0.01 | 0.00 | 0.00 | 0.00 | 0.00 | 0.01 | 0.02 | 0.00 | 0.04 |
| Behenic acid (C22:0) | 0.12 | 0.10 | 0.08 | 0.06 | 0.00 | 0.00 | 0.00 | 0.00 | 0.09 | 0.03 | 0.06 | 0.12 |
| Erucic acid (C22:1 n-9) | - | - | - | - | - | - | - | - | - | - | - | - |
| Total SFA | 13.59 | 13.82 | 11.00 | 10.33 | 12.27 | 9.94 | 10.15 | 9.48 | 11.32 | 1.69 | 9.48 | 13.82 |
| Total MUFA | 52.46 | 51.76 | 55.36 | 55.44 | 54.44 | 55.96 | 55.22 | 58.10 | 54.84 | 2.00 | 51.76 | 58.10 |
| Total PUFA | 33.95 | 34.39 | 33.65 | 34.23 | 33.29 | 34.11 | 34.63 | 32.42 | 33.84 | 0.71 | 32.42 | 34.63 |
| Total n-3 PUFA | 4.20 | 4.32 | 4.16 | 4.48 | 4.54 | 4.56 | 4.93 | 5.04 | 4.53 | 0.32 | 4.16 | 5.04 |
| Total n-6 PUFA | 29.75 | 29.94 | 29.26 | 29.56 | 28.57 | 29.32 | 29.70 | 27.30 | 29.17 | 0.87 | 27.30 | 29.94 |
| n-6/n-3 PUFA ratio | 7.08 | 6.94 | 7.04 | 6.60 | 6.32 | 6.43 | 6.05 | 5.46 | 6.49 | 0.55 | 5.46 | 7.08 |
| PUFA/SFA ratio | 2.50 | 2.49 | 3.15 | 3.32 | 2.72 | 3.43 | 3.42 | 3.43 | 3.06 | 0.42 | 2.49 | 3.43 |
| Lot 1 | Lot 2 | Lot 3 | Lot 4 | Lot 6 | Lot 7 | Mean | sd | Min | Max | |
|---|---|---|---|---|---|---|---|---|---|---|
| mg kg−1 | ||||||||||
| α-tocopherol a | 18.44 | 8.65 | 7.33 | 3.66 | 6.47 | 7.38 | 8.65 | 5.08 | 3.66 | 18.44 |
| γ-tocopherol a | 10.40 | 6.61 | 6.50 | 2.96 | 5.73 | 4.65 | 6.14 | 2.49 | 2.96 | 10.40 |
| δ-tocopherol | 3.10 | 0.00 | 0.00 | 0.00 | 0.00 | 2.06 | 0.86 | 1.37 | 0.00 | 3.10 |
| α-tocotrienol | 1.12 | 0.00 | 0.52 | 0.00 | 0.00 | 0.00 | 0.27 | 0.47 | 0.00 | 1.12 |
| γ-tocotrienol | 0.30 | 0.00 | 0.00 | 0.00 | 0.00 | 0.00 | 0.05 | 0.12 | 0.00 | 0.30 |
| δ-tocotrienol | 0.00 | 0.00 | 0.00 | 0.00 | 0.00 | 0.00 | 0.00 | 0.00 | 0.00 | 0.00 |
| Ergosterol | 1.01 | 1.04 | 0.70 | 0.47 | 0.53 | 0.47 | 0.71 | 0.26 | 0.47 | 1.04 |
| Brassicasterol a | 8.14 | 37.16 | 35.06 | 16.98 | 31.75 | 34.19 | 27.21 | 11.82 | 8.14 | 37.16 |
| Stigma + campesterol | 74.26 | 35.68 | 30.80 | 14.64 | 32.01 | 33.09 | 36.75 | 19.84 | 14.64 | 74.26 |
| β-sitosterol | 172.71 | 92.76 | 91.23 | 39.55 | 83.64 | 102.24 | 97.02 | 43.11 | 39.55 | 172.71 |
| Sitostanol | - | 4.37 | - | 3.72 | 4.96 | - | 4.35 | 0.62 | 3.72 | 4.96 |
| Squalene | 0.51 | 0.47 | 1.84 | 0.45 | 1.19 | 1.53 | 1.17 | 0.56 | 0.47 | 1.84 |
| Sum of sterols | --- | 171.00 | --- | 75.36 | 152.90 | --- | 133.09 | 50.81 | 75.36 | 171.00 |
| Sum of tocopherols | 31.95 | 15.26 | 13.83 | 6.62 | 12.20 | 14.08 | 15.66 | 8.54 | 6.62 | 31.95 |
| Sum of tocotrienol | 1.42 | 0.00 | 0.52 | 0.00 | 0.00 | 0.00 | 0.32 | 0.58 | 0.00 | 1.42 |
| Sum of tocols | 33.37 | 15.26 | 14.35 | 6.62 | 12.20 | 14.08 | 15.98 | 9.07 | 6.62 | 33.37 |
Publisher’s Note: MDPI stays neutral with regard to jurisdictional claims in published maps and institutional affiliations. |
© 2021 by the authors. Licensee MDPI, Basel, Switzerland. This article is an open access article distributed under the terms and conditions of the Creative Commons Attribution (CC BY) license (https://creativecommons.org/licenses/by/4.0/).
Share and Cite
Di Lena, G.; Sanchez del Pulgar, J.; Lucarini, M.; Durazzo, A.; Ondrejíčková, P.; Oancea, F.; Frincu, R.-M.; Aguzzi, A.; Ferrari Nicoli, S.; Casini, I.; et al. Valorization Potentials of Rapeseed Meal in a Biorefinery Perspective: Focus on Nutritional and Bioactive Components. Molecules 2021, 26, 6787. https://doi.org/10.3390/molecules26226787
Di Lena G, Sanchez del Pulgar J, Lucarini M, Durazzo A, Ondrejíčková P, Oancea F, Frincu R-M, Aguzzi A, Ferrari Nicoli S, Casini I, et al. Valorization Potentials of Rapeseed Meal in a Biorefinery Perspective: Focus on Nutritional and Bioactive Components. Molecules. 2021; 26(22):6787. https://doi.org/10.3390/molecules26226787
Chicago/Turabian StyleDi Lena, Gabriella, Jose Sanchez del Pulgar, Massimo Lucarini, Alessandra Durazzo, Petra Ondrejíčková, Florin Oancea, Rodica-Mihaela Frincu, Altero Aguzzi, Stefano Ferrari Nicoli, Irene Casini, and et al. 2021. "Valorization Potentials of Rapeseed Meal in a Biorefinery Perspective: Focus on Nutritional and Bioactive Components" Molecules 26, no. 22: 6787. https://doi.org/10.3390/molecules26226787
APA StyleDi Lena, G., Sanchez del Pulgar, J., Lucarini, M., Durazzo, A., Ondrejíčková, P., Oancea, F., Frincu, R.-M., Aguzzi, A., Ferrari Nicoli, S., Casini, I., Gabrielli, P., Caproni, R., Červeň, I., & Lombardi-Boccia, G. (2021). Valorization Potentials of Rapeseed Meal in a Biorefinery Perspective: Focus on Nutritional and Bioactive Components. Molecules, 26(22), 6787. https://doi.org/10.3390/molecules26226787