
Does the Temperature of the prise de mousse Affect the Effervescence and the Foam of Sparkling Wines?

 ,
,
Abstract
:1. Introduction
2. Results
2.1. Initial Concentrations of Dissolved CO2
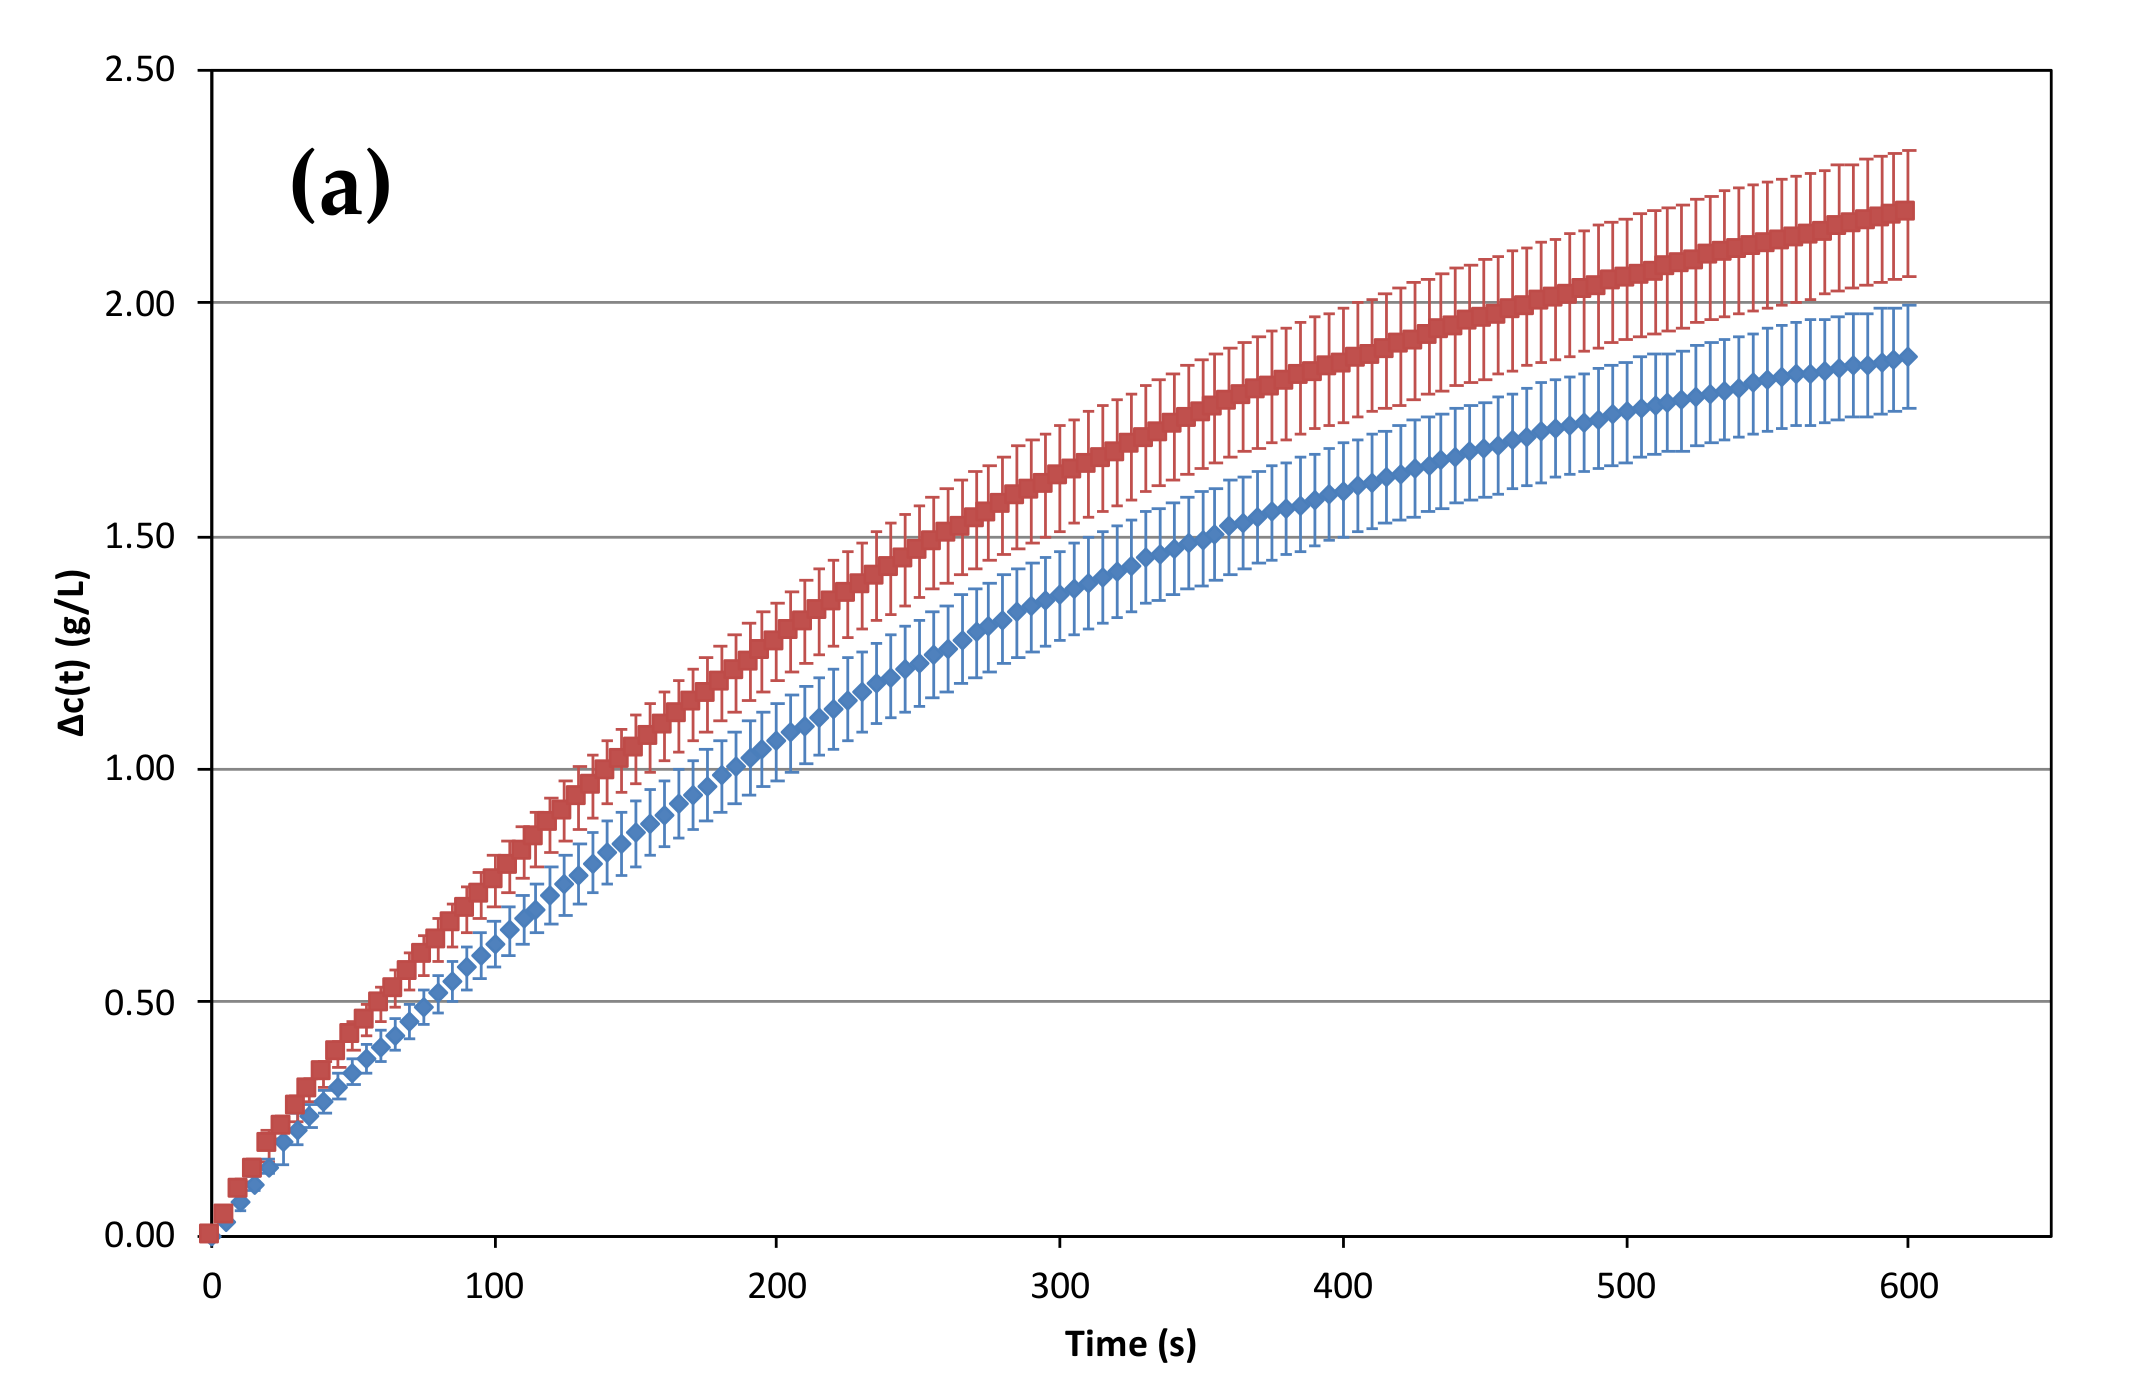
2.2. Influence of the Temperature of the prise de mousse on the Losses of Dissolved CO2 versus Time
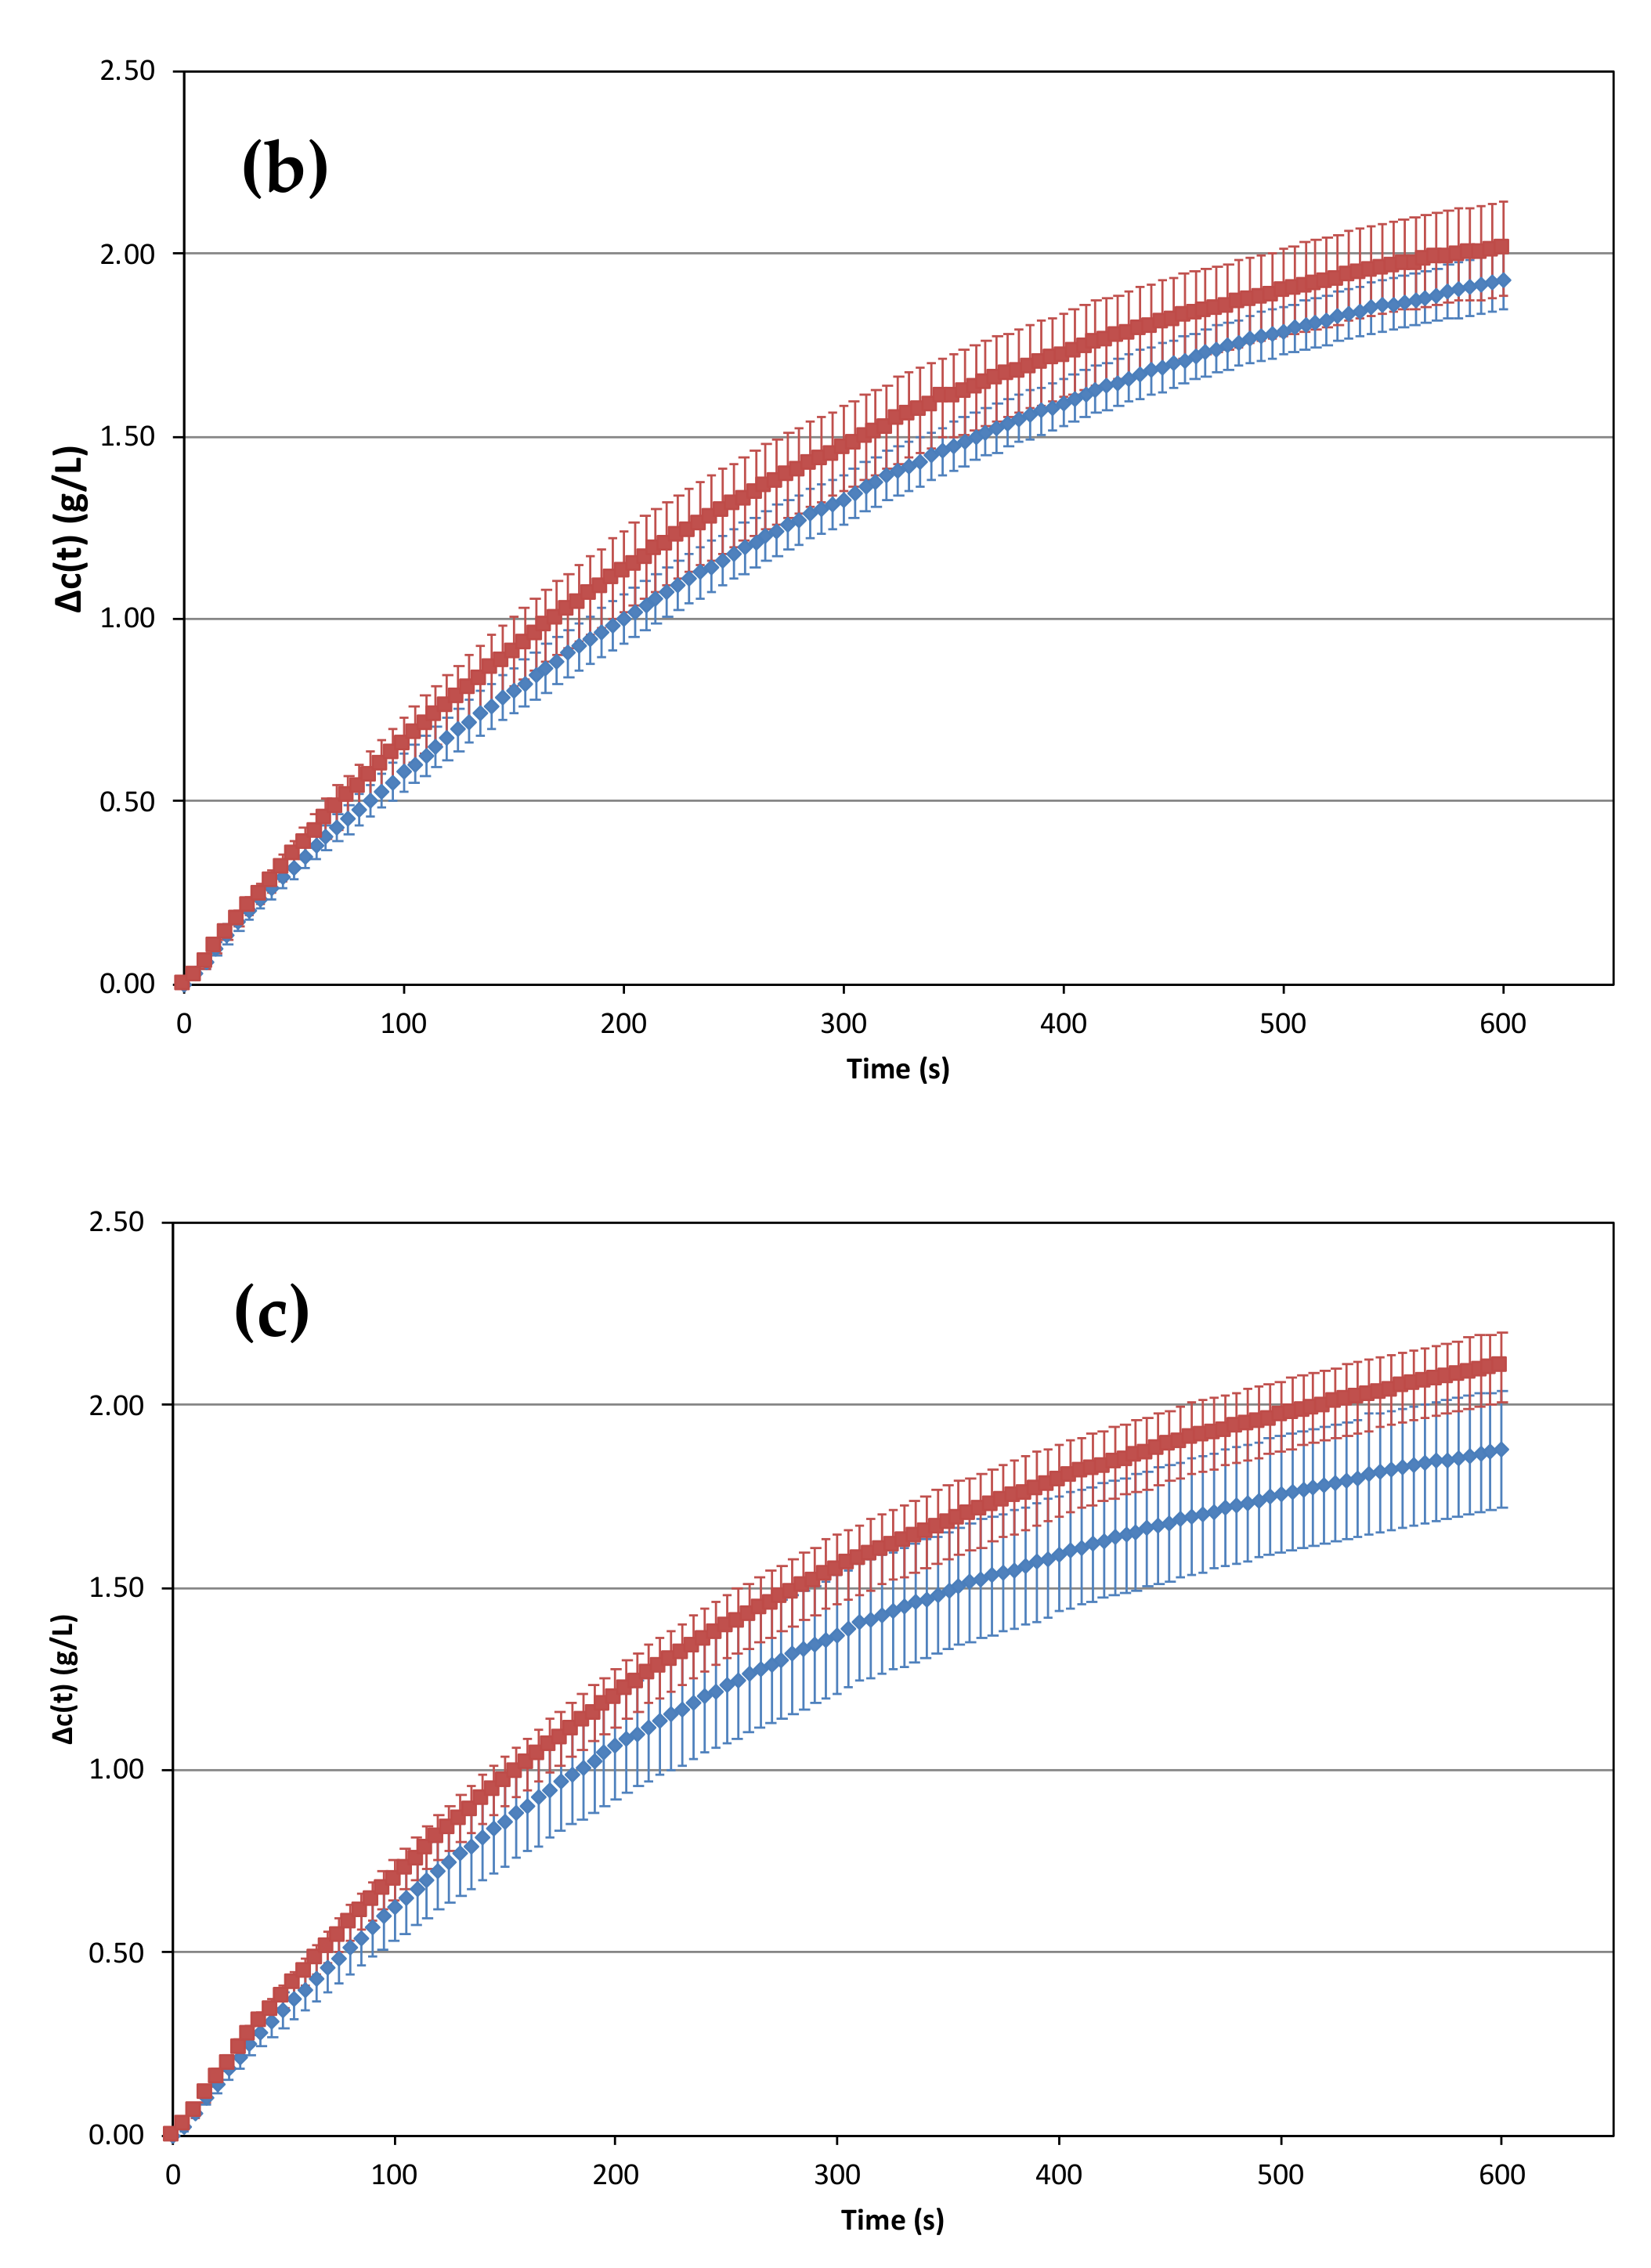
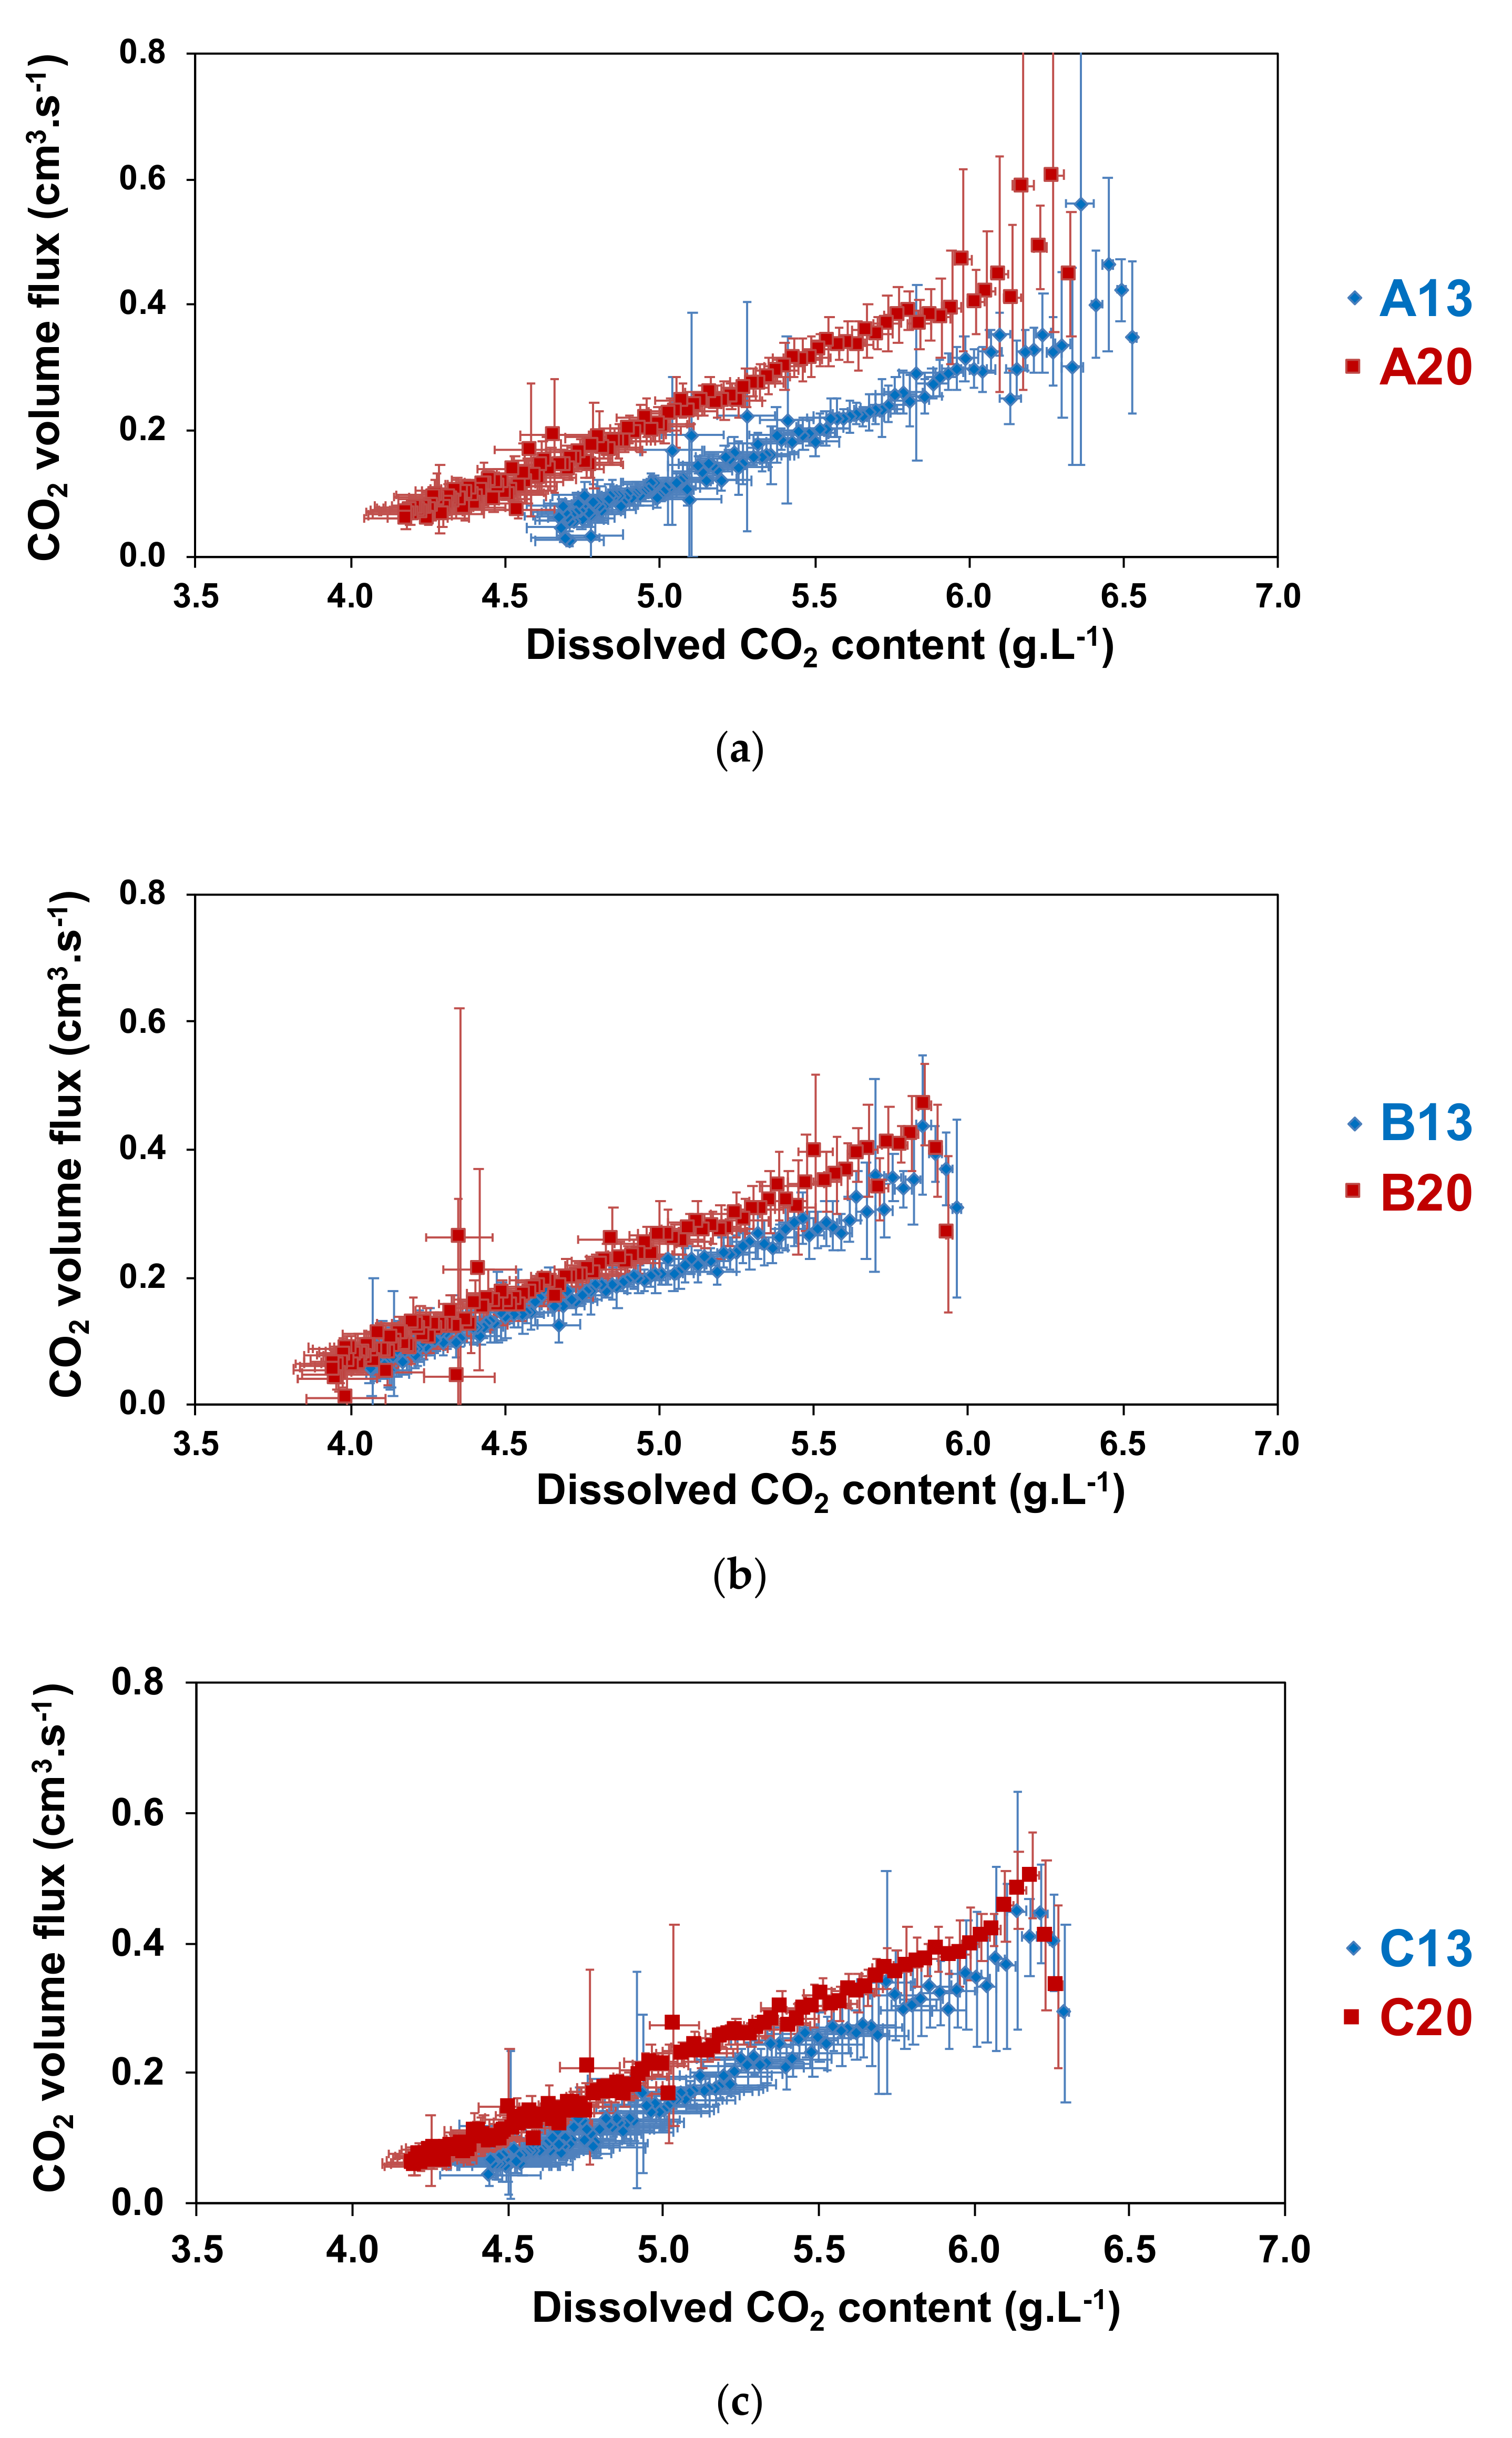
2.3. Influence of the Temperature of the prise de mousse on CO2 Volume Fluxes
2.4. Foaming Properties in Real Tasting Conditions
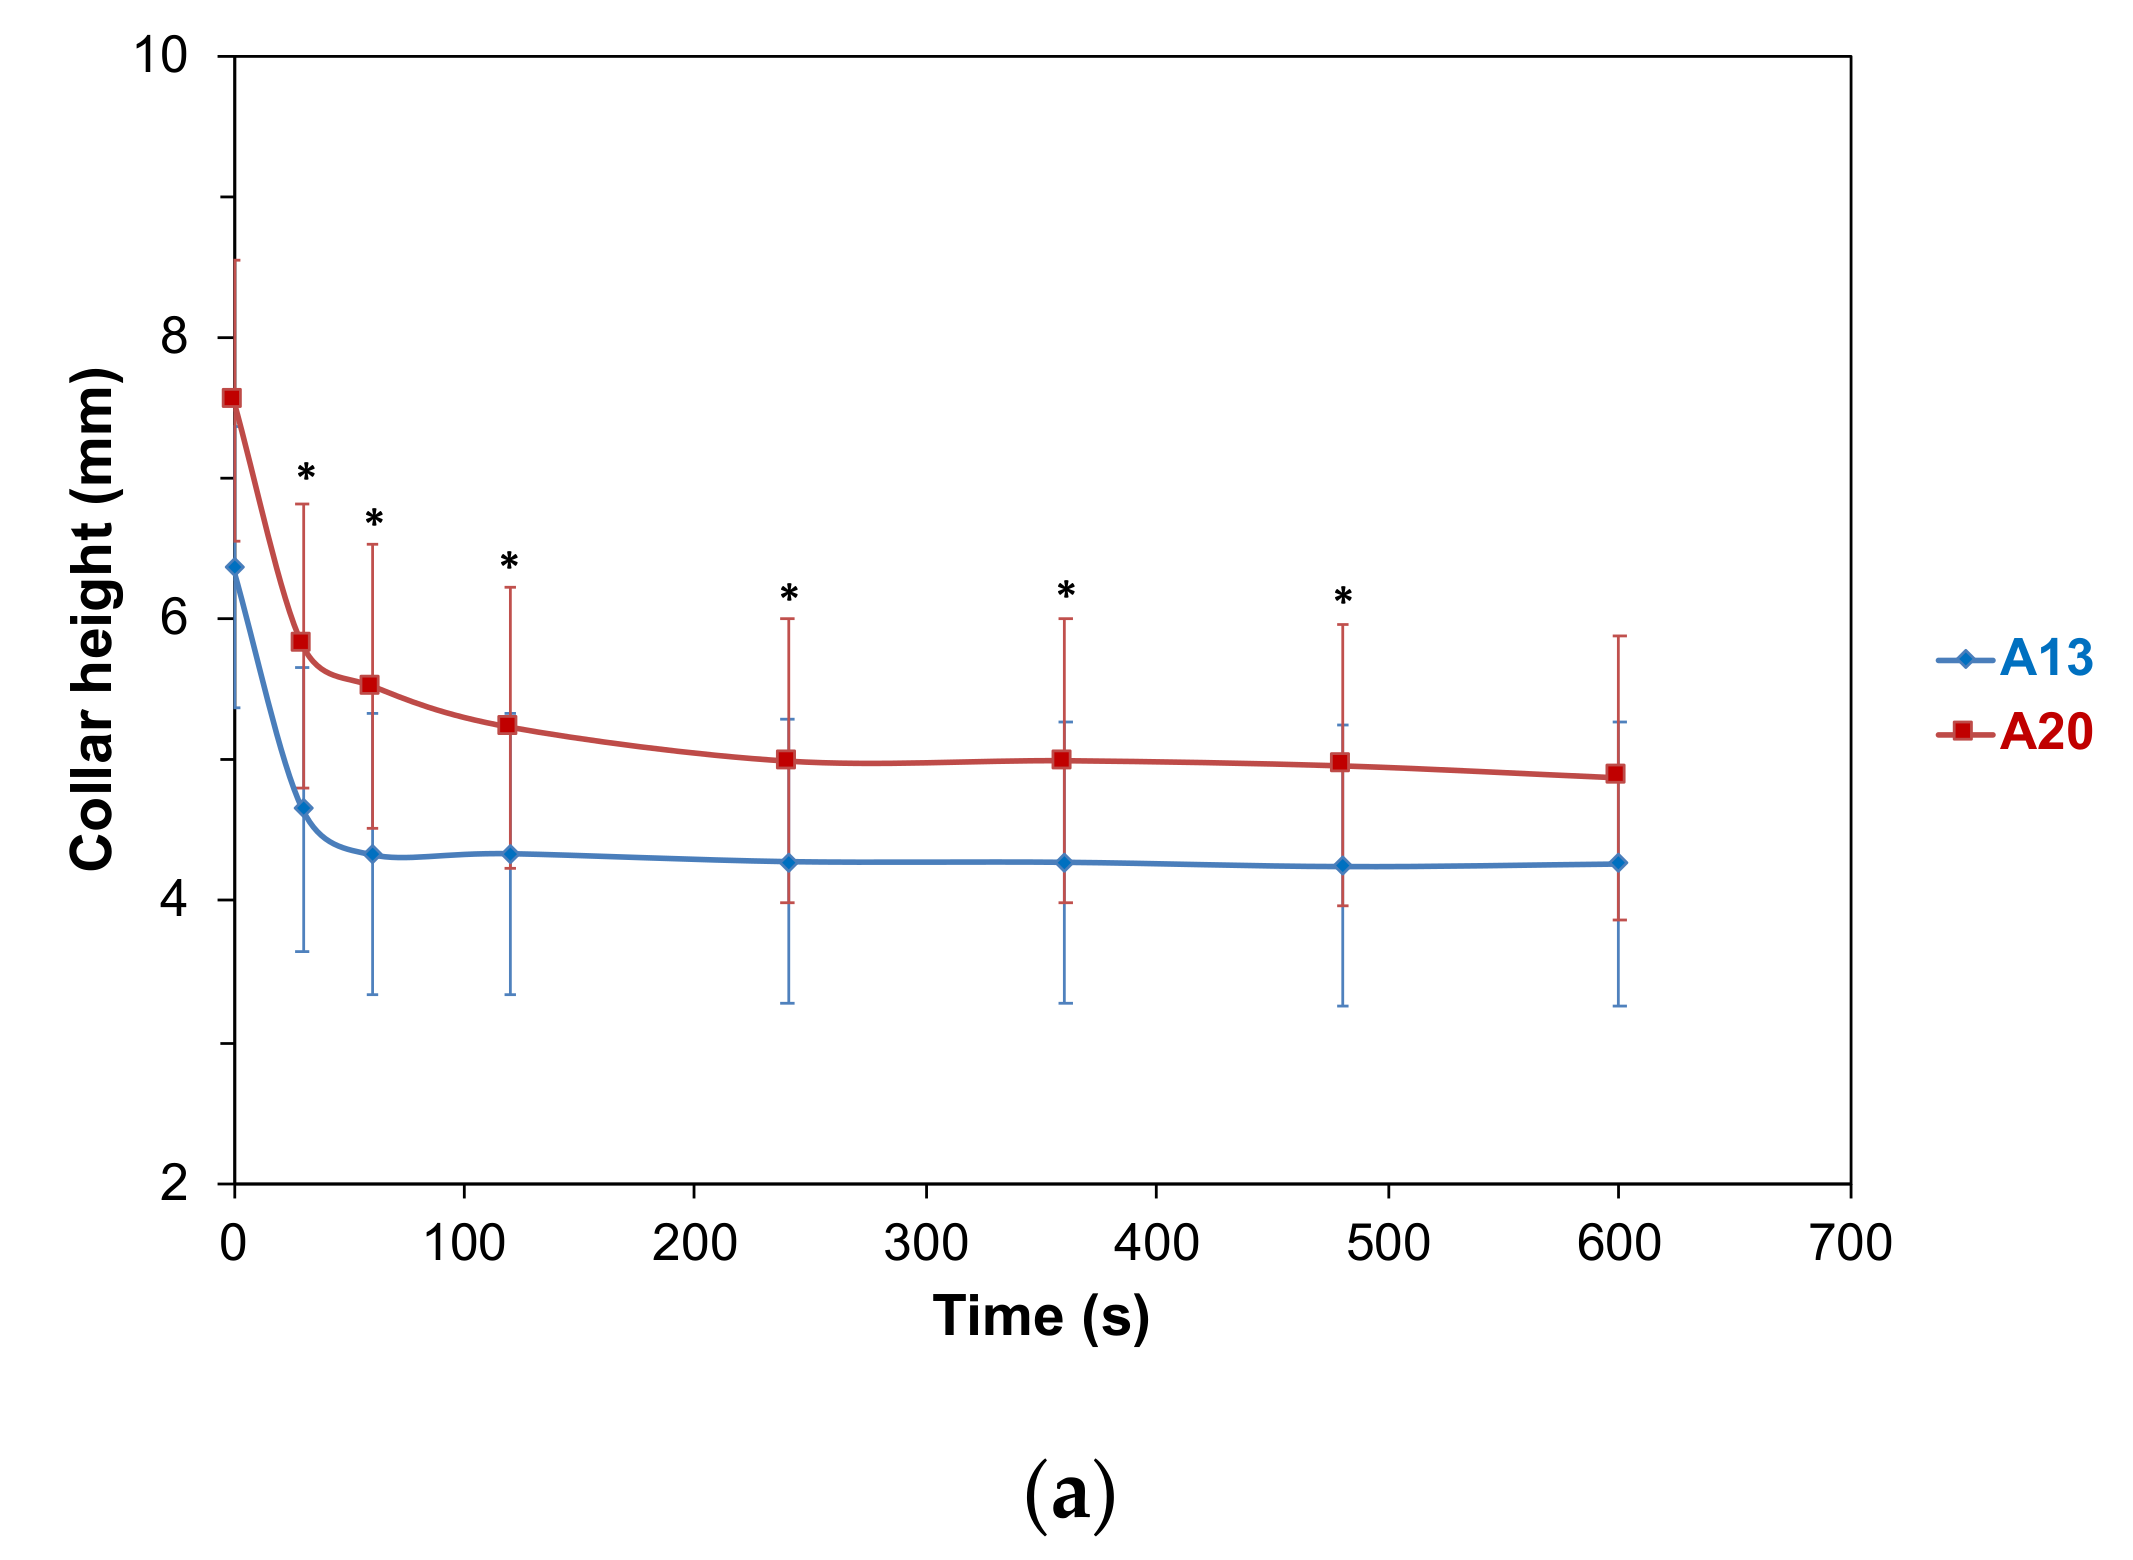
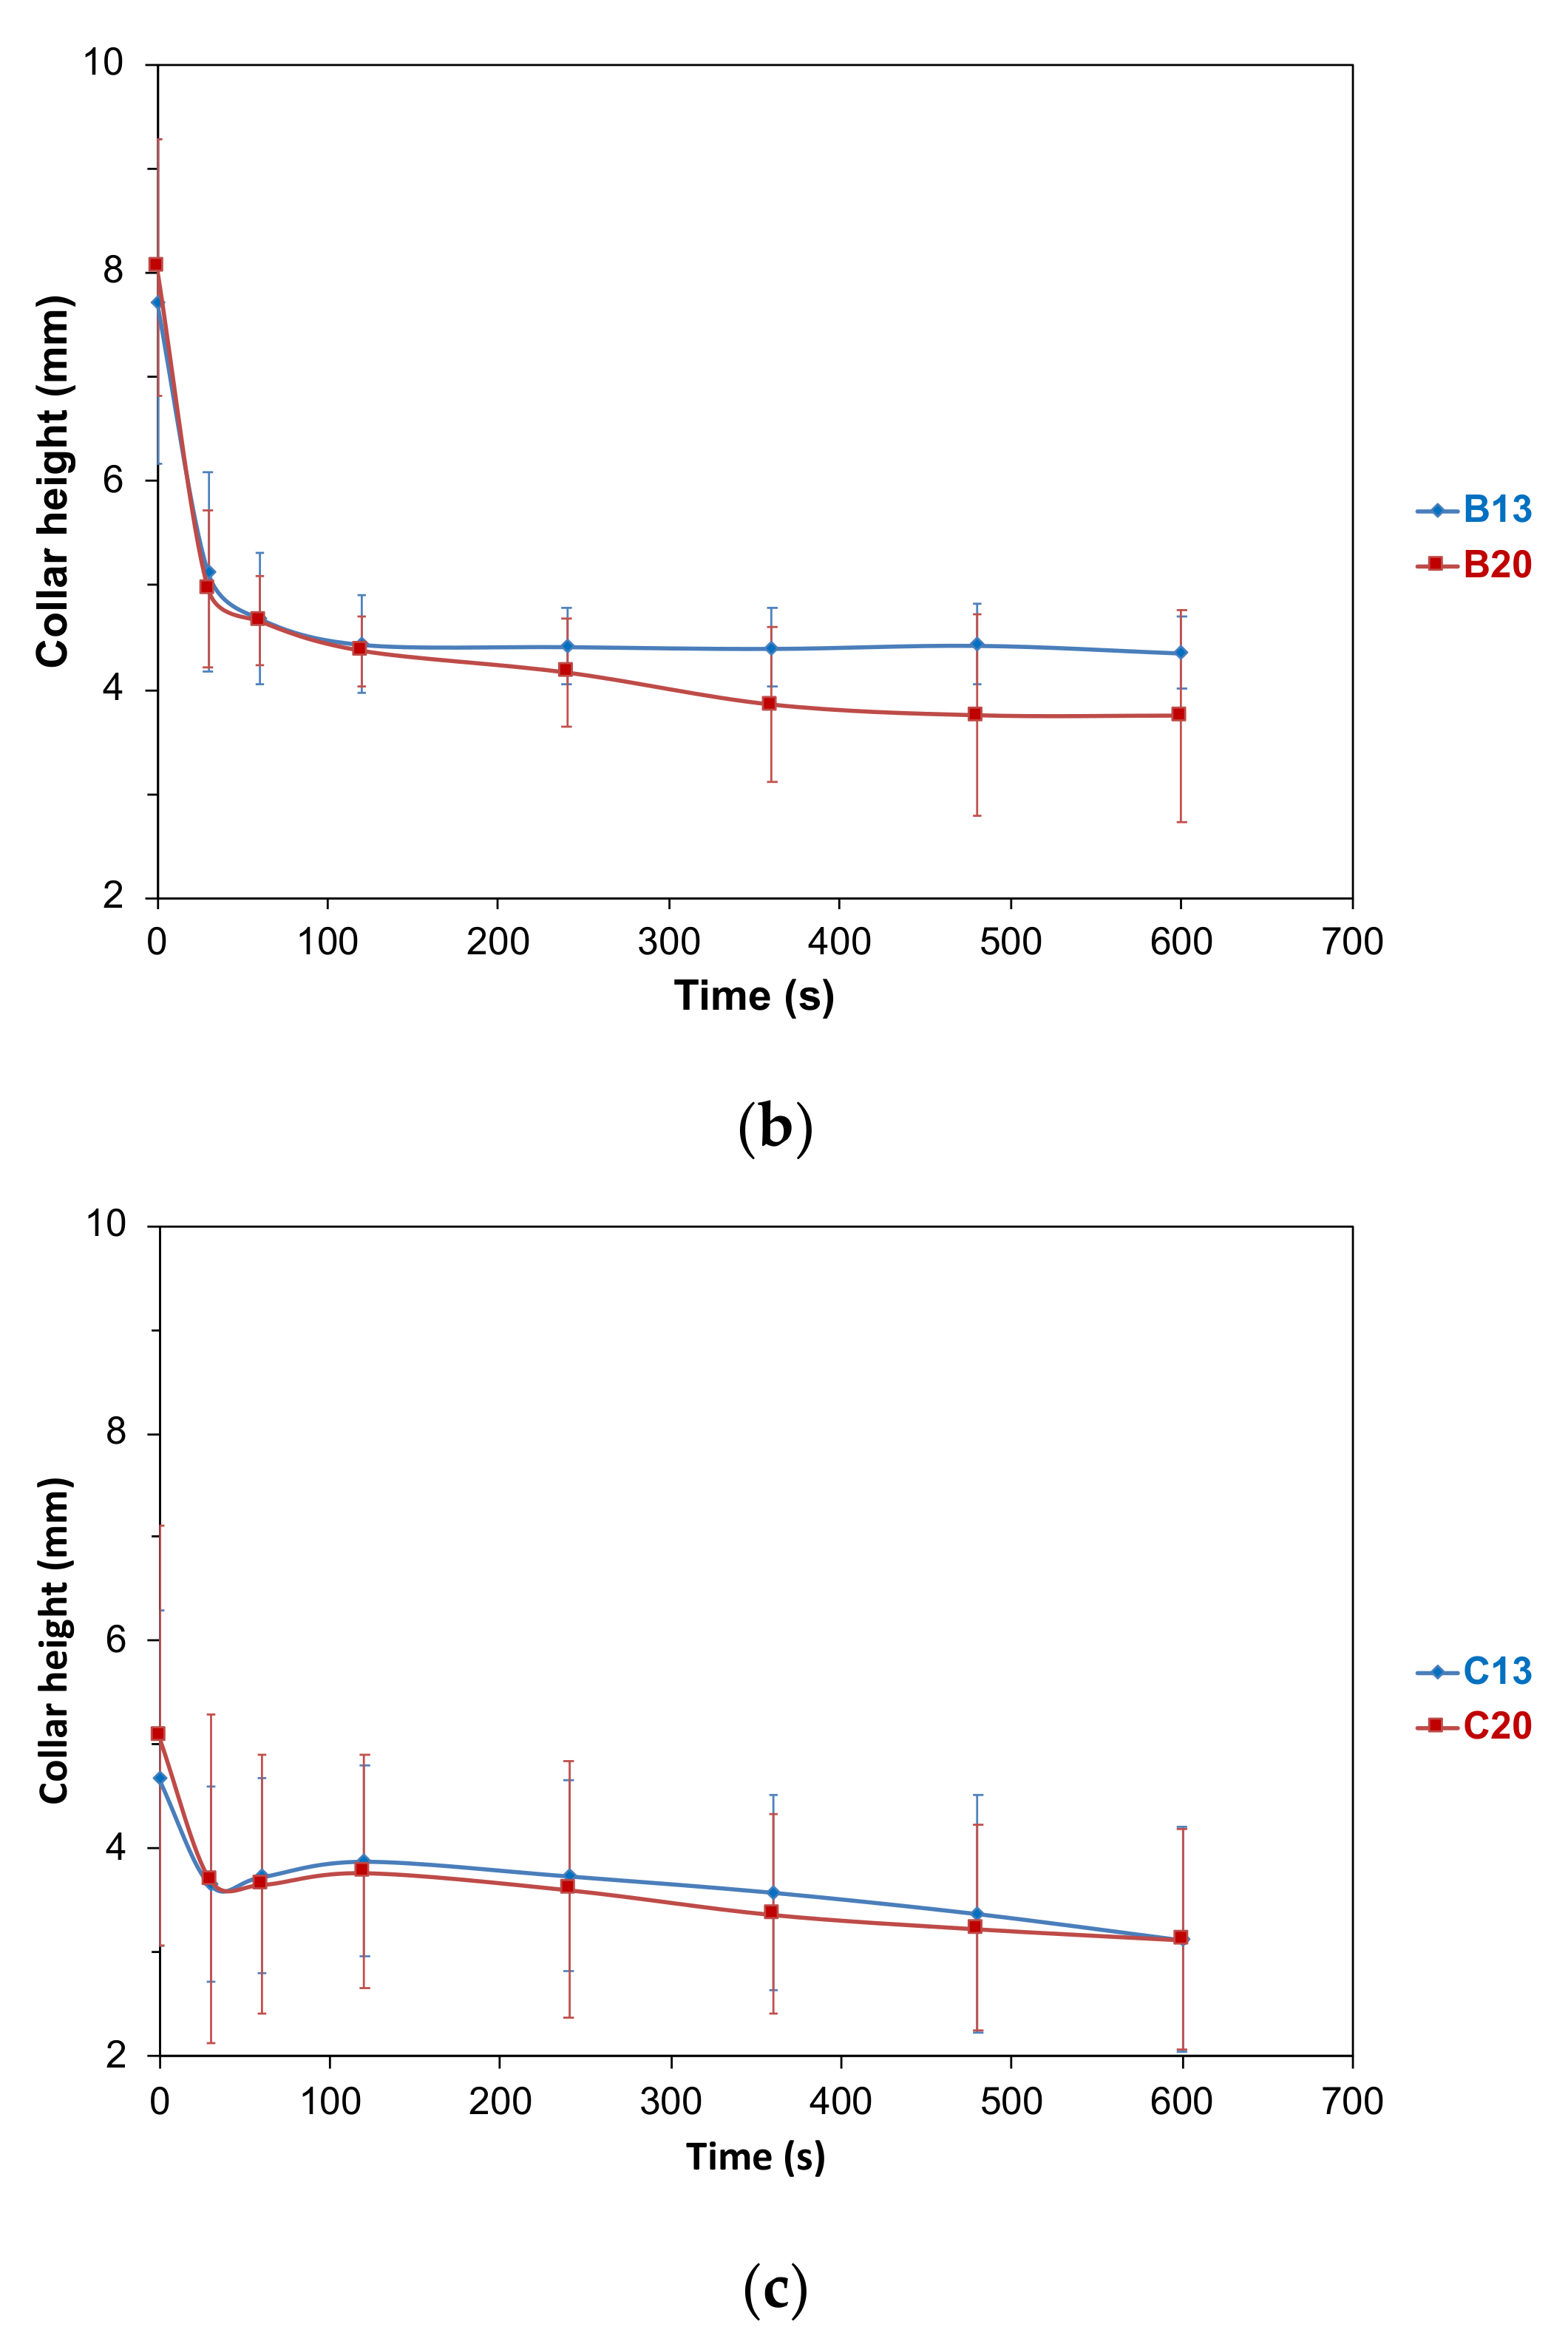
2.4.1. Foam Collar
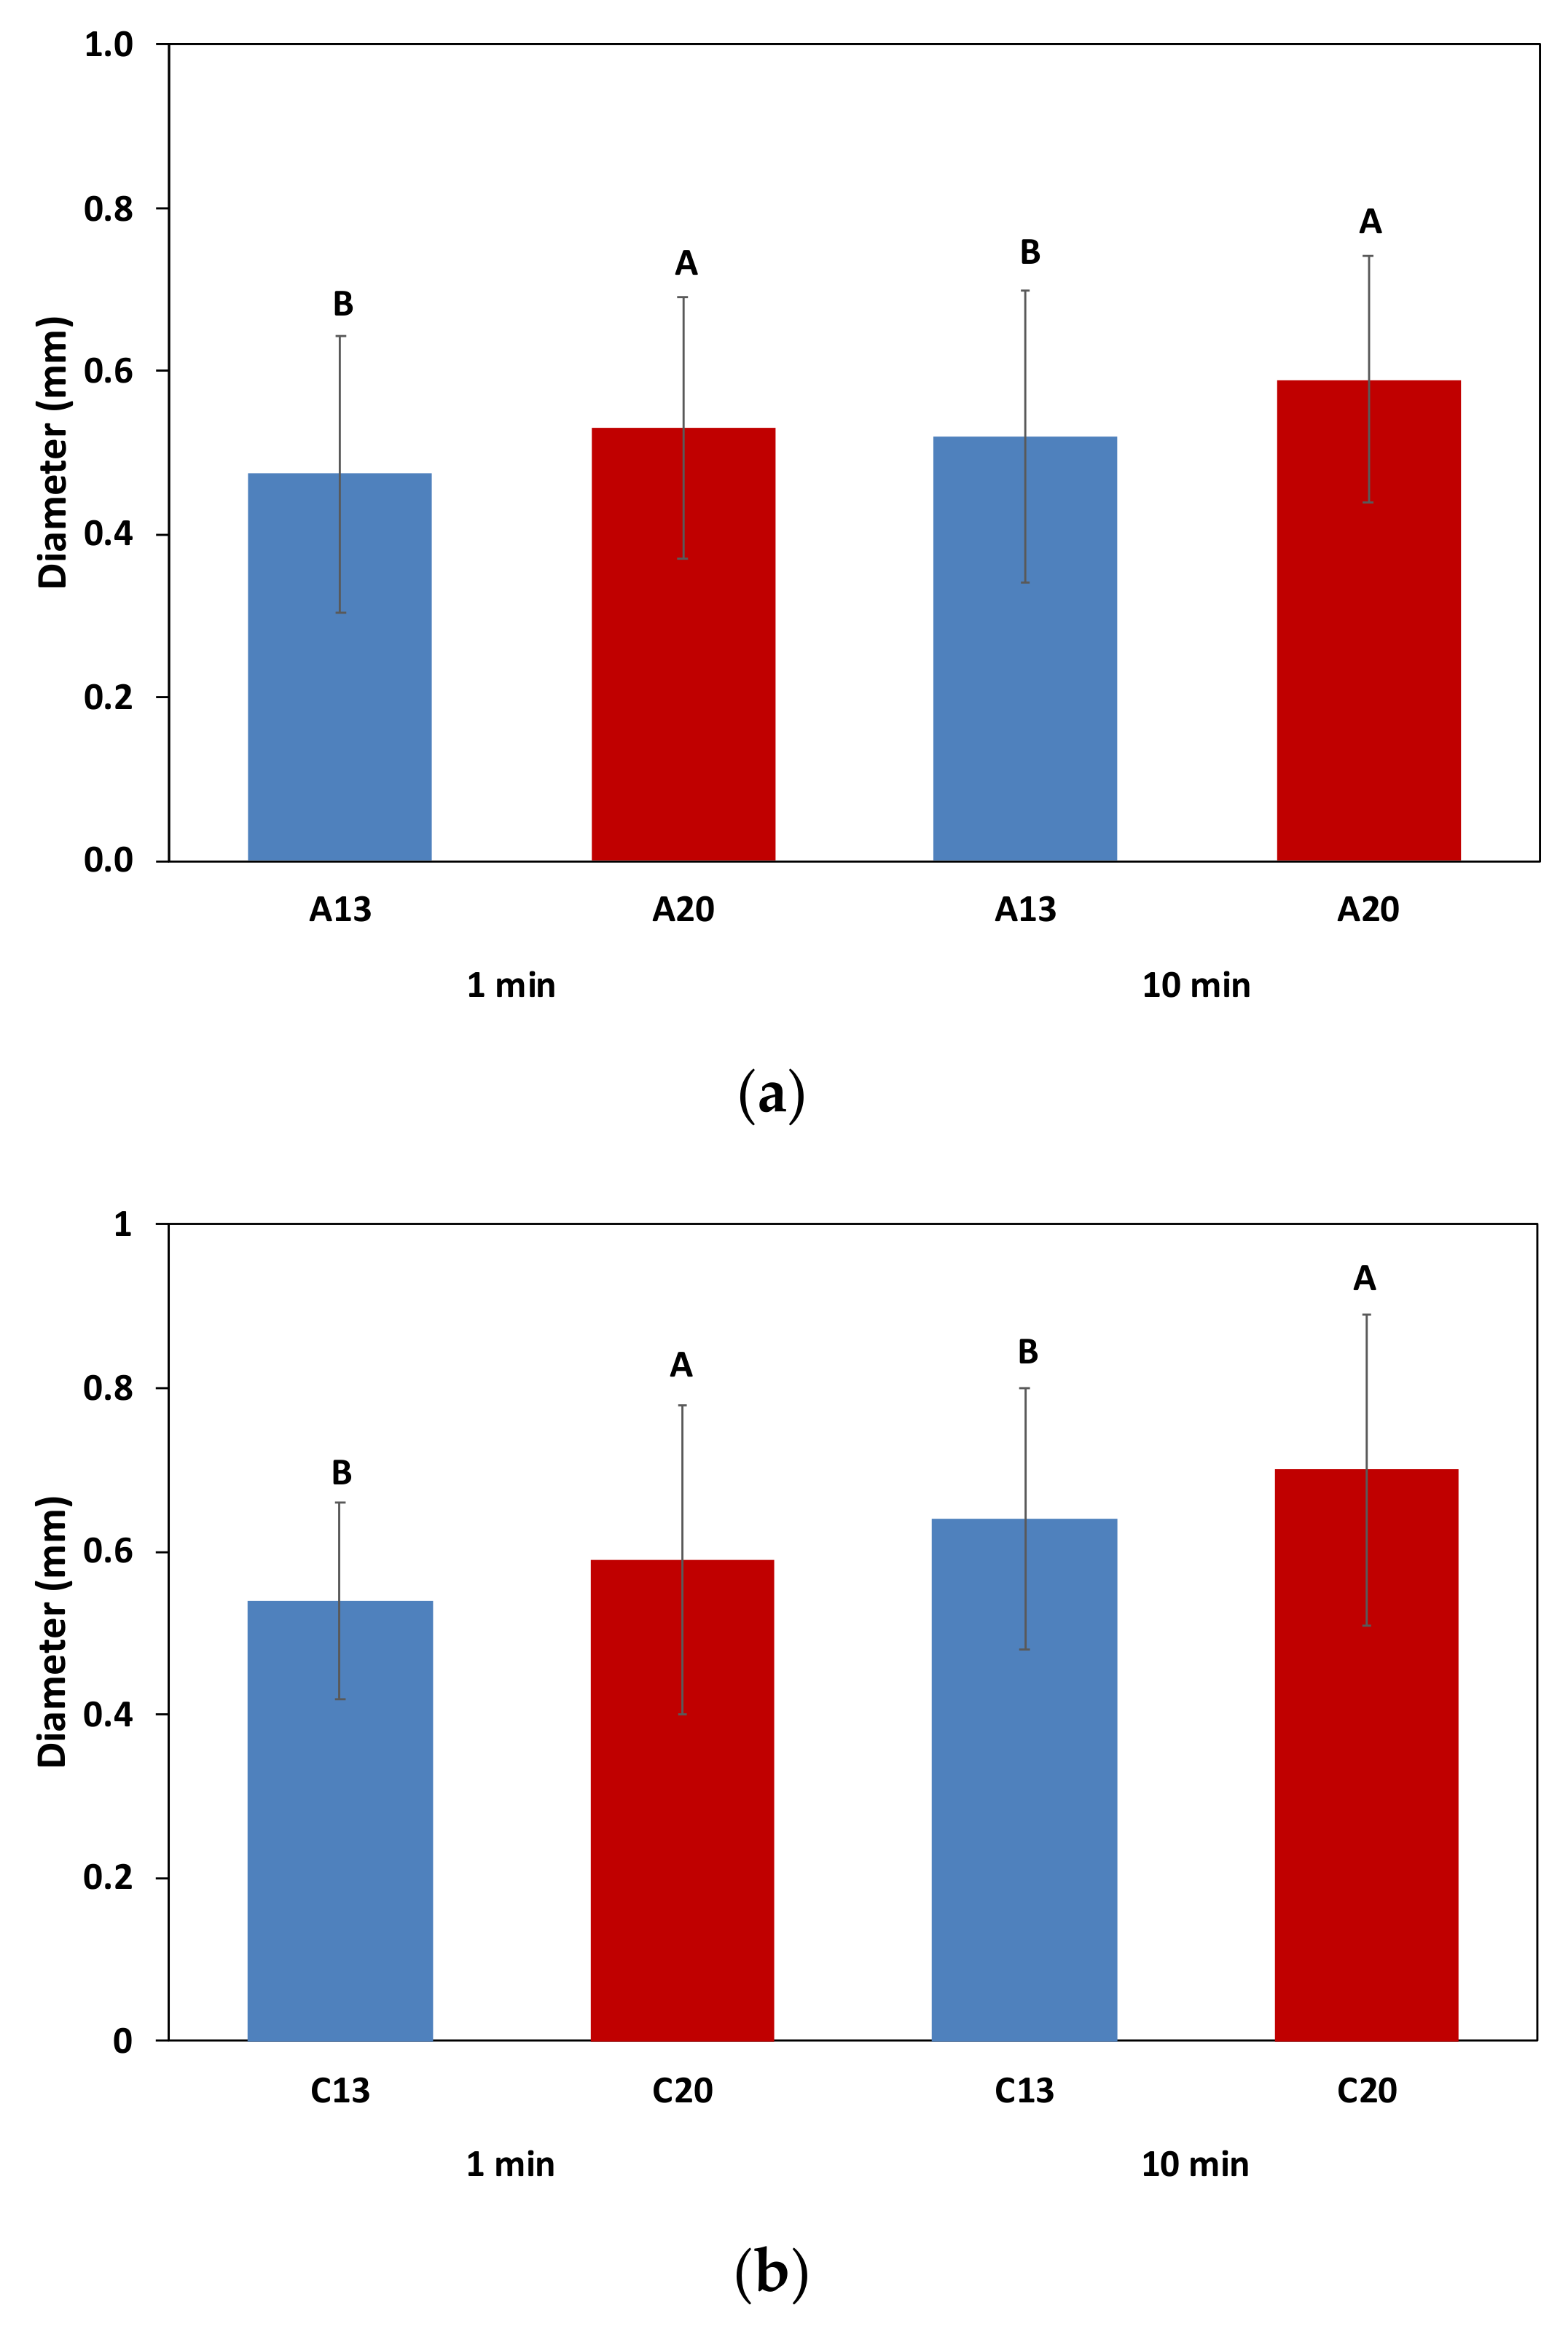
2.4.2. Bubble Size
3. Conclusions
4. Materials and Methods
4.1. Sparkling Wines Samples
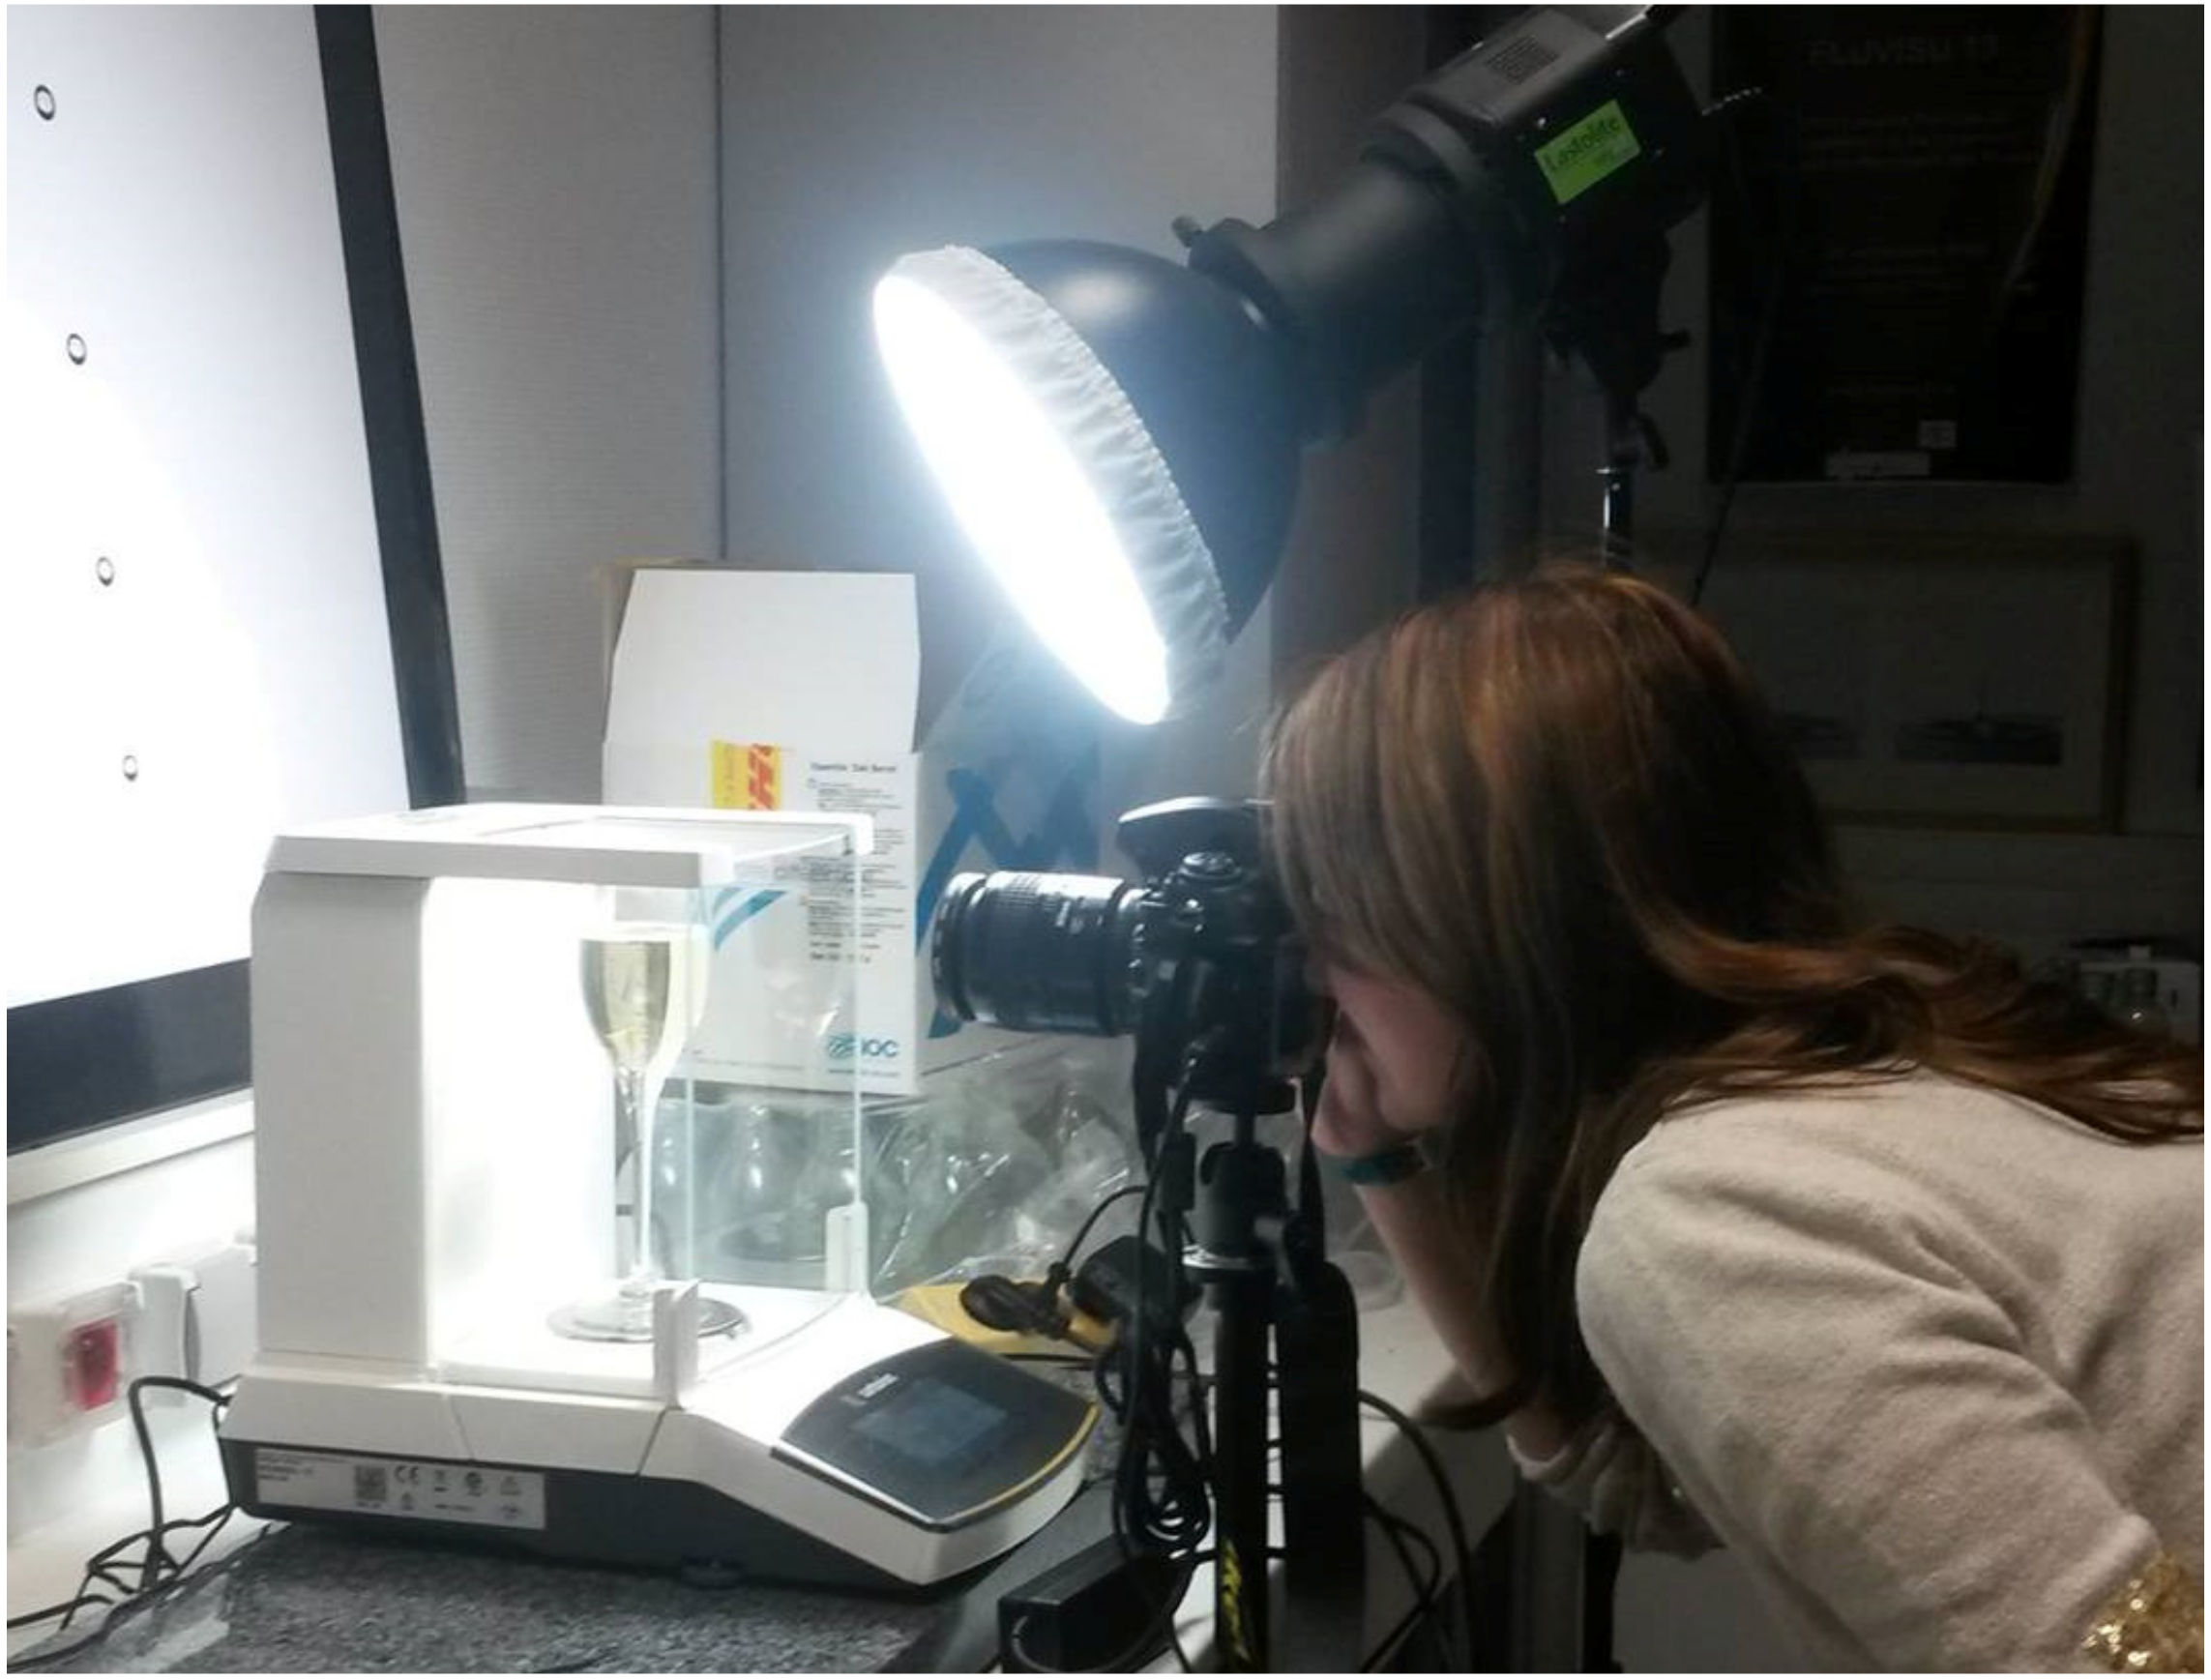
4.2. Standardized Tasting Conditions
4.3. Measuring Concentrations of Dissolved CO2 in Sparkling Wines Samples
4.4. Measuring the Flux of CO2 Desorbing from the Flute Poured with Sparkling Wines
4.5. Foaming Properties (Collar Height and Bubbles Size) in Tasting Conditions
4.6. Statistical Analysis
Supplementary Materials
Author Contributions
Funding
Data Availability Statement
Acknowledgments
Conflicts of Interest
Sample Availability
References
- Liger-Belair, G. Effervescence in Champagne and sparkling wines: From grape harvest to bubble rise. Eur. Phys. J. Spec. Top. 2017, 226, 3–116. [Google Scholar] [CrossRef]
- Kemp, B.; Condé, B.; Jégou, S.; Howell, K.; Vasserot, Y.; Marchal, R. Chemical compounds and mechanisms involved in the formation and stabilization of foam in sparkling wines. Crit. Rev. Food Sci. Nutr. 2019, 59, 2072–2094. [Google Scholar] [CrossRef] [PubMed]
- Cilindre, C.; Fasoli, E.; D’Amato, A.; Liger-Belair, G.; Righetti, P.G. It’s time to pop a cork on champagne’s proteome! J. Proteomics 2014, 105, 351–362. [Google Scholar] [CrossRef] [PubMed]
- Condé, B.C.; Bouchard, E.; Culbert, J.A.; Wilkinson, K.L.; Fuentes, S.; Howell, K.S. Soluble protein and amino acid content affects the foam quality of sparkling wine. J. Agric. Food Chem. 2017, 65, 9110–9119. [Google Scholar] [CrossRef] [PubMed]
- Alexandre, H.; Guilloux-Benatier, M. Yeast autolysis in sparkling wine—A review. Aust. J. Grape Wine Res. 2006, 12, 119–127. [Google Scholar] [CrossRef]
- Kemp, B.; Alexandre, H.; Robillard, B.; Marchal, R. Effect of production phase on bottle-fermented sparkling wine quality. J. Agric. Food Chem. 2015, 63, 19–38. [Google Scholar] [CrossRef]
- Benucci, I.; Liburdi, K.; Cerreti, M.; Esti, M. Characterization of active dry wine yeast during starter culture (pied de cuve) preparation for sparkling wine production. J. Food Sci. 2016, 81, M2015–M2020. [Google Scholar] [CrossRef]
- Laurent, M.; Valade, M. La préparation du levain de tirage à partir de levures sèches actives. Le Vigneron Champenois 2007, 128, 74–95. [Google Scholar]
- Valade, M.; Laurent, M. La prise de mousse: Les phénomènes microbiologiques (1eère partie). Le Vigneron Champenois 1999, 120, 59–78. [Google Scholar]
- Valade, M.; Laurent, M. La prise de mousse: Les pheénomeènes microbiologiques (2eème partie). Le Vigneron Champenois 1999, 120, 67–89. [Google Scholar]
- Penacho, V.; Valero, E.; Gonzalez, R. Transcription profiling of sparkling wine second fermentation. Int. J. Food Microbiol. 2012, 153, 176–182. [Google Scholar] [CrossRef] [PubMed]
- González-Jiménez, M.d.C.; García-Martínez, T.; Puig-Pujol, A.; Capdevila, F.; Moreno-García, J.; Moreno, J.; Mauricio, J.C. Biological Processes Highlighted in Saccharomyces cerevisiae during the Sparkling Wines Elaboration. Microorganisms 2020, 8, 1216. [Google Scholar] [CrossRef] [PubMed]
- Porras-Agüera, J.A.; Román-Camacho, J.J.; Moreno-García, J.; Mauricio, J.C.; Moreno, J.; García-Martínez, T. Effect of endogenous CO2 overpressure on the yeast “stressome” during the “prise de mousse” of sparkling wine. Food Microbiol. 2020, 89, 103431. [Google Scholar] [CrossRef] [PubMed]
- Martínez-García, R.; García-Martínez, T.; Puig-Pujol, A.; Mauricio, J.C.; Moreno, J. Changes in sparkling wine aroma during the second fermentation under CO2 pressure in sealed bottle. Food Chem. 2017, 237, 1030–1040. [Google Scholar] [CrossRef] [PubMed]
- Bulletin officiel du Ministère de l’Agriculture et de l’Alimentation du 14 Novembre 2019. Cahier des Charges de l’Appellation d’Origine Contrôlée « Crémant de Loire » Homologué par l’Arrêté du 10 Octobre 2019, Publié au JORF du 19 Octobre 2019. Available online: https://info.agriculture.gouv.fr/gedei/site/bo-agri/document_administratif-baeb17d6-5e61-48e0-ab86-d4c28e387778 (accessed on 30 March 2021).
- Bulletin Officiel du Ministère de l’Agriculture et de l’Alimentation du 3 Septembre 2020. Cahier des Charges de l’Appellation d’Origine Contrôlée «Champagne» Homologué par le Décret n°2010-1441 du 22 Novembre 2010, Modifié par Arrêté du 19 Août 2020 Publié au JORF du 27 Août 2020. Available online: https://info.agriculture.gouv.fr/gedei/site/bo-agri/document_administratif-f45cd2cf-c683-42c8-b1ea-c209314cfeb2 (accessed on 30 March 2021).
- Valade, M. La prise de mousse: Historique. Le Vigneron Champenois 1999, 120, 63–77. [Google Scholar]
- Vizetelly, H. A History of Champagne: With Notes on the Other Sparkling Wines of France, 1st ed.; Vizetelly & Co.: New York, NY, USA, 1882. [Google Scholar]
- Union des Maisons de Champagne. 2021. Available online: https://maisons-champagne.com/en/appellation/stages-in-winemaking/from-still-wine-to-sparkling-wine/article/second-fermentation-capturing-the-sparkle (accessed on 29 March 2021).
- Esteruelas, M.; González-Royo, E.; Gil, M.; Kountoudakis, N.; Orte, A.; Cantos, A.; Fort, F.; Canals, J.M.; Zamora, F. Influence of temperature during the second fermentation and aging of sparkling wine (Cava) on the properties of the foam. BIO Web Conf. 2015, 5, 02011. [Google Scholar] [CrossRef] [Green Version]
- Liger-Belair, G.; Bourget, M.; Villaume, S.; Jeandet, P.; Pron, H.; Polidori, G. On the losses of dissolved CO2 during champagne serving. J. Agric. Food Chem. 2010, 58, 8768–8775. [Google Scholar] [CrossRef] [PubMed]
- Liger-Belair, G.; Villaume, S.; Cilindre, C.; Jeandet, P. Kinetics of CO2 fluxes outgassing from champagne glasses in tasting conditions: The role of temperature. J. Agric. Food Chem. 2009, 57, 1997–2003. [Google Scholar] [CrossRef]
- Liger-Belair, G.; Parmentier, M.; Cilindre, C. More on the losses of dissolved CO2 during champagne serving: Toward a multiparameter modeling. J. Agric. Food Chem. 2012, 60, 11777–11786. [Google Scholar] [CrossRef]
- Liger-Belair, G.; Villaume, S.; Cilindre, C.; Polidori, G.; Jeandet, P. CO2 volume fluxes outgassing from champagne glasses in tasting conditions: Flute versus coupe. J. Agric. Food Chem. 2009, 57, 4939–4947. [Google Scholar] [CrossRef] [PubMed]
- Liger-Belair, G.; Conreux, A.; Villaume, S.; Cilindre, C. Monitoring the losses of dissolved carbon dioxide from laser-etched champagne glasses. Food Res. Int. 2013, 54, 516–522. [Google Scholar] [CrossRef]
- Liger-Belair, G. The physics and chemistry behind the bubbling properties of Champagne and sparkling wines: A state-of-the-art review. J. Agric. Food Chem. 2005, 53, 2788–2802. [Google Scholar] [CrossRef] [PubMed]
- Gonzalez Viejo, C.; Torrico, D.D.; Dunshea, F.R.; Fuentes, S. Bubbles, foam formation, stability and consumer perception of carbonated drinks: A review of current, new and emerging technologies for rapid assessment and control. Foods 2019, 8, 596. [Google Scholar] [CrossRef] [PubMed] [Green Version]
- White, M.R.H.; Heymann, H. Assessing the sensory profiles of sparkling wine over time. Am. J. Enol. Vitic. 2015, 66, 156–163. [Google Scholar] [CrossRef]
- Torija, M.J.; Beltran, G.; Novo, M.; Poblet, M.; Guillamón, J.M.; Mas, A.; Rozes, N. Effects of fermentation temperature and Saccharomyces species on the cell fatty acid composition and presence of volatile compounds in wine. Int. J. Food Microbiol. 2003, 85, 127–136. [Google Scholar] [CrossRef]
- Martínez-García, R.; Moreno, J.; Bellincontro, A.; Centioni, L.; Puig-Pujol, A.; Peinado, R.A.; Mauricio, J.C.; García-Martínez, T. Using an electronic nose and volatilome analysis to differentiate sparkling wines obtained under different conditions of temperature, ageing time and yeast formats. Food Chem. 2021, 334, 127574. [Google Scholar] [CrossRef]
- Caputi, A.J.; Ueda, M.; Walter, P.; Brown, T. Titrimetric determination of carbon dioxide in wine. Am. J. Enol. Vitic. 1970, 21, 140–144. [Google Scholar]
- Moriaux, A.L.; Vallon, R.; Lecasse, F.; Chauvin, N.; Parvitte, B.; Zéninari, V.; Liger-Belair, G.; Cilindre, C. How does gas-phase CO2 evolve in the headspace of champagne glasses? J. Agric. Food Chem. 2021, 69, 2262–2270. [Google Scholar] [CrossRef]


| Concentration of Dissolved CO2 (g.L−1) 1 | Temperature of the prise de mousse (°C) | Batch A | Batch B | Batch C |
|---|---|---|---|---|
| 13 | 9.65 ± 0.07 a | 8.79 ± 0.08 a | 9.38 ± 0.08 b | |
| 20 | 9.60 ± 0.08 a | 8.92 ± 0.08 a | 9.52 ± 0.09 a | |
| 13 | 6.50 ± 0.23 a | 5.90 ± 0.16 a | 6.32 ± 0.16 a | |
| 20 | 6.37 ± 0.18 a | 5.96 ± 0.24 a | 6.30 ± 0.08 a |
Publisher’s Note: MDPI stays neutral with regard to jurisdictional claims in published maps and institutional affiliations. |
© 2021 by the authors. Licensee MDPI, Basel, Switzerland. This article is an open access article distributed under the terms and conditions of the Creative Commons Attribution (CC BY) license (https://creativecommons.org/licenses/by/4.0/).
Share and Cite
Cilindre, C.; Henrion, C.; Coquard, L.; Poty, B.; Barbier, J.-E.; Robillard, B.; Liger-Belair, G. Does the Temperature of the prise de mousse Affect the Effervescence and the Foam of Sparkling Wines? Molecules 2021, 26, 4434. https://doi.org/10.3390/molecules26154434
Cilindre C, Henrion C, Coquard L, Poty B, Barbier J-E, Robillard B, Liger-Belair G. Does the Temperature of the prise de mousse Affect the Effervescence and the Foam of Sparkling Wines? Molecules. 2021; 26(15):4434. https://doi.org/10.3390/molecules26154434
Chicago/Turabian StyleCilindre, Clara, Céline Henrion, Laure Coquard, Barbara Poty, Jacques-Emmanuel Barbier, Bertrand Robillard, and Gérard Liger-Belair. 2021. "Does the Temperature of the prise de mousse Affect the Effervescence and the Foam of Sparkling Wines?" Molecules 26, no. 15: 4434. https://doi.org/10.3390/molecules26154434
APA StyleCilindre, C., Henrion, C., Coquard, L., Poty, B., Barbier, J.-E., Robillard, B., & Liger-Belair, G. (2021). Does the Temperature of the prise de mousse Affect the Effervescence and the Foam of Sparkling Wines? Molecules, 26(15), 4434. https://doi.org/10.3390/molecules26154434