
Carbon Isotope Fractionation during the Formation of CO2 Hydrate and Equilibrium Pressures of 12CO2 and 13CO2 Hydrates


Abstract
:1. Introduction
2. Results and Discussion
3. Materials and Methods
3.1. Crystallographic Analysis
3.2. Measurement for Equilibrium Pressure
3.3. Gas Analysis for Detecting Carbon Isotope Fractionation
4. Conclusions
Supplementary Materials
Author Contributions
Funding
Institutional Review Board Statement
Informed Consent Statement
Data Availability Statement
Acknowledgments
Conflicts of Interest
Sample Availability
References
- Sloan, E.D.; Koh, C.A. Clathrate Hydrates of Natural Gases, 3rd ed.; CRC Press Taylor and Francis Group: Boca Raton, FL, USA, 2008. [Google Scholar]
- Sluijs, A.; Brinkhuis, H.; Schouten, S.; Bohaty, S.M.; John, C.M.; Zachos, J.C.; Reichart, G.-J.; Sinninghe Damsté, J.S.; Crouch, E.M.; Dickens, G.R. Environmental precursors to rapid light carbon injection at the Palaeocene/Eocene boundary. Nature 2007, 450, 1218–1221. [Google Scholar] [CrossRef]
- Kennedy, M.; Mrofka, D.; Von Der Borch, C. Snowball Earth termination by destabilization of equatorial permafrost methane clathrate. Nature 2008, 453, 642–645. [Google Scholar] [CrossRef]
- Ménot, G.; Bard, E. Geochemical evidence for a large methane release during the last deglaciation from Marmara Sea sediments. Geochim. Cosmochim. Acta 2010, 74, 1537–1550. [Google Scholar] [CrossRef]
- Shipley, T.H.; Didyk, B.M. Occurrence of methane hydrates offshore southern Mexico. In Initial Reports of the Deep Sea Drilling Project; Watkins, J.S., Moore, J.C., Eds.; USA Govt Printing Office: Washington, DC, USA, 1982; Volume 66, pp. 547–555. [Google Scholar]
- Brooks, J.M.; Kennicutt, M.C., II; Fay, R.R.; McDonald, T.J.; Sassen, R. Thermogenic gas hydrates in the Gulf of Mexico. Science 1984, 225, 409–411. [Google Scholar] [CrossRef]
- Jin, Y.; Kida, M.; Yoneda, J.; Konno, Y.; Oshima, M.; Tenma, N.; Nagao, J. Natural gas hydrates recovered from the Umitaka Spur in the Joetsu Basin, Japan: Coexistence of two structure-I hydrates with distinctly different textures and gas compositions within a massive structure. ACS Earth Space Chem. 2020, 4, 77–85. [Google Scholar] [CrossRef] [Green Version]
- Sakai, H.; Gamo, T.; Kim, E.-S.; Tsutsumi, M.; Tanaka, T.; Ishibashi, J.; Wakita, H.; Yamano, M.; Oomori, T. Venting of carbon dioxide-rich fluid and hydrate formation in Mid-Okinawa Trough Backarc Basin. Science 1990, 248, 1093–1096. [Google Scholar] [CrossRef]
- Lupton, J.; Butterfield, D.; Lilley, M.; Evans, L.; Nakamura, K.; Chadwick, W., Jr.; Resing, J.; Embley, R.; Olson, E.; Proskurowski, G.; et al. Submarine venting of liquid carbon dioxide on a Mariana Arc volcano. Geochem. Geophys. Geosyst. 2006, 7, Q08007. [Google Scholar] [CrossRef] [Green Version]
- Miller, S.L.; Smythe, W.D. Carbon dioxide clathrate in the Martian ice cap. Science 1970, 170, 531–533. [Google Scholar] [CrossRef]
- Dobrovolskis, A.; Ingersoll, A.P. Carbon dioxide-water clathrate as a reservoir of CO2 on Mars. Icarus 1975, 26, 353–357. [Google Scholar] [CrossRef]
- Ambuehl, D.; Madden, M.E. CO2 hydrate formation and dissociation rates: Application to Mars. Icarus 2014, 234, 45–52. [Google Scholar] [CrossRef]
- Hachikubo, A.; Kosaka, T.; Kida, M.; Krylov, A.; Sakagami, H.; Minami, H.; Takahashi, N.; Shoji, H. Isotopic fractionation of methane and ethane hydrates between gas and hydrate phases. Geophys. Res. Lett. 2007, 34, L21502. [Google Scholar] [CrossRef]
- Hachikubo, A.; Khlystov, O.; Manakov, A.; Kida, M.; Krylov, A.; Sakagami, H.; Minami, H.; Takahashi, N.; Shoji, H.; Kalmychkov, G.; et al. Model of formation of double structure gas hydrates in Lake Baikal based on isotopic data. Geophys. Res. Lett. 2009, 36, L18504. [Google Scholar] [CrossRef] [Green Version]
- Hachikubo, A.; Krylov, A.; Sakagami, H.; Minami, H.; Nunokawa, Y.; Shoji, H.; Matveeva, T.; Jin, Y.K.; Obzhirov, A. Isotopic composition of gas hydrates in subsurface sediments from offshore Sakhalin Island, Sea of Okhotsk. Geo-Mar. Lett. 2010, 30, 313–319. [Google Scholar] [CrossRef]
- Hachikubo, A.; Minami, H.; Yamashita, S.; Khabuev, A.; Krylov, A.; Kalmychkov, G.; Poort, J.; De Batist, M.; Chenskiy, A.; Manakov, A.; et al. Characteristics of hydrate-bound gas retrieved at the Kedr mud volcano (southern Lake Baikal). Sci. Rep. 2020, 10, 14747. [Google Scholar] [CrossRef]
- Luzi, M.; Schicks, J.M.; Erzinger, J. Carbon isotopic fractionation of synthetic methane and carbon dioxide hydrates. In Proceedings of the 7th International Conference on Gas Hydrates (ICGH2011), Edinburgh, UK, 17–21 July 2011. [Google Scholar]
- Ozeki, T.; Kikuchi, Y.; Takeya, S.; Hachikubo, A. Phase equilibrium of isotopologue methane hydrates enclathrated CH3D and CD4. J. Chem. Eng. Data 2018, 63, 2266–2270. [Google Scholar] [CrossRef]
- Nakano, S.; Moritoki, M.; Ohgaki, K. High-pressure phase equilibrium and Raman microprobe spectroscopic studies on the CO2 hydrate system. J. Chem. Eng. Data 1998, 43, 807–810. [Google Scholar] [CrossRef]
- Kumar, R.; Englezos, P.; Moudrakovski, I.; Ripmeester, J.A. Structure and composition of CO2/H2 and CO2/H2/C3H8 hydrate in relation to simultaneous CO2 capture and H2 production. AIChE J. 2009, 55, 1584–1594. [Google Scholar] [CrossRef]
- Qin, J.; Kuhs, W.F. Quantitative analysis of gas hydrates using Raman spectroscopy. AIChE J. 2013, 59, 2155–2167. [Google Scholar] [CrossRef]
- Shimanouchi, T. Tables of Molecular Vibrational Frequencies, Consolidated Volume I; US Government Printing Office: Washington, DC, USA, 1972; p. 39.
- Nema, Y.; Ohmura, R.; Senaha, I.; Yasuda, K. Quadruple point determination in carbon dioxide hydrate forming system. Fluid Phase Equilib. 2017, 441, 49–53. [Google Scholar] [CrossRef]
- Deaton, W.M.; Frost, E.M. Gas Hydrates and Their Relation to the Operation of Natural-Gas Pipe Lines; American Gas Association: Washington, DC, USA, 1946; Volume 8. [Google Scholar]
- Larson, S.D. Phase Studies of the Two-Component Carbon Dioxide-Water System, Involving the Carbon Dioxide Hydrate. Ph.D. Thesis, University of Illinois, Urbana, IL, USA, 1955. [Google Scholar]
- Yasuda, K.; Ohmura, R. Phase equilibrium for clathrate hydrates formed with methane, ethane, propane, or carbon dioxide at temperatures below the freezing point of water. J. Chem. Eng. Data 2008, 53, 2182–2188. [Google Scholar] [CrossRef]
- Hachikubo, A.; Kida, M.; Okuda, M.; Sakagami, H.; Shoji, H. Dissociation heat of mixed-gas hydrate composed of methane and ethane. Seppyo 2009, 71, 341–351. [Google Scholar]


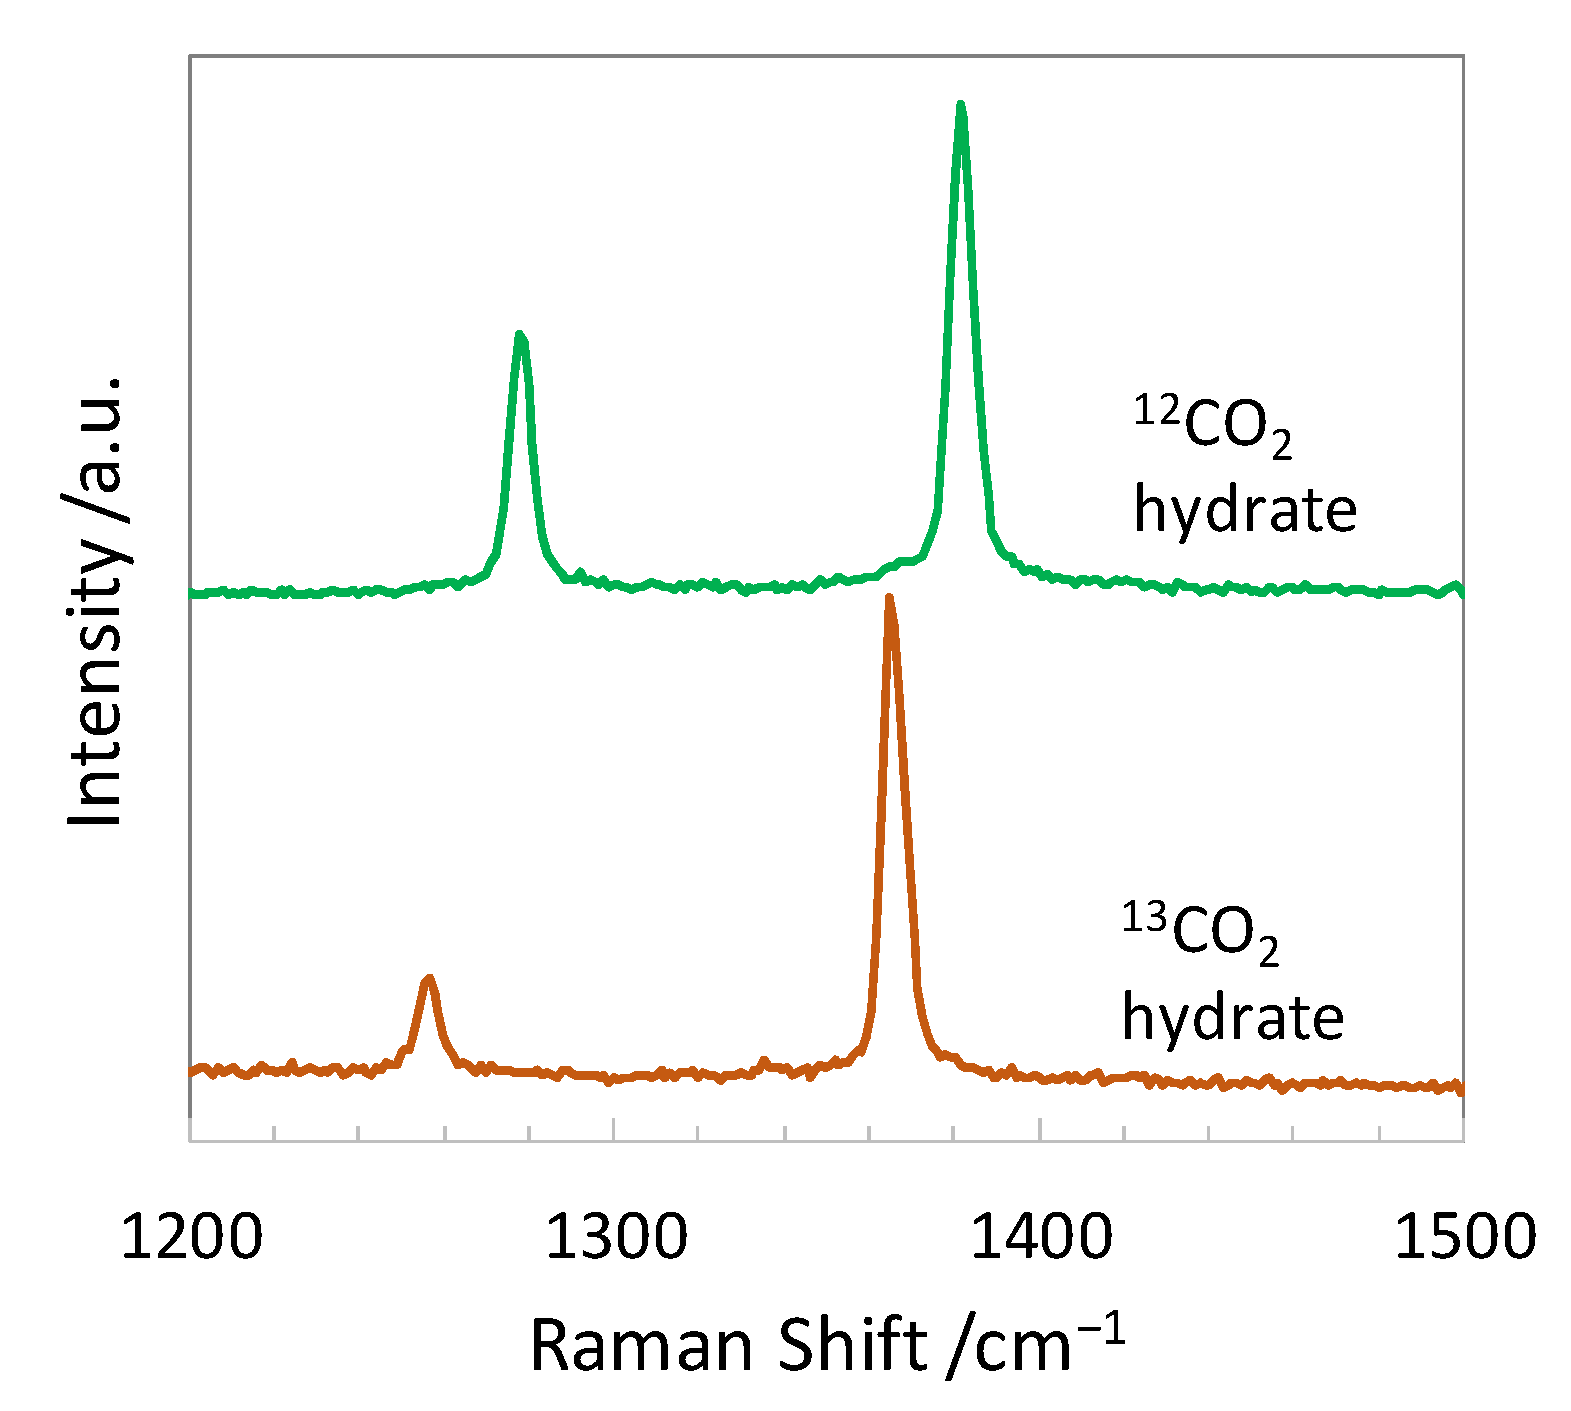
| Guest Molecule | Raman Shift Gas/cm−1 | Raman Shift Hydrate/cm−1 | Assign | Vibrational Mode |
|---|---|---|---|---|
| 12CO2 | 1285.40 [22] | 1278.2 a, 1277 [19], 1278 [20], 1275.5 ± 0.8 [21] | υ1 + 2υ2 b | CO s-stretch + bend b |
| 1388.15 [22] | 1381.9 a, 1381 [19], 1382 [20], 1379.4 ± 0.8 [21] | |||
| 13CO2 | 1266.03 [22] | 1256.4 a | ||
| 1369.90 [22] | 1365.8 a, 1366.6 ± 4.0 [21] |
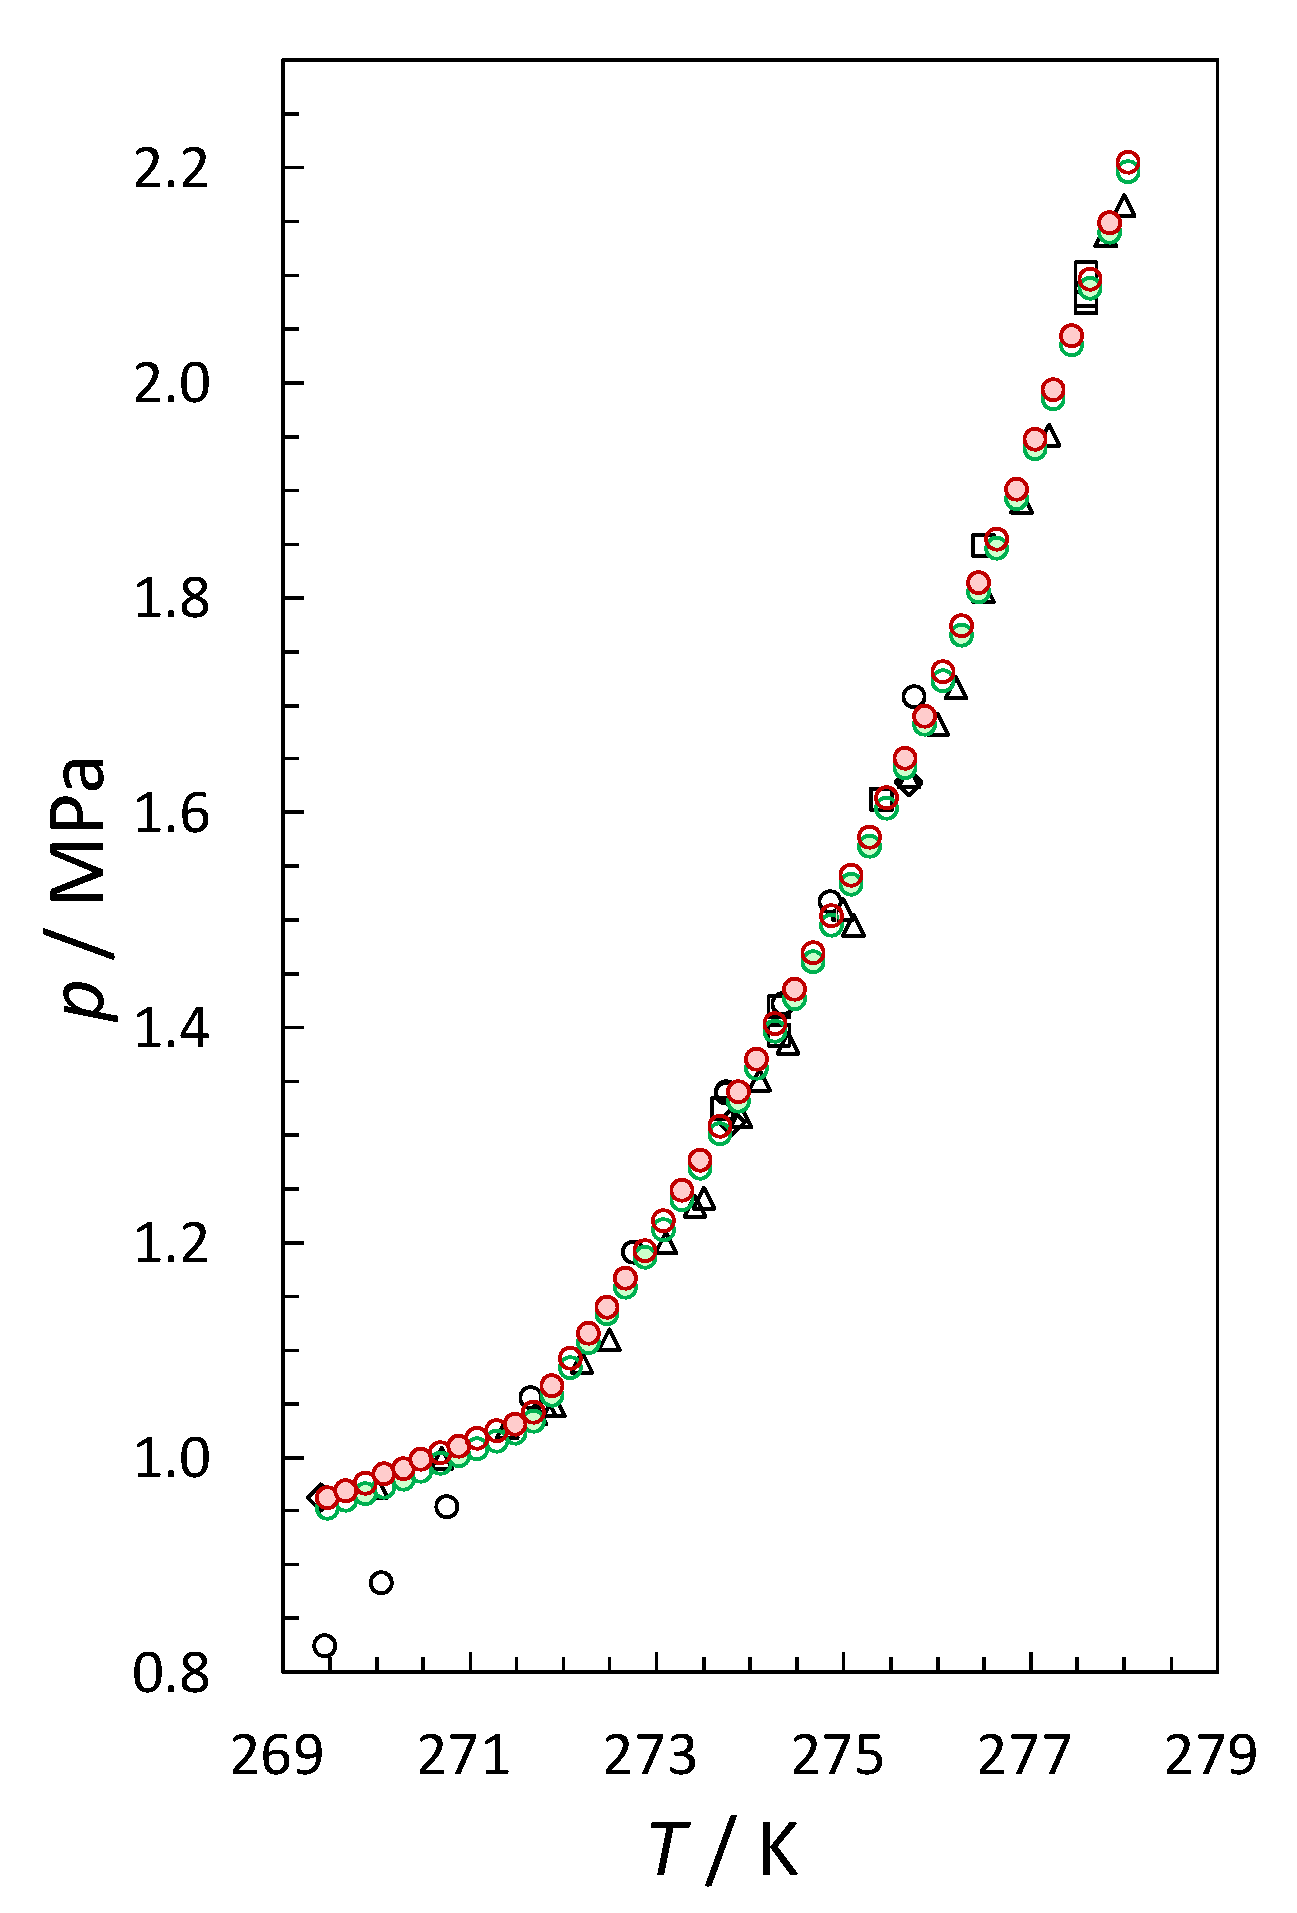
| T/K | p12CO2–H2O/MPa | p13CO2–H2O/MPa | Phase in Equilibrium |
|---|---|---|---|
| 269.47 | 0.953 | 0.963 | ice + hydrate + vapor |
| 269.67 | 0.960 | 0.969 | ice + hydrate + vapor |
| 269.88 | 0.967 | 0.977 | ice + hydrate + vapor |
| 270.08 | 0.973 | 0.984 | ice + hydrate + vapor |
| 270.28 | 0.980 | 0.990 | ice + hydrate + vapor |
| 270.47 | 0.987 | 0.999 | ice + hydrate + vapor |
| 270.67 | 0.994 | 1.004 | ice + hydrate + vapor |
| 270.88 | 1.002 | 1.011 | ice + hydrate + vapor |
| 271.08 | 1.009 | 1.018 | ice + hydrate + vapor |
| 271.28 | 1.016 | 1.025 | ice + hydrate + vapor |
| 271.48 | 1.023 | 1.031 | ice + hydrate + vapor |
| 271.67 | 1.034 | 1.043 | water + hydrate + vapor |
| 271.88 | 1.058 | 1.067 | water + hydrate + vapor |
| 272.08 | 1.083 | 1.092 | water + hydrate + vapor |
| 272.28 | 1.109 | 1.118 | water + hydrate + vapor |
| 272.46 | 1.133 | 1.142 | water + hydrate + vapor |
| 272.66 | 1.159 | 1.168 | water + hydrate + vapor |
| 272.86 | 1.185 | 1.195 | water + hydrate + vapor |
| 273.05 | 1.212 | 1.223 | water + hydrate + vapor |
| 273.25 | 1.240 | 1.251 | water + hydrate + vapor |
| 273.45 | 1.270 | 1.280 | water + hydrate + vapor |
| 273.66 | 1.302 | 1.312 | water + hydrate + vapor |
| 273.85 | 1.333 | 1.342 | water + hydrate + vapor |
| 274.05 | 1.365 | 1.376 | water + hydrate + vapor |
| 274.26 | 1.397 | 1.408 | water + hydrate + vapor |
| 274.47 | 1.427 | 1.435 | water + hydrate + vapor |
| 274.67 | 1.461 | 1.469 | water + hydrate + vapor |
| 274.87 | 1.496 | 1.504 | water + hydrate + vapor |
| 275.07 | 1.534 | 1.542 | water + hydrate + vapor |
| 275.27 | 1.569 | 1.578 | water + hydrate + vapor |
| 275.46 | 1.605 | 1.614 | water + hydrate + vapor |
| 275.66 | 1.642 | 1.651 | water + hydrate + vapor |
| 275.86 | 1.682 | 1.690 | water + hydrate + vapor |
| 276.06 | 1.723 | 1.732 | water + hydrate + vapor |
| 276.26 | 1.766 | 1.774 | water + hydrate + vapor |
| 276.44 | 1.806 | 1.814 | water + hydrate + vapor |
| 276.64 | 1.846 | 1.855 | water + hydrate + vapor |
| 276.85 | 1.893 | 1.901 | water + hydrate + vapor |
| 277.04 | 1.939 | 1.948 | water + hydrate + vapor |
| 277.24 | 1.985 | 1.994 | water + hydrate + vapor |
| 277.43 | 2.035 | 2.044 | water + hydrate + vapor |
| 277.64 | 2.088 | 2.097 | water + hydrate + vapor |
| 277.84 | 2.140 | 2.149 | water + hydrate + vapor |
| 278.05 | 2.196 | 2.205 | water + hydrate + vapor |
Publisher’s Note: MDPI stays neutral with regard to jurisdictional claims in published maps and institutional affiliations. |
© 2021 by the authors. Licensee MDPI, Basel, Switzerland. This article is an open access article distributed under the terms and conditions of the Creative Commons Attribution (CC BY) license (https://creativecommons.org/licenses/by/4.0/).
Share and Cite
Kimura, H.; Fuseya, G.; Takeya, S.; Hachikubo, A. Carbon Isotope Fractionation during the Formation of CO2 Hydrate and Equilibrium Pressures of 12CO2 and 13CO2 Hydrates. Molecules 2021, 26, 4215. https://doi.org/10.3390/molecules26144215
Kimura H, Fuseya G, Takeya S, Hachikubo A. Carbon Isotope Fractionation during the Formation of CO2 Hydrate and Equilibrium Pressures of 12CO2 and 13CO2 Hydrates. Molecules. 2021; 26(14):4215. https://doi.org/10.3390/molecules26144215
Chicago/Turabian StyleKimura, Hiromi, Go Fuseya, Satoshi Takeya, and Akihiro Hachikubo. 2021. "Carbon Isotope Fractionation during the Formation of CO2 Hydrate and Equilibrium Pressures of 12CO2 and 13CO2 Hydrates" Molecules 26, no. 14: 4215. https://doi.org/10.3390/molecules26144215
APA StyleKimura, H., Fuseya, G., Takeya, S., & Hachikubo, A. (2021). Carbon Isotope Fractionation during the Formation of CO2 Hydrate and Equilibrium Pressures of 12CO2 and 13CO2 Hydrates. Molecules, 26(14), 4215. https://doi.org/10.3390/molecules26144215