Article

Chemical Characteristics of Croatian Traditional Istarski pršut (PDO) Produced from Two Different Pig Genotypes

1
Department of Food Technology, Marko Marulic Polytehnic in Knin, Kralja Petra Krešimira 30, 22300 Knin, Croatia
2
Andrija Stampar Teaching Institute of Public Health, Mirogojska 16, 10000 Zagreb, Croatia
3
Faculty of Food Technology and Biotechnology, University of Zagreb, Pierottijeva 6, 10000 Zagreb, Croatia
4
Ministry of Agriculture, Ul. grada Vukovara 78, 10000 Zagreb, Croatia
5
Department of Nursing, University North, Trg dr. Žarka Dolinara 1, 48000 Koprivnica, Croatia
*
Author to whom correspondence should be addressed.
Molecules 2021, 26(14), 4140; https://doi.org/10.3390/molecules26144140
Submission received: 21 May 2021 / Revised: 1 July 2021 / Accepted: 5 July 2021 / Published: 7 July 2021
(This article belongs to the Section Applied Chemistry)

Abstract

:
Chemical characteristics of raw and processed Istarski pršut (PDO) produced from two different pig genotypes were studied with special emphasis on amino and fatty acid composition and factors of lipid stability. Raw hams of Large White (LW)xLandrace (L), and (LWxL)xDuroc (D) pig genotypes were used in the study (20 hams of each genotype). All left raw hams from each carcass were processed in accordance with the PDO specification of Istarski pršut, and other half (the right ones) of LWxL)xD genotype were used for analyses of raw hams (fresh muscles). Istarski pršut was evaluated on the basis of the chemical parameters of the raw and matured lean ham. The process of dry curing significantly influenced the chemical properties of Istarski pršut. Despite the higher content of intramuscular fat and polyunsaturated fatty acids, the fat of (LWxL)xD ham was much more resistant to hydrolysis and oxidation, suggesting that fatty acid profile and other factors, also play a significant role. Significant differences between pig genotypes in the amino acid and fatty acid profiles were found. The analyzed Istarski pršut may be distinguished by prints of multivariate chemometric statistical analysis, based on their amino acid and fatty acid compositions.

1. Introduction

Due to their specific quality and organoleptic characteristics, four types of Croatian dry-cured ham (Istarski, Krčki, Dalmatinski and Drniški pršut) have been legally recognized as an exceptional contribution to the gastronomic culture of European Union and marked with the labels of Protected Designation of Origin (PDO) and Protected Geographical Indications (PGI). Among them, only Istarski pršut is marked with the PDO label, and its production from the beginning to the end of the process (including pig rearing) takes place in a geographical area defined by the PDO specification. Istarski pršut is a highly appreciated dry-cured ham, especially in Croatia and other regional countries, therefore the PDO label guarantees its specific quality and attributes expected by consumers. Compared with the other three types of hams mentioned, Istarski pršut is produced from pigs with a live weight over 160 kg. The hams are processed with pelvic bones and without skin and subcutaneous fat. Spices are used in the dry salting process, and the drying process is carried out without smoking [1]. The PDO specification of Istarski pršut also regulates the rearing of the animals. Only gilts and barrows (to avoid boar taint) of modern pig genotypes are allowed, except Pietrain (to avoid pale, soft and exudative–PSE meat). Animals must be at least 9 months old before slaughter.
It is well known that a variety of factors affect the final quality of dry-cured ham, but all of them are related to the characteristics of raw ham or processing technology. If the processing technology is standardized (as in the case of PDO products), the quality of the final dry-cured hams is primarily determined by the quality of the raw ham [2]. The quality of the raw ham depends mainly on factors related to the pig (breed, genes, sex, age, weight, diet) as well as on the pre/post-slaughter treatment (loading, transport, stunning, bleeding, dehairing, scalding, cooling) [2].
It is generally accepted that the meat of highly muscled pig genotypes, such as Pietrain (but also Belgian Landrace) are less suitable for the production of dry-cured ham due to the lower meat quality [3]. Hogs susceptible to porcine stress syndrome often develop post-mortem PSE meat, which is manifested by abnormally pale color, soft texture, and extremely low water- holding capacity of the meat. Low carcass fat content, particularly intramuscular fat (IMF) is also a common feature of meat from highly muscled swine genotypes. A large number of studies have reported a negative effect of PSE meat and a positive effect of IMF content on sensory characteristics of dry-cured meat products such as marbling, flavor, juiciness and tenderness [2,4,5,6,7,8,9]. The influence of pig genotype on the quality of raw ham destined for dry-cured ham production has also been widely studied [10,11]. Among the different pig genotypes that have been used to obtain the best quality of raw hams, the Duroc breed and especially its crossbreds frequently meet both muscle and fat quality criteria for dry-cured ham processing [2,12,13,14]. In addition, genes associated with the fatty acid composition and other important pork quality indicators in Duroc pigs have been recently identified and validated [15,16]. Although numerous studies have been conducted on the influence of genotype and, in particular, Duroc breed on the quality of different types of dry-cured ham, especially on its chemical profiles, only a few have been conducted on Istarski pršut [17,18]. Moreover, few studies have been published on the free amino acid content of Istarski pršut independent of the genotype effect [19,20], and there are no available data on the composition of total amino acids (free and peptide-bound) of Istarski pršut.
Lipids are responsible for many desirable properties (contributing to the improvement of taste, tenderness and juiciness) of meat and meat products [21]. However, they are also among the most chemically unstable components of meat, and are prone to degradation; especially in the processes of their hydrolysis and oxidation. Most authors recognize that the accumulation of free fatty acids (rich in unsaturated FAs) in the processes of lipid hydrolysis promotes their oxidation [22,23,24]. However, some consider that these two processes are independent or even that some free FAs have antioxidant properties and long-chain free FAs “protect” against oxidation [25]. In general, the oxidation processes can cause a non-microbial quality deterioration of meat and meat products, and their products have negative effects on the quality of meat and meat products [26,27]. However, in the case of dry-cured meat products, they also play an important role in the development of the typical flavor of the product, which is highly appreciated by consumers [28]. The profile and ratio of chemical compounds formed by lipid oxidation depends largely on the lipid profile of the animals (which depends on genotype, sex, age, fatness, weight, diet etc.), but also on other numerous post-mortem factors such as: processing methods, storage conditions, type of ingredient, and presence and concentrations of pro- or antioxidants [29]. All these numerous ante- and post-mortem factors affect the chemical profile of raw and processed meat. Although lipid oxidation has been intensively studied for decades, the mechanisms of lipid oxidation are not fully understood due to the complex reactions involved in this process and the different pathways and factors that influence it [30].
As the technology of Istarski pršut is very specific and unique compared to all other types of dry-cured ham around the world [17] (e.g., final trimming of raw ham without skin and subcutaneous fat tissue, specificities in the use of spices etc.), it is expected that the chemical profile of matured Istarski pršut will be significantly different from other ham varieties, regardless of the genotype of the pig. Because of these differences in processing technology, the influence of the Duroc breed on the chemical profile of Istarski pršut could be significantly different from that of other types of dry-cured ham.
Consequently, the aim of this study was to determine the differences between two pig genotypes often used in the production of Croatian dry-cured ham types, in chemical properties of Istarski pršut, such as chemical proximate composition, amino acid (AA) and fatty acid (FA) composition, as well as the influence of processing technology on the FA profile of mature hams. Particular emphases are placed on the FA composition of both raw and mature ham, and its influence on the level of lipolysis (acid value) and lipid oxidation (peroxide value and TBARS test) of Istarski pršut of both pig genotypes.

2. Results and Discussion

2.1. Chemical Properties

Proximate chemical analysis, NaCl content and pH of raw and matured ham are shown in Table 1.
In agreement with similar studies of other dry-cured hams [31,32], the influence of processing on the basic-chemical properties of Istarski pršut in this study was shown by a decrease in water content and an increase of dry matter content (proteins, IMF and NaCl) as well as an increase in pH, as expected [2]. Other authors, [33] stated that Istarski pršut has the following contents: water 37.9 to 41.0%, proteins 32.4 to 43.1%, fat 13.5 to 17.0% and NaCl 6.3 to 7.4%, and most of the results of this study fit into the indicated ranges, except for NaCl content which was higher (8.44%).
The differences between pig genotypes in chemical composition and NaCl content, as well as pH and weight loss during processing of Istarski pršut is presented in Table 2. All observed indicators, except protein content and pH, were strongly influenced by the genotypes (p < 0.01; p < 0.001) which is contrary to some authors [17,34], but also in agreement with others [35,36,37].
As expected, a significant influence of Duroc genotype on IMF content was found, which has long been considered one of the breed traits of Duroc [38] and has been confirmed by many authors [2,9,37,39,40]. Apart from the possible influence of Duroc genotype, the high content of IMF in (LWxL)xD of raw ham is certainly a consequence of the prolonged fattening [41] and the much higher final weights of the pigs [42].
Since IMF impedes dehydration, the higher water content and lower salt content in the (LWxL)xD hams could be due to the higher IMF content. The protein content in dry-cured ham depends on the degree of dryness and fat content [43].
In contrast to authors who found significantly lower weight loss of dry-cured ham of the Duroc genotype [39], these differences between the LWxL and (LWxL)xD hams were not significant (p > 0.05). In general, the weight loss of Istarski pršut determined in this study agrees with some studies that also found a weight loss of more than 40% [17,20]. The significantly higher weight loss of Istarski pršut compared to most other types of Mediterranean dry-cured hams is due to the unique shape of the ham with pelvic bones and without skin and subcutaneous fat, which exposes a larger surface area of the muscle tissue of the leg to drying [17,20]. Moreover, a significant difference in the weight loss of Istarski pršut was found between Pietrene and Duroc genotypes, but not between the Landrace and Duroc genotypes [17], which is consistent with the results of this study.

2.2. Amino Acid Composition

The composition of total amino acids (AA) of Istarski pršut is shown in Table 3. A total of 37.04 g AA/100 g sample was determined, of which the 9 essential (EAA) and 8 non-essential AA (NEAAs). Since the average amount of EAA and NEAA, regardless of genotype, was 18.29 and 18.75 g/100 g sample respectively (EAA/NEAA = 0.98), it can be said that dry-cured ham is an excellent source of biologically high-quality proteins, as it contains essential amino acids in appropriate ratios [44]. According to Zuo et al. [45], Chinese traditional dry-cured Jinhua ham has a slightly different AA profile; it contains a total of 27.67 mg AA/mL, of which the 16.20 mg/mL of EAA and 11.85 mg/mL of NEAA (EAA/NEAA = 1.37).
The differences between the genotypes in total AA, calculated per amount of sample, were not significant (p > 0.05), but calculated per amount of total proteins, they were significant (p < 0.01). The differences were significant only on NEAAs such as proline (p < 0.01), glycine (p < 0.05) and cysteine (p < 0.001) when calculated per amount of sample, but they were much larger when calculated per amount of total proteins. All EAAs, except of threonine, and five NEAAs (glutamic acid, proline, glycine, cysteine and tyrosine) differed significantly between genotypes (all of EAAs, except arginine, were higher in LWxL; all of NEAAs, except tyrosine, were higher in (LWxL)xD genotype). Consequently, the EAA/NEAA ratio was significantly lower in the (LWxL)xD genotype (p < 0.001). Since the content of free AAs is an indicator of proteolysis and increases with the progress of ham processing [5], much research has been conducted on their content in dry-cured ham, but not so much in total (free and peptide-bound) amino acids [45].

2.3. Fatty Acid Composition

The influence of processing technology on the FA composition of Istarski pršut is presented in Table 4, from which the considerable changes in FA composition of raw vs. matured ham, are visible.
One of the key changes in the ham tissues (beside dehydration, salt intake and proteolysis) affected by the dry-curing process, is lipid degradation (lipolysis) under the influence of lipolytic enzymes [2]. Many studies have shown those effects [32,46,47,48,49]. According to the results of this study, monounsaturated (MUFA) and saturated (SFA) fatty acids, were the main FAs found in the IMF of both, raw and matured ham (mostly due to oleic and palmitic FA contents). Together, they represent 93.44 % of total FAs in raw and 85.11 % in matured ham. Those results are close to the results of other studies [41,50,51]. Further, in raw and matured ham, a different number of FAs, 11 vs. 26, respectively were detected. Between the investigated groups, the differences of all FAs, except stearic (18:0), were significant (mostly p < 0.001), so myristic (14:0), palmitic (16:0), palmitoleic (16:1), oleic (18:1ω-9c), arachidonic (20:0; not detected in matured ham) and γ-linolenic acid (18:3ω-6), and SFA, MUFA and ω-9 as well, were higher in raw ham (p < 0.001). On the contrary, polyunsaturated (PUFA) were higher in raw ham (p < 0.001), and SFA and MUFA were higher in matured ham (p < 0.01 and p < 0.001, respectively). The ω-6 were found only in matured ham, while the content of ω-3 were significantly higher in the matured ham than in the raw ham (p < 0.001). For comparison, one study reported different results for Toscano ham. After 16 months of processing, they reported significant decrease of myristic (14:0), palmitic (16:0), palmitoleic (16:1), oleic (18:1ω-9) and cis-vaccenic (18:1ω-7) acid, and significant increase of arachidonic (20:4ω-6) acid [50]. They also reported a significant decrease of SFA and MUFA, and a significant increase in the ratio of ω-6/ω-3, but after 18 months of processing, they were no longer significantly different from raw ham. However, according to the results of Larrea et al. [52], PUFA, ω-3 and ω-6 increased in neutral (the most abundant) lipid fraction of matured Teruel ham, while in total lipids they were significantly lower in mature compared the raw Teruel ham, but they were decreased up to half of the process, after which they were gradually increased until the end of the process.
Many researchers reported significant impact of the length of processing on decrease of FAs in the neutral (triacylglycerols) and polar (phospholipids) lipid fractions of the IMF lipids, and their increase in the free FA fraction [47,50,53]. In the free FA fraction, particularly the MUFAs increase along the dry-curing process [51], although, besides the length of processing, the processing methods’ differences also have a significant impact [54]. Since the free FAs are prone to oxidation and reactions with other compounds, their quantity and ratio change at some ham ripening stage.
The differences between two pig genotypes in the FA profile of Istarski pršut are presented in Table 5.
The differences in FA composition of various dry-cured ham types are mainly the consequence of the pigs’ genetic features and differences in the rearing/feeding system. Recent research identified quantitative trait loci on swine chromosomes associated with stearic, oleic and SFA in Duroc breed [15]. Since the same feeding system was applied in both genetic groups of this study, the differences presented in Table 5 can be considered to be mainly the result of differences in the pig genotype [55,56]. The differences were significant for 17 of 27 FAs detected; and the most represented oleic (18:1ω-9c) were significantly higher in LWxL hams; stearic (18:0) and linoleic (18:2ω-6) acids were significantly higher in the (LWxL)xD hams, while the palmitic (16:0) was similar in both genotypes. On the contrary, Božac et al. [17] found no significant influence of Duroc genotype on the FA profile of Istarski pršut, except for higher content of myristic (14:0) acid. However, most studies found a significant effect of Duroc genotype on FA profile of dry-cured ham [8,14,18,47,56,57].

2.4. Lipolysis and Lipid Oxidation Indicators
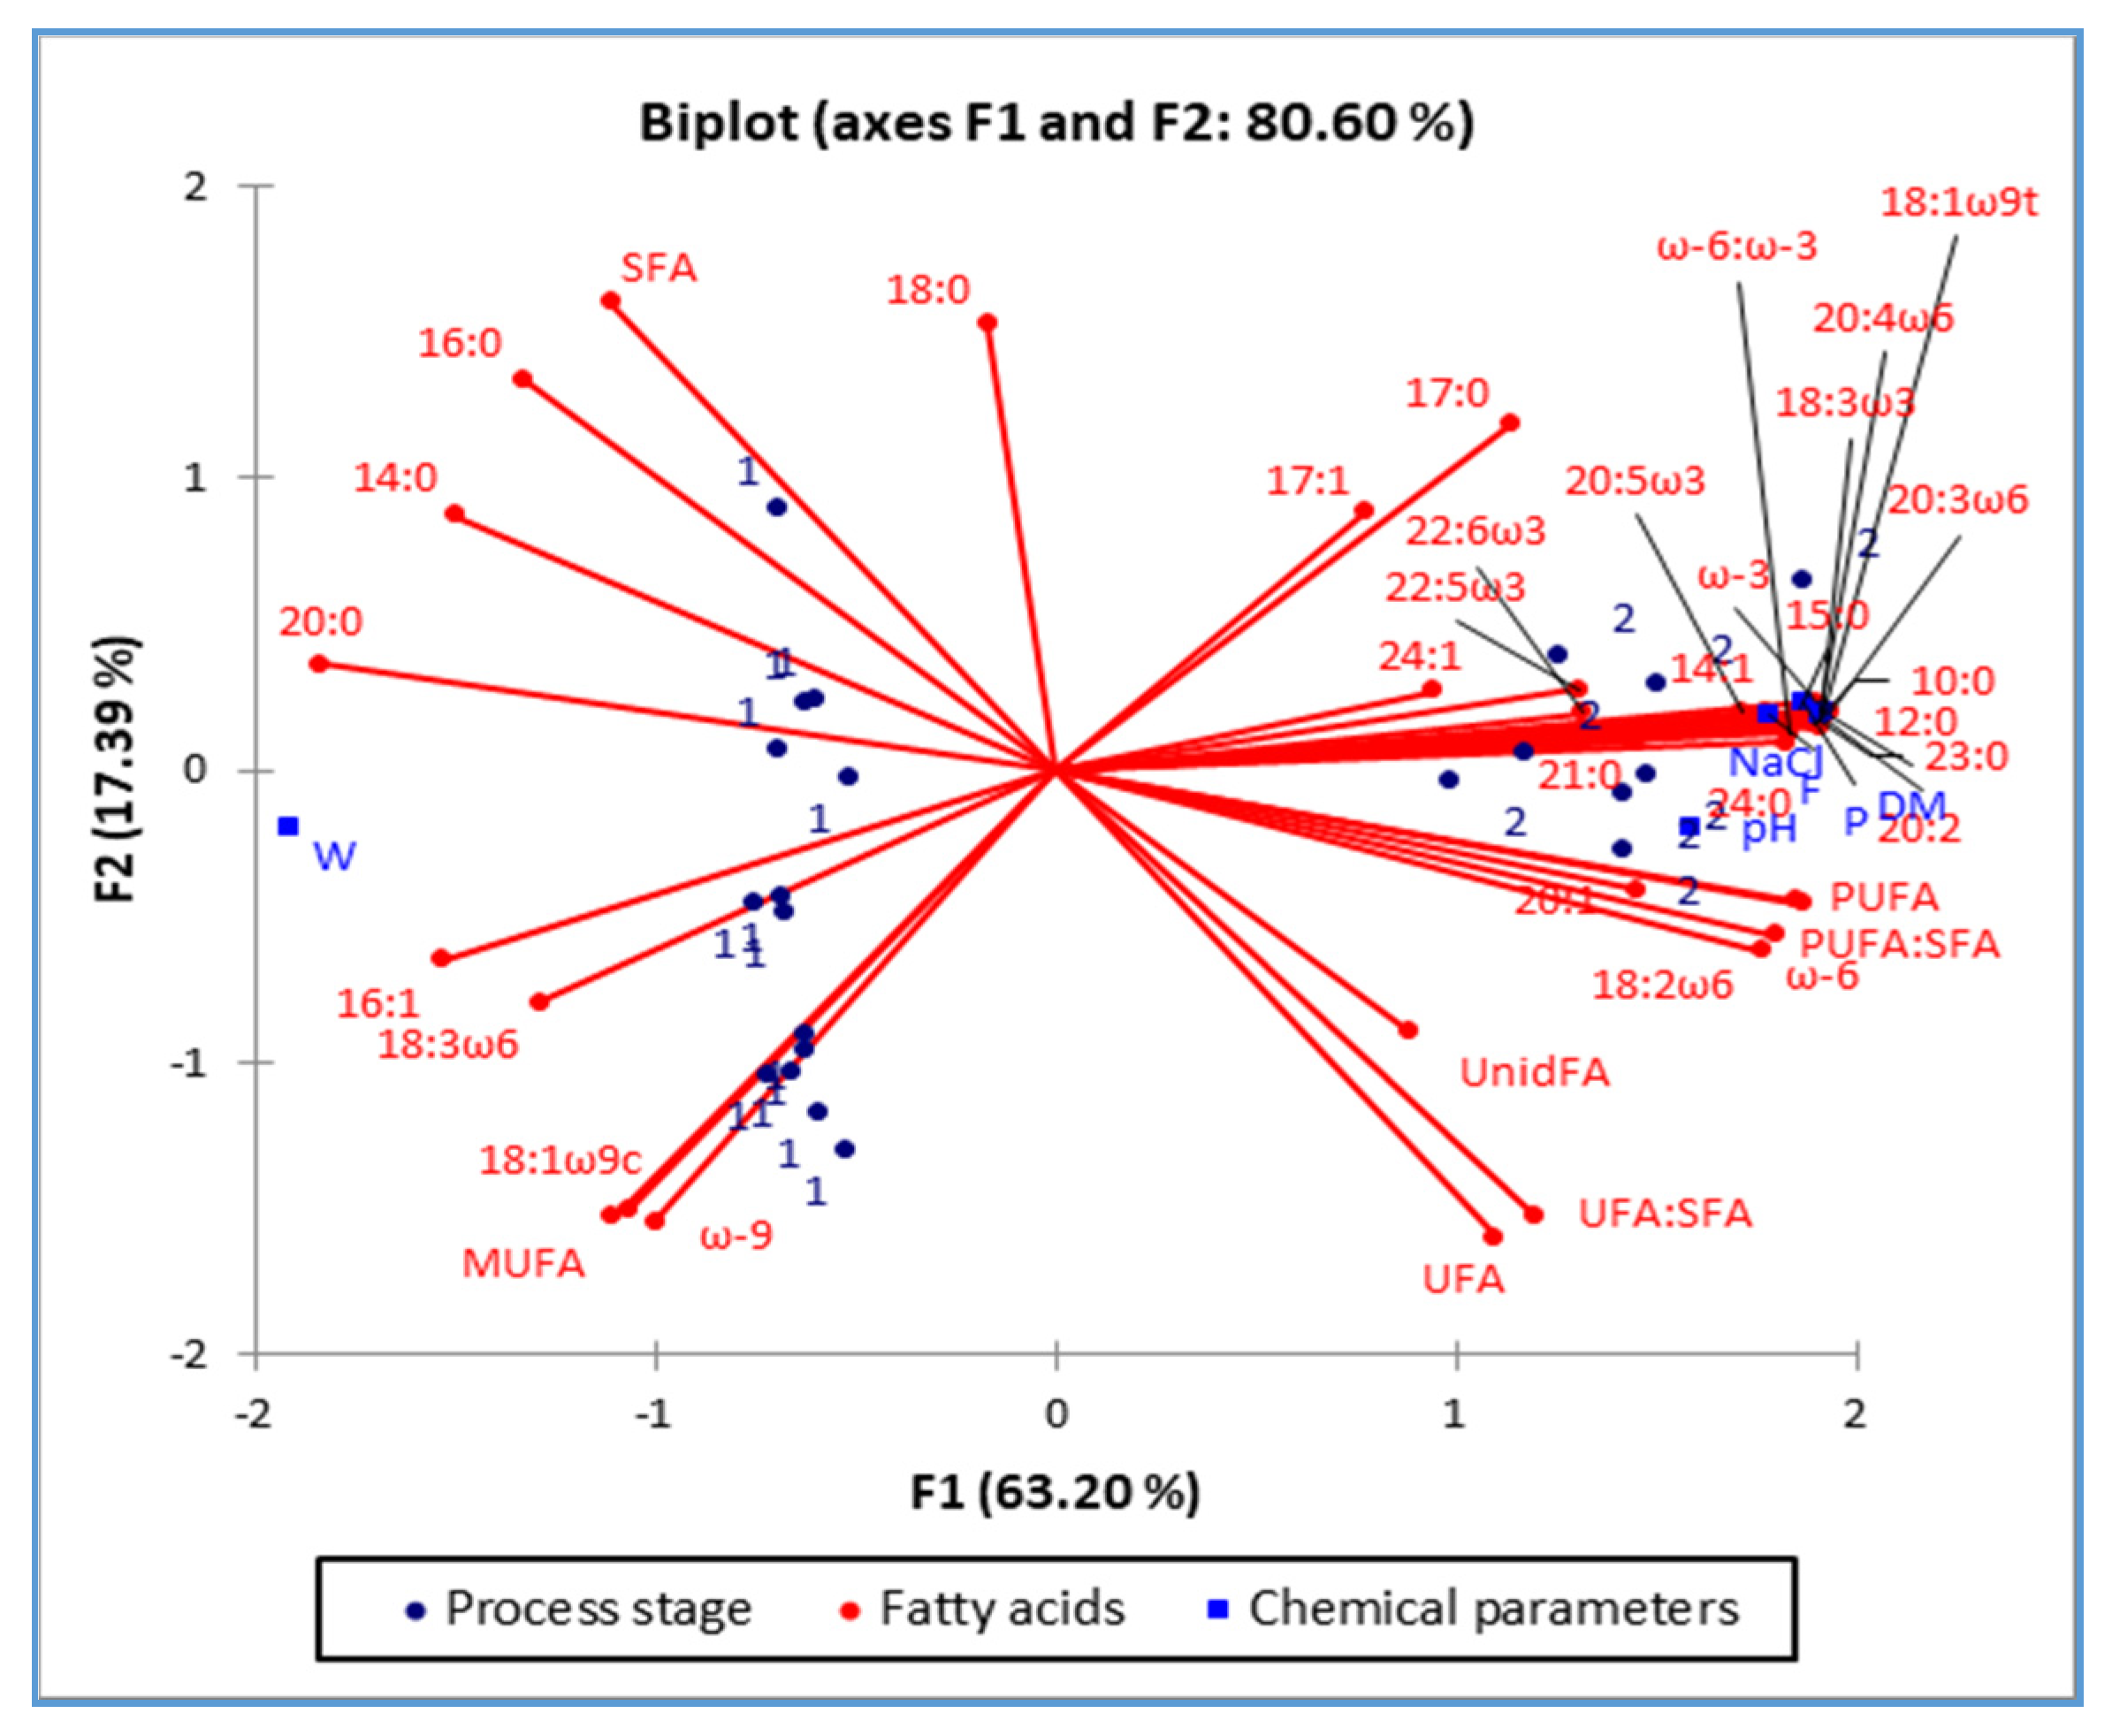
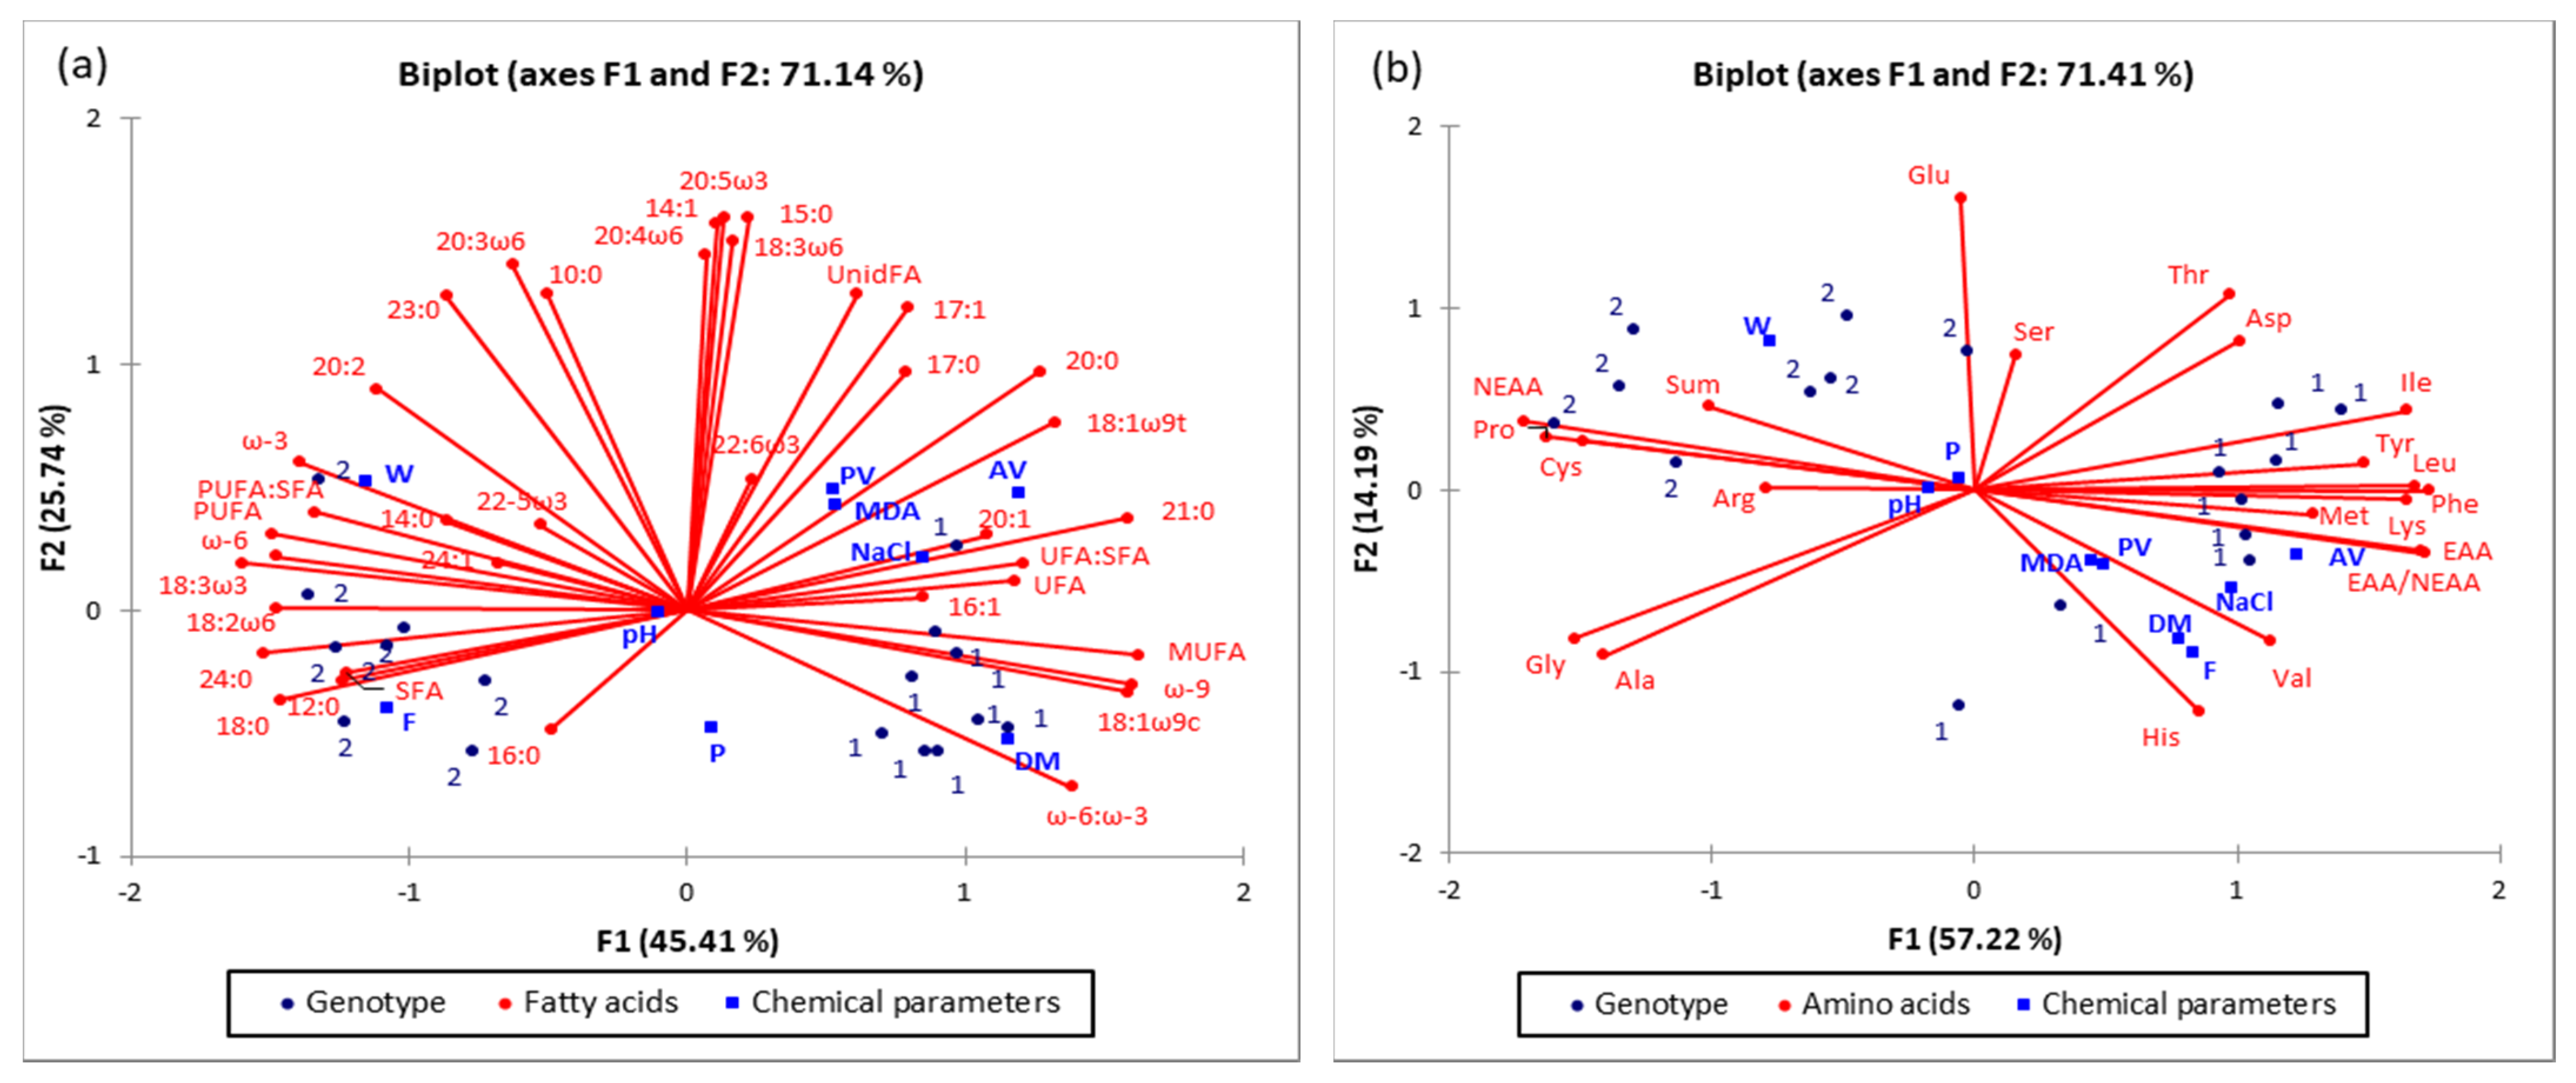
The acid value (an indicator of the content of free FA), and peroxide value and TBARS assay (indicators of primary and secondary lipid oxidation) of Istarski pršut are presented in Table 6.
As can be seen, all the indicators were significantly different between the genotypes. According to the obtained results, despite the significantly higher IMF and PUFA in Duroc genotype, the IMF were much more resistant to hydrolysis and oxidation. This could be explained by the different influence of individual fatty acids (in total and free FA fraction) on fat stability, but probably the enzyme activities (mostly endogenous lipases and phospholipases) play an important role. The significantly lower peroxide value and TBARS in Duroc genotype could be explained with significantly lower acid value because, in general, fatty acids have been shown to oxidize faster in the free form than their glyceryl esters [24,29], not because of the length of their chains, but because of the number of bis-allylic positions, which cause the lipid peroxidation, to increase exponentially [58]. According to Cava et al. [51], free FA fraction largely increased throughout the ham ripening, and with it at the same time, the content of MUFAs largely increased from 34.7% to 40.9%, and PUFAs largely decreased from 45.1% to 20.5%, and SFAs increased from 28.3% to 38.6%. Also, some authors strongly suggest that the hydrolysis of phospholipids (which are composed of much more PUFA than triacylglycerols) during processing “protect” the long-chain PUFAs from oxidation, although the exact mechanism remains unknown [25,59]. Those reports could go towards explaining the results of this study. The higher content of NaCl in LWxL genotype could also be one of the promoters of lipolysis [53]. To better understand factors of lipolysis and fat oxidation, a correlation was made between FAs, IMF and NaCl contents and indicators of fat stability (Table 7). The results from Table 7 indicate, the higher the IMF content, the higher the content of stearic (18:0), linoleic (18:2ω-6), α-linolenic (18:3ω-3) and tetracosanoic acid (24:0), and the lower the content of elaidic (18:1ω-9t), arachidic (20:0), arachidonic (20:4ω-6) and heneicosanoic acid (20:0).
According to Ruiz et al. [6], the IMF content positively influenced the content of oleic acid (18:1ω-9c) and exhibited a negative relationship with linoleic (18:2ω-6) and arachidonic (20:4ω-6) acid. These authors explain that as the IMF increases, triacylglycerols which contain more oleic acid increase too; and because the content of phospholipid fraction which contains more PUFA is stable, the content of PUFA in total IMF relatively decreases. However, those results are in accordance with this study only regarding the linoleic (R = −0.51; p < 0.05) and arachidonic acid (R = −0.60; p < 0.01), since IMF content has not affected the content of oleic acid and neither the PUFA (Table 7). Further, the higher the content of IMF, the lower the contents of UnidFA, MUFA, ω-9 and NaCl (Table 7). Since higher content of NaCl has not affected the AV nor PV and TBARS; increased content of NaCl was not shown as a promoter of lipolysis and lipid oxidation. Most research points to salt as a promoter of lipolysis and oxidation [53,60,61,62], but there are those who do not find such an influence [63,64].
The higher AV and PV were positively associated with the contents of 10-heptadecanoic (17:1), eicosanoic (20:0) and heneicosanoic (21:0) acid and negatively with the content of stearic acid (18:0). The higher the stearic acid content, the more stable the fat was, since AV and PV were significantly lower (p < 0.001 and p < 0.05, respectively) and the correlation with TBARS values was also very close to the statistical significance (R = 0.40). However, only the content of two FAs affected TBARS, palmitoleic acid (16:1) positively, and tetracosanoic acid (24:0) negatively. The higher the contents of SFA and PUFA, the lower the AV (p < 0.01), but not the PV and TBARS. In addition, the higher the contents of MUFA and UFA, the higher the AV (p < 0.001 and p < 0.01, respectively), but not the PV and TBARS. Also, the TBARS and PV were in highly positive correlation (R = 0.95; p < 0.001).
Additionally, the correlation between the lipolysis/lipid oxidation indicators, within the (LWxL)xD genotype were highly positive between PV and AV (R = 0.87; p < 0.001) as well as PV and TBARS (R = 0.94; p < 0.001), while within the LWxL genotype were highly positive only between PV and TBARS (R = 0.95; p < 0.001).

2.5. PCA Analysis

The score plots of the Principal component analysis are presented in Figure 1 and Figure 2. Figure 1 shows the grouping and changes in the FA profile of the raw and matured ham, while Figure 2 shows differences in the FA (Figure 2a) and AA profiles (Figure 2b) of two different genotypes of matured ham.
The application of multivariate analysis in meat science, especially for pork meat, becomes an indispensable tool in the scientific investigation. For example, some authors related the elemental composition of pork meat from conventional and animal welfare farms by inductively coupled plasma-optical emission spectrometry (ICP-OES) and ICP-mass spectrometry (ICP-MS) and their authentication via multivariate chemometric analysis [65], while others used multivariate tools in investigating authentication of organic pork and identification of geographical origins of pork in four regions of China by combined analysis of stable isotopes and multi-elements [66]. In this study, multivariate tool, the PCA was used to identify which fatty acid (FA) or amino acid (AA) dominates in different genotypes of pork used in processing of Istarski pršut, as well as to investigate FAs and AAs in hams from two different process stages (raw and matured).
Score plots (Figure 1 and Figure 2) give an insight into a system in which a significant number of variables were observed simultaneously. So, the processing influence on the FA composition of the raw ham is presented in Figure 1. First two principal components (PC1 & PC2) explain 80.6% of the variability of all observed data. Also, it should be noted that the raw ham (Figure 1, marked as “1” and positioned in the 2nd and 3rd quadrant) has a significantly higher content of water (which is seen by occupying the left part of the plot). In the left part of the plot are also positioned FAs which had not changed significantly during the processing (and those FAs are: 14:0; 16:0; 16:1; 18:0; 20:0; SFA; MUFA; ω-9; 18:3ω6 and 18:3ω9c).
By observing of two genotypes of ham, it was found that the first two PCs contributed with 71.41%, regardless if FAs (Figure 2a) or AAs (Figure 2b) are observed. Such high sum of the first two PCs indicates that over 71% of all interactions in the observed data set, can be explained based on the observed genotype, basic chemical composition & FA and AA contents. The investigated genotypes ((LWxL = 1 & (LWxL)xD = 2) were moved away and positioned into different quadrants. Ham of the LWxL genotype (1) is positioned in the right part of the chart, while the matured ham of the other observed genotype (2 = (LWxL)xD genotype) is positioned in the left part of the chart, for both observed concentrations of FAs and AAs. Such spreading in the Bi-plot and grouping based on the genotype indicates the qualitative differentiation of the samples (matured Istarski pršut produced from two different pork genotypes). Additional multivariate tools would be needed for quantitative prediction of certain FA and or AA if the genotype is known or vice versa. It is Figure 2a that shows that the content of Alanine (Ala), Glycine (Gly) will differ based on the observed genotype, but not significantly (they are positioned in the 3rd quadrant indicating no significant differences of Ala & Gly in the samples positioned in adjacent quadrants, such as genotype 2 (positioned in the 2nd quadrant) or the majority of genotype 1, positioned in 4th quadrant). However, position of AA as Arginine (Arg), Proline (Pro) and Cysteine (Cys), in the same quadrant where are grouped the hams of (LWxL)xD genotype, indicate that should be expected significantly different values regarding the observed genotype 2.
The PCA plots related to the values in Table 1, Table 2, Table 3, Table 4, Table 5 and Table 6 confirm the significance of the changes in the chemical properties of raw and matured ham (Table 1) and different pig genotypes (Table 2) with the AA composition of Istarski pršut, depending on genotype (Table 3), as well as the changes in FA composition, depending on processing (Table 4) and genotype (Table 5), and changes in indicators of lipolysis and lipid oxidation depending on genotype (Table 6). It can be assumed that PCA application cannot provide empirical results to quantify the effects or clarify variations between processing and genotypes like other statistical approaches. However, it helps to understand better and substantiate relationships between a variety of variables affecting meat quality by reducing the data and visualizing them using PCA.

3. Materials and Methods

3.1. Raw Ham Selection and Processing

Raw ham (purchased at the market) selection and shaping: The raw hams used in this study were obtained from the 20 pigs of two different genotypes (5 gilts and 5 barrows per genotype), raised in the same pen (same farm) under the same conditions and fed ad libitum with the same commercial feed. Genetic background of the animals (10 of each genotype) was as follows:
  • Genotype 1 (LWxL): ♀ Large White (LW) × ♂ Swedish Landrace (L) and
  • Genotype 2 (LWxL)xD: ♀ (LWxL) × ♂ Duroc (D).
The animals were 12 months old at slaughter when they reached an average live slaughter weight of 182.9 kg for genotype 1 and 186.3 kg for genotype 2. Average hot carcass weights were 151.2 kg and 154.4 kg, and killing out percentage were 82.64% and 82.89%, for genotype 1 and genotype 2, respectively. After slaughtering, in accordance with the industry-accepted procedure, the hams were removed from the carcasses according to the Istrian manner (PDO specification). The hams were separated between the last lumbal (v. lumbales) and first sacral vertebra (v. sacrales). The pelvic bones such as os ilium, os ischii and os pubis, were left in the ham and only the sacrum (os sacrum) and caudal vertebra (v. caudales) were removed. The leg was cut at the ankle (a. tarsi) so that in connection with the tibia and fibula remains the proximal row (talus and calcaneus) of the ankle bones. On the lateral and medial side of the ham, the skin and subcutaneous adipose tissue were removed to a height of 10–15 cm proximal to the ankle. The hams treated in this way are characteristically long and closed surfaces. After shaping the raw ham, weights of genotype 1 and genotype 2 were 14.58 kg and 14.91 kg, respectively. All left hams from each carcass were subjected to processing, and the right ones were used to take samples of raw ham (fresh muscles).
Ham processing (20 left hams): Immediately before salting, the hams were vigorously massaged by hand to remove residual blood, especially from the femoral artery (a. femoralis) and other visibly bloody areas. In the process of dry salting, hams were salted with a mixture of coarse and ground sea salt (in a 70:30 ratio) and spices (4.5% per kg of NaCl) such as ground black pepper, garlic and laurel. Salting was done by hand, firmly rubbing the dry-salt mixture (0.6–0.7 kg per ham) on the surface of the hams, after which they were left on the shelves for 21 days at a temperature of 2–5 °C. During the 21 days of salting period, the hams were rotated twice. After the salting phase, the hams were washed with cold water, to remove excess salt, and left to drain for 24 h. After draining, hams were rubbed with ground pepper and then subjected to the drying process. The drying process was carried out under natural climate conditions (the drying rooms were exposed to dominant winds) for 6 months at the temperature of 12–15 °C and relative humidity of 65–75%. After the salting and drying phases, when the hams lost about 35% of their initial weight, they were moved to the ripening phase for the next 9 months, under the stable microclimate at a temperature up to 18 °C and relative humidity of 70–75%.
After 15 months of processing, the mature hams of genotype 1 and genotype 2 were weighing 8.58 kg and 8.89 kg, respectively. At the beginning and the end of the process the pH of the m. semimembranosus was measured using the pH meter CPC-501 ELMETRON (ELMETRON ©, Zabrze, Poland) equipped with a combined puncture pH electrode, OSH 12-01.

3.2. Sampling

A longitudinal section from tuber ishiadicum to tuber calcanei of the hams, both raw and matured was made, and the samples (approximate 200 g in weight) composed mainly of m. semimembranosus, m. semitendinosus and m. bicep femoris muscles were taken (all visible fat and connective tissue from the samples were removed). Samples were individually vacuum packaged, coded, frozen and stored at −20 °C until analysis. By the end of the first week after freezing, both raw and matured samples were analyzed (to avoid chemical changes caused by storage). Before analysis, the samples were thawed for 24 h at 4 °C and homogenized.

3.3. Chemical Analyses

Proximate chemical analysis and fatty acid analysis were carried out on both raw and matured samples of lean ham. Determination of amino acids and lipolysis and lipid oxidation indicators were carried out only on matured samples of lean ham. Only the samples of raw and matured hams of (LWxL)xD genotype were used to assess the effect of processing on the proximate chemical composition and FA composition of Istarski pršut.
Moisture, fat and protein contents, as well as sodium chloride content were determined according to methods recommended by the AOAC [67]. Results were expressed as wt% of sample.
The AA content was determined according to Holló et al. [68] in an automatic amino acid analyzer (INGOS AAA 400, INGOS Ltd., Prague, Czech Republic) of the previously hydrolyzed proteins using reusable Pyrex hydrolysis tubes. In case of the AA containing sulfur performic acid, oxidation was made before hydrolysis according to Csapó et al. [69]. Samples are filtered and stored at −25 °C until the analysis by ion exchange column chromatography. The determination of amino acids was performed with post column derivatization by ninhydrin with photometric detection at 570 nm for all amino acids and 440 nm for proline. Results were expressed as g AA/100 g sample as well as g AA/100 g proteins.
Analysis of FA methyl esters was determined by gas chromatography according to ISO 12966-2 method [70]. Each sample’s fat was extracted using solvent petroleum ether (User Manual Soxtec System 2047 SoxCap) according to ISO 1443 method [71]. All lipid extracts were evaporated to dryness with nitrogen stream at 35 °C and stored at −18 °C until preparation of their fatty acid methyl esters (FAMEs). Lipids were transesterified under sequential alkali- and acid-catalyzed conditions by heating in methanol solution. After esterification, FAMEs were isolated by extraction with isooctane according to ISO 12966-2 method [70] and stored at −18 °C until chromatographic analysis. Separation and quantification of the FAMEs was carried out using a gas chromatograph, GC-Shimadzu, Model: GC-2010 Plus (Shimadzu Corporation, Duisburg, Germany) equipped with a flame ionization detector and an automatic sample injector AOC-5000 Shimadzu, and using an Agilent J & W DB 23-fused silica capillary column (60 m, 0.25 mm i.d., 0.25 μm film thickness). The chromatographic conditions were as follows: initial column temperature 60 °C held for 1 min, then increased at 7 °C/min to 215 °C and held 30 min. The injector and detector were maintained at 250 and 260 °C, respectively. Nitrogen was used as carrier gas at a constant flow-rate of 1.50 mL/min, with the column head pressure set at 179.9 kPa. The split ratio was 1:80 and 1 μL of the solution was injected. Individual FAMEs were identified by comparing their retention times with those of authenticated standards. Results are expressed as a percentage (%) of particular fatty acid on total fatty acids.
Acid value (AV), as an equivalent of the amount of free fatty acids, was used as an indicator of lipolysis. The acid value was determined according to ISO 660 method [72] and expressed as mg KOH/g fat.
Level of lipid oxidation was assessed by the determination of peroxide value (primary oxidation) and by the thiobarbituric acid assay (secondary oxidation). Peroxide value (PV) was determined according to the method recommended by AOAC [73], and expressed as meq/kg fat. Thiobarbituric acid (TBA) assay was conducted according to Lemon [74]. Absorbance at 538 nm was measured by a SPECORD 200 spectrophotometer (Analytic Jena AG, Germany). A calibration curve was developed using 0, 0.01, 0.02, 0.03, 0.04 and 0.05 μmol of malondialdehyde (MDA). TBARS values were expressed as mg of MDA equivalents/kg sample.
All the analyses were done in duplicate, except for AV, PV and TBARS, which were done in three replicates of each sample, and the average score for each sample was used for statistical analysis.

3.4. Statistical Analysis

Discriminant analysis and correlations were performed for all data collected. The categorial variables were the pork genotypes (coded as 1 (LWxL) & 2 (LWxL)xD), respectively. To determine the influence of pork genotype and processing on the scale factor of different factors and to create sample grouping, principal component analysis (PCA) was performed using XLSTAT 2016 software (Addinsoft, Paris, France). PCA was applied as a well-known technique for tracking and detecting similarities and/or differences in multivariate processes because it allows for the assessment of variability through dimensionality reduction. PCA was used to track overall process variability in amino-acid and fatty acid composition for two genotypes, as well as for the process stage.

4. Conclusions

From the obtained results, it can be concluded that most of the chemical properties of raw and matured Istarski pršut were significantly influenced by pig genotype and processing. The processing weight loss, and pH and protein content of Istarski pršut between the pig genotypes were not significantly different. On the contrary, the dry matter (content of water), intramuscular fat (IMF) and NaCl, and the profiles of AA and FA and lipolysis and the lipid stability of Istarski pršut were significantly different. Although the contents of intramuscular fat and polyunsaturated fatty acids were higher, the intramuscular fat of Istarski pršut of the Duroc genotype was much more resistant to hydrolysis and oxidation, suggesting that other factors also play a significant role. The assumption that the hydrolysis of phospholipids (which are composed of much more PUFA than triacylglycerols) during processing “protect” the long-chain polyunsaturated fatty acids from oxidation might be supported by the differences between genotypes in the fatty acid composition of Istarski pršut and significantly higher content of polyunsaturated fatty acids of Duroc genotype (p < 0.001). Multivariate chemometrics efficiently separated the studied samples based on the processing and genotype. Conclusively, the analyzed Istarski pršut can be distinguished by elemental fingerprints via multivariate chemometric statistical analysis based on their amino acid and fatty acid composition of the row ham genotypes.

Author Contributions

Conceptualization, M.K. and J.B.; Methodology, M.K. and J.G.K.; Validation, J.Đ. and Š.J.; Formal Analysis, M.K., D.L., S.M. and J.G.K.; Investigation, M.K., J.Đ. and Š.J.; Writing—Original Draft Preparation, M.K. and J.G.K.; Writing—Review & Editing, J.Đ., Š.J., S.M. and J.B.; Visualization, J.G.K. and M.K.; Supervision, J.B.; Project Administration, M.K. and J.Đ. All authors have read and agreed to the published version of the manuscript.

Funding

This research received no external funding.

Institutional Review Board Statement

Not applicable.

Informed Consent Statement

Not applicable.

Data Availability Statement

The data presented in this study are available on request from the corresponding author. The data are not publicly available due to the project agreement.

Acknowledgments

The manuscript was partly made as part of the project Center for Food Safety and Quality (KK.01.1.1.02.0004), https://www.stampar.hr/en/Food-Safety-and-Quality-Center-1 (accessed on 11 June 2020), led by Andrija Stampar Teaching Institute of Public Health, Zagreb, Croatia that is funded by the European Regional Development Fund.

Conflicts of Interest

The authors declare no conflict of interest.

Sample Availability

Samples of the compounds are not available from the authors.

References

  1. Petričević, S.; Marušić Radovčić, N.; Lukić, K.; Listeš, E.; Medić, H. Differentiation of dry-cured hams from different processing methods by means of volatile compounds, physico-chemical and sensory analysis. Meat Sci. 2018, 137, 217–227. [Google Scholar] [CrossRef]
  2. Čandek-Potokar, M.; Škrlep, M. Factor in pig production that impact the quality of dry-cured ham: A review. Animal 2012, 6, 327–338. [Google Scholar] [CrossRef] [PubMed]
  3. Soriano, A.; Quiles, R.; Mariscal, C.; García Ruiz, A. Pig sire type and sex effects on carcass traits, meat quality and physicochemical and sensory characteristics of Serrano dry-cured ham. J. Sci. Food Agric. 2005, 85, 1914–1924. [Google Scholar] [CrossRef]
  4. Čandek-Potokar, M.; Zlender, B.; Lefaucheur, L.; Bonneau, M. Effects of age and/or weight at slaughter on longissimus dorsi muscle: Biochemical traits and sensory quality in pigs. Meat Sci. 1998, 48, 287–300. [Google Scholar] [CrossRef]
  5. Fernandez, X.; Monin, G.; Talmant, A.; Mourot, J.; Lebret, B. Influence of intramuscular fat content on the quality of pig meat–1: Composition of the lipid fraction and sensory characteristics of M. longissimus lumborum. Meat Sci. 1999, 53, 59–65. [Google Scholar] [CrossRef]
  6. Ruiz, J.; Ventanas, J.; Cava, R.; Andrés, A.I.; García, C. Texture and appearance of dry cured ham as affected by fat content and fatty acid composition. Food Res. Int. 2000, 33, 91–95. [Google Scholar] [CrossRef]
  7. Brewer, M.S.; Zhu, L.G.; McKeith, F.K. Marbling effects on quality characteristics of pork loin chops: Consumer purchase intent, visual and sensory characteristics. Meat Sci. 2001, 59, 153–163. [Google Scholar] [CrossRef]
  8. Fuentes, V.; Ventanas, S.; Ventanas, J.; Estevez, M. The genetic background affects composition, oxidative stability and quality traits of Iberian dry-cured hams: Purebred Iberian versus reciprocal Iberian×Duroc crossbred pigs. Meat Sci. 2014, 96, 737–743. [Google Scholar] [CrossRef]
  9. Bermúdez, R.; Franco, D.; Carballo, J.; Lorenzo, J.M. Sensory properties and physico-chemical changes in the biceps femoris muscle during processing of dry-cured ham from celta pigs. Effects of cross-breeding with duroc and landrace pigs. J. Food Sci. 2017, 29, 123–137. [Google Scholar] [CrossRef]
  10. Armero, E.; Flores, M.; Toldrá, F.; Barbosa, J.A.; Olivet, J.; Pla, M.; Baselga, M. Effect of pig sire type and sex on carcass traits, meat quality and sensory quality of dry-cured ham. J. Sci. Food Agric. 1999, 79, 1147–1154. [Google Scholar] [CrossRef]
  11. Fontanesi, L.; Schiavo, G.; Gallo, M.; Baiocco, C.; Galimberti, G.; Bovo, S.; Russo, V.; Buttazzoni, L. Genome-wide association study for ham weight loss at first salting in Italian Large White pigs: Towards the genetic dissection of a key trait for dry-cured ham production. Anim. Genet. 2016, 48, 103–107. [Google Scholar] [CrossRef] [Green Version]
  12. Cilla, I.; Altarriba, J.; Guerrero, L.; Gispert, M.; Martínez, L.; Moreno, C.; Beltrán, J.A.; Guàrdia, M.D.; Diestre, A.; Arnau, J.; et al. Effect of different Duroc line sires on carcass composition, meat quality and dry-cured ham acceptability. Meat Sci. 2006, 72, 252–260. [Google Scholar] [CrossRef] [PubMed]
  13. Peloso, J.V.; Lopes, P.S.; Gomide, L.A.M.; Guimarães, S.E.F.; Carneiro, P.L.S. Carcass and ham quality characteristics of heavy pigs from different genetic groups intended for the production of dry-cured hams. Meat Sci. 2010, 86, 371–376. [Google Scholar] [CrossRef]
  14. Seong, P.N.; Park, K.M.; Kang, S.M.; Kang, G.H.; Cho, S.H.; Park, B.Y.; Ba, H.V. Effect of Particular Breed on the Chemical Composition, Texture, Color, and Sensorial Characteristics of Dry-cured Ham. Asian-Australas. J. Anim. Sci. 2014, 27, 1164–1173. [Google Scholar] [CrossRef] [PubMed] [Green Version]
  15. Viterbo, V.S.; Lopez, B.I.M.; Kang, H.; Kim, H.; Song, C.W.; Seo, K.S. Genome wide association study of fatty acid composition in Duroc swine. Asian-Australas. J. Anim. Sci. 2018, 31, 1127–1133. [Google Scholar] [CrossRef]
  16. Bertolini, F.; Schiavo, G.; Galimberti, G.; Bovo, S.; D’Andrea, M.; Gallo, M.; Buttazzoni, L.; Rothschild, M.F.; Fontanesi, L. Genome-wide association studies for seven production traits highlight genomic regions useful to dissect dry-cured ham quality and production traits in Duroc heavy pigs. Animal 2018, 12, 1777–1784. [Google Scholar] [CrossRef] [PubMed]
  17. Božac, R.; Kos, I.; Janječić, Z.; Kuzmanović, Ž.; Konjačić, M.; Nežak, J. Effect of different crossbreeds on chemical and sensory profiling of Istrian dry-cured ham. Acta Aliment. 2011, 40, 315–326. [Google Scholar] [CrossRef]
  18. Marušić Radovčić, N.; Poljanec, I.; Vidinski, P.; Novina, K.; Medic, H. Influence of different pig genotype on aroma, colour and fatty acid composition of smoked dry-cured ham. MESO Prvi Hrvat. Čas. o Mesu 2019, 6, 548–561. [Google Scholar] [CrossRef]
  19. Karolyi, D. Chemical properties and quality of istrian dry-cured ham. MESO Prvi Hrvat. Čas. o Mesu 2006, 4, 224–228. [Google Scholar]
  20. Krvavica, M.; Đugum, J. Effect of desalting on some physical characteristics of Istrian dry-cured ham. MESO Prvi Hrvat. Čas. o Mesu 2007, 1, 32–37. Available online: https://hrcak.srce.hr/index.php?show=clanak&id_clanak_jezik=34681 (accessed on 11 June 2020).
  21. Purriños, L.; Bermúdez, R.; Franco, D.; Carballo, J.; Lorenzo, J.M. Development of volatile compounds during the manufacture of dry-cured “Lacón” a Spanish traditional meat product. J. Food Sci. 2011, 76, 89–97. [Google Scholar] [CrossRef]
  22. Antequera, T.; Lopez-Bote, C.J.; Cordoba, J.J.; Garcia, C.; Ascensio, M.A.; Ventanas, J.; Garcia-Regueiro, J.A.; Diaz, I. Lipid oxidative changes in the processing of Iberian pig hams. Food Chem. 1992, 45, 105–110. [Google Scholar] [CrossRef]
  23. Buscailhon, S.; Gandemer, G.; Monin, G. Time-related changes in volatile compounds of lean tissue during processing of French dry-cured ham. J. Sci. Food Agric. 1994, 63, 69–75. [Google Scholar] [CrossRef]
  24. Shahidi, F.; Zhong, Y. Novel antioxidants in food quality preservation and health promotion. Eur. J. Lipid Sci. Technol. 2010, 112, 930–940. [Google Scholar] [CrossRef]
  25. Gandemer, G. Dry cured ham quality as related to lipid quality of raw material and lipid changes during processing: A review. Grasas y Aceites 1999, 60, 297–307. [Google Scholar] [CrossRef]
  26. Min, B.; Ahn, D.U. Mechanism of Lipid Peroxidation in Meat and Meat Products—A Review. Food Sci. Biotechnol. 2005, 14, 152–163. [Google Scholar]
  27. Pereira, A.L.F.; Abreu, V.K.G. Lipid peroxidation in meat and meat products. In Lipid Peroxidation; Mansour, M.A., Ed.; IntechOpen: London, UK, 2018; pp. 531–633. [Google Scholar] [CrossRef] [Green Version]
  28. Gómez, M.; Lorenzo, J.M. Effect of fat level on physicochemical, volatile compounds and sensory characteristics of dry-ripened “chorizo” from Celta pig breed. Meat Sci. 2013, 95, 658–666. [Google Scholar] [CrossRef]
  29. Amaral, A.B.; da Silva, M.V.; da Silva Lannes, S.C. Lipid oxidation in meat: Mechanisms and protective factors–A review. Food Sci. Technol. 2018, 38, 1–15. [Google Scholar] [CrossRef] [Green Version]
  30. Domínguez, R.; Pateiro, M.; Gagaoua, M.; Barba, F.J.; Zhang, W.; Lorenzo, J.M. A Comprehensive Review on Lipid Oxidation in Meat and Meat Products. Antioxidants 2019, 8, 429. [Google Scholar] [CrossRef] [PubMed] [Green Version]
  31. Lorenzo, J.M.; Purrinos, L. Changes on Physico-chemical, Textural, Proteolysis, Lipolysis and Volatile Compounds During the Manufacture of Dry-cured “Lacón” from Celta Pig Breed. J. Biol. Sci. 2013, 13, 168–182. [Google Scholar] [CrossRef] [Green Version]
  32. Salazar, E.; Abellán, A.; Cayuela, J.M.; Poto, Á.; Girón, F.; Zafrilla, P.; Tejada, L. Effect of processing time on the quality of dry-cured ham obtained from a native pig breed (Chato Murciano). Anim. Prod. Sci. 2015, 55, 113–121. [Google Scholar] [CrossRef]
  33. Marušić, N.; Vidaček, S.; Janči, T.; Petrak, T.; Medić, H. Determination of volatile compounds and quality parameters of traditional Istrian dry-cured ham. Meat Sci. 2014, 96, 1409–1416. [Google Scholar] [CrossRef]
  34. Lertpatarakomol, R.; Chaosap, C.; Chaweewan, K.; Sitthigripong, R.; Limsupavanich, R. Carcass characteristics and meat quality of purebred Pakchong 5 and crossbred pigs sired by Pakchong 5 or Duroc boar. Asian-Australas. J. Anim. Sci. 2019, 32, 585–591. [Google Scholar] [CrossRef] [Green Version]
  35. Ramírez, R.; Cava, R. Carcass composition and meat quality of three different Iberian×Duroc genotype pigs. Meat Sci. 2007, 75, 388–396. [Google Scholar] [CrossRef]
  36. Touma, S.; Oyadomari, M. Comparison of growth performances, carcass characteristics, and meat qualities of Okinawan indigenous Agu pigs and crossbred pigs sired by Agu or Duroc boar. Anim. Sci. J. 2020, 91, 1–7. [Google Scholar] [CrossRef] [PubMed]
  37. Kos, I. Physico-Chemical and Sensory Properties of Dalmatian Prosciutto of Different Pig Genotypes. Ph.D. Thesis, Faculty of Agriculture, University of Zagreb, Zagreb, Croatia, 2011. [Google Scholar]
  38. Sanchez, M.P.; Iannuccelli, N.; Basso, B.; Bidanel, J.; Billon, Y.; Gandemer, G.; Gilbert, H.; Larzul, C.; Legault, C.; Riquet, J.; et al. Identification of QTL with effects on intramuscular fat content fatty acid composition in a Duroc × Large White cross. BMC Genet. 2007, 8, 55. [Google Scholar] [CrossRef] [Green Version]
  39. Čandek-Potokar, M.; Monin, G.; Žlender, B. Pork quality, processing and sensory characteristics of dry-cured hams as influenced by Duroc crossing and sex. J. Anim. Sci. 2002, 80, 988–996. [Google Scholar] [CrossRef]
  40. Kim, J.A.; Cho, E.S.; Jeong, Y.D.; Choi, Y.H.; Kim, Y.S.; Choi, J.W.; Kim, J.S.; Jang, A.; Hong, J.K.; Sa, S.J. The effects of breed and gender on meat quality of Duroc, Pietrain, and their crossbred. J. Anim. Sci. Technol. 2020, 62, 409–419. [Google Scholar] [CrossRef]
  41. Ayuso, D.; González, A.; Peña, F.; Hernández-García, F.; Izquierdo, M. Effect of Fattening Period Length on Intramuscular and Subcutaneous Fatty Acid Profiles in Iberian Pigs Finished in the Montanera Sustainable System. Sustainability 2020, 12, 7937. [Google Scholar] [CrossRef]
  42. Eggert, J.; Grant, A.; Schinckel, A. Factors Affecting Fat Distribution in Pork Carcasses1. Prof. Anim. Sci. 2007, 23, 42–53. [Google Scholar] [CrossRef]
  43. Toldrá, F. Dry-Cured Meat Products; WileyBlackwell: Ames, IW, USA, 2002; pp. 27–62. [Google Scholar]
  44. Jiménez-Colmenero, F.; Ventanas, J.; Toldrá, F. Nutritional composition of dry-cured ham and its role in a healthy diet. Meat Sci. 2010, 84, 585–593. [Google Scholar] [CrossRef] [PubMed]
  45. Zuo, Q.-X.; Zhang, W.-G.; Xing, L.-J.; Zheng, J.-X.; Zhou, G.-H. Stability of Angiotensin I-converting Enzyme Inhibitory Activity of Peptides Extracted from Dry-cured Jinhua Ham. J. Food Nutr. Res. 2017, 5, 301–308. [Google Scholar] [CrossRef] [Green Version]
  46. Marušić, N.; Aristoy, M.-C.; Toldrá, F. Nutritional pork meat compounds as affected by ham dry-curing. Meat Sci. 2013, 93, 53–60. [Google Scholar] [CrossRef]
  47. Salazar, E.; Cayuela, J.M.; Abellán, A.; Bueno-Gavilá, E.; Tejada, L. Fatty Acids and Free Amino Acids Changes during Processing of a Mediterranean Native Pig Breed Dry-Cured Ham. Foods 2020, 9, 1170. [Google Scholar] [CrossRef] [PubMed]
  48. Vestergaard, C.S.; Schivazappa, C.; Virgili, R. Lipolysis in dry-cured ham maturation. Meat Sci. 2000, 55, 1–5. [Google Scholar] [CrossRef]
  49. Pateiro, M.; Franco, D.; Carril, J.A.; Lorenzo, J.M. Changes on physico-chemical properties, lipid oxidation and volatile compounds during the manufacture of celta dry-cured loin. J. Food Sci. Technol. 2014, 52, 4808–4818. [Google Scholar] [CrossRef] [PubMed] [Green Version]
  50. Larrea, V.; Perezmunuera, I.; Hernando, I.; Quiles, A.; Lluch, M. Chemical and structural changes in lipids during the ripening of Teruel dry-cured ham. Food Chem. 2007, 102, 494–503. [Google Scholar] [CrossRef]
  51. Cava, R.; Estévez, M.; Morcuende, D.; Antequera, T. Evolution of fatty acids from intramuscular lipid fractions during ripening of Iberian hams as affected by α-tocopheryl acetate supplementation in diet. Food Chem. 2003, 81, 199–207. [Google Scholar] [CrossRef]
  52. Sirtori, F.; Dimauro, C.; Bozzi, R.; Aquilani, C.; Franci, O.; Calamai, L.; Pezzati, A.; Pugliese, C. Evolution of volatile compounds and physical, chemical and sensory characteristics of Toscano PDO ham from fresh to dry-cured product. Eur. Food Res. Technol. 2019, 246, 409–424. [Google Scholar] [CrossRef] [Green Version]
  53. Andres, A.; Cava, R.; Martin, D.; Ventanas, J.; Ruiz-Carrascal, J. Lipolysis in dry-cured ham: Influence of salt content and processing conditions. Food Chem. 2005, 90, 523–533. [Google Scholar] [CrossRef]
  54. Storrustløkken, L.; Devle, H.M.; Håseth, T.T.; Egelandsdal, B.; Naess-Andresen, C.F.; Hollung, K.; Berg, P.; Ekeberg, D.; Alvseike, O. Lipid degradation and sensory characteristics ofM. biceps femorisin dry-cured hams from Duroc using three different processing methods. Int. J. Food Sci. Technol. 2015, 50, 522–531. [Google Scholar] [CrossRef]
  55. González-Domínguez, R.; Sayago, A.; Fernández-Recamales, Á. Fatty Acid Profiling for the Authentication of Iberian Hams According to the Feeding Regime. Foods 2020, 9, 149. [Google Scholar] [CrossRef] [PubMed] [Green Version]
  56. Ramirez, M.; Cava, R.; Ramirez, R. Effect of Physico-chemical Characteristics of Raw Muscles from Three Iberian × Duroc Genotypes on Dry-cured Meat Products Quality. Food Sci. Technol. Int. 2007, 13, 485–495. [Google Scholar] [CrossRef]
  57. Yim, D.-G.; Jung, J.-H.; Ali, M.; Nam, K.-C. Comparison of physicochemical traits of dry-cured ham from purebred Berkshire and crossbred Landrace × Yorkshire × Duroc (LYD) pigs. J. Anim. Sci. Technol. 2019, 61, 35–40. [Google Scholar] [CrossRef] [PubMed] [Green Version]
  58. Li, Y.; Liu, S. Reducing lipid peroxidation for improving colour stability of beef and lamb: On-farm considerations. J. Sci. Food Agric. 2011, 92, 719–729. [Google Scholar] [CrossRef]
  59. Gandemer, G. Lipids in muscles and adipose tissues, changes during processing and sensory properties of meat products. Meat Sci. 2002, 62, 309–321. [Google Scholar] [CrossRef]
  60. Mariutti, L.R.; Bragagnolo, N. Influence of salt on lipid oxidation in meat and seafood products: A review. Food Res. Int. 2017, 94, 90–100. [Google Scholar] [CrossRef] [PubMed]
  61. Zhao, B.; Zhou, H.-M.; Zhang, S.-L.; Pan, X.-Q.; Li, S.; Zhu, N.; Wu, Q.-R.; Wang, S.-W.; Qiao, X.-L.; Chen, W.-H. Changes of protein oxidation, lipid oxidation and lipolysis in Chinese dry sausage with different sodium chloride curing salt content. Food Sci. Hum. Wellness 2020, 9, 328–337. [Google Scholar] [CrossRef]
  62. Overholt, M.; Mancini, S.; Galloway, H.; Preziuso, G.; Dilger, A.; Boler, D. Effects of salt purity on lipid oxidation, sensory characteristics, and textural properties of fresh, ground pork patties. LWT 2016, 65, 890–896. [Google Scholar] [CrossRef] [Green Version]
  63. Kong, F.; Oliveira, A.; Tang, J.; Rasco, B.; Crapo, C. Salt effect on heat-induced physical and chemical changes of salmon fillet (O. gorbuscha). Food Chem. 2008, 106, 957–966. [Google Scholar] [CrossRef]
  64. Sakai, T.; Shimizu, Y.; Kawahara, S. Effect of NaCl on the Lipid Peroxidation-Derived Aldehyde, 4-Hydroxy-2-nonenal, Formation in Boiled Pork. Biosci. Biotechnol. Biochem. 2006, 70, 815–820. [Google Scholar] [CrossRef] [PubMed] [Green Version]
  65. Song, O.Y.; Islam, A.; Son, J.H.; Jeong, J.Y.; Kim, H.E.; Yeon, L.S.; Khan, N.; Jamila, N.; Kim, K.S. Elemental composition of pork meat from conventional and animal welfare farms by inductively coupled plasma-optical emission spectrometry (ICP-OES) and ICP-mass spectrometry (ICP-MS) and their authentication via multivariate chemometric analysis. Meat Sci. 2021, 172, 108344. [Google Scholar] [CrossRef] [PubMed]
  66. Zhao, Y.; Tu, T.; Tang, X.; Zhao, S.; Qie, M.; Chen, A.; Yang, S. Authentication of organic pork and identification of geographical origins of pork in four regions of China by combined analysis of stable isotopes and multi-elements. Meat Sci. 2020, 165, 108129. [Google Scholar] [CrossRef]
  67. Association of Official Analytical Chemists (AOAC). Official Methods of Analysis, 17th ed.; Horwitz, W., Ed.; AOAC: Gaithersburg, MD, USA, 2000. [Google Scholar]
  68. Holló, G.; Nuernberg, K.; Holló, I.; Csapó, J.; Seregi, J.; Repa, I.; Ender, K. Effect of feeding on the composition of longissimus muscle of Hungarian Grey and Holstein Friesian bulls. III. Amino acid composition and mineral content. Arch. Tierz. 2007, 50, 575–586. [Google Scholar] [CrossRef] [Green Version]
  69. Csapó, J.; Csapó-Kiss, Z.S.; Tóth-Pósfai, I. Optimization of hydrolysis at determination of amino acid content in food and feed products. Acta Aliment. 1986, 1, 3–21. [Google Scholar]
  70. ISO. Animal and Vegetable Fats and Oils—Gas Chromatography of Fatty Acid Methyl Esters—Part 2: Preparation of Methyl Esters of Fatty Acids; ISO 12966-2:2017; International Organization for Standardization: Geneva, Switzerland, 2017. [Google Scholar]
  71. ISO. Meat and Meat Products—Determination of Total Fat Content; ISO 1443:1973; International Organization for Standardization: Geneva, Switzerland, 1973. [Google Scholar]
  72. ISO. Animal and Vegetable Fats and Oils—Determination of Acid Value and Acidity; ISO 660:2009; International Organization for Standardization: Geneva, Switzerland, 2009. [Google Scholar]
  73. Association of Official Analytical Chemists (AOAC). Official Method 965.33, 18th ed.; Horwitz, W., Latimer, G.W., Eds.; AOAC International: Gaithersburg, MD, USA, 2007. [Google Scholar]
  74. Lemon, D.W. An Improved TBA Test for Rancidity; New Series Circular no. 51. 1975; Halifax Laboratory: Halifaks, NS, Canada, 1975. [Google Scholar]
Figure 1. Score plot of the first two principal components (PC1 and PC2), of the principal component analysis, showing variance based on the fatty acid composition of ham from two different process stages, raw ham (1) and matured ham (2).
Molecules 26 04140 g001
Figure 2. Score plot of the first two principal components (PC1 and PC2), of the principal component analysis, showing variance based on the (a) fatty acid composition and (b) amino acid composition of matured Istarski pršut of two different genotypes, LWxL (1) & (LWxL)xD (2).
Molecules 26 04140 g002
Table 1. Influence of processing on basic-chemical properties (means ± standard error) of raw and matured Istarski pršut of (LWxL)xD genotype.
IndicatorsRaw HamMatured Hamp
Dry matter (DM), %27.62 ± 1.4257.86 ± 2.260.000
Water (W), %72.38 ± 1.4242.14 ± 2.260.000
Protein (P), %23.02 ± 0.5537.70 ± 2.480.000
Fat (IMF), %4.18 ± 1.4216.12 ± 2.600.000
NaCl, %-8.29 ± 0.78-
pH5.77 ± 0.186.18 ± 0.280.000
The values in bold are significant.
Table 2. Differences between pig genotypes in basic-chemical properties (means ± standard error) of matured Istarski pršut.
IndicatorsLWxL(LWxL)xDp
Dry matter (DM), %63.00 ± 1.5757.86 ± 2.260.000
Water (W), %37.01 ± 1.5742.14 ± 2.260.000
Protein (P), %38.13 ± 3.5137.70 ± 2.480.311
Fat (IMF), %11.76 ± 2.1716.12 ± 2.600.000
NaCl, %9.04 ± 0.388.29 ± 0.780.002
pH6.13 ± 0.186.18 ± 0.280.324
Processing weight loss, %41.36 ± 3.4840.48 ± 2.260.254
LW—Large White; L—Landrace; D—Duroc; The values in bold are significant.
Table 3. Differences between pig genotypes in the AA composition (means ± standard error) of matured Istarski pršut.
Amino Acid
(AA)
gAA/100 g SamplegAA/100 g Protein
LWxL(LWxL)xDpLWxL(LWxL)xDp
Threonine (Thr)1.72 ± 0.111.74 ± 0.180.3924.62 ± 0.114.59 ± 0.040.226
Valine (Val)2.02 ± 0.121.95 ± 0.210.1685.40 ± 0.045.13 ± 0.190.000
Methionine (Met)1.03 ± 0.071.02 ± 0.120.3852.75 ± 0.052.68 ± 0.070.006
Isoleucine (Ile)1.80 ± 0.131.76 ± 0.210.3084.81 ± 0.124.64 ± 0.070.001
Leucine (Leu)3.01 ± 0.202.95 ± 0.350.3278.05 ± 0.117.78 ± 0.150.000
Phenylalanine (Phe)1.55 ± 0.111.51 ± 0.180.2974.15 ± 0.083.98 ± 0.070.000
Histidine (His)1.68 ± 0.111.59 ± 0.180.0834.51 ± 0.134.19 ± 0.160.000
Lysine (Lys)3.31 ± 0.233.24 ± 0.420.3238.86 ± 0.178.53 ± 0.230.001
Arginine (Arg)2.26 ± 0.152.41 ± 0.300.0896.07 ± 0.236.36 ± 0.350.021
Total EAA18.38 ± 1.1918.16 ± 2.080.38649.24 ± 0.4547.85 ± 0.620.000
Aspartic acid (Asp)3.53 ± 0.243.57 ± 0.380.3989.46 ± 0.099.41 ± 0.080.116
Serine (Ser)1.49 ± 0.111.52 ± 0.190.3143.97 ± 0.064.00 ± 0.130.278
Glutamic acid (Glu)5.97 ± 0.466.25 ± 0.710.15915.99 ± 0.4716.45 ± 0.230.011
Proline (Pro)1.55 ± 0.101.75 ± 0.160.0034.15 ± 0.194.63 ± 0.240.000
Glycine (Gly)1.77 ± 0.201.96 ± 0.150.0214.75 ± 0.585.19 ± 0.430.047
Alanine (Ala)2.22 ± 0.332.22 ± 0.210.4945.70 ± 0.255.85 ± 0.140.073
Cysteine (Cys)0.33 ± 0.030.41 ± 0.030.0000.86 ± 0.101.09 ± 0.100.000
Tyrosine (Tyr)1.57 ± 0.121.54 ± 0.160.2934.19 ± 0.094.05 ± 0.080.001
Total NEAA18.43 ± 1.1519.20 ± 1.900.14449.09 ± 0.4550.66 ± 0.630.000
EAA/NEAA1.00 ± 0.030.94 ± 0.020.0001.00 ± 0.020.94 ± 0.020.000
Total AA36.81 ± 2.2937.36 ± 3.970.35498.33 ± 0.1498.51 ± 0.110.003
NH30.61 ± 0.040.60 ± 0.060.2541.65 ± 0.081.58 ± 0.050.022
N% × 6.2538.33 ± 3.8737.60 ± 2.380.622---
LW—Large White; L—Landrace; D—Duroc; EAA—Essential AA; NEAA—Non-essential AA; The values in bold are significant.
Table 4. Influence of processing on the FA composition (means ± standard error) of raw and matured Istarski pršut of (LWxL)xD genotype (% of FAMEs).
Fatty AcidRaw HamMatured Hamp
C10:00.000.08 ± 0.010.000
C12:00.000.08 ± 0.010.000
C14:01.94 ± 0.331.40 ± 0.100.000
C14:10.000.02 ± 0.010.000
C15:00.000.05 ± 0.020.000
C16:028.14 ± 3.1924.22 ± 0.770.001
C16:13.81 ± 0.542.53 ± 0.300.000
C17:00.20 ± 0.060.28 ± 0.050.002
C17:10.18 ± 0.050.22 ± 0.040.027
C18:013.79 ± 1.7213.72 ± 0.760.457
C18:1ω-9t0.000.29 ± 0.030.000
C18:1ω-9c44.64 ± 2.7741.11 ± 0.790.001
C18:2ω-65.90 ± 2.0811.84 ± 1.370.000
C18:3ω-30.24 ± 0.110.60 ± 0.080.000
C18:3ω-60.000.05 ± 0.020.000
C20:00.20 ± 0.050.000.000
C20:10.54 ± 0.160.88 ± 0.140.000
C20:20.000.62 ± 0.080.000
C20:3ω-60.000.18 ± 0.020.000
C20:4ω-60.000.72 ± 0.180.000
C20:5ω-30.000.02 ± 0.010.000
C21:00.000.02 ± 0.010.000
C22:5ω-30.000.20 ± 0.240.001
C22:6ω-30.000.02 ± 0.020.000
C23:00.000.11 ± 0.010.000
C24:00.000.03 ± 0.010.000
C24:10.000.09 ± 0.180.029
UnidFA0.39 ± 0.340.64 ± 0.120.029
SFA44.27 ± 4.7339.98 ± 0.980.010
MUFA49.17 ± 2.9745.13 ± 0.990.000
PUFA6.14 ± 2.1714.25 ± 1.570.000
UFA55.30 ± 4.5659.39 ± 1.010.011
PUFA/SFA0.14 ± 0.050.36 ± 0.050.000
UFA/SFA1.27 ± 0.211.49 ± 0.060.004
ω-944.64 ± 2.7741.40 ± 0.800.002
ω-65.90 ± 0.5212.79 ± 1.390.000
ω-30.24 ± 0.110.84 ± 0.260.000
ω-6/ω-323.54 ± 2.3915.98 ± 3.050.001
UnidFA—Unidentified fatty acids (most likely long-chain PUFA); SFA—Saturated fatty acids; MUFA—Mono-unsaturated fatty acids; PUFA—Polyunsaturated fatty acids; UFA—Unsaturated fatty acids; The values in bold are significant.
Table 5. Differences between pig genotypes in fatty acid properties (means ± standard error) of matured Istarski pršut.
Fatty AcidLWxL(LWxL)xDp
C10:00.07 ± 0.020.08 ± 0.010.124
C12:00.07 ± 0.010.08 ± 0.010.000
C14:01.29 ± 0.131.40 ± 0.100.032
C14:10.03 ± 0.060.02 ± 0.010.249
C15:00.09 ± 0.110.05 ± 0.020.173
C16:023.55 ± 1.1624.22 ± 0.770.086
C16:12.84 ± 0.272.53 ± 0.300.014
C17:00.40 ± 0.130.28 ± 0.050.009
C17:10.37 ± 0.150.22 ± 0.040.008
C18:011.23 ± 0.4713.72 ± 0.760.000
C18:1ω-9t0.46 ± 0.070.29 ± 0.030.000
C18:1ω-9c46.42 ± 1.5541.11 ± 0.790.000
C18:2ω-68.48 ± 1.2411.84 ± 1.370.000
C18:3ω-30.17 ± 0.080.60 ± 0.080.000
C18:3ω-60.06 ± 0.060.05 ± 0.020.263
C20:00.23 ± 0.100.000.000
C20:11.04 ± 0.090.88 ± 0.140.003
C20:20.48 ± 0.120.62 ± 0.080.006
C20:3ω-60.16 ± 0.060.18 ± 0.020.134
C20:4ω-60.82 ± 0.250.72 ± 0.180.176
C20:5ω-30.04 ± 0.060.02 ± 0.010.231
C21:00.39 ± 0.070.02 ± 0.010.000
C22:5ω-30.12 ± 0.040.20 ± 0.240.145
C22:6ω-30.03 ± 0.010.02 ± 0.020.169
C23:00.08 ± 0.050.11 ± 0.010.033
C24:00.000.03 ± 0.010.000
C24:10.000.09 ± 0.180.000
UnidFA0.89 ± 0.310.64 ± 0.120.022
SFA37.39 ± 1.2739.98 ± 0.980.000
MUFA51.16 ± 1.2945.13 ± 0.990.000
PUFA10.35 ± 1.5314.25 ± 1.570.000
UFA61.51 ± 1.0059.39 ± 1.010.000
PUFA/SFA0.28 ± 0.050.36 ± 0.050.001
UFA/SFA1.65 ± 0.081.49 ± 0.060.000
ω-946.87 ± 1.5141.40 ± 0.800.000
ω-69.52 ± 1.3812.79 ± 1.390.000
ω-30.36 ± 0.160.84 ± 0.260.000
ω-6/ω-329.24 ± 8.7315.98 ± 3.050.000
LW—Large White; L—Landrace; D—Duroc; UnidFA—Unidentified fatty acids (most likely long-chain PUFA); SFA–Saturated fatty acids; MUFA—Mono-unsaturated fatty acids; PUFA—Polyunsaturated fatty acids; UFA—Unsaturated fatty acids; The values in bold are significant.
Table 6. Differences between pig genotypes in the indicators of lipolysis and lipid oxidation (means ± standard error) of matured Istarski pršut.
IndicatorsLWxL(LWxL)xDp
Acid value (AV), KOH/g fat38.50 ± 8.4622.20 ± 5.160.000
Peroxide value (PV), meq/kg fat17.80 ± 8.0911.10 ± 7.450.035
TBARS, mg MDA/kg sample0.42 ± 0.190.28 ± 0.120.037
LW—Large White; L—Landrace; D—Duroc; The values in bold are significant.
Table 7. Correlation (Pearson) matrix between individual FAs and lipolysis/lipid oxidation indicators of matured Istarski pršut, irrespective to genotype.
VariablesIMFAVPVTBARS
C10:00.03−0.110.060.10
C12:00.38−0.67 **−0.34−0.34
C14:00.20−0.39−0.23−0.06
C14:10.240.260.360.36
C15:00.300.340.400.40
C16:00.08−0.29−0.24−0.12
C16:1−0.400.250.360.46 *
C17:0−0.570.46 *0.320.32
C17:1−0.430.54 *0.44 *0.43
C18:00.61 **−0.77 ***−0.44 *−0.40
C18:1ω-9t−0.70 ***0.77 ***0.380.41
C18:1ω-9c−0.420.70 ***0.370.32
C18:2ω-60.51 *−0.65 **−0.39−0.42
C18:3ω-30.60 **−0.71 ***−0.37−0.34
C18:3ω-6−0.210.240.270.27
C20:0−0.52 *0.78 ***0.50 *0.43
C20:1−0.280.70 ***0.180.11
C20:20.33−0.28−0.17−0.23
C20:3ω-6−0.24−0.080.070.08
C20:4ω-6−0.60 **0.310.270.30
C20:5ω-3−0.280.280.350.32
C21:0−0.61 **0.81 ***0.46 *0.40
C22:5ω-3−0.28−0.16−0.050.01
C22:6ω-3−0.340.230.290.28
C23:0−0.20−0.170.02−0.01
C24:00.66 **−0.69 **−0.40−0.49 *
C24:1−0.15−0.30−0.12−0.05
UnidFA−0.62 **0.50 *0.230.21
SFA0.41−0.63 **−0.39−0.28
MUFA−0.48 *0.73 ***0.410.37
PUFA0.42−0.60 **−0.34−0.35
UFA−0.360.65 **0.360.24
PUFA/SFA0.35−0.51 *−0.28−0.32
UFA/SFA−0.390.62 **0.370.25
ω-60.43−0.61 **−0.36−0.38
ω-30.23−0.54 *−0.22−0.17
ω-6/ω-3−0.290.53 *0.150.09
ω-9−0.44 *0.71 ***0.370.32
IMF1.00−0.48*−0.18−0.29
AV−0.48 *1.000.340.27
PV−0.180.341.000.95 ***
TBARS−0.290.270.95 ***1.00
NaCl−0.56 *0.160.140.26
IMF—Intramuscular fat; AV—Acid value; PV—Peroxide value; TBARS—Thiobarbituric acid reactive substances assay; UnidFA—Unidentified fatty acids (most likely long-chain PUFA); SFA—Saturated fatty acids; MUFA—Mono-unsaturated fatty acids; PUFA—Polyunsaturated fatty acids; UFA—Unsaturated fatty acids; The values in bold are different from 0 (* p < 0.05; ** p < 0.01; *** p < 0.001).
Publisher’s Note: MDPI stays neutral with regard to jurisdictional claims in published maps and institutional affiliations.

