
Varietal and Geographical Origin Characterization of Peaches and Nectarines by Combining Analytical Techniques and Statistical Approach

 , ,
, ,  , ,
, ,  , , ,
, , , 
Abstract
:
1. Introduction
2. Results and Discussion
2.1. Ripeness Index via Rheological Analyses
2.2. Organic and Inorganic Composition via Thermogravimetric Analysis (TGA)
2.3. Antioxidant Properties: Spectrophotometric Analysis (TPP and TEAC) and HPLC-ESI-MS Analysis (Selected Flavonoids)
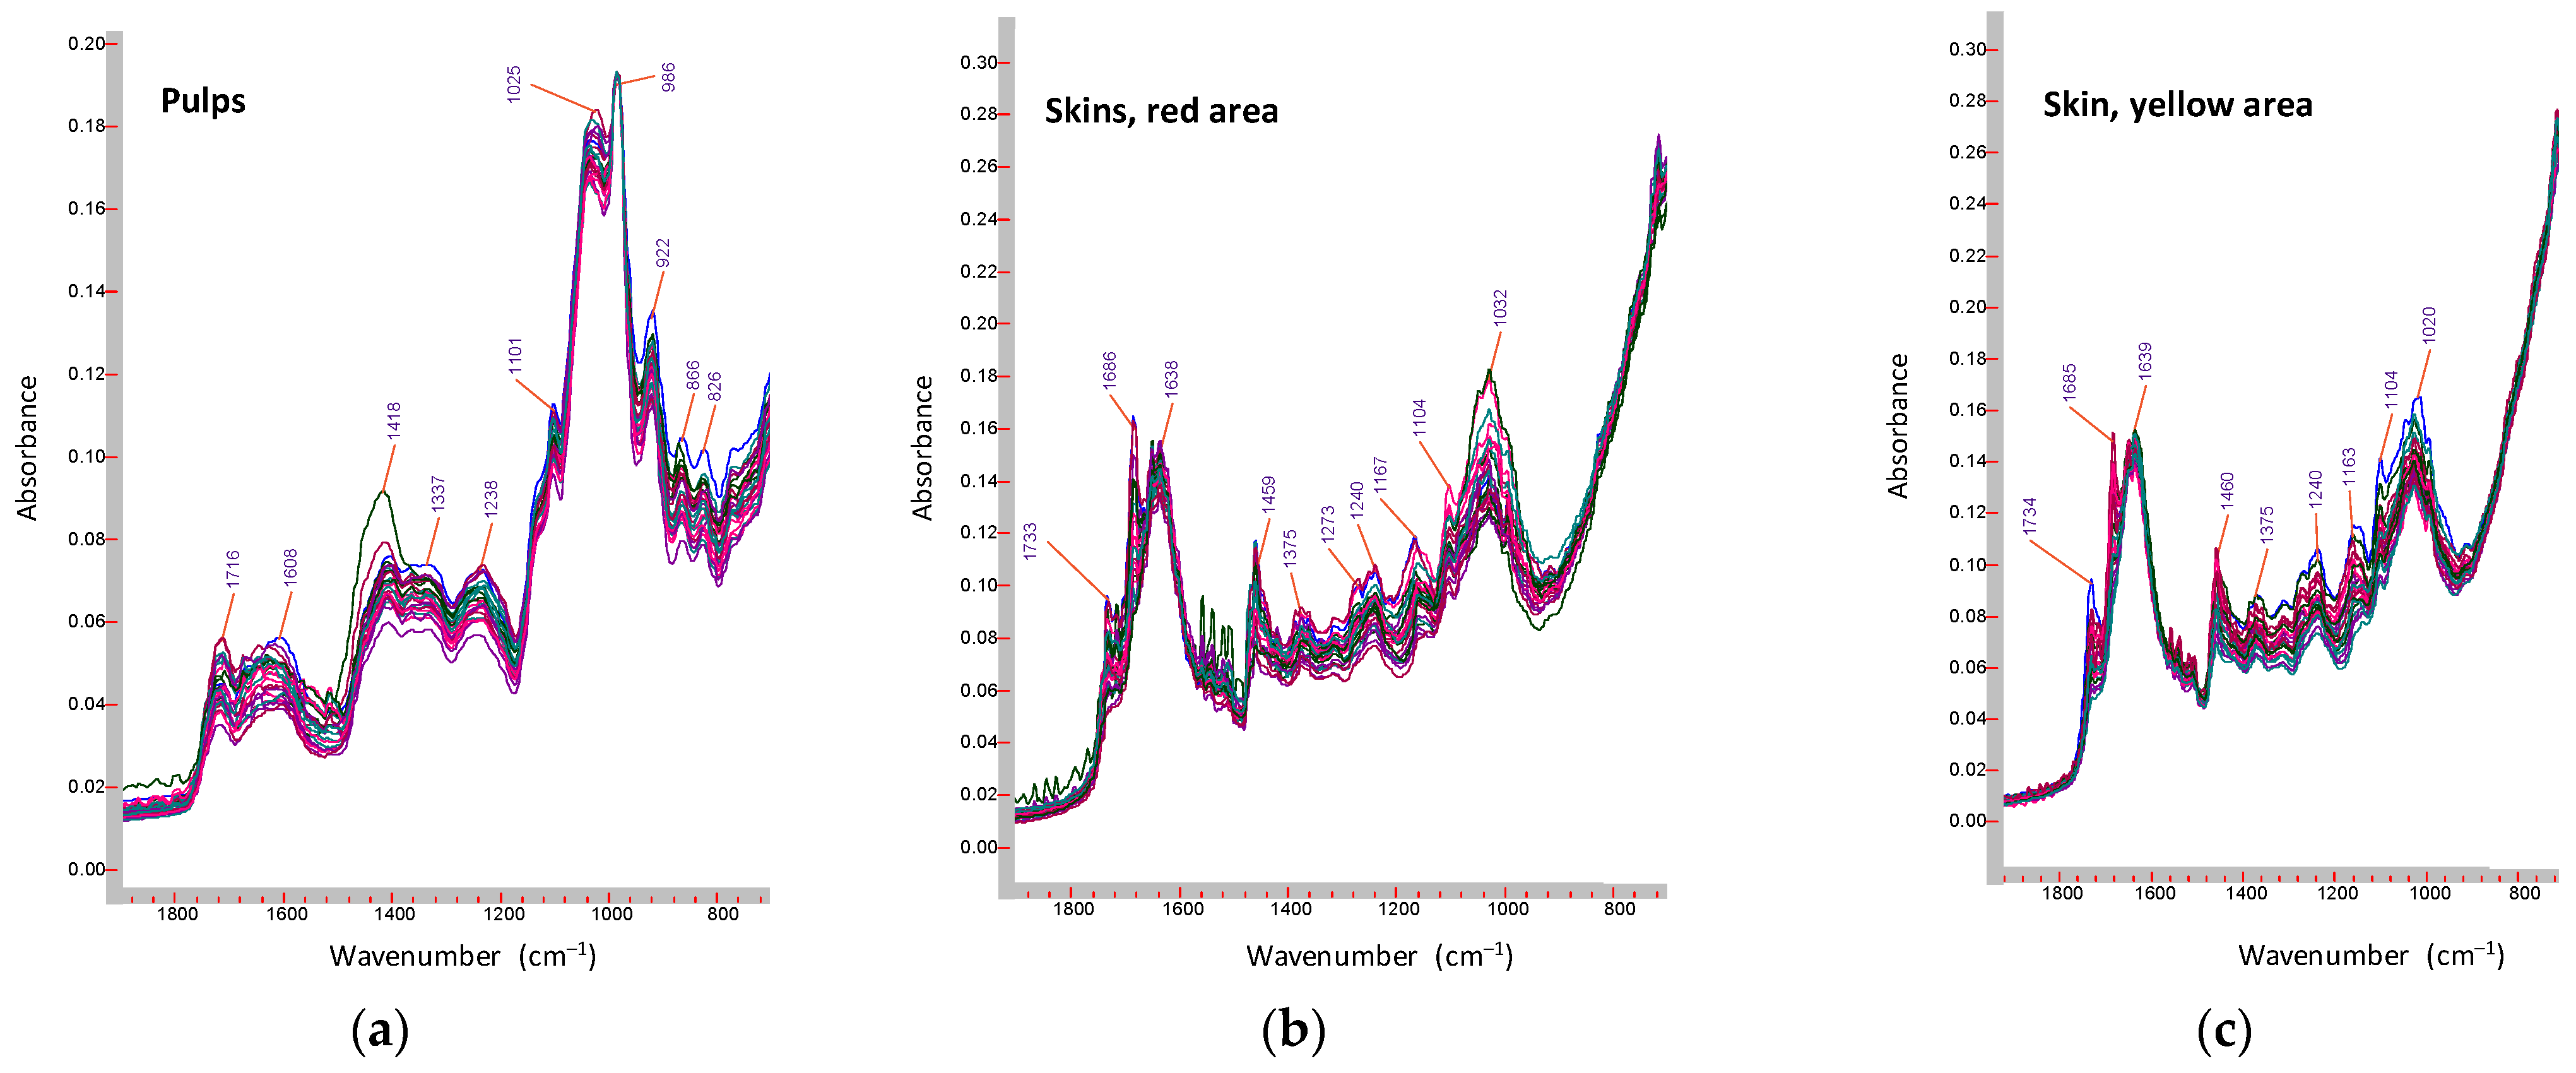
2.4. Infrared Analysis (ATR-FT-MIR)
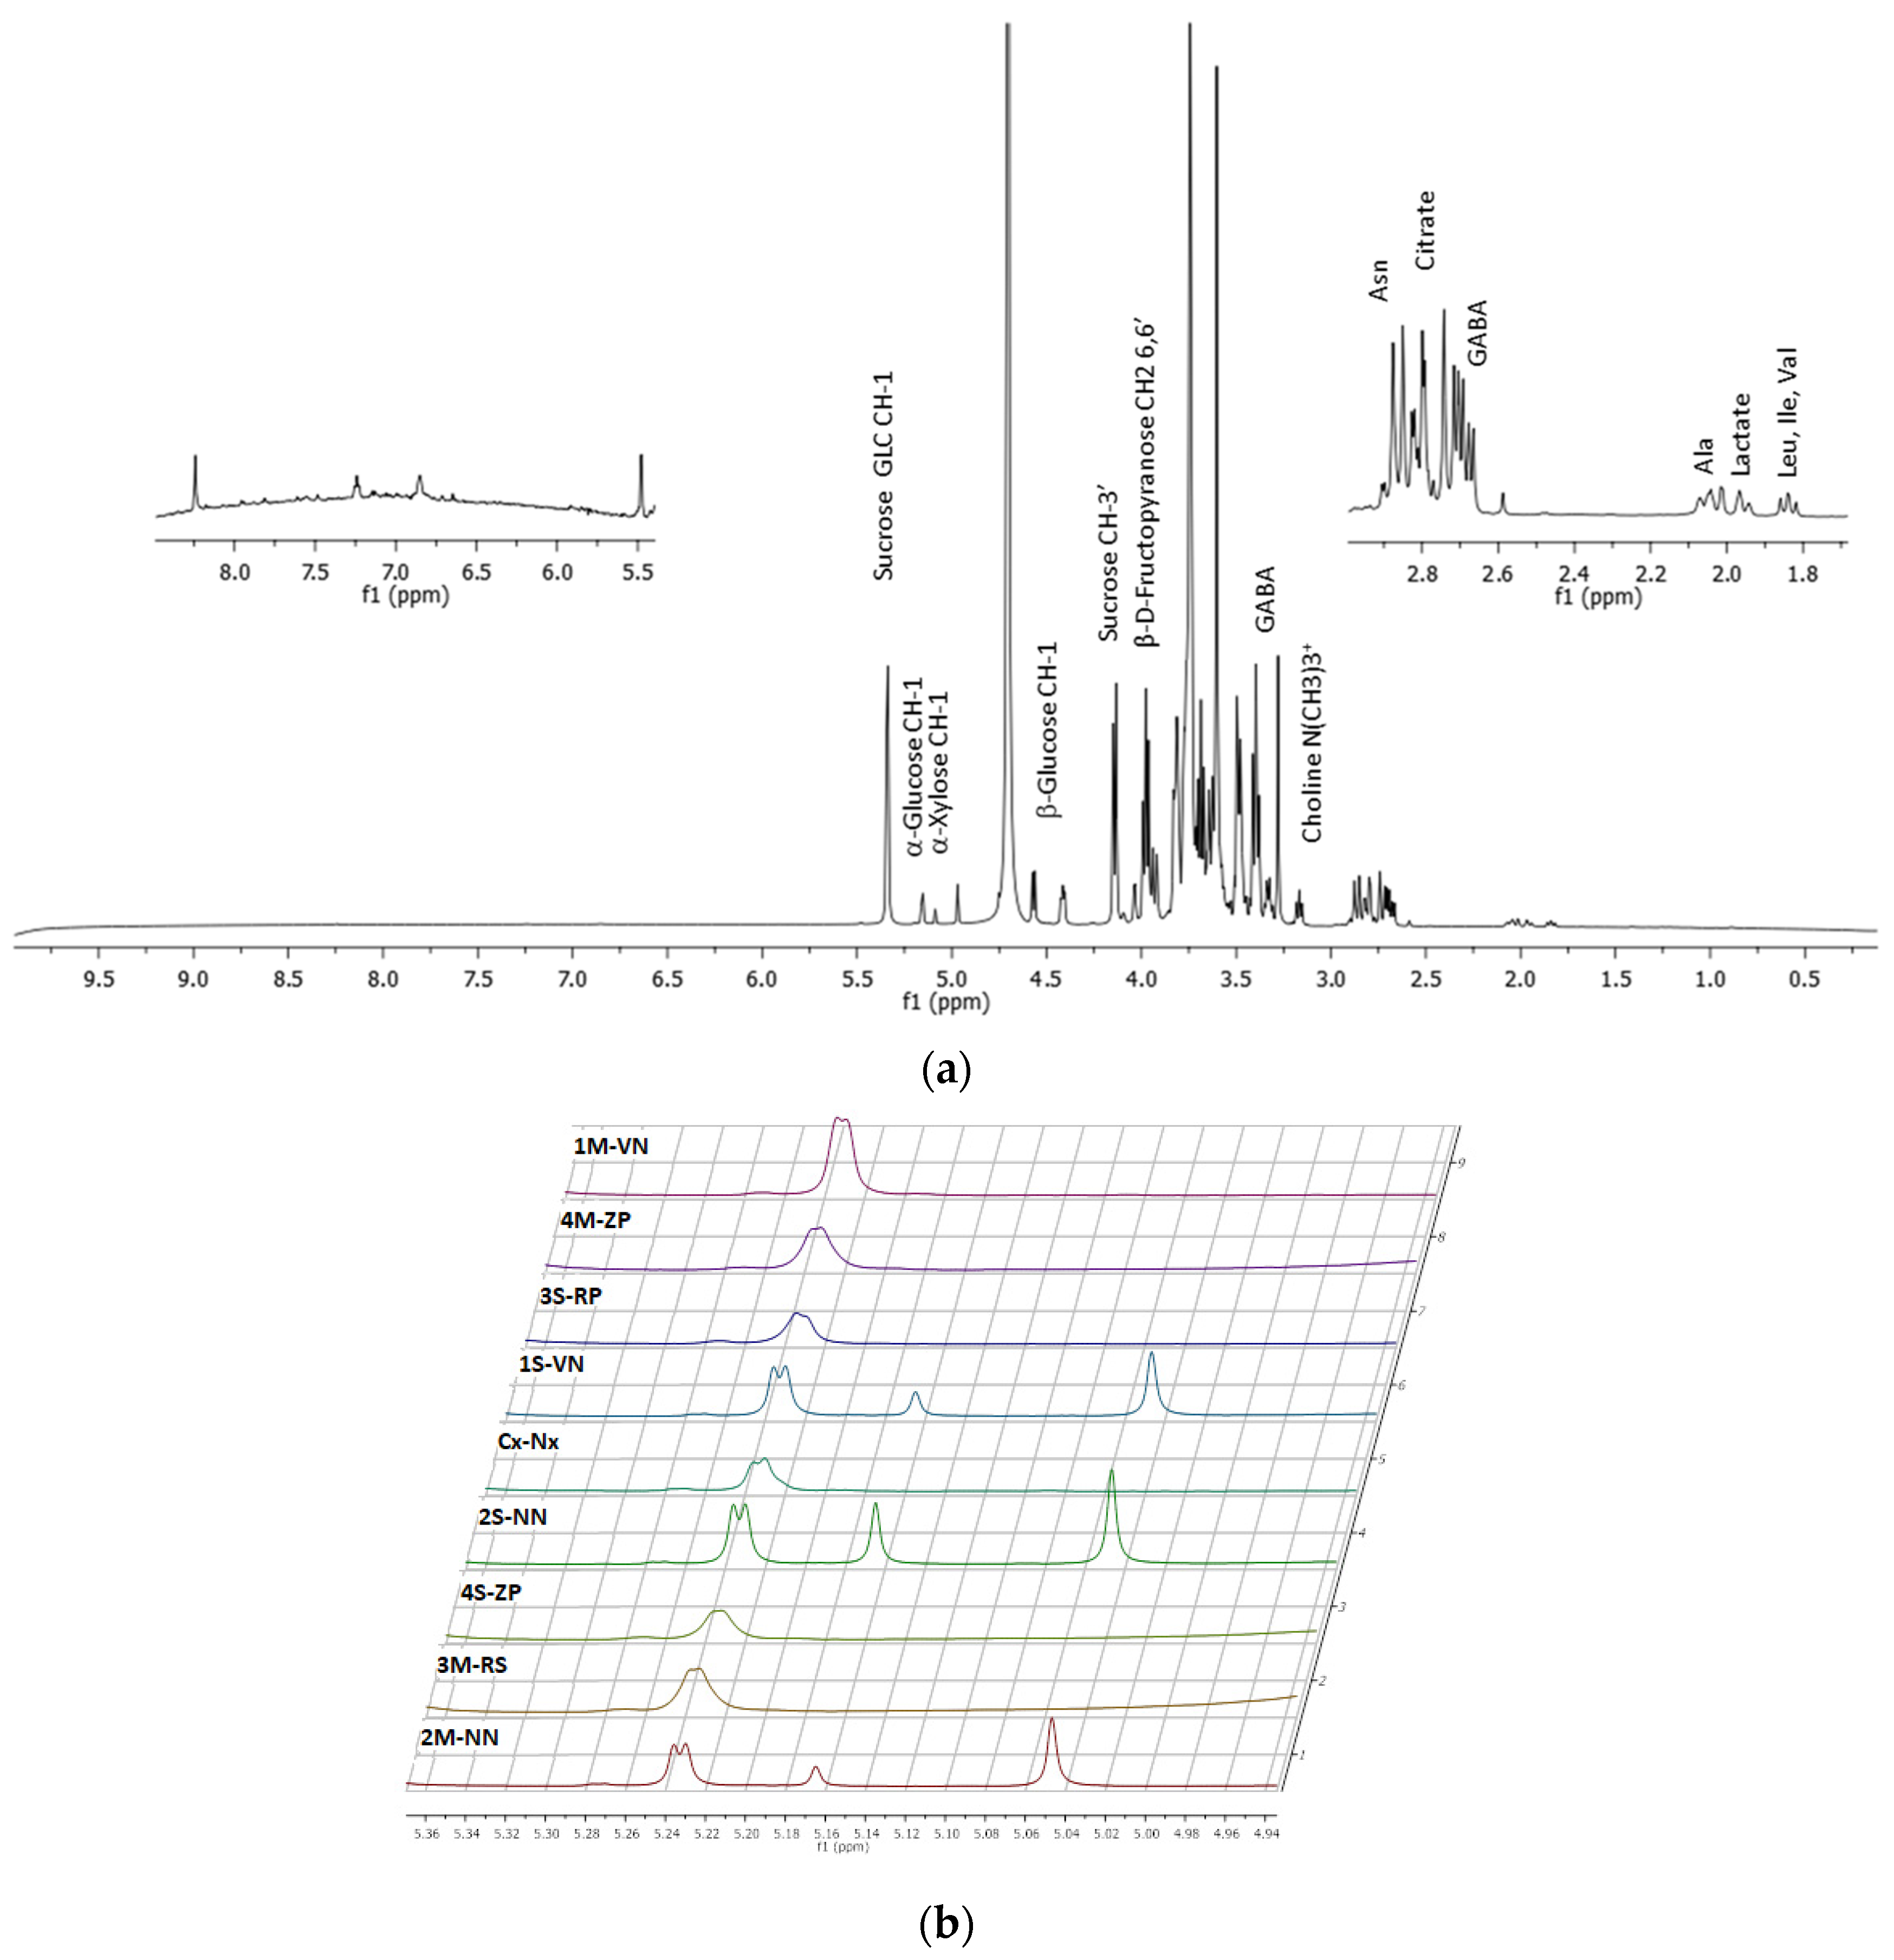
2.5. H NMR Analysis
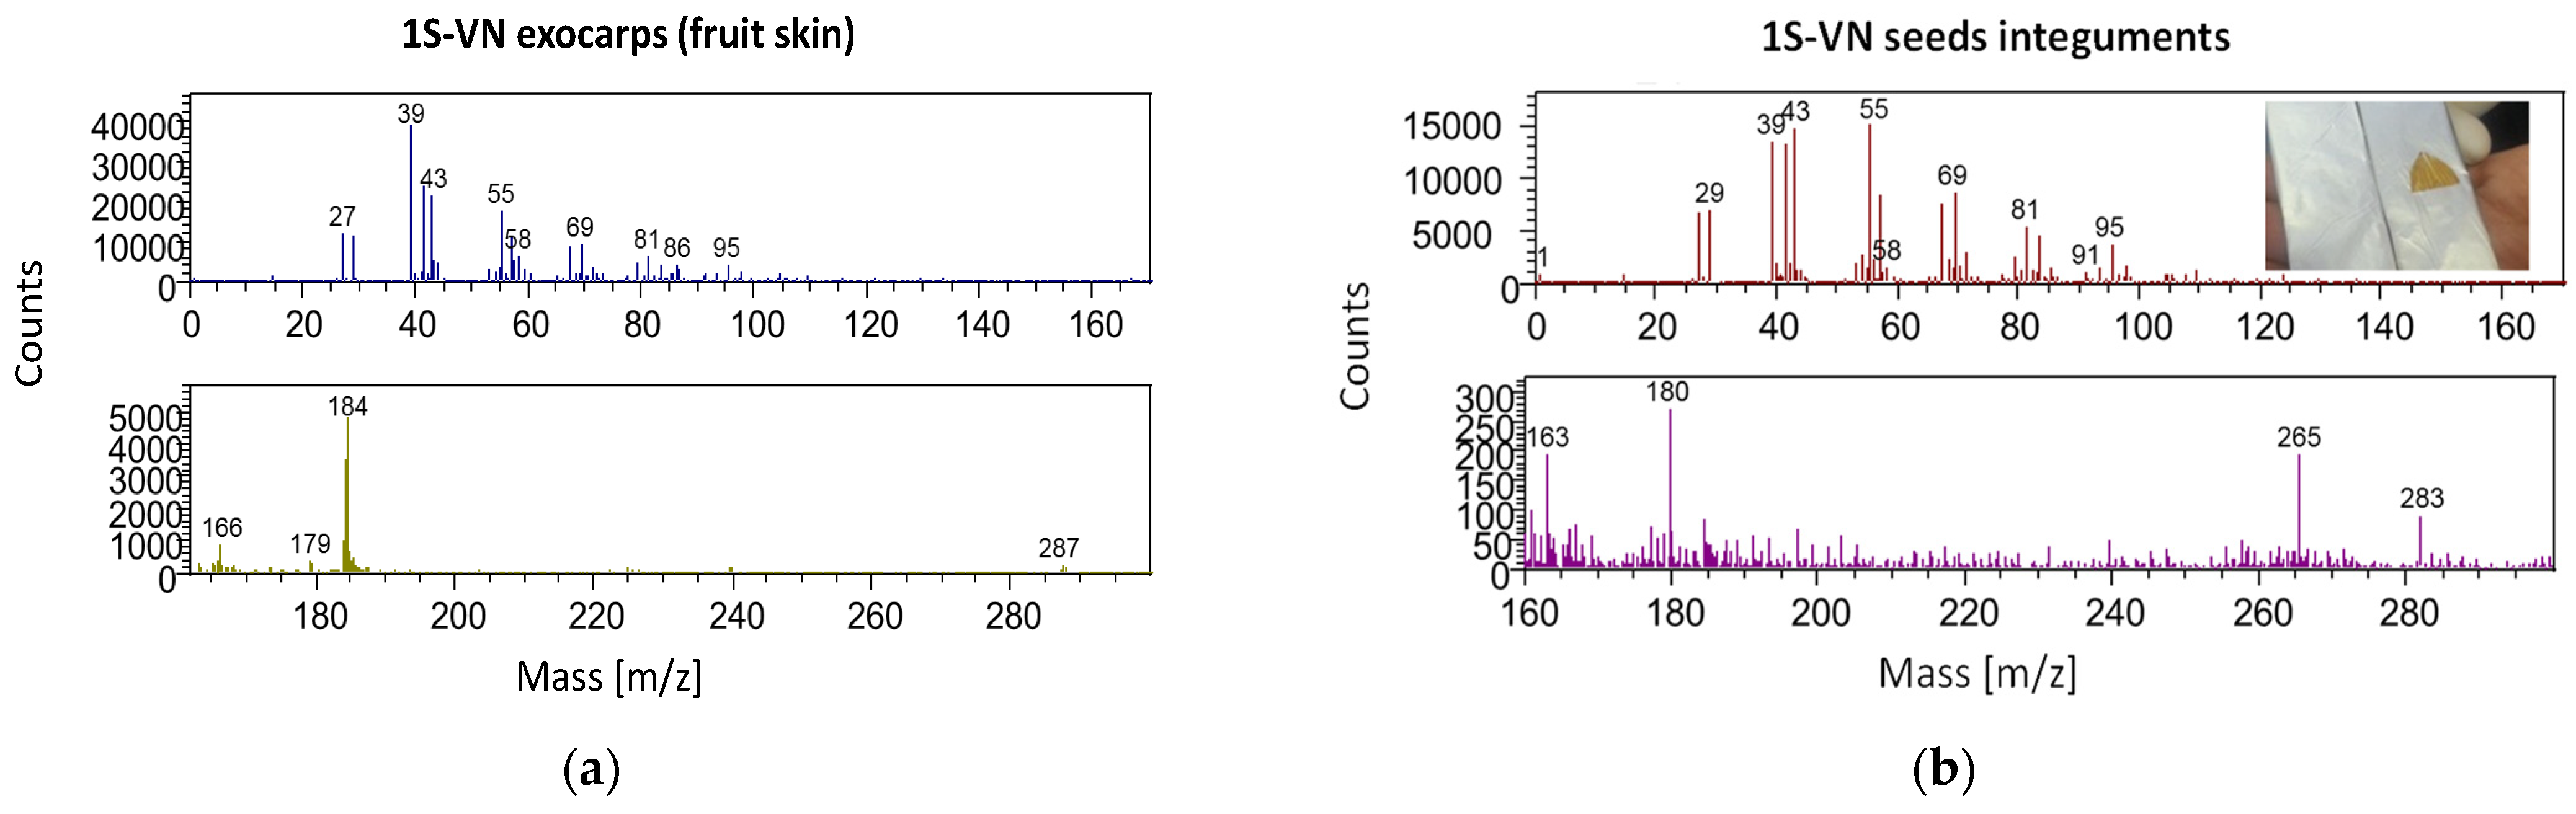
2.6. ToF-SIMS Analysis
3. Conclusions
- Thermo-gravimetric (TGA) and rheological analyses were very useful to characterize the ripening stage of the sample, revealing a great homogeneity among them.
- The determinations of the antioxidant capacity (TEAC method, quenching the ABTS•+ radical cation) and total polyphenols (Folin–Ciocalteu method) of mesocarp (flesh pulp) hydroalcoholic extracts revealed as both peaches and nectarines are excellent sources of natural antioxidant polyphenols.
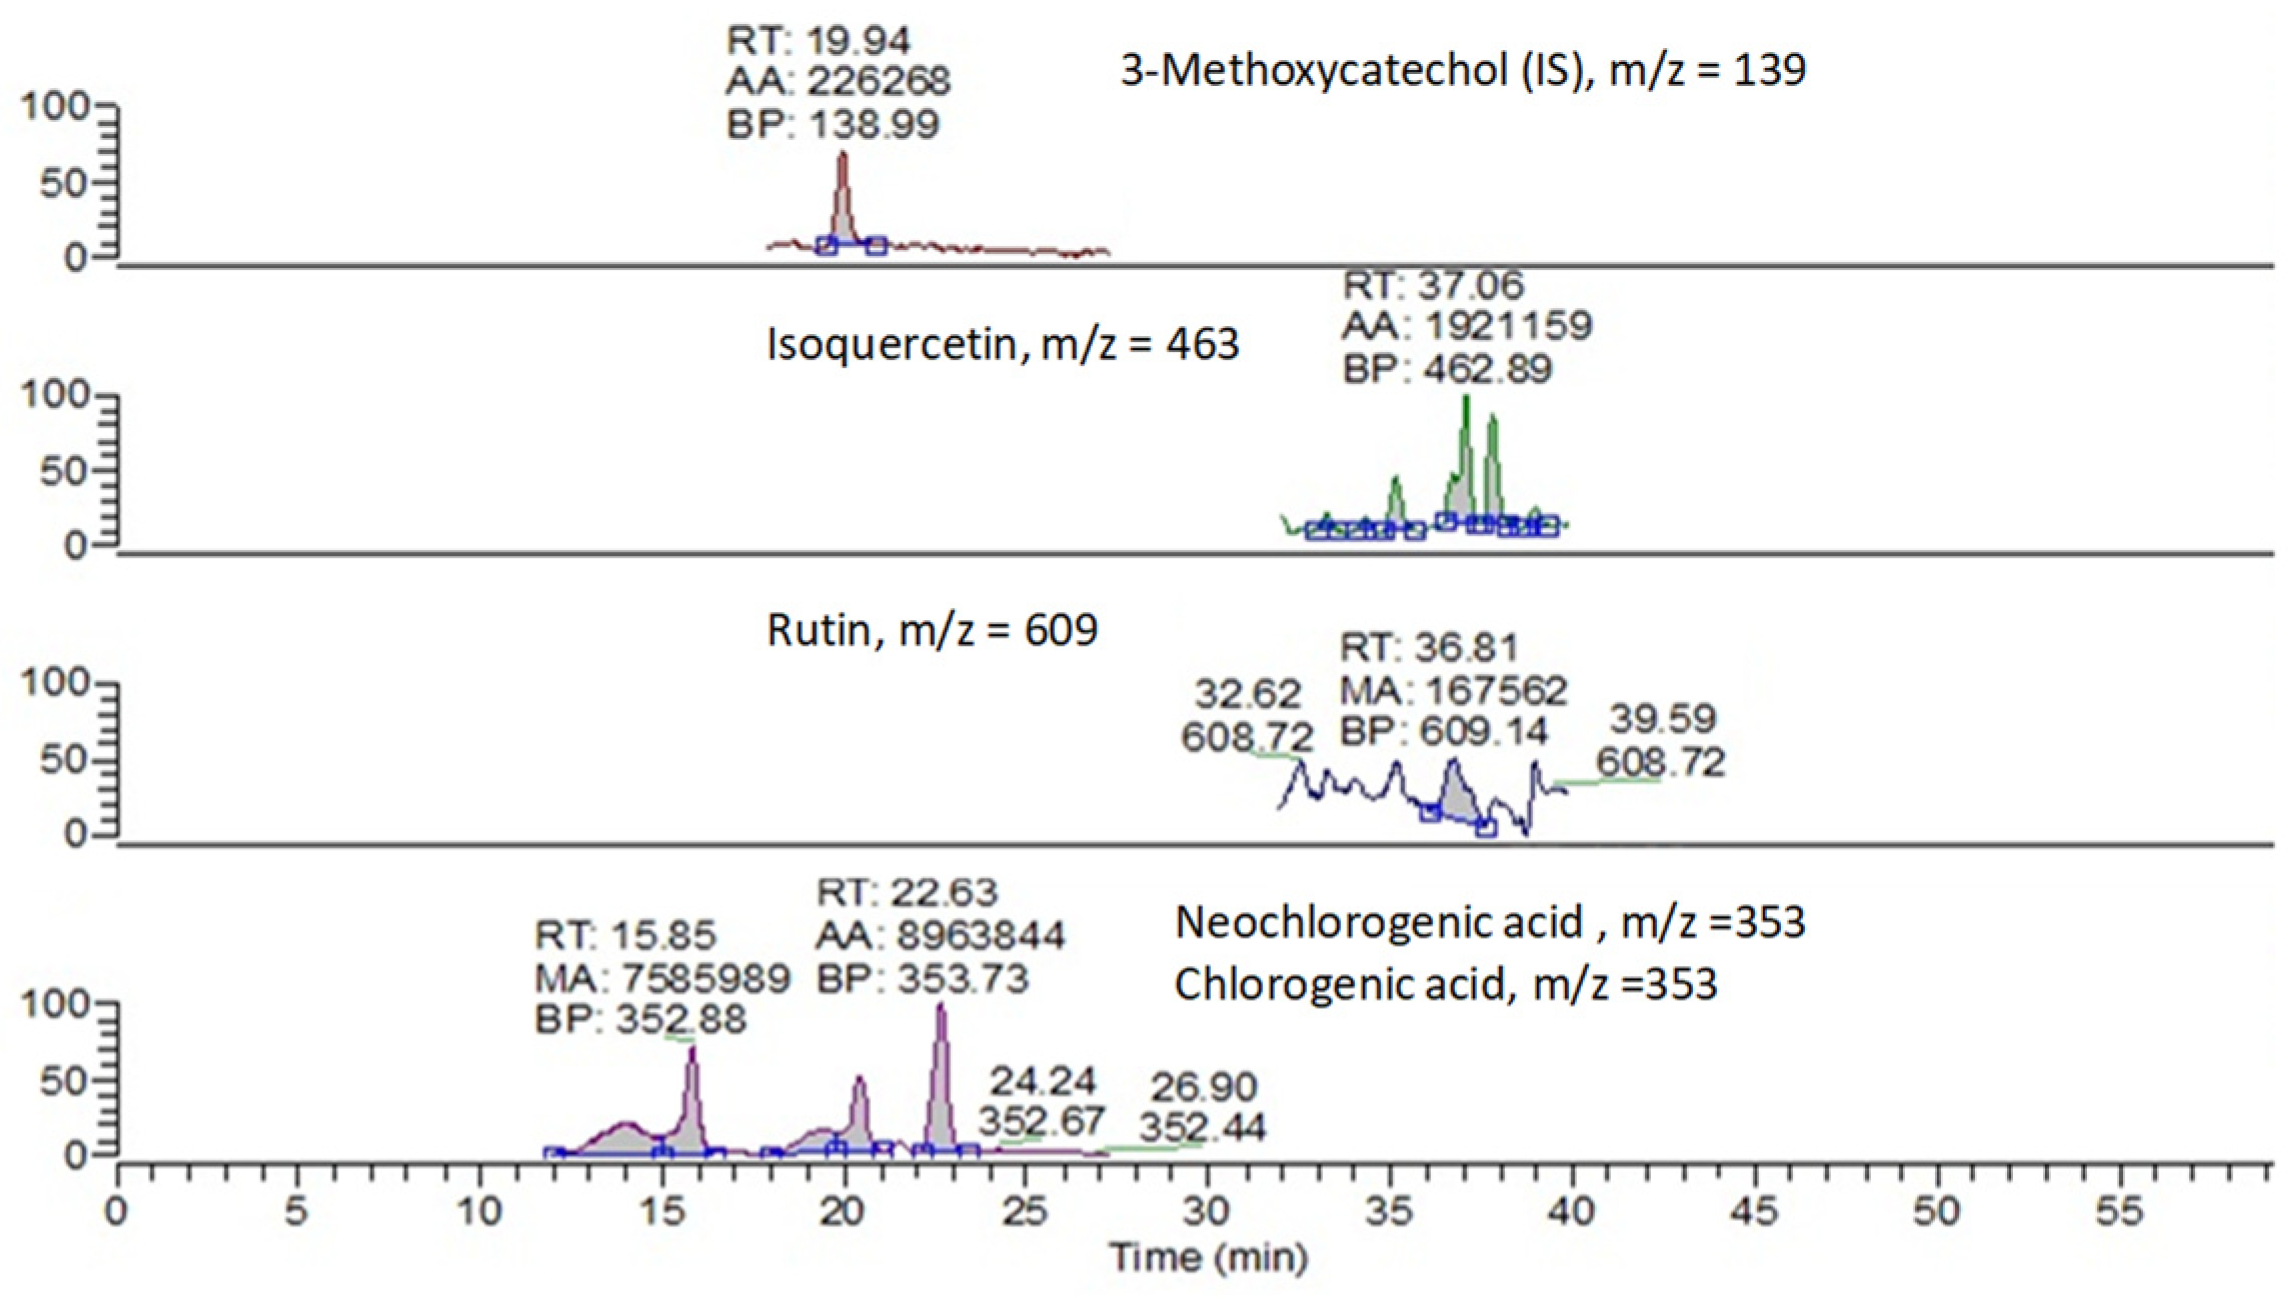
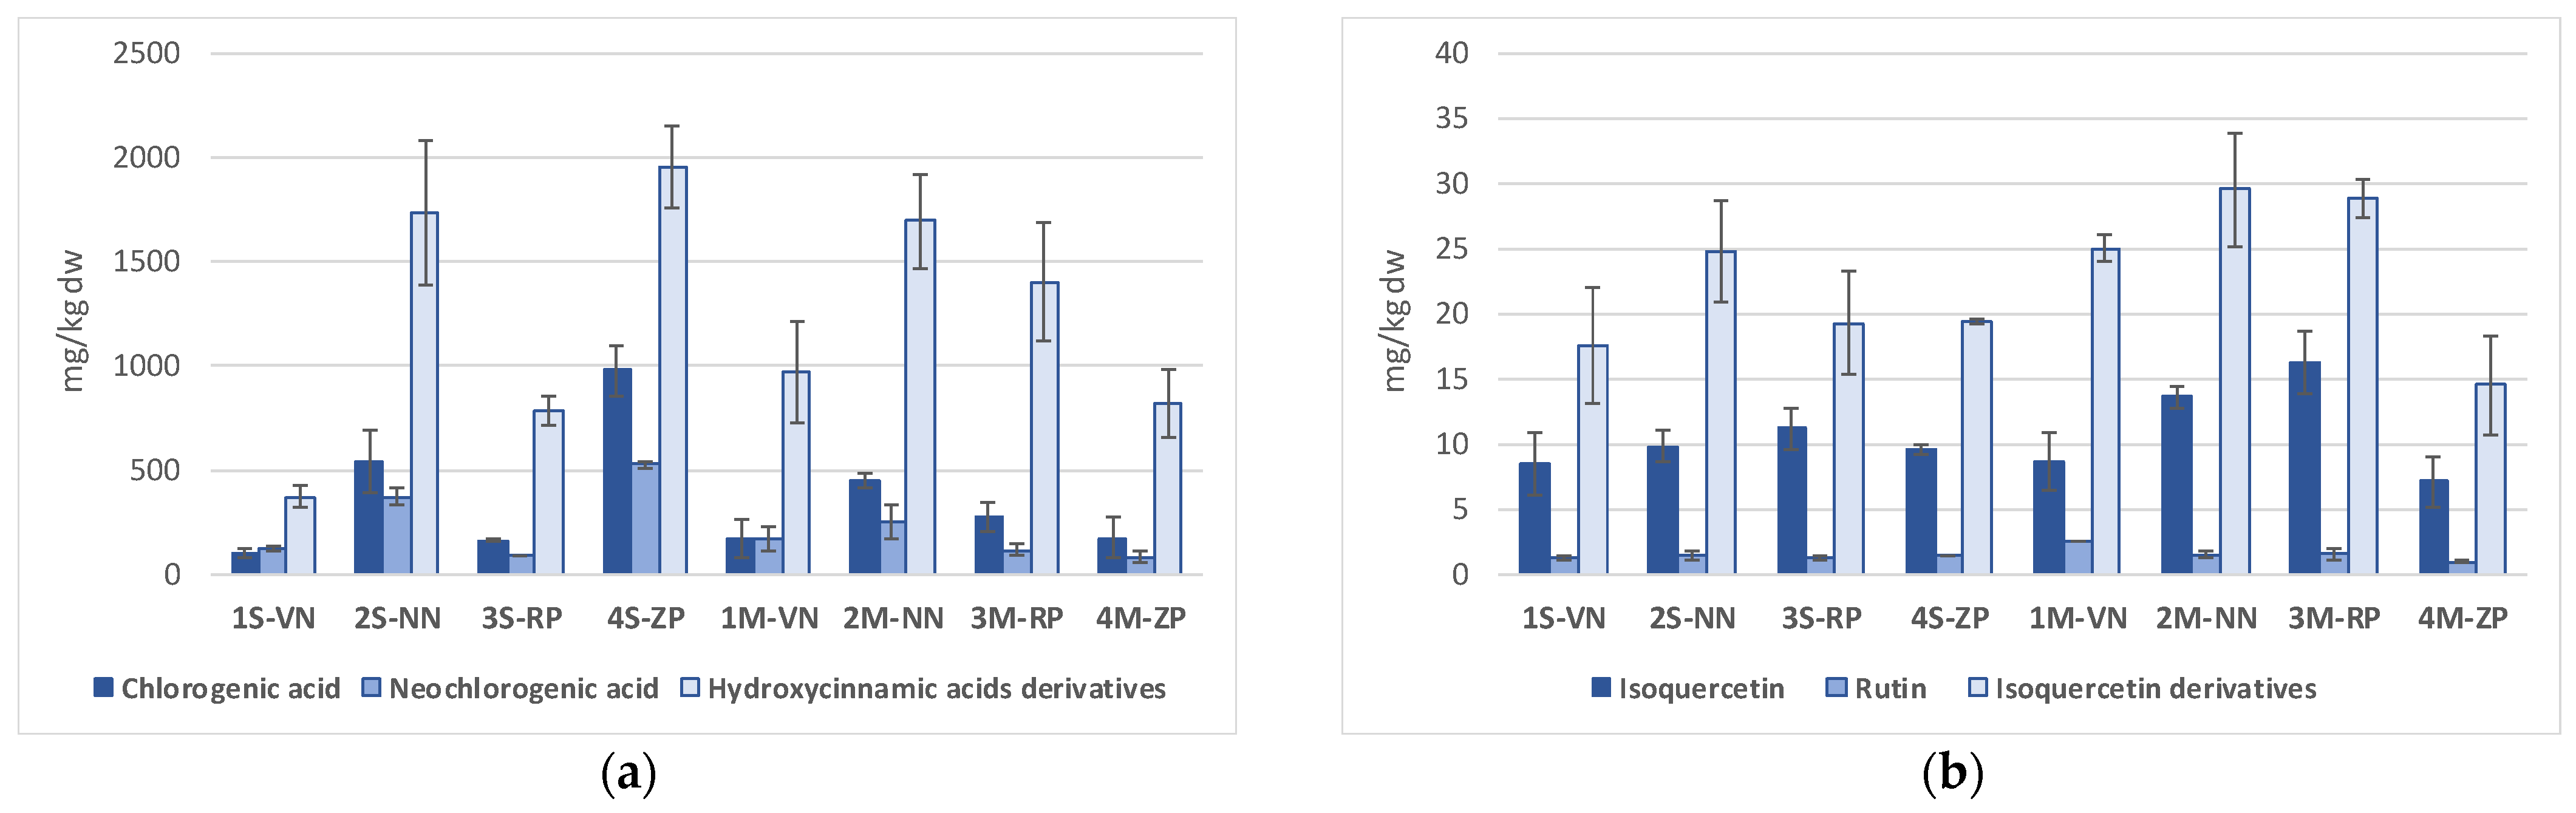
- HPLC-ESI-MS analysis on mesocarp (flesh pulp) hydroalcoholic extracts, allowed the identification and quantification of selected polyphenolic compounds, revealing a predominant relative distribution of the two chlorogenic and neochlorogenic acids and hydroxycinnamic acids derivatives, with a statistically significant linear relation with findings for antioxidant activity and total polyphenols.
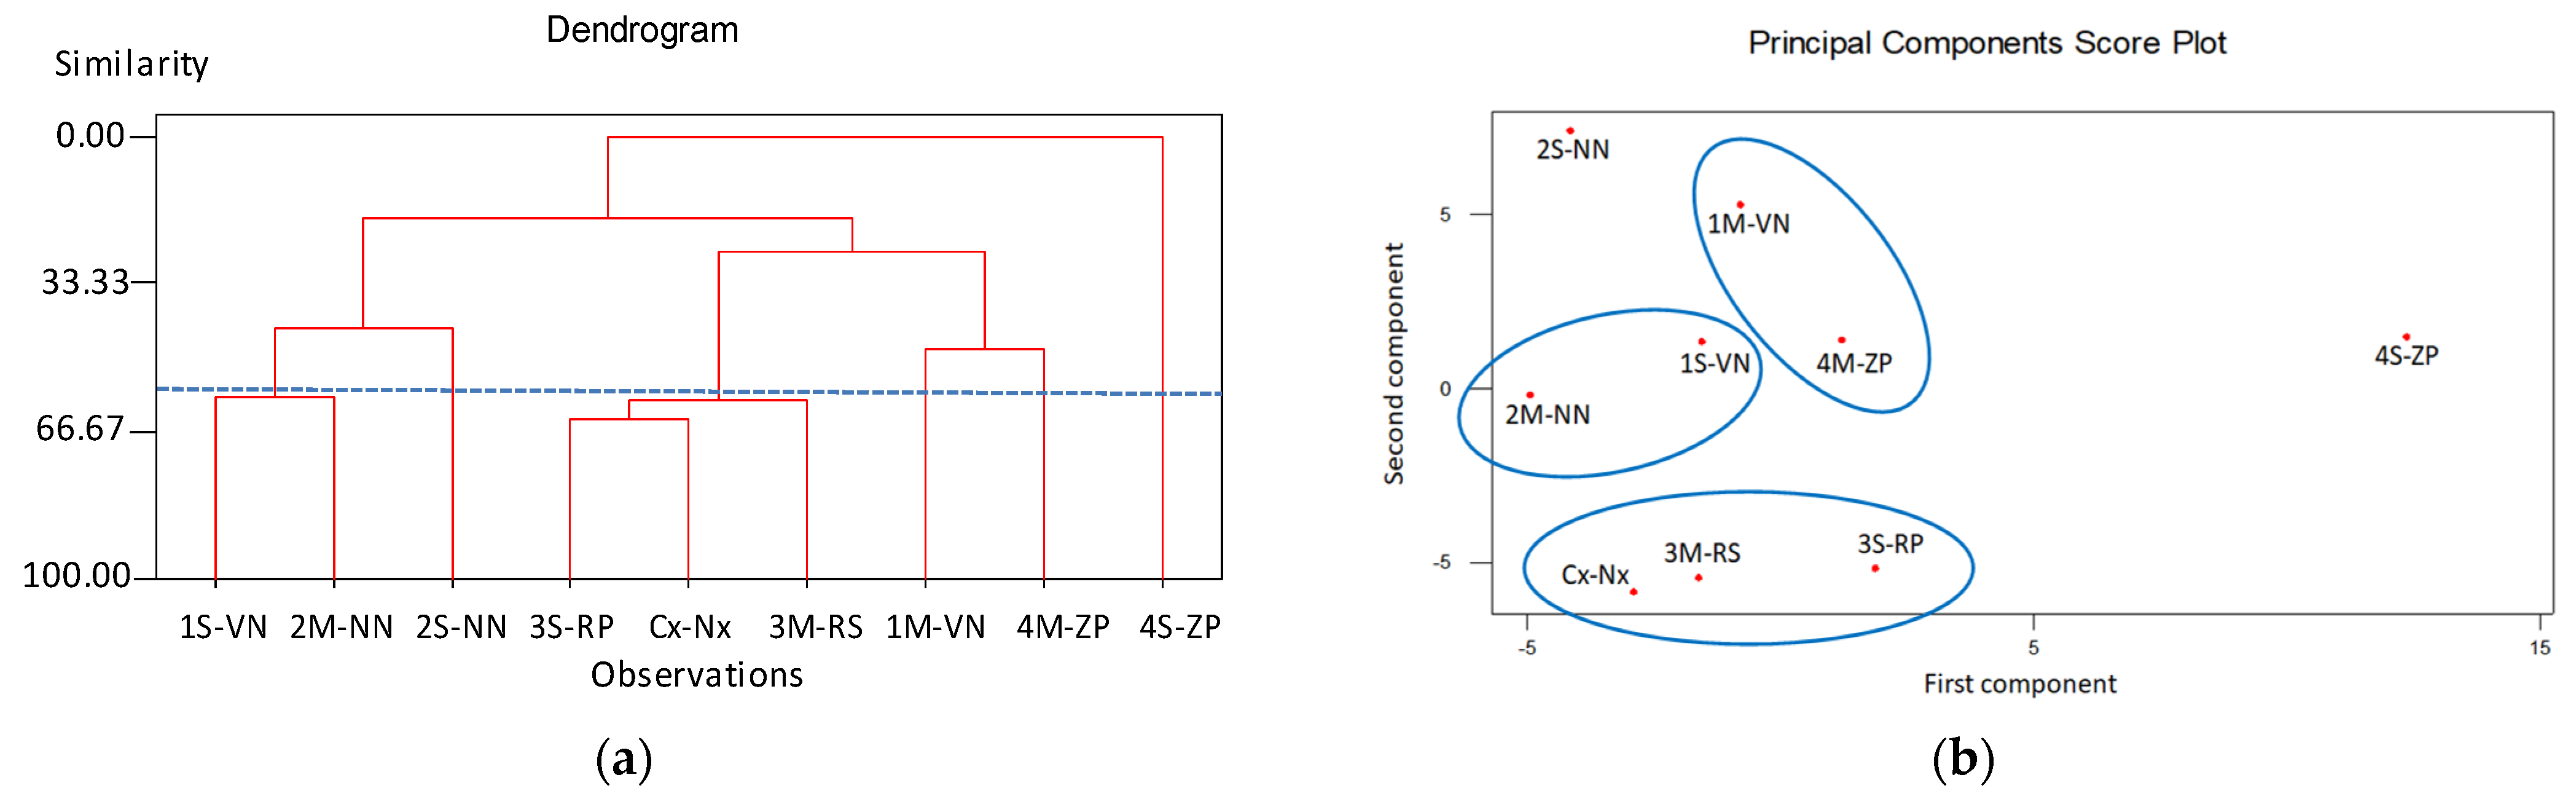
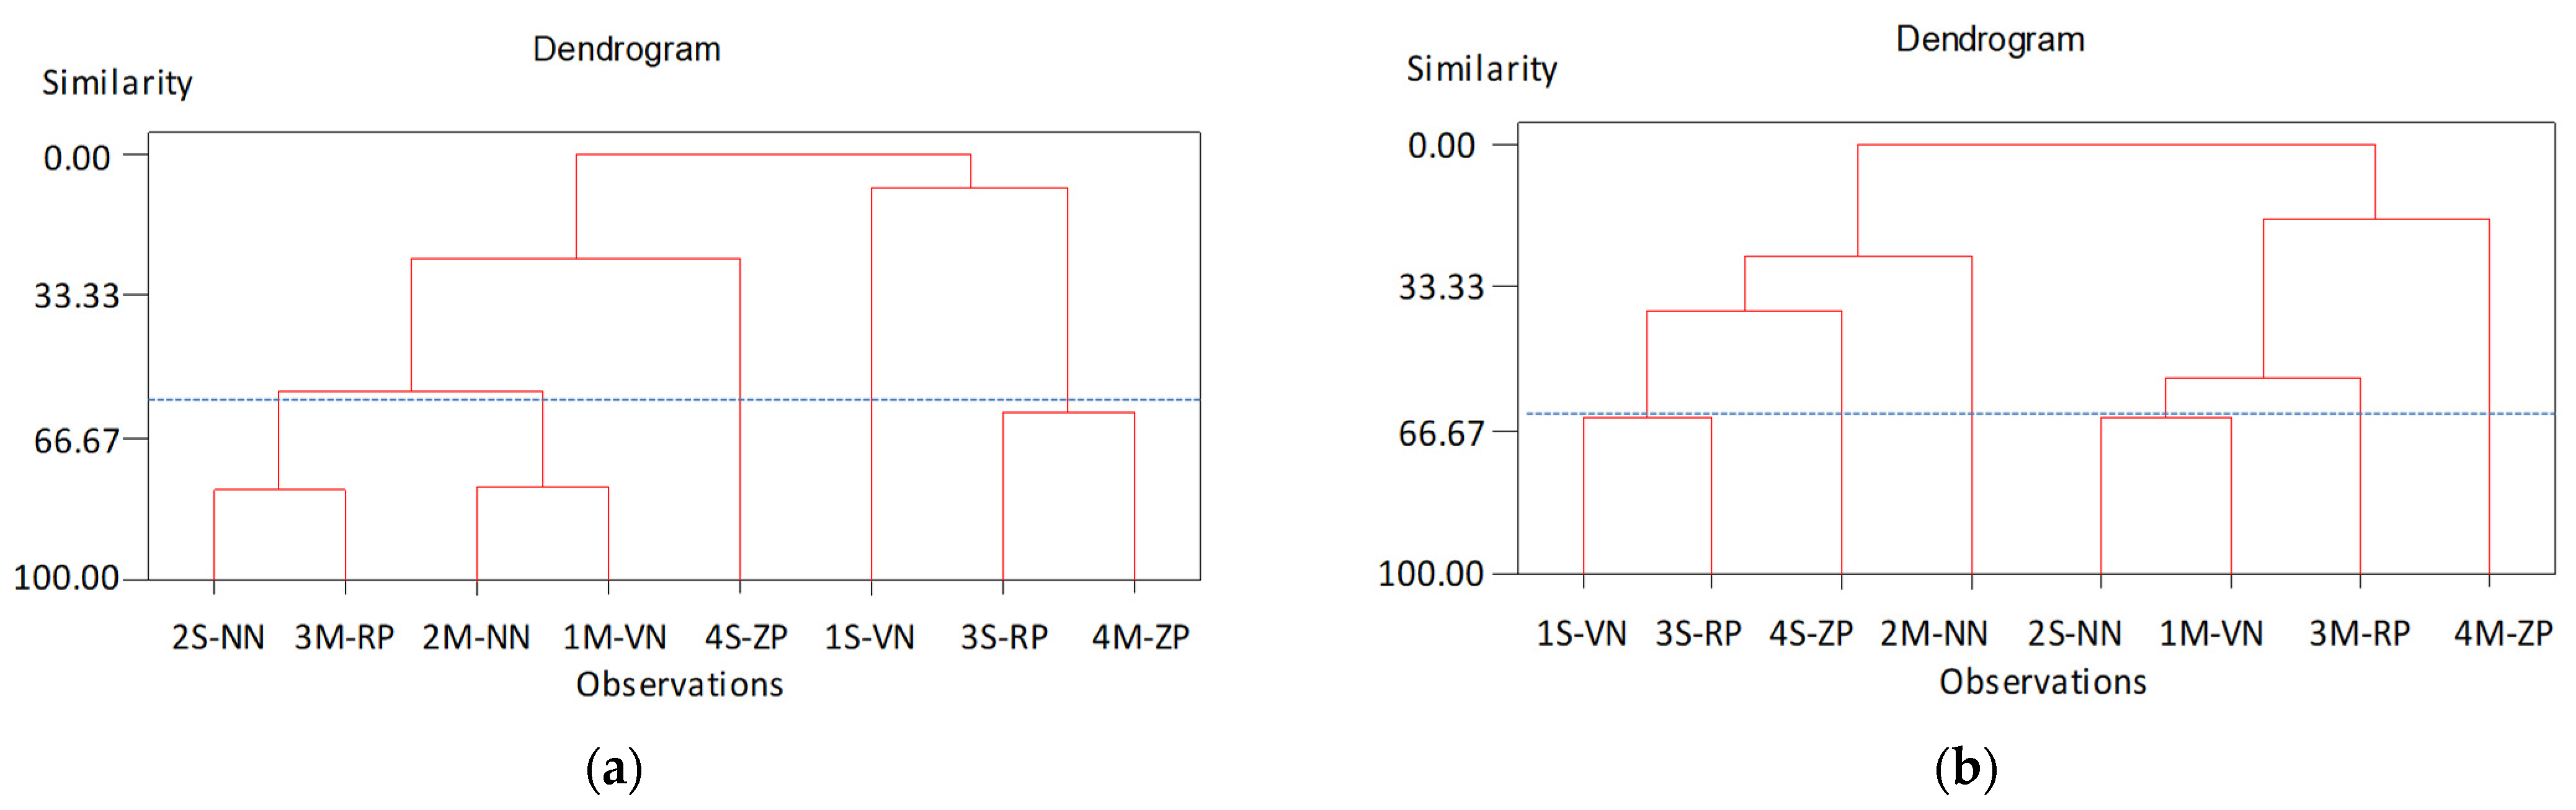
- 1H-NMR spectra revealed the presence of sugars (sucrose, α- and β-glucose, α-xylose, β-d-fructopyranose) among the main constituents of mesocarp extracts, presenting only minor differences in chemical shift and peaks intensity between samples, in accordance with a chemical composition very similar between peaches and nectarines. In particular, the samples of nectarine variety Venus and Nectaross showed additional peaks at 5.16 ppm and 5.05 ppm due to a different sugar composition (presence of α-xylose) and at 8.30 ppm in the aromatic signal region. The PCA analysis obtained by statistical processing of the 1H-NMR spectra, showed the presence of two outlier samples (ZeeLady-Peach and Nectaross-Nectarine, 2S-NN and 4S-ZP) in accordance with different chemical compositions observed in the high values of chlorogenic acid and neochlorogenic acid from chromatographic measurements. Furthermore, statistical Cluster analysis showed the grouping of samples for variety, between two samples of nectarines (one Nectaross and the other Venus) and between two samples of peaches (both RomeStar) with a significance level of 60%.
- In agreement with NMR data, IR measurements carried out on lyophilized samples of mesocarps (pulps) and exocarps (skins), confirmed the presence of characteristic bands of –COOH groups of organic acids, –OH groups of sugars, phenols, water, and peptide groups (NH–CO) (amide bands I, II and III) of the proteins. From the comparison between the IR spectra of skin with those of flesh pulp it was established that more intense absorption bands in the region 1800–1500 cm–1 of the exocarp are attributable to cyanidins, while the more intense absorption bands corresponding to sugars between 1200–800 cm–1 are obtained from the mesocarp.
- ToF-SIMS analysis confirmed the presence of cyanidin and phosphatidylcholine in the exocarps of peaches and nectarines, and cyanidin, phosphatidylcholine, oleic acid and coniferyl alcohol in the seed integuments. The cluster analysis obtained from the seed integuments constitutes a viable tool for the geographical characterization of peaches and nectarines. Furthermore, the PCA analysis (and cluster analysis), performed on seed integuments ToF-SIMS data, found two varietal grouping for nectarines and peaches and the presence of two outliers.
4. Materials and Methods
4.1. Chemicals
4.2. Sample Collection and Pre-Treatment
4.3. Rheology
4.4. Thermogravimetric Analysis (TGA)
4.5. Antioxidant Hydrofilic Componets Extraction Procedure
4.6. Antioxidant Activity Assays
4.6.1. Total Polyphenols (TPP) Content: Folin–Ciocalteu Assay
4.6.2. Trolox Equivalent Antioxidant Capacity (TEAC) Assays
4.7. HPLC-ESI-MS Analysis
4.8. Infrared Analysis (ATR-FTIR)
4.9. 1H-NMR Spectroscopy
4.10. Time-of-Flight Secondary Ion Mass Spectrometry (ToF-SIMS)
4.11. Statistical Data Analysis
Author Contributions
Funding
Institutional Review Board Statement
Informed Consent Statement
Data Availability Statement
Acknowledgments
Conflicts of Interest
Sample Availability
References
- Huang, H.; Cheng, Z.; Zhang, Z.; Wang, Y. History of cultivation and trends in China. In The Peach: Botany, Production and Uses, 1st ed.; Layne, D.R., Bassi, D., Eds.; CAB International: Oxfordshire, UK, 2008; pp. 37–60. ISBN 978-1-8459-3386-9. [Google Scholar]
- Food and Agriculture Organization of the United Nations. FAOSTAT Statistical Database; FAO: Rome, Italy, 1997.
- Byrne, D.; Raseira, M.; Bassi, D.; Piagnani, M.; Gasic, K.; Reighard, G.; Moreno, M.; Pérez, S. Peach. In Handbook of Plant Breeding; Fruit Breeding; Badenes, M.L., Byrne, D.H., Eds.; Springer Science+Business Media: New York, NY, USA, 2012; Chapter 14; Volume 8, pp. 505–569. ISBN 978-1-4419-0763-9. [Google Scholar]
- Li, Y.; Wang, L. Genetic resources, breeding programs in China, and gene mining of peach: A review. Hortic. Plant. J. 2020, 6, 205–215. [Google Scholar] [CrossRef]
- Bazzano, L.A.; He, J.; Ogden, L.G.; Loria, C.M.; Vupputuri, S.; Meyers, L.; Whelton, P.K. Fruit and vegetable intake and risk of cardiovascular disease in US adults: The first national health and nutrition examination survey epidemiologic follow-up study. Am. J. Clin. Nutr. 2002, 76, 93–99. [Google Scholar] [CrossRef] [Green Version]
- Boeing, H.; Bechthold, A.; Bub, A.; Ellinger, S.; Haller, D.; Kroke, A.; Kroke, A.; Leschik-Bonnet, E.; Müller, M.J.; Oberritter, H.; et al. Critical review: Vegetables and fruit in the prevention of chronic diseases. Eur. J. Nutr. 2012, 51, 637–663. [Google Scholar] [CrossRef] [Green Version]
- Aune, D.; Giovannucci, E.; Boffetta, P.; Fadnes, L.T.; Keum, N.N.; Norat, T.; Greenwood, D.C.; Riboli, E.; Vatten, L.J.; Tonstad, S. Fruit and vegetable intake and the risk of cardiovascular disease, total cancer and all-cause mortality—A systematic review and dose-response meta-analysis of prospective studies. Int. J. Epidemiol. 2017, 46, 1029–1056. [Google Scholar] [CrossRef]
- Miller, V.; Mente, A.; Dahghan, M.; Rangarajan, S.; Zhang, X.; Swaminathan, S.; Dagenais, G.; Gupta, R.; Mohan, V.; Lear, S.; et al. on behalf of the Prospective Urban Rural Epidemiology (PURE) study investigators. Fruit, vegetable, and legume intake, and cardiovascular disease and deaths in 18 countries (PURE): A prospective cohort study. Lancet 2017, 390, 2037–2049. [Google Scholar] [CrossRef] [Green Version]
- Zhao, X.; Zhang, W.; Yin, X.; Su, M.; Sun, C.; Li, X.; Chen, K. Phenolic composition and antioxidant properties of different peach [Prunus persica (L.) Batsch] cultivars in China. Int. J. Mol. Sci. 2015, 16, 5762–5778. [Google Scholar] [CrossRef] [PubMed] [Green Version]
- Noratto, G.; Porter, W.; Byrne, D.; Cisneros-Zevallos, L. Identifying peach and plum polyphenols with chemopreventive potential against estrogen-independent breast cancer cells. J. Agric. Food Chem. 2009, 57, 5219–5226. [Google Scholar] [CrossRef]
- Mokrani, A.; Krisa, S.; Cluzet, S.; Da Costa, G.; Temsamani, H.; Renouf, E.; Richard, T. Phenolic contents and bioactive potential of peach fruit extracts. Food Chem. 2016, 202, 212–220. [Google Scholar] [CrossRef] [PubMed]
- Tomás-Barberán, F.A.; Gil, M.I.; Cremin, P.; Waterhouse, A.L.; Hess-Pierce, B.; Kader, A.A. HPLC–DAD–ESIMS analysis of phenolic compounds in nectarines, peaches, and plums. J. Agric. Food Chem. 2001, 49, 4748–4760. [Google Scholar] [CrossRef]
- Gil, M.I.; Tomás-Barberán, F.A.; Hess-Pierce, B.; Kader, A.A. Antioxidant capacities, phenolic compounds, carotenoids, and vitamin C contents of nectarine, peach, and plum cultivars from California. J. Agric. Food Chem. 2002, 50, 4976–4982. [Google Scholar] [CrossRef]
- Infante, R.; Contador, L.; Rubio, P.; Aros, D.; Peña-Neira, Á. Postharvest sensory and phenolic characterization of ‘Elegant Lady’ and ‘Carson’ peaches. Chilean J. Agric. Res. 2011, 71, 445–451. [Google Scholar] [CrossRef]
- Stojanovic, B.T.; Mitic, S.S.; Stojanovic, G.S.; Mitic, M.N.; Kostic, D.A.; Paunovic, D.D.; Arsic, B.B. Phenolic profile and antioxidant activity of pulp and peel from peach and nectarine fruits. Not. Bot. Horti Agrobot. Cluj Napoca 2016, 44, 175–182. [Google Scholar] [CrossRef] [Green Version]
- Liao, X.; Greenspan, P.; Pegg, R.B. Characterizing the phenolic constituents and antioxidant capacity of Georgia peaches. Food Chem. 2019, 271, 345–353. [Google Scholar] [CrossRef] [PubMed]
- Bianchi, T.; Weesepoel, Y.; Koot, A.; Iglesias, I.; Eduardo, I.; Gratacos-Cubarsi, M.; Guerrero, L.; Hortos, M.; van Ruth, S. Investigation of the aroma of commercial peach (Prunus persica L. Batsch) types by proton transfer Reaction-Mass Spectrometry (PTR-MS) and sensory analysis. Food Res. Int. 2017, 99, 133–146. [Google Scholar] [CrossRef] [PubMed] [Green Version]
- Tamasi, G.; Baratto, M.C.; Bonechi, C.; Byelyakova, A.; Pardini, A.; Donati, A.; Leone, G.; Consumi, M.; Lamponi, S.; Magnani, A.; et al. Chemical characterization and antioxidant properties of products and by-products from Olea europaea L. Food Sci. Nutr. 2019, 7, 2907–2920. [Google Scholar] [CrossRef] [PubMed] [Green Version]
- Ridolfi, R.; Kneller, M.; Donati, A.; Pulselli, R.M. The greenhouse gas balance of the Province of Siena. J. Environ. Manag. 2008, 86, 365–371. [Google Scholar] [CrossRef]
- Li, B.; Bhandari, D.R.; Janfelt, C.; Rompp, A.; Spengler, B. Natural products in Glycyrrhiza glabra (licorice) rhizome imaged at the cellular level by atmospheric pressure matrix-assisted laser desorption/ionization tandem mass spectrometry imaging. Plant. J. 2014, 80, 161–171. [Google Scholar] [CrossRef]
- Shroff, R.; Vergara, F.; Muck, A.; Svatos, A.; Gershenzon, J. Nonuniform distribution of glucosinolates in Arabidopsis thaliana leaves has important consequences for plant defense. Proc. Natl. Acad. Sci. USA 2008, 105, 6196–6201. [Google Scholar] [CrossRef] [Green Version]
- Scordino, M.; Sabatino, L.; Muratore, A.; Belligno, A.; Gagliano, G. Phenolic characterization of Sicilian yellow flesh peach (Prunus persica L.) cultivars at different ripening stages. J. Food Qual. 2012, 35, 255–262. [Google Scholar] [CrossRef]
- Francini, A.; Romeo, S.; Cifelli, M.; Gori, D.; Domenici, V.; Sebastiani, L. 1H NMR and PCA-based analysis revealed variety dependent changes in phenolic contents of apple fruit after drying. Food Chem. 2017, 221, 1206–1213. [Google Scholar] [CrossRef]
- Prasanna, V.; Prabha, T.N.; Tharanathan, R.N. Fruit ripening phenomena–an overview. Crit. Rev. Food Sci. Nutr. 2007, 47, 1–19. [Google Scholar] [CrossRef] [PubMed]
- Nambi, V.E.; Thangavel, K.; Manickavasagan, A.; Shahir, S. Comprehensive ripeness-index for prediction of ripening level in mangoes by multivariate modelling of ripening behaviour. Int. Agrophys. 2017, 31, 35–44. [Google Scholar] [CrossRef] [Green Version]
- Padda, M.S.; do Amarante, C.V.; Garcia, R.M.; Slaughter, D.C.; Mitcham, E.J. Methods to analyze physicochemical changes during mango ripening: A multivariate approach. Postharvest Biol. Technol. 2011, 62, 267–274. [Google Scholar] [CrossRef]
- Vásquez-Caicedo, A.L.; Sruamsiri, P.; Carle, R.; Neidhart, S. Accumulation of all-trans-β-carotene and its 9-cis and 13-cis stereoisomers during postharvest ripening of nine Thai mango cultivars. J. Agric. Food Chem. 2005, 53, 4827–4835. [Google Scholar] [CrossRef]
- Rungpichayapichet, P.; Mahayothee, B.; Nagle, M.; Khuwijitjaru, P.; Müller, J. Robust NIRS models for nondestructive prediction of postharvest fruit ripeness and quality in mango. Postharvest Biol. Technol. 2016, 111, 31–40. [Google Scholar] [CrossRef]
- Heyes, J.A.; Sealey, D.F. Textural changes during nectarine (Prunus persica) development and ripening. Sci. Hortic. 1996, 65, 49–58. [Google Scholar] [CrossRef]
- Nambi, V.E.; Thangavel, K.; Manickavasagan, A.; Geetha, V. Texture and rheological changes of Indian mango cultivars during ripening. Postharvest Biol. Technol. 2016, 117, 152–160. [Google Scholar] [CrossRef]
- Leone, G.; Consumi, M.; Pepi, S.; Lamponi, S.; Bonechi, C.; Tamasi, G.; Donati, A.; Rossi, C.; Magnani, A. Alginate–gelatin formulation to modify lovastatin release profile from red yeast rice for hypercholesterolemia therapy. Ther. Deliv. 2017, 8, 843–854. [Google Scholar] [CrossRef]
- Capel, E.L.; de la Rosa Arranz, J.M.; Gonzalez-Vila, F.J.; Gonzalez-Perez, J.A.; Manning, D.A.C. Elucidation of different forms of organic carbon in marine sediments from the Atlantic coat of Spain using thermal analysis coupled to isotope ratio and quadrupole mass spectrometry. Org. Geochem. 2006, 37, 1983–1994. [Google Scholar] [CrossRef] [Green Version]
- Handa, A.K.; Tiznado-Hernández, M.-E.; Mattoo, A.K. Fruit development and ripening: A molecular perspective. In Plant Biotechnology and Agriculture: Prospects for the 21st Century, 1st ed.; Altman, A., Hasegawa, P.M., Eds.; Academic Press: Boston, MA, USA, 2012; pp. 405–424. [Google Scholar] [CrossRef]
- Durst, R.W.; Weaver, G.W. Nutritional content of fresh and canned peaches. J. Sci. Food Agric. 2013, 93, 593–603. [Google Scholar] [CrossRef]
- Della Valle, A.Z.; Mignani, I.; Spinardi, A.; Galvano, F.; Ciappellano, S. The antioxidant profile of three different peaches cultivars (Prunus persica) and their short-term effect on antioxidant status in human. Eur. Food Res. Technol. 2007, 225, 167–172. [Google Scholar] [CrossRef]
- Di Vaio, C.; Graziani, G.; Marra, L.; Cascone, A.; Ritieni, A. Antioxidant capacities, carotenoids, and polyphenols evaluation of fresh and refrigerated peach and nectarine cultivars from Italy. Eur. Food Res. Technol. 2008, 227, 1225–1231. [Google Scholar] [CrossRef]
- Montevecchi, G.; Vasile Simone, G.; Masino, F.; Bignami, C.; Antonelli, A. Physical and chemical characterization of Pescabivona, a Sicilian white flesh peach cultivar [Prunus persica (L.) Batsch]. Food Res. Int. 2012, 45, 123–131. [Google Scholar] [CrossRef]
- Aubert, C.; Bony, P.; Chalot, G.; Landry, P.; Lurol, S. Effects of storage temperature, storage duration, and subsequent ripening on the physicochemical characteristics, volatile compounds, and phytochemicals of western red nectarine (Prunus persica L. Batsch). J. Agric. Food Chem. 2014, 62, 4707–4724. [Google Scholar] [CrossRef]
- Rupasinghe, H.P.V.; Clegg, S. Total antioxidant capacity, total phenolic content, mineral elements, and histamine concentrations in wines of different fruit sources. J. Food Comp. Anal. 2007, 20, 133–137. [Google Scholar] [CrossRef]
- Andreotti, C.; Ravaglia, D.; Ragaini, A.; Costa, G. Phenolic compounds in peach (Prunus persica) cultivars at harvest and during fruit maturation. Ann. Appl. Biol. 2008, 153, 11–23. [Google Scholar] [CrossRef]
- Bureau, S.; Ruiz, D.; Reich, M.; Gouble, B.; Bertrand, D.; Audergon, J.-M.; Renard, C.M.G.C. Application of ATR-FTIR for a rapid and simultaneous determination of sugars and organic acids in apricot fruit. Food Chem. 2009, 115, 1133–1140. [Google Scholar] [CrossRef]
- Capitani, D.; Proietti, N.; Sobolev, A.P.; Antiochia, R.; Delfini, M.; Sciubba, F.; Miccheli, A.; De Salvador, F.R.; Mannina, L. Nuclear magnetic resonance-based approach to fruit characterisation: The case studies of kiwifruits and peaches. Spectrosc. Eur. 2013, 25, 6–12. [Google Scholar]
- Capitani, D.; Sobolev, A.P.; Tomassini, A.; Sciubba, F.; De Salvador, F.R.; Mannina, L.; Delfini, M. Peach fruit: Metabolomic comparative analysis of two varieties with different resistances to insect attacks by NMR spectroscopy. J. Agric. Food Chem. 2013, 61, 1718–1726. [Google Scholar] [CrossRef]
- Santucci, C.; Tenori, L.; Luchinat, L. NMR fingerprinting as a tool to evaluate post-harvest time-related changes of peaches, tomatoes and plums. Food Res. Int. 2015, 75, 106–114. [Google Scholar] [CrossRef] [PubMed]
- Leone, G.; Consumi, M.; Pepi, S.; Pardini, A.; Bonechi, C.; Tamasi, G.; Donati, A.; Lamponi, S.; Rossi, C.; Magnani, A. Enriched Gellan Gum hydrogel as visco-supplement. Carbohydr. Polym. 2020, 227, 115347. [Google Scholar] [CrossRef]
- Singleton, V.L.; Rossi, J.A., Jr. Colorimetry of total phenolics with phosphomolybdic-phosphotungstic acid reagents. Am. J. Enol. Vitic. 1965, 16, 144–158. [Google Scholar]
- Gião, M.S.; González-Sanjosé, M.L.; Rivero-Pérez, M.D.; Pereira, C.I.; Pintado, M.E.; Malcata, F.X. Infusions of Portuguese medicinal plants: Dependence of final antioxidant capacity and phenol content on extraction features. J. Sci. Food Agric. 2007, 87, 2638–2647. [Google Scholar] [CrossRef]
- Tamasi, G.; Pardini, A.; Bonechi, C.; Donati, A.; Pessina, F.; Marcolongo, P.; Gamberucci, A.; Leone, G.; Consumi, M.; Magnani, A.; et al. Characterization of nutraceutical components in tomatoes pulp, skin and locular gel. Eur. Food Res. Technol. 2019, 245, 907–918. [Google Scholar] [CrossRef]
- Re, R.; Pellegrini, N.; Proteggente, A.; Pannala, A.; Yang, M.; Rice-Evans, C. Antioxidant activity applying an improved ABTS radical cation decolorization assay. Free Rad. Biol. Med. 1999, 26, 1231–1237. [Google Scholar] [CrossRef]
- Pellegrini, N.; Re, R.; Yang, M.; Rice-Evans, C. Screening of dietary carotenoids and carotenoid-rich fruit extracts for antioxidant activities applying 2,2′-azinobis(3-ethylenebenzothiazoline-6-sulfonic acid radical cation decolorization assay. Methods Enzymol. 1999, 299, 379–389. [Google Scholar] [CrossRef]
- Pardini, A.; Consumi, M.; Leone, G.; Bonechi, C.; Tamasi, G.; Sangiorgio, P.; Verardi, A.; Rossi, C.; Magnani, A. Effect of different post-harvest storage conditions and heat treatment on tomatine content in commercial varieties of green tomatoes. J. Food Comp. Anal. 2021, 96, 103735. [Google Scholar] [CrossRef]
- Bonechi, C.; Donati, A.; Tamasi, G.; Pardini, A.; Rostom, H.; Leone, G.; Lamponi, S.; Consumi, M.; Magnani, A.; Rossi, C. Chemical characterization of liposomes containing nutraceutical compounds: Tyrosol, hydroxytyrosol and oleuropein. Biophys. Chem. 2019, 246, 25–34. [Google Scholar] [CrossRef]
- Leone, G.; Consumi, M.; Lamponi, S.; Bonechi, C.; Tamasi, G.; Donati, A.; Rossi, C.; Magnani, A. Thixotropic PVA hydrogel enclosing a hydrophilic PVP core as nucleus pulposus substitute. Mat. Sci. Eng. C 2019, 98, 696–704. [Google Scholar] [CrossRef] [PubMed]


| Samples | G’ (kPa) (1 Hz) | G” (kPa) (1 Hz) | tan δ |
|---|---|---|---|
| 1S-VN | 85 ± 6 | 11 ± 2 | 0.129 |
| 2S-NN | 138 ± 12 | 15 ± 2 | 0.109 |
| 3S-RP | 173 ± 8 | 18 ± 3 | 0.104 |
| 4S-ZP | 121 ± 9 | 10 ± 1 | 0.083 |
| 1M-VN | 180 ± 8 | 18 ± 4 | 0.100 |
| 2M-NN | 138 ± 10 | 14 ± 3 | 0.101 |
| 3M-RP | 81 ± 9 | 11 ± 2 | 0.135 |
| 4M-ZP | 24 ± 1 | 2.0 ± 0.1 | 0.083 |
| Samples | 30–120 °C | 120–200 °C | 200–400 °C | 400–600 °C | Residue | R |
|---|---|---|---|---|---|---|
| 1S-VN | 78 | 10.7 | 4.0 | 1.4 | 5.8 | 0.35 |
| 2S-NN | 68 | 20.3 | 5.6 | 1.6 | 5.1 | 0.28 |
| 3S-RP | 82 | 7.5 | 5.1 | 1.8 | 3.7 | 0.35 |
| 4S-ZP | 76 | 10.4 | 6.5 | 2.1 | 5.1 | 0.32 |
| 1M-VN | 77 | 10.5 | 6.0 | 1.7 | 5.1 | 0.28 |
| 2M-NN | 60 | 27.4 | 5.3 | 1.8 | 5.4 | 0.34 |
| 3M-RP | 69 | 20.3 | 4.6 | 1.6 | 4.6 | 0.35 |
| 4M-ZP | 67 | 21.4 | 5.8 | 1.7 | 4.2 | 0.29 |
| Samples | TPP (mg(GA)/kg dw) | TEAC (mmol(Trx)/kg dw) |
|---|---|---|
| 1S-VN | 2416 ± 36 a | 9.44 ± 0.41 a |
| 2S-NN | 3326 ± 38 b,c | 17.56 ± 0.20 b |
| 3S-RP | 2702 ± 327 a,d | 11.36 ± 0.23 c |
| 4S-ZP | 4320 ± 130 e | 29.21 ± 2.41 d |
| 1M-VN | 2573 ± 291 a,d | 9.76 ± 0.01 a |
| 2M-NN | 3723 ± 661 f | 18.61 ± 0.82 e |
| 3M-RP | 3591 ± 351 c,f | 23.34 ± 0.70 f |
| 4M-ZP | 3043 ± 554 b,g | 16.56 ± 1.05 g |
| Cx-Nx | 2809 ± 444 d,g | 13.68 ± 0.34 h |
| Samples | ChlAc (mg/kg dw) | NeoChlAc (mg/kg dw) | HydcynDer (mg/kg dw) | |
| 1S-VN | 102 ± 19 a | 123 ± 10 a,b | 372 ± 56 a | |
| 2S-NN | 540 ± 155 b | 368 ± 41 c | 1732 ± 346 b | |
| 3S-RP | 164 ± 1 a,c | 89 ± 3 a,d | 788 ± 79 c | |
| 4S-ZP | 979 ± 120 d | 526 ± 16 e | 1949 ± 195 d | |
| 1M-VN | 169 ± 92 a,c | 171 ± 56 f | 968 ± 242 e | |
| 2M-NN | 445 ± 36 e | 255 ± 83 g | 1694 ± 223 b | |
| 3M-RP | 275 ± 64 f | 117 ± 33 a,b,d | 1402 ± 280 f | |
| 4M-ZP | 176 ± 10 c | 83 ± 23 d | 819 ± 164 c,e | |
| Samples | IsoQue (mg/kg dw) | IsoQueDer (mg/kg dw) | Rut (mg/kg dw) | Kaemp (mg/kg dw) |
| 1S-VN | 8.5 ± 2.4 a,b | 17.5 ± 4.4 a | 1.21 ± 0.18 a | 0.27 ± 0.16 a |
| 2S-NN | 9.8 ± 1.2 b,c | 24.7 ± 3.9 b | 1.39 ± 0.34 a,b,c | 0.45 ± 0.04 b |
| 3S-RP | 11.2 ± 1.6 c | 19.3 ± 4.0 a | 1.30 ± 0.22 a,b | 0.17 ± 0.04 c |
| 4S-ZP | 9.6 ± 0.4 b | 19.4 ± 0.2 a | 1.36 ± 0.01 a,b | 0.16 ± 0.04 c,d |
| 1M-VN | 8.7 ± 2.2 b | 25.0 ± 1.0 b | 2.55 ± 0.01 d | 0.25 ± 0.04 a |
| 2M-NN | 13.6 ± 0.8 d | 29.5 ± 4.3 c | 1.46 ± 0.26 b,c,e | 0.26 ± 0.01 a |
| 3M-RP | 16.3 ± 2.4 e | 28.9 ± 1.5 c | 1.59 ± 0.47 c,e | 0.16 ± 0.05 c,d |
| 4M-ZP | 7.1 ± 2.0 a | 14.5 ± 3.8 d | 0.95 ± 0.09 f | 0.11 ± 0.01 d |
| TPP | TEAC | ChlAc | NeoChlAc | HydcynDer | IsoQue | IsoQueDer | Rut | |
|---|---|---|---|---|---|---|---|---|
| TEAC | 0.965 *** | |||||||
| ChlAc | 0.882 ** | 0.834 ** | ||||||
| NeoChlAc | 0.749 * | 0.679 * | 0.963 *** | |||||
| HydcynDer | 0.890 ** | 0.798 ** | 0.855 ** | 0.803 ** | ||||
| IsoQue | 0.385 | 0.366 | 0.054 | −0.074 | 0.332 | |||
| IsoQueDer | 0.165 | 0.095 | −0.002 | 0.022 | 0.204 | 0.708 * | ||
| Rut | −0.207 | −0.249 | −0.131 | −0.010 | 0.007 | 0.112 | 0.516 | |
| Kaemp | −0.072 | −0.190 | 0.148 | 0.354 | 0.292 | −0.080 | 0.204 | 0.155 |
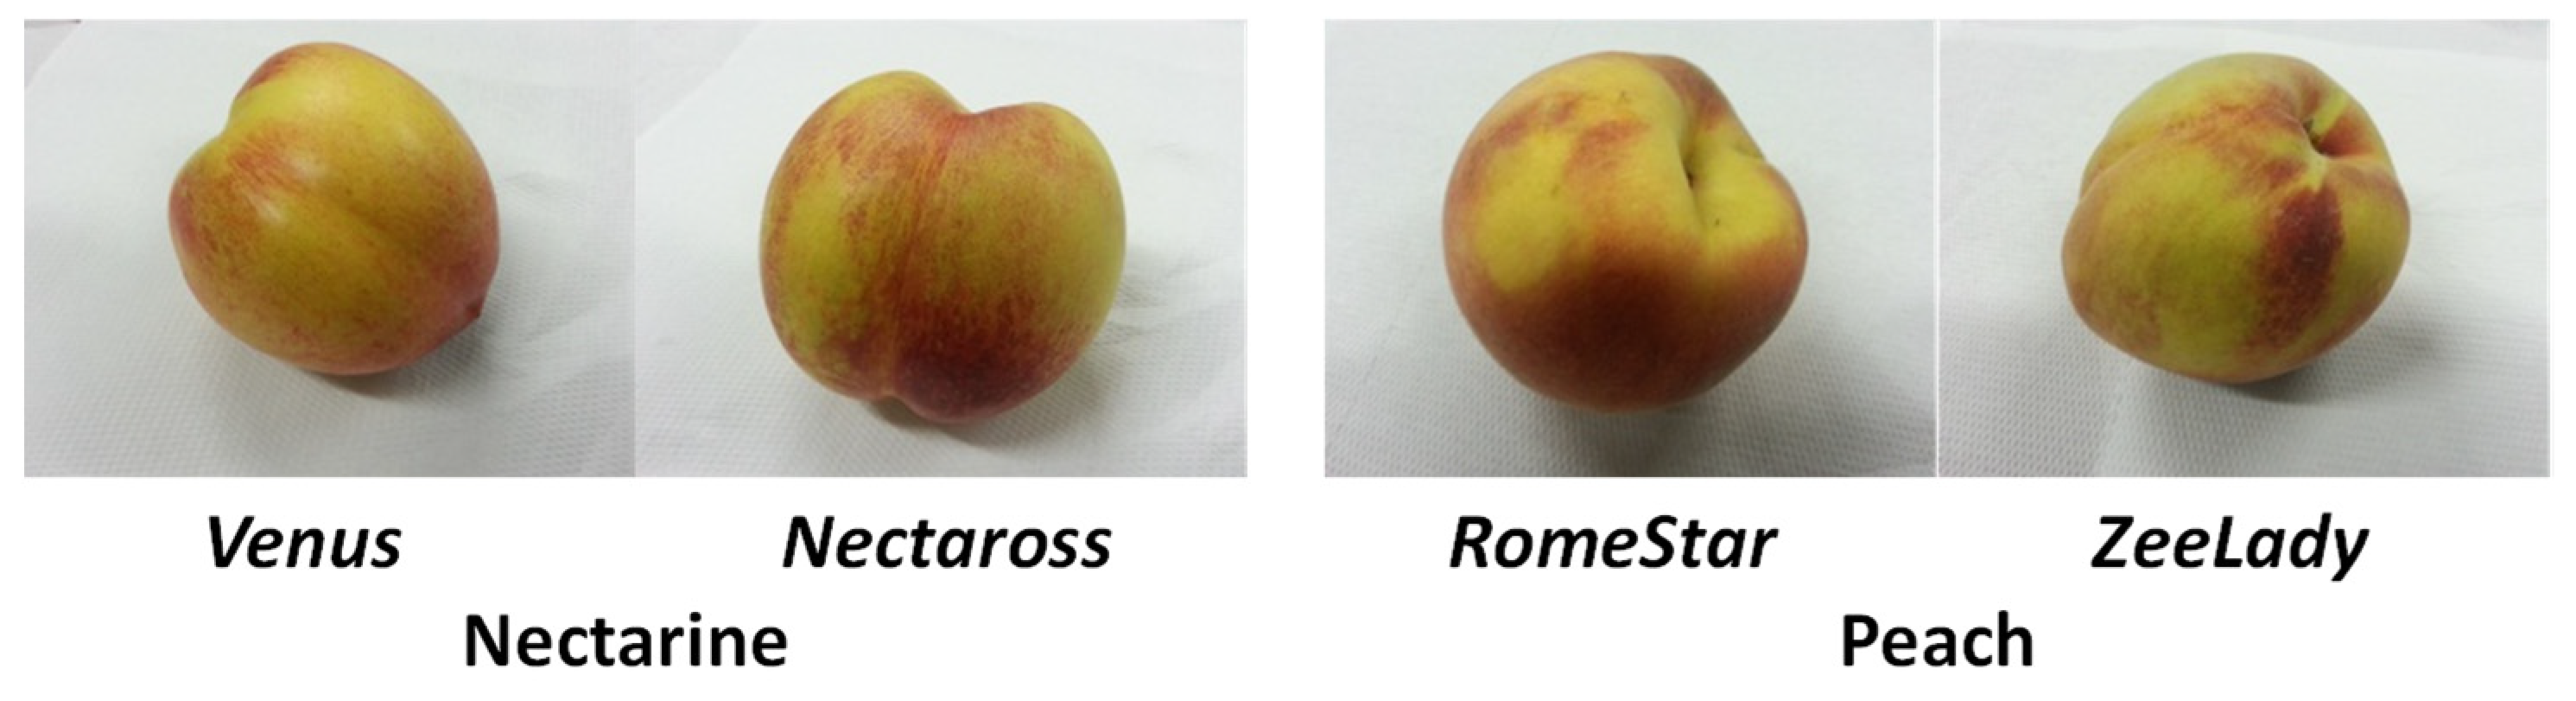
| Sample | Origin | Variety |
|---|---|---|
| 1S-VN | Sibari Area | Venus (Nectarine) |
| 2S-NN | Sibari Area | Nectaross (Nectarine) |
| 3S-RP | Sibari Area | Rome Star (Peach) |
| 4S-ZP | Sibari Area | Zee Lady (Peach) |
| 1M-VN | Metaponto Area | Venus (Nectarine) |
| 2M-NN | Metaponto Area | Nectaross (Nectarine) |
| 3M-RP | Metaponto Area | Rome Star (Peach) |
| 4M-ZP | Metaponto Area | Zee Lady (Peach) |
| Cx-Nx | Commercial | (Nectarine) |
| tR (min) | MS Mode Polarity | [M−H]− (m/z) | Calibration Range (mg/L) | Equation R2 | LOQ // LOD (mg/L) | |
|---|---|---|---|---|---|---|
| ChlAc | 20.65 | SIM negative | 353 | 0.010–15 | y = 8.40731 × 0.9995 | 0.010 // 0.003 |
| NeoChlAc | 15.85 | SIM negative | 353 | 0.010–15 | y = 9.00526 × 0.9998 | 0.010 // 0.003 |
| IsoQue | 37.06 | SIM negative | 463 | 0.010–10 | y = 16.06550 × 0.9952 | 0.010 // 0.003 |
| Rut | 36.81 | SIM negative | 609 | 0.010–12 | y = 14.10963 × 0.9969 | 0.010 // 0.003 |
| Kaemp | 41.02 | SIM negative | 285 | 0.060–1.0 | y = 11.22166 × 0.9924 | 0.060 // 0.020 |
| MeOCat | 19.94 | --- | 139 | IS, 0.5 | --- | --- |
Publisher’s Note: MDPI stays neutral with regard to jurisdictional claims in published maps and institutional affiliations. |
© 2021 by the authors. Licensee MDPI, Basel, Switzerland. This article is an open access article distributed under the terms and conditions of the Creative Commons Attribution (CC BY) license (https://creativecommons.org/licenses/by/4.0/).
Share and Cite
Tamasi, G.; Bonechi, C.; Leone, G.; Andreassi, M.; Consumi, M.; Sangiorgio, P.; Verardi, A.; Rossi, C.; Magnani, A. Varietal and Geographical Origin Characterization of Peaches and Nectarines by Combining Analytical Techniques and Statistical Approach. Molecules 2021, 26, 4128. https://doi.org/10.3390/molecules26144128
Tamasi G, Bonechi C, Leone G, Andreassi M, Consumi M, Sangiorgio P, Verardi A, Rossi C, Magnani A. Varietal and Geographical Origin Characterization of Peaches and Nectarines by Combining Analytical Techniques and Statistical Approach. Molecules. 2021; 26(14):4128. https://doi.org/10.3390/molecules26144128
Chicago/Turabian StyleTamasi, Gabriella, Claudia Bonechi, Gemma Leone, Marco Andreassi, Marco Consumi, Paola Sangiorgio, Alessandra Verardi, Claudio Rossi, and Agnese Magnani. 2021. "Varietal and Geographical Origin Characterization of Peaches and Nectarines by Combining Analytical Techniques and Statistical Approach" Molecules 26, no. 14: 4128. https://doi.org/10.3390/molecules26144128
APA StyleTamasi, G., Bonechi, C., Leone, G., Andreassi, M., Consumi, M., Sangiorgio, P., Verardi, A., Rossi, C., & Magnani, A. (2021). Varietal and Geographical Origin Characterization of Peaches and Nectarines by Combining Analytical Techniques and Statistical Approach. Molecules, 26(14), 4128. https://doi.org/10.3390/molecules26144128