1. Introduction
The electrodeposition process is one of the methods for manufacturing thin solid layers from an electrolyte solution using electric field. It has found application in various industries such as biology, biotechnology, biochemistry, chemistry, materials science and waste-water treatment [
1,
2,
3]. Originally, the electrodeposition process was used for obtaining metal coatings. Recently, it has been employed in manufacturing hydrogel layers from synthetic or natural polymers. In the latter case, the systems reported in the literature are composed of collagen, silk, alginate or chitosan [
4].
Both metal and hydrogel deposits have been applied in medicine for production of products that possess unique chemical and physical properties [
5]. Depending on process parameters, electrodeposition products can be obtained in different forms such as electrode coatings, thin layers or cylindrical tubes [
5,
6]. In addition, the electrodeposition process is marked by mild conditions and low-cost apparatus. Although it is time consuming for some systems, it allows controlling the structure and morphology of deposited layers.
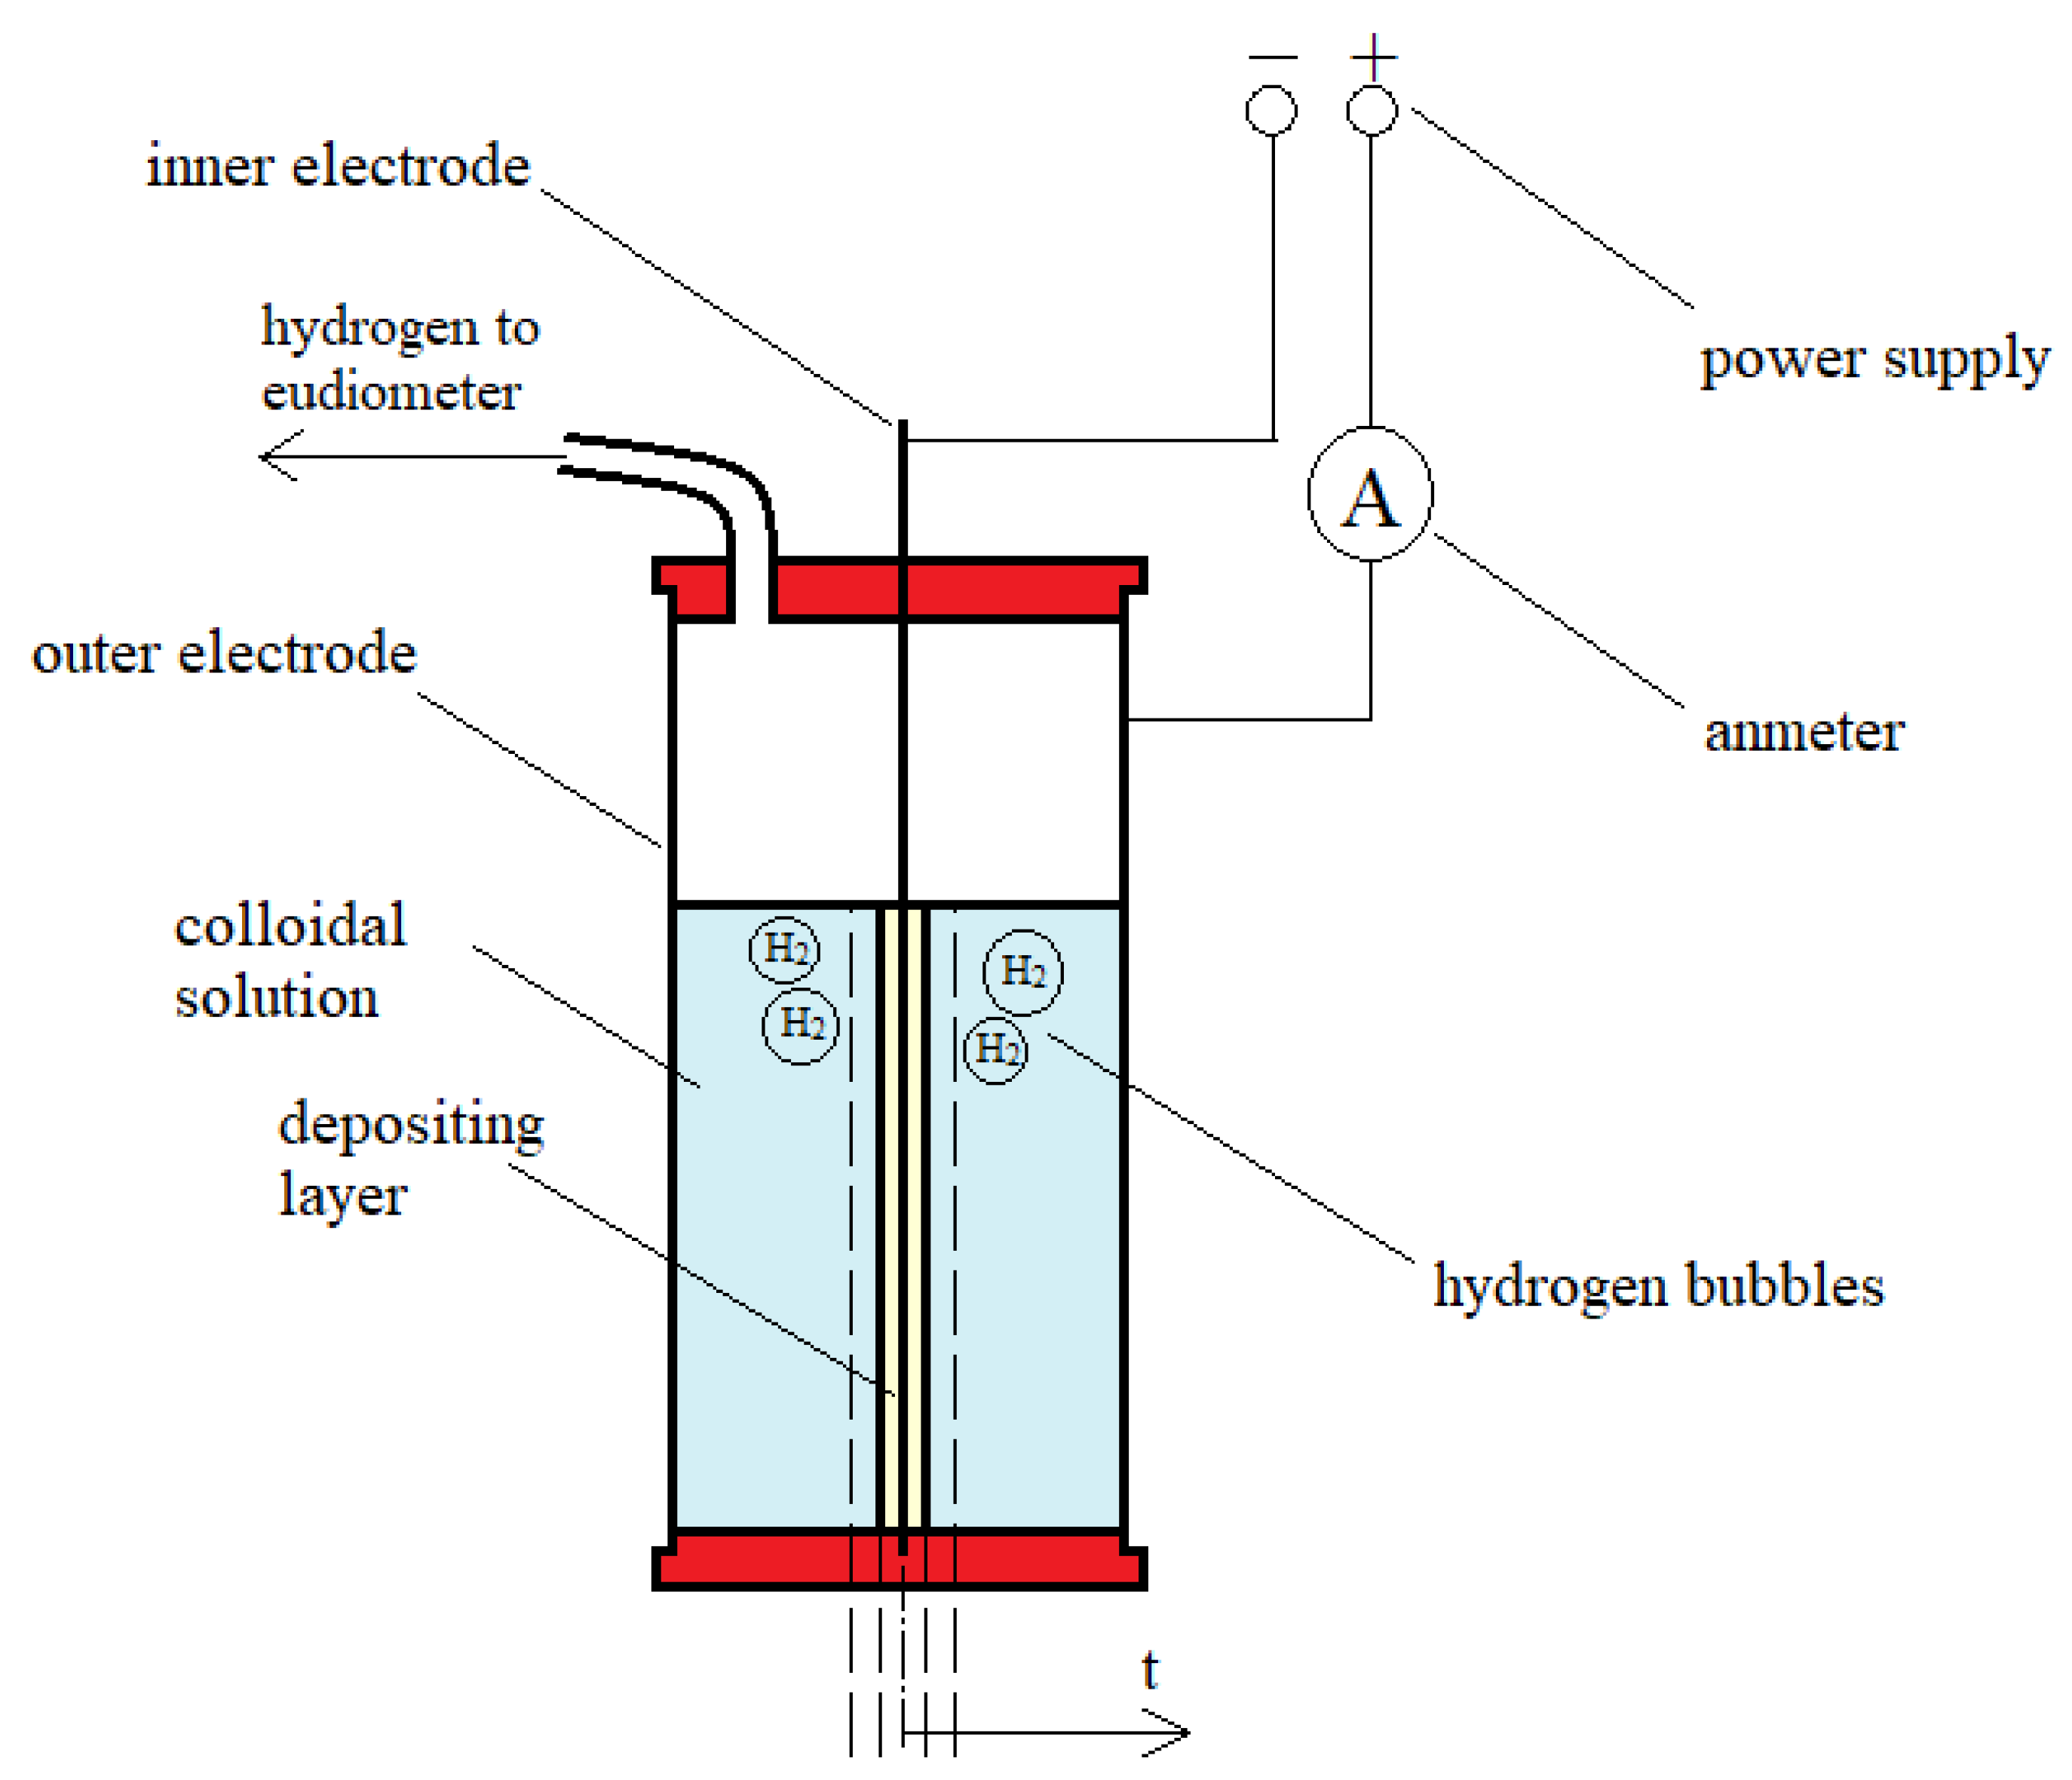
In 2016, our team reported a technique for obtaining tubular-shaped deposits from a chitosan-hydroxyapatite colloidal solution [
7]. The novelty of this approach was the use of a stainless steel rod as an inner electrode. It allowed obtaining a tubular-shaped hydrogel structure, which was applied in peripheral nerve tissue engineering [
8]. Peripheral nerves can regenerate spontaneously by themselves, but without proper guidance the healing process may be hindered, causing illnesses and dysfunctions (e.g., neuroma) [
9,
10]. The golden standard in reconstruction of disrupted peripheral nerve tissue is nerve grafts taken from autologous tissue (e.g., sural nerve, medial antebrachial cutaneous nerve and posterior interosseous nerves). Despite good clinical efficacy of autografting, the autologous tissue is limited and harvesting it causes donor site morbidity (i.e., neuroma formation, sensory loss, infection and surgical scarring). The promising alternative solution is inserting biocompatible tubular polymer implants [
7]. The potential of our electrodeposited chitosan implants was studied in vitro and in vivo with satisfactory outcomes [
8,
11,
12]. In addition, the electrodeposition process is highly reproducible [
13]. Despite its high application potential, the influence of process parameters (i.e., voltage) on structural, chemical, and mechanical characteristics of chitosan deposits is inadequately studied [
14,
15].
It is known that cathodic electrodeposition of chitosan can undergo in the environment of pH less than 6.5, which facilitates forming a colloid. Electrochemical reaction of water reduction, which undergoes on the cathode, is presented as:
Near the cathode, a sharp gradient of pH occurs. Chains of protonated chitosan are deposited on metal at pH 6.5 due to charge deprotonation of amino groups, which causes their precipitation according to the following equation [
16,
17]:
There are some reports describing biological, physical, and chemical properties of chitosan-based deposits and their applications [
6,
18,
19]. However, the literature is lacking in quantitative and qualitative explanation of mechanism of this process. A correlation between process parameters and their changes over time for electrodeposition from chitosan-hydroxyapatite colloidal solution in the cylindrical geometry has not been described. This knowledge would be helpful for manufacturing tubular implants with desired properties for customised nerves regeneration or other applications, where high control over chemical composition, mechanical parameters, and morphology is required.
The aim of this work is focused on the investigation of parameters influencing electrodeposition from chitosan-hydroxyapatite colloidal solution. The correlation between the total charge exchanged, hydrogen liberation, and deposit thickness over time was described. In addition, apparent density and water content was calculated for the investigated range of voltages. In order to qualitatively characterise the structure of fabricated deposits, scanning electron microscopy and Fourier-transform infrared spectroscopy were employed. The obtained results will be a handful tool for manufacturing an implant with desired properties for an individual medical case, for instance a person suffering from peripheral nerve tissue disruption.
2. Results
In order to determine the parameters of particles in colloidal solutions, measurements of particle size and zeta potential were performed. The results are collected in
Table 1. Chitosan in acidic conditions can be degraded; however, this process is slow, and significant changes can be observed not earlier than after 10 days of the solution storage [
20,
21].
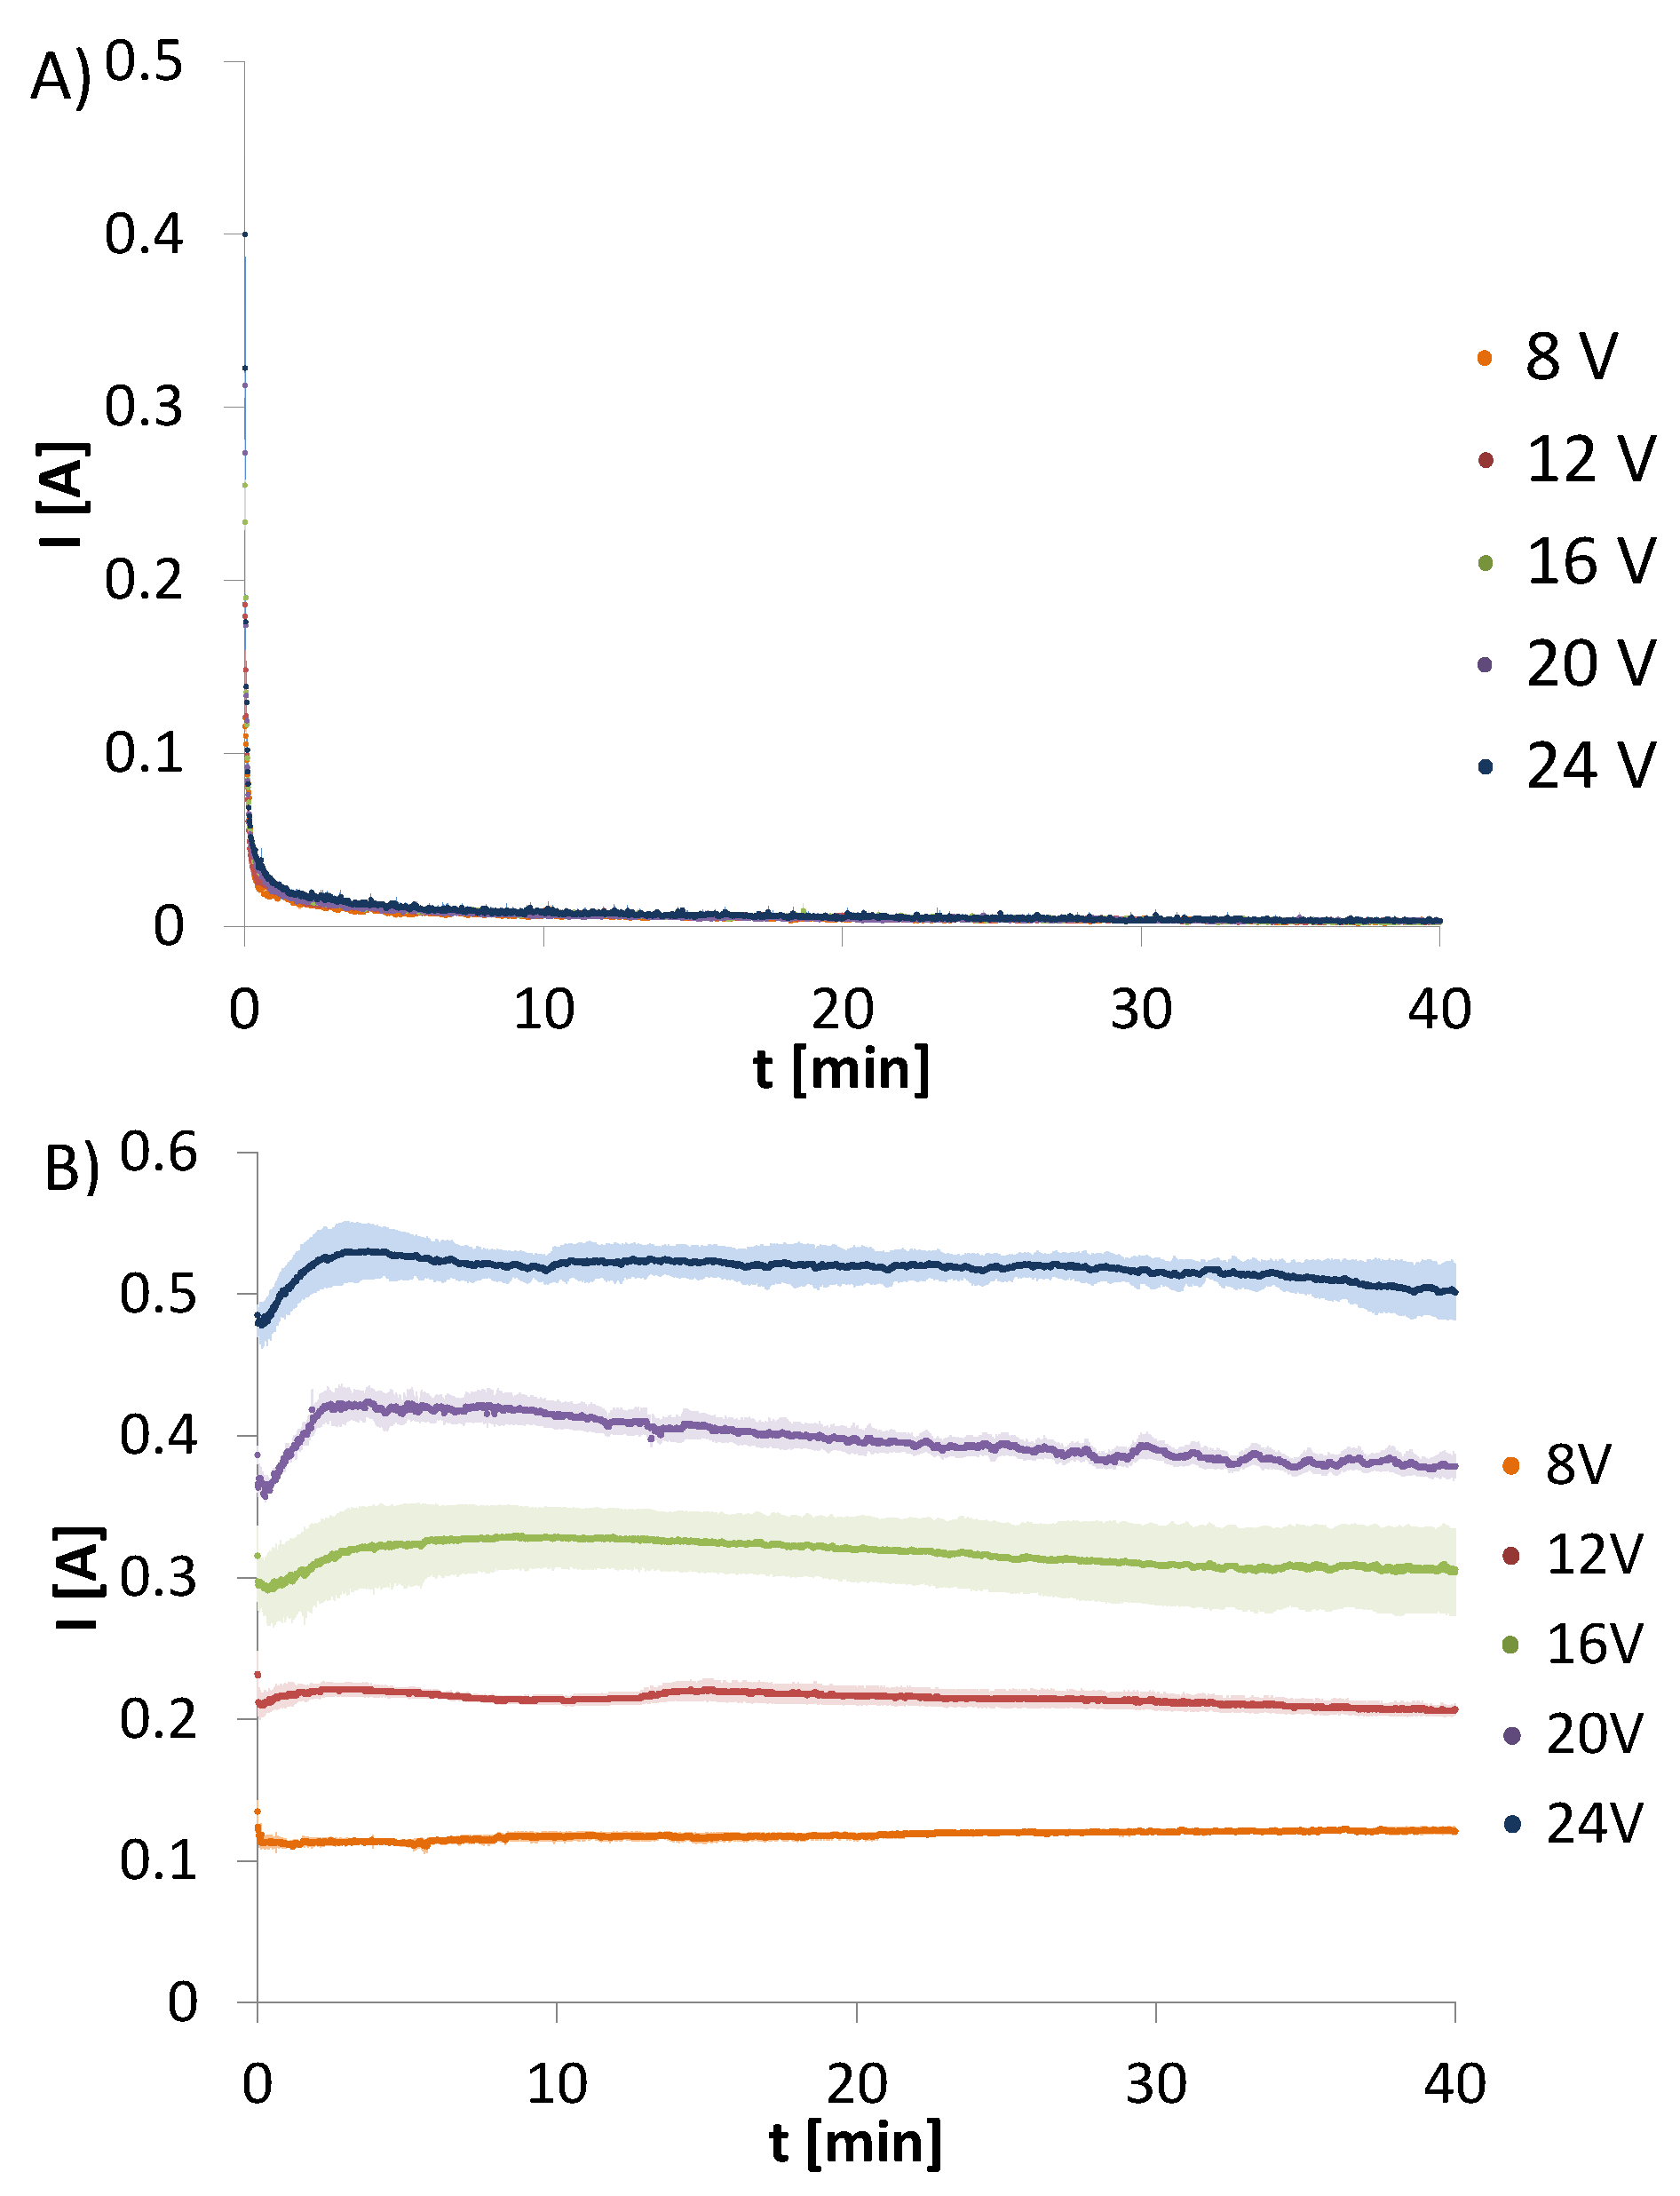
Amperage changes over time were recorded for electrodeposition from chitosan, hydroxyapatite and chitosan-hydroxyapatite colloidal solution. The changes of amperage for CHcs recorded for the initial voltages set at 8, 12, 16, 20, or 24 V are presented in
Figure 1A Electrodeposition form CHcs does not result in a solid deposit. Only a very thin semi-stiff hydrogel layer was observed. The changes of amperage over time for all initial voltages are the same and show rapid decrease.
Figure 1B shows the changes of amperage for HApcs recorded for the initial voltages set at 8, 12, 16, 20, or 24 V. The process does not lead to any deposit on the electrode and the plots are characterised by a constant current.
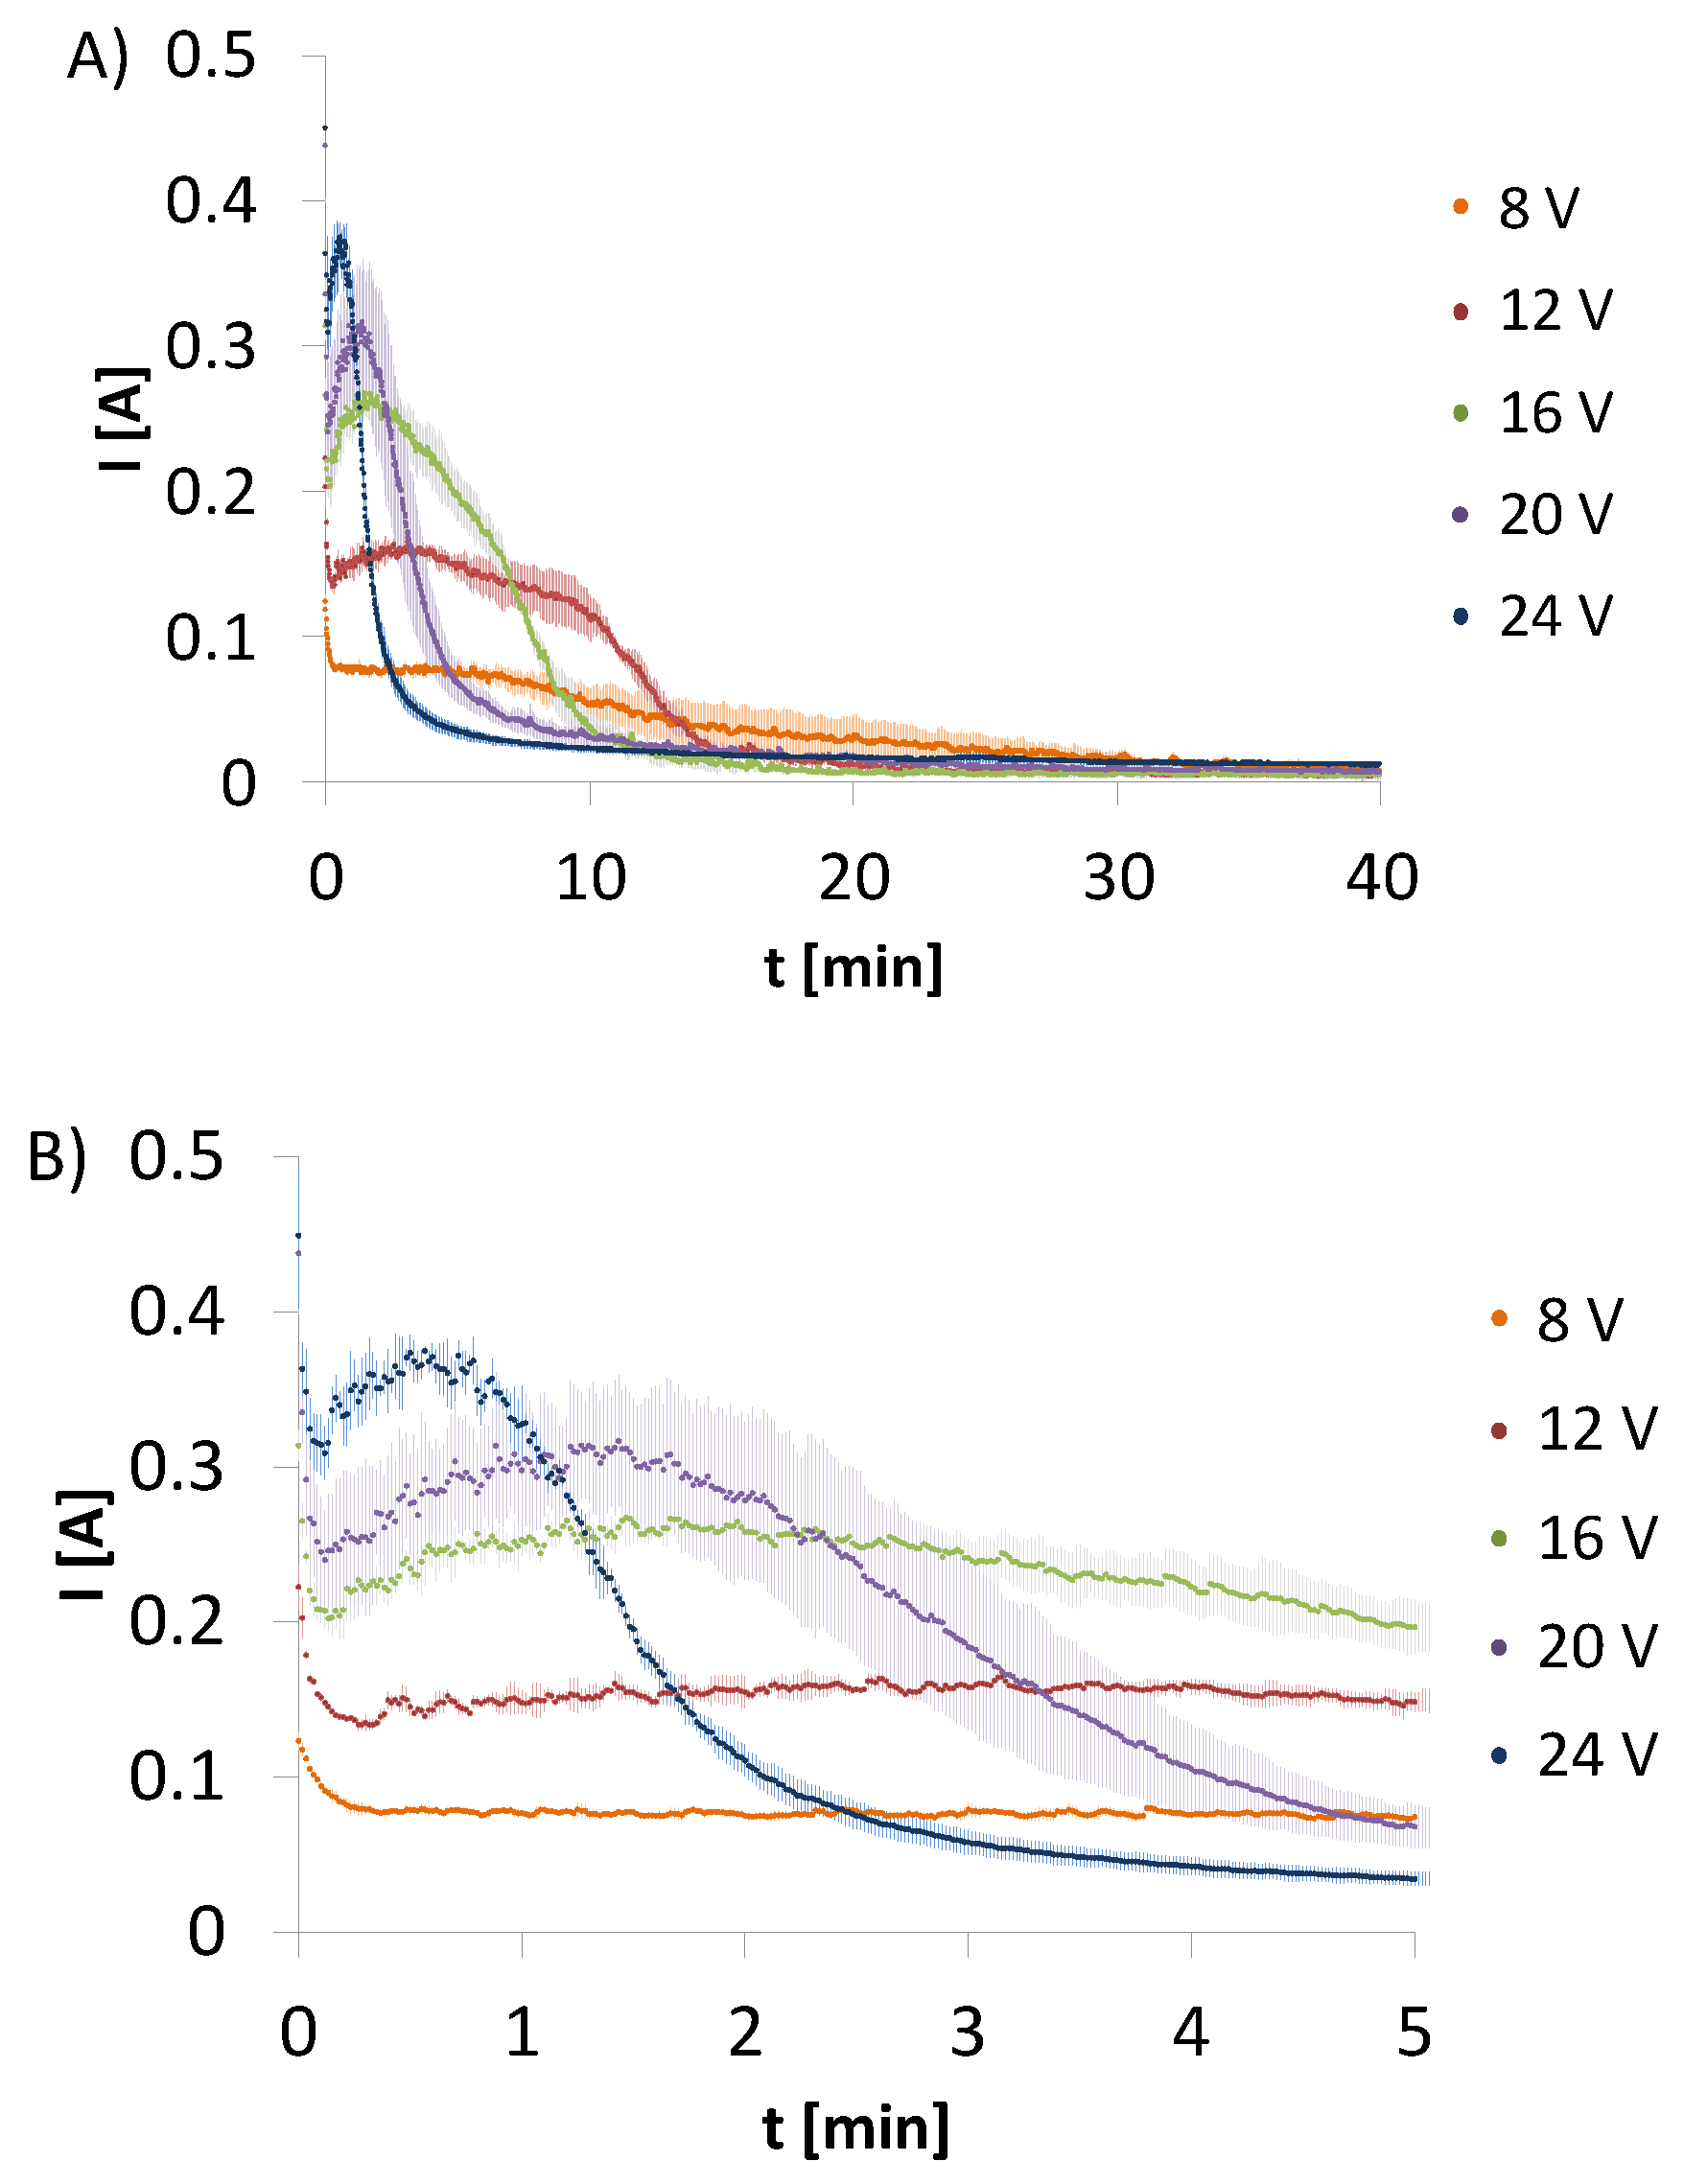
In contrast to the above electrodeposition processes from CHcs and HApcs, changes of amperage over time for electrodeposition form CH-HApcs were observed. The amperage was recorded for the initial voltages set at 8, 12, 16, 20, or 24 V (
Figure 2). All plots have similar shapes, i.e., a rapid amperage drop is observed during the first 10 s of the process. The higher initial voltage, the higher maximum value of amperage is recorded. After the initial period of 10 s, an increment in amperage can be observed to continue until the maximum value is reached. However, at the initial voltage, equal to 8 V, the local maximum is not observed. In addition, the lower the voltage, the longer the time required for reaching the maximum value.
In order to obtain the kinetics of the total electric charge exchanged, volume of hydrogen evolved, and increase in deposit thickness, the following respective measurements and calculations were made.
In the first step, for the obtained data, the electric charge (
exchanged during electrodeposition process was calculated. For this purpose, the definite integral of I(t) over [0, t] was employed:
where
I—amperage (A) and
t—time (s).
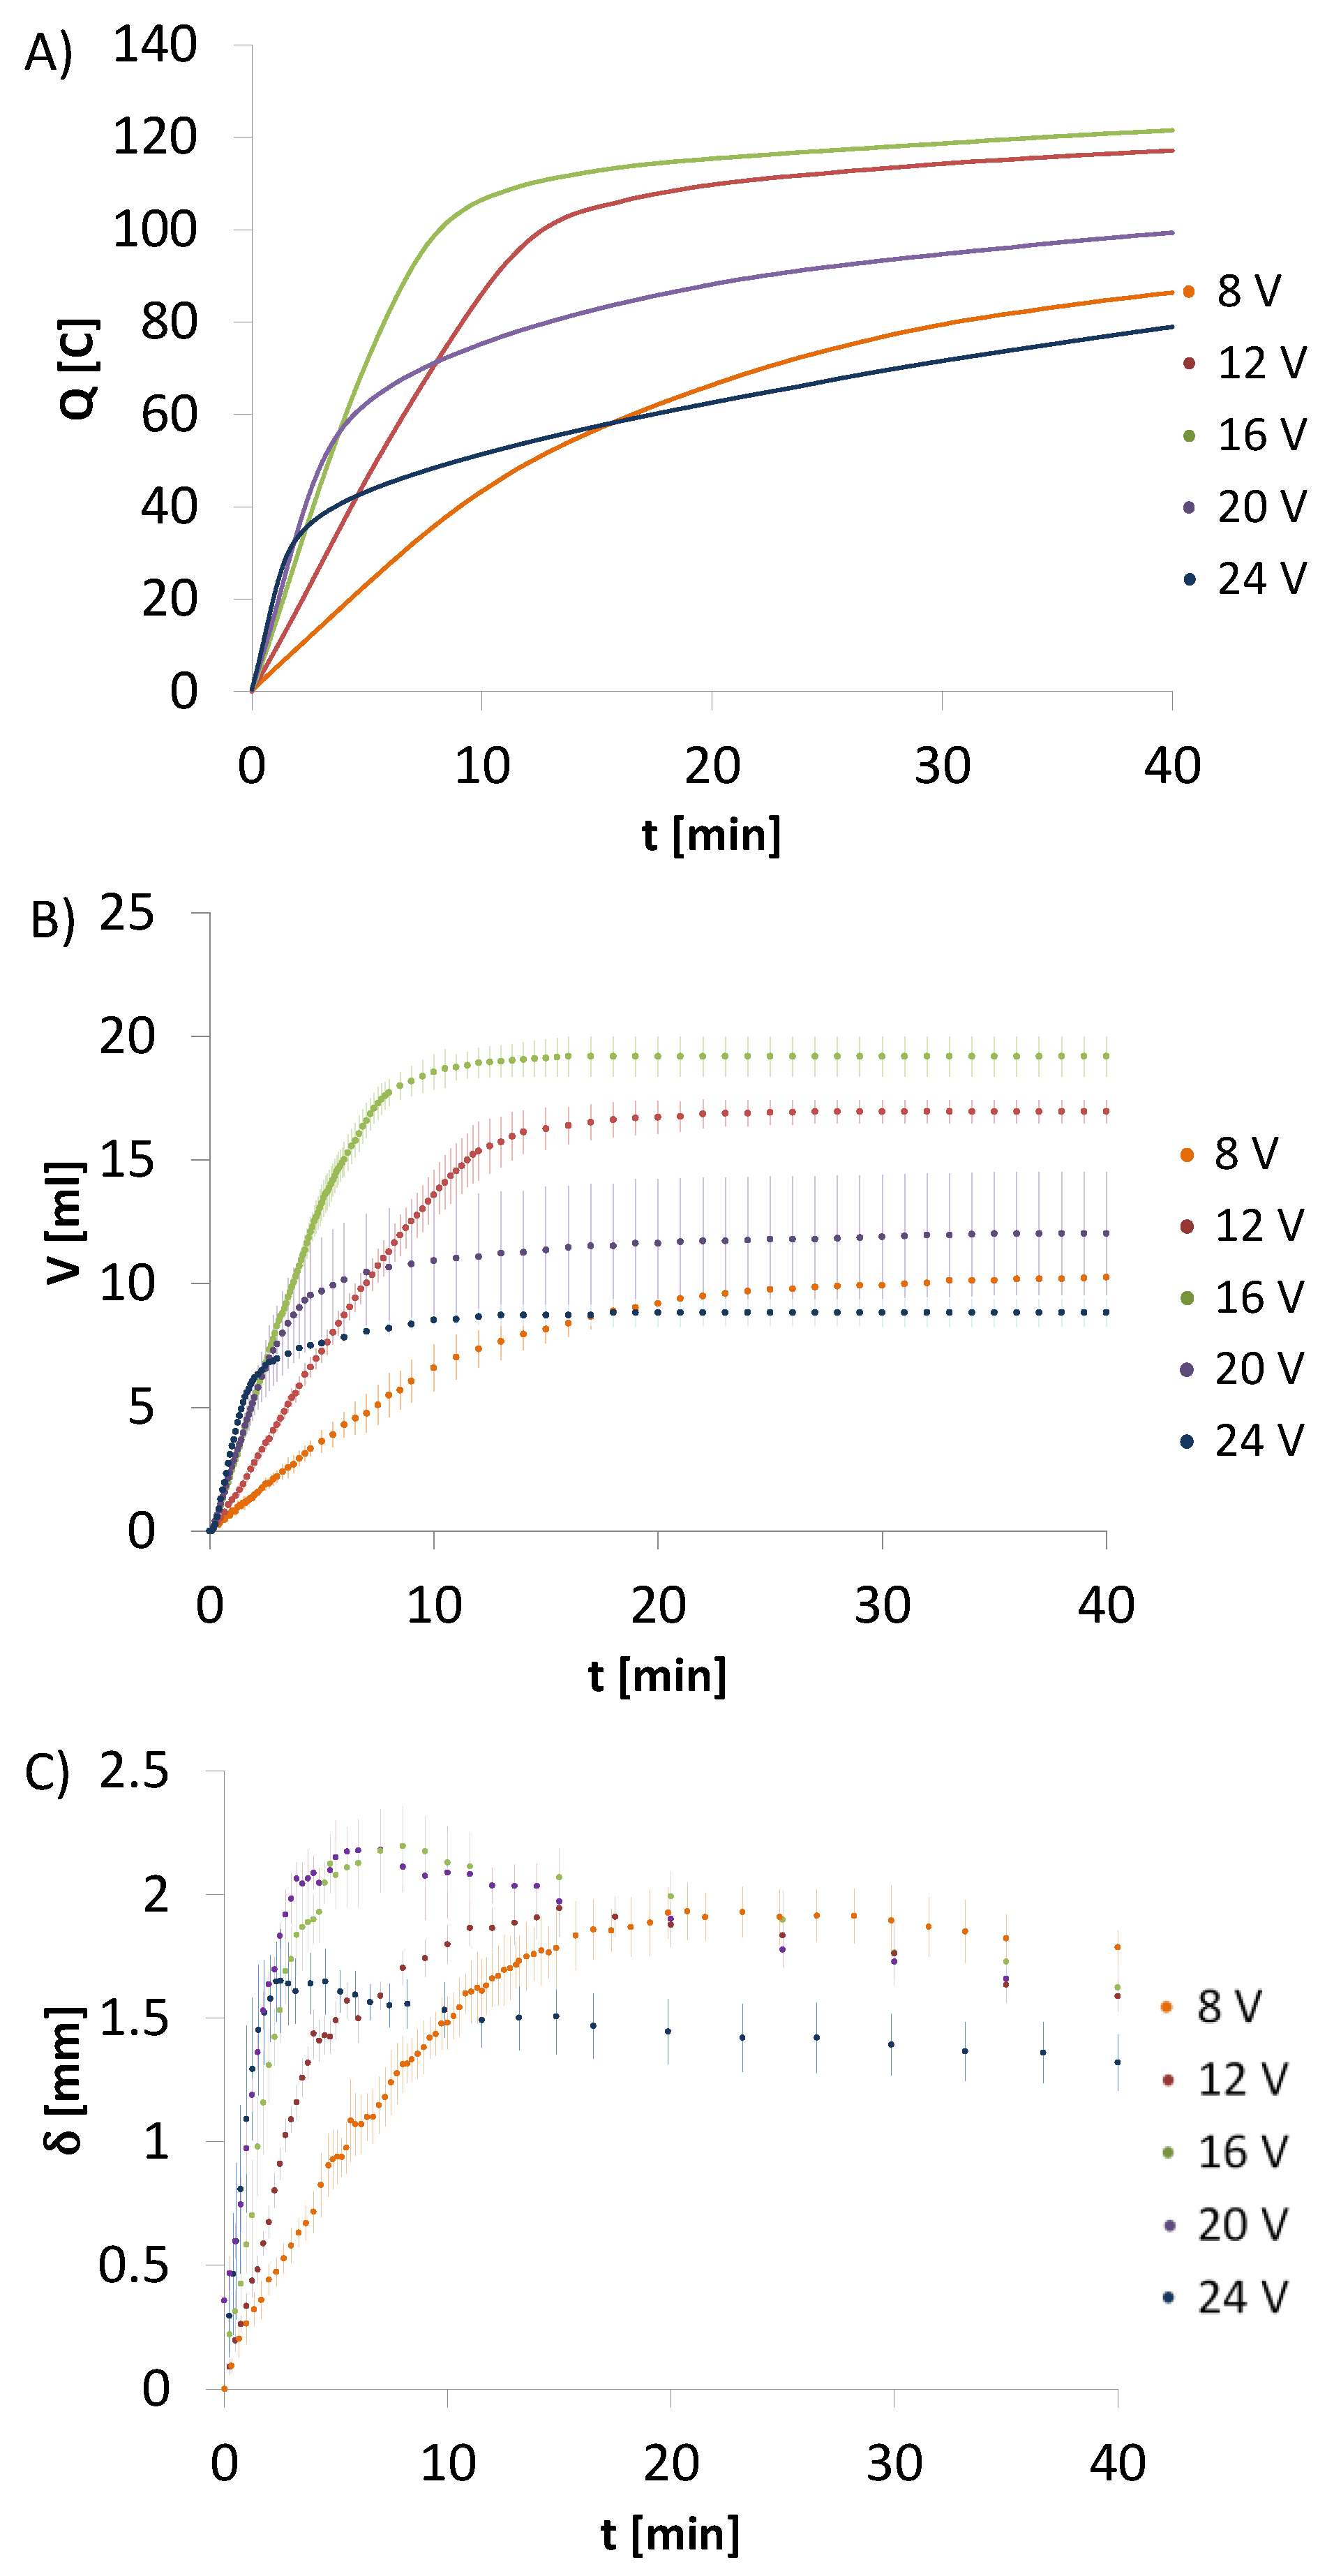
The total charge exchanged during 40 min of the electrodeposition process was calculated too (
Table 2). The calculated values for CHcs are lower than for CH-HApcs. The total electric charge takes the highest values for HApcs. Analysing the results for CH-HApcs, it can be noticed that the electric charge rises rapidly to the point where amperage reaches the minimum value (
Figure 3A). Moreover, the process for the initial voltage set at 16 V generates the highest total charge, whereas the processes initiated at voltages of 8 and 24 V induce similar values of the total charge.
In the next step, the total amount of gas produced during electrodeposition process was determined. For this purpose, the ideal gas equation was employed. The calculations were conducted using the values of hydrogen volume collected in the eudiometer and are presented in
Table 2. The calculated values of evolved hydrogen for CHcs are lower than for CH-HApcs. For HApcs, the hydrogen volume takes the highest values. In this system, the gas volume decreases for the initial voltages set at 16, 20, and 24 V. In addition, the constant hydrogen volumetric flow is observed. Since there is only a slight amperage decrease after 40 min of the process, the total electric charge received is higher than for the system containing only chitosan.
In the final step, the deposit mass, dry deposit mass, water content, and apparent density for the particular electrodeposition processes was measured (
Table 2).
Figure 3C presents the rate of deposit thickness increase versus time.
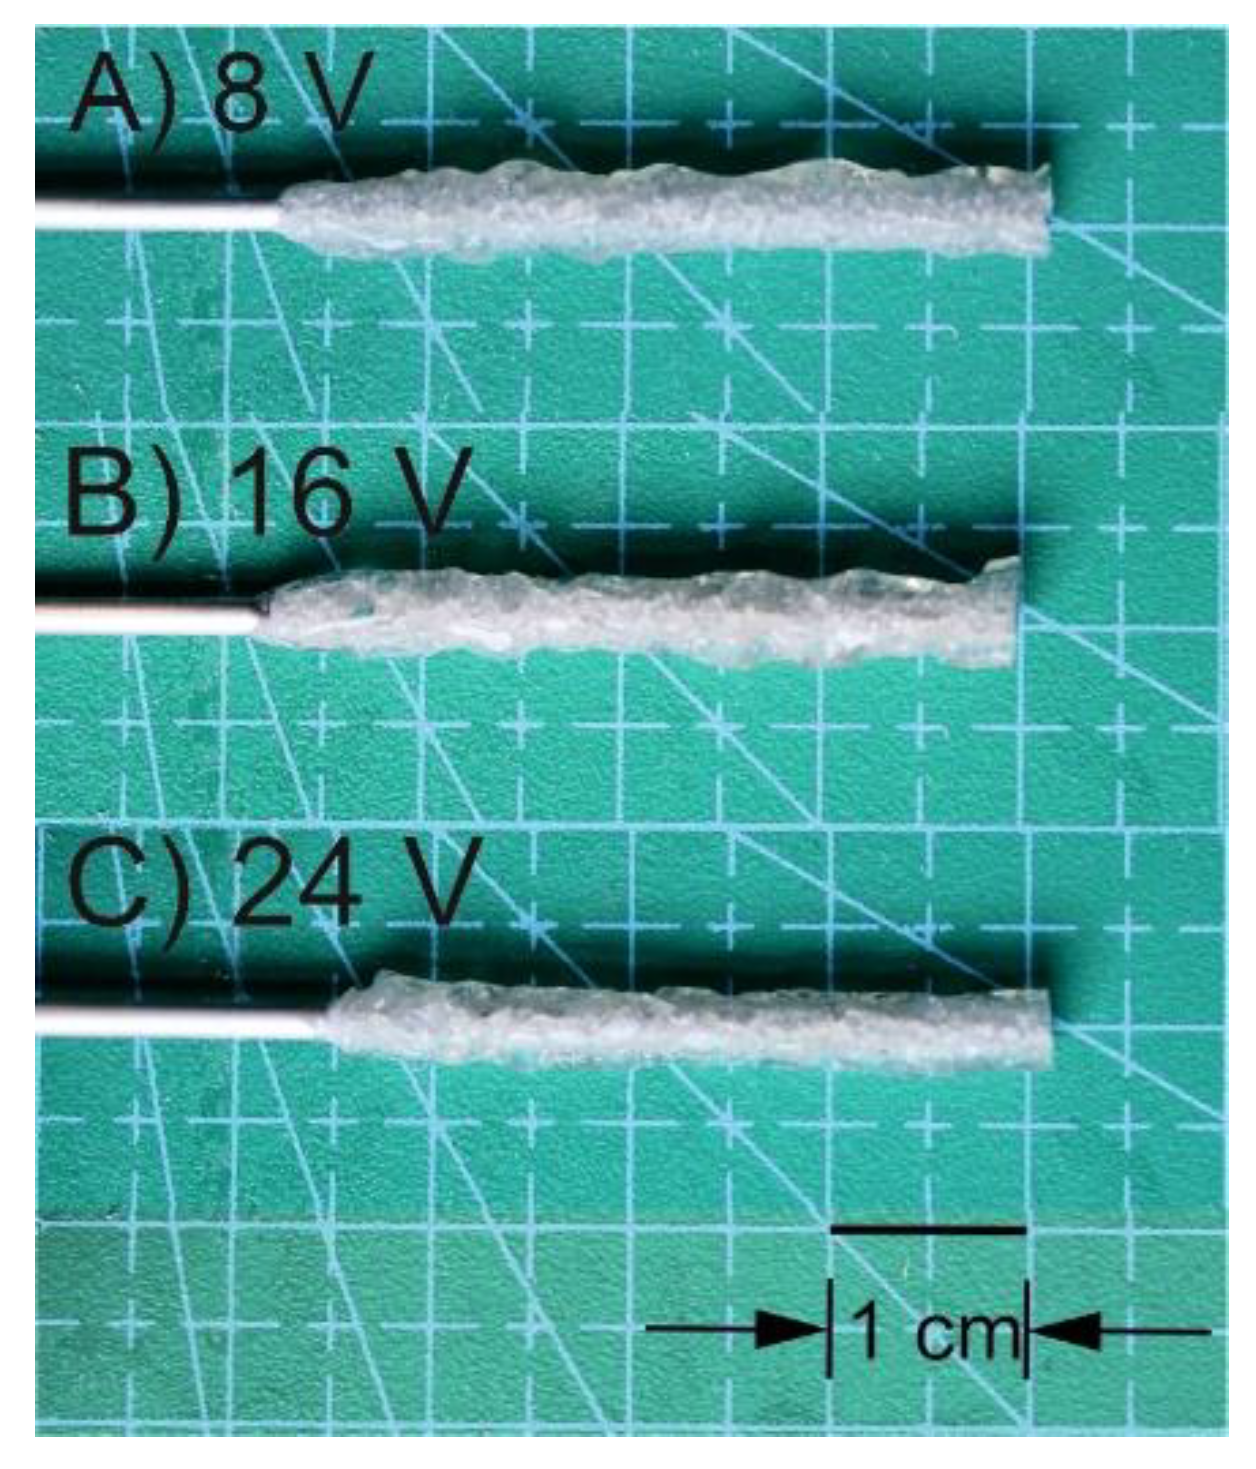
The photographs of deposits obtained from chitosan-hydroxyapatite colloidal solution for the electrodeposition process initiated at voltages 8, 16, and 24 V are shown in
Figure 4. The applied reactor and initial volume of colloidal solution enabled receiving structures with a length of 38 ± 2 mm. They could be easily removed from the rod. It can be noticed that there is no significant influence of the initial voltage on the average deposit thickness for the process lasting at least 20 min, with the exception for 24 V, where the conduit is less than 0.5 mm thinner than for other cases.
In order to perform detailed studies of gain in deposit thickness over time, the electrodeposition process was recorded under the optical microscope (
Figure 5A–C). In every case, hydrogen was evolved, and its amount was quantified. The violet colour of chitosan-hydroxyapatite layer was the consequence of interaction of OH
− ions with phenolphthalein. The resulting alkaline environment facilitated chitosan deposition. After 30 min of the process, only single bubbles were observed. The higher the voltage, the higher the amount of hydrogen that is evolved (
Table 2). The mass of deposits just after their preparation and the dry ones for electrodeposition run for 40 min at 8, 12, 16, 20, and 24 V was equal to 0.380 ± 0.063 and 0.074 ± 0.011, 0.416 ± 0.013 and 0.088 ± 0.007, 0.331 ± 0.021 and 0.082 ± 0.004, 0.319 ± 0.023 and 0.087 ± 0.005, and 0.307 ± 0.022 and 0.081 ± 0.003 g, respectively. The lower the induced voltage, the higher the water content. Moreover, the apparent density is higher for higher voltages (
Table 2). In order to qualitatively assess structural changes caused by liberating hydrogen within the bulk of structures, scanning electron microscopy was employed (
Figure 5D–G). The higher the voltage, the higher the irregularity of the implant outer surface.
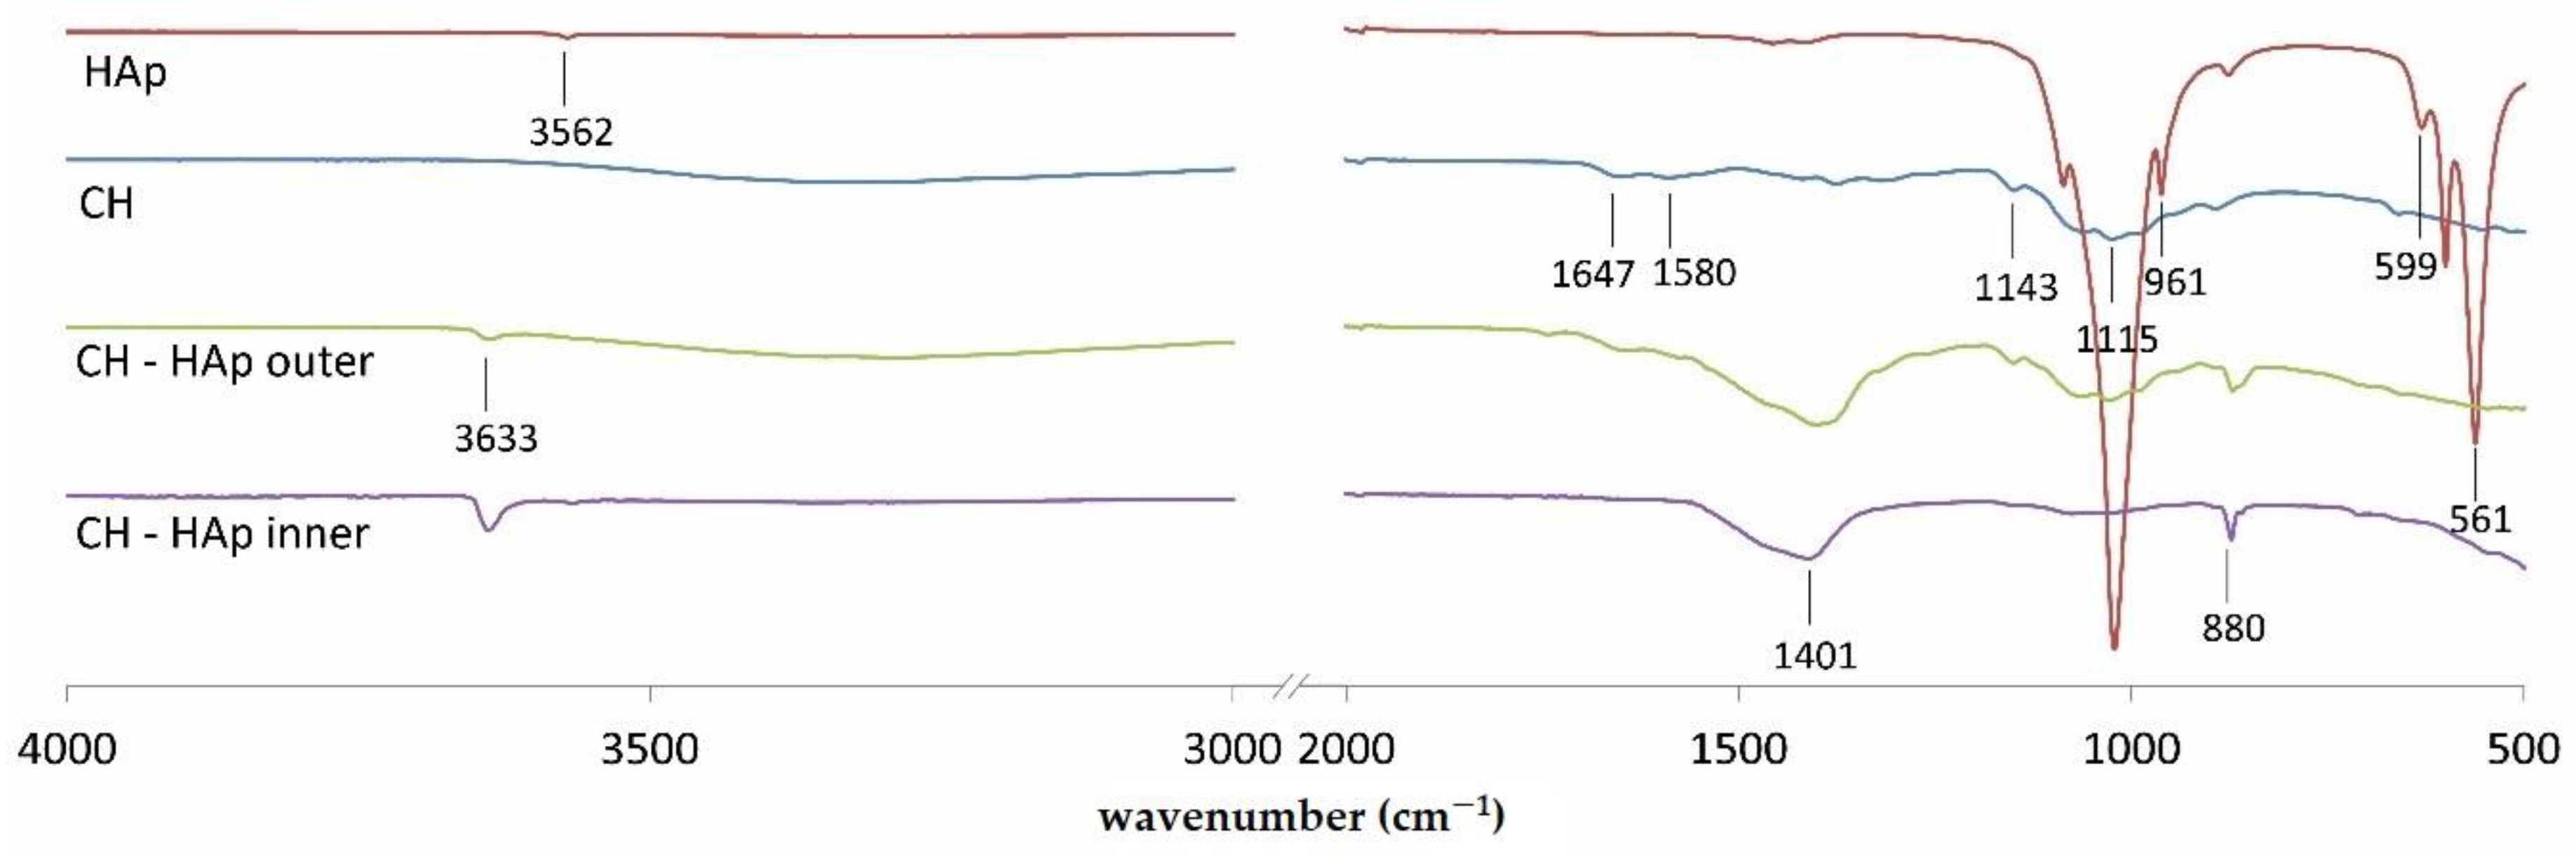
In
Figure 6, FT–IR spectra of hydroxyapatite, chitosan, and surfaces (inner and outer) of CH-HAp deposit are presented in order to understand interactions between chitosan and hydroxyapatite created in implants. The peaks characteristic for chitosan are present at: 1647 (–C=O stretching mode), 1580 (–NH
2 bending mode), and three peaks located in the range from 1020 to 1140 cm
−1 (C-O-C stretching asymmetric and symmetric mode). The spectrum of hydroxyapatite shows characteristic peaks associated with
at 1020, 961, and 561 cm
−1. Moreover, the signal observed at 3562 cm
−1 denotes the stretching mode of -OH bond [
7,
22,
23,
24]. The strongest characteristic
bands are visible at 1420 cm
−1. Carbonate is often present in hydroxyapatite as a production residue [
22]. The spectra of inner and outer surfaces of implants show well-pronounced peaks at 1401 and 1387 cm
−1, respectively. They demonstrate peaks characteristic for chitosan at 1647, 1580, 1143, and 1015 cm
−1. The weak peak assigned to lactic acid at 1749 cm
−1 (attributed to carbonyl of ester or carboxylic groups) is detected in the spectrum of outer surface. Moreover, CH-HAp inner and outer surfaces show peaks at 3633 and 880 cm
−1.
3. Discussion
In recent years, researches have investigated a variety of products which can be applied in nerve tissue regeneration [
25]. Nevertheless, only a few papers bring up the topic of tubular-shaped layer electrodeposition [
26,
27]. In addition, up to now, the quantitative and qualitative characterisation of electrodeposition process from polymeric colloidal solution has been poorly described. Taking into account the high application potential of electrodeposited structures in the production of personalised implants, particularly for peripheral nerve tissue engineering, the presented work was focused on investigation of parameters influencing the tubular-shaped layer electrodeposition from chitosan-hydroxyapatite colloidal solution.
The work protocol encompassed three steps. Firstly, the properties of the prepared colloidal systems (i.e., particle size and zeta potential) were determined. Secondly, the parameters of the electrodeposition process were characterised. In this step, the change of amperage and deposit thickness over time were studied. In addition, the amount of evolved hydrogen was monitored. The final step of the work was focused on structural characterisation of deposits. The water content and apparent density was determined for CH-HAp implants. The structures were also qualitatively assessed based on the results of morphology by SEM and chamical composition by FTIR.
The obtained results of z-average particle size confirm colloidal character of the studied solutions, since the particle sizes of respective molecules are lower than 1 nm. The average size of particles in CH-HApcs is bigger than in CHcs and HApcs. This observation suggests formation of new complexes with higher positive zeta potential for the complex system. The new interactions might be the result from chelation of hydroxyapatite-derived species by chitosan chains [
28]. Moreover, it is known that in the range of pH values between the pK
a of lactic acid (3.8) and the one of chitosan (~6), an ionic pair between RCOO
− and protonated chitosan (−NH
3+) is formed [
29]. It was also shown that the lactic acid counter-anion interacts strongly with the chitosan chains [
30]. The resulting high zeta potential facilitates movement of particles towards the cathode.
Analysing the results for change of amperage over time, a sharp drop within first 10 s of electrodeposition process is observed. This might result from an adhesion of hydrogen bubbles to the cathode surface. This gas layer forms a resistancebarrier, which limits the current flow between the electrodes. Positively charged particles dispersed in the system move in the electric field towards the cathode and negative hydroxide ions, which occurs as a product of water electrochemical reduction, are repulsed. As the zeta potential is the highest for CH-HApcs particles, their movement towards the cathode is strongly favoured. Simultaneously, calcium ions derived from hydroxyapatite might be involved in the formation of calcium hydroxide (Ca(OH)
2) with hydroxide ions created in electrochemical reaction of water reduction. This phenomenon takes place at the deposit-colloid interface. Simultaneously, –NH
3+ groups of chitosan are also deprotonated by hydroxide ions, resulting in neutral amino groups. Then, calcium hydroxide might be immediately chelated by –NH
2 groups, forming coordination bonds with free electron pairs on nitrogen atoms. As a result, this phenomenon initiates deposition of the created complex on the cathode [
28]. The forming layer starts gradually replacing hydrogen bubbles and continuously serves as a base for incoming chitosan chains. Moreover, the initial amperage increase observed for HApcs (
Figure 1B) suggests the promoting effect of this compound on the formation of hydroxide ions. Their formation can be observed with the colour change of phenolphthalein to purple near the cathode. The concentration of hydroxide ions for CH-HApcs is bigger than for CHcs, which causes growth of amperage until a local maximum is reached. As the deposit thickness increases, the resistance of the solution increases too. Upon reaching the maximum values, a drop in amperage is observed. Transport of hydroxide ions originated form water electrolysis and calcium ions derived from hydroxyapatite dissociation is hindered by a deposited layer. Therefore, the formation of calcium hydroxide, which can promote further thickness growth, is inhibited. For lower voltages, the maximum value of amperage is reached later because of slower increase of implant thickness. The lower the set voltages, the lower the value of the maximum amperage. However, for the process initiated at 8 V, there is no maximum observed and only a plateau value exists, which slightly decreases after 20 min. The observed fluctuations of amperage are caused by hydrogen formation, which changes the resistance of the system over time. The high viscosity of CH-HApcs allows for the adhesion of bubbles to implant until they reach the critical size for detachment. The recorded changes of amperage over time as well as a lack of solid deposits for CHcs and HApcs suggest that chitosan-hydroxyapatite electrodeposition results from the interaction between chitosan and hydroxyapatite-derived species.
The amperage plot for the CH electrolyte presents a sharp drop of values over time and solid product is not obtained. Moreover, the amount of hydrogen formed during the process is lower than the one collected for CH-HAp electrolyte. Nevertheless, a denser layer of suspension observed near the cathode after process initiation can cause a resistance increase. Deposition of pure chitosan layer is possible in HCl solution. In the literature, the moving front model was proposed for electrophoretic deposition of chitosan dissolved in this acid. It is based on three assumptions. Firstly, the degree of deprotonation is equal to the total electric charge transferred to the electrode. Secondly, chains in the gel area are totally deprotonated, while those in the solution are totally protonated. Finally, the concentration of chitosan is constant in the entire system. In this model, if the pH gradient front and gelation front are co-localised, the ratio of deprotonation and chitosan deposit formation are equal [
31]. It was confirmed that under constant current density, in pair side-wall electrode system, the thickness gain is linear and increases with the increase of the set current density [
17]. However, it slightly decreases upon chitosan depletion after 100 s. The observation of RHS-rodamine-tagged chitosan electrodeposition indicated that in the area of the gradient, a depletion of chitosan concentration is observed. This is the effect of polymer shrinkage after neutralisation of positive charge on its amino groups. It was postulated that movement of protonated chitosan molecules is controlled by electric field and a concentration gradient [
17]. It is known that the rate of electrodeposition depends also on pH of solution used for process. The lower the pH value, the higher the deposition rate [
32].
The electrodeposition of hydroxyapatite in lactic acid water solution undergoes at almost constant amperage over time, with slight increase for voltages higher than 8 V at the beginning of the process. In this process, the flow rate of hydrogen is almost steady; however, deposition of a solid layer is not observed. This suggests that hydroxyapatite facilitates the current flow during the initial period of the co-deposition process, while migrating chitosan particles and hydrogen bubbles adhered to the cathode. The positive zeta potential of hydroxyapatite in the wide range of pH (3–10) facilitates its movement to the cathode. This might result from the presence of calcium-based ions (e.g., Ca
2+, CaOH
+, CaH
2PO
4+). However, the deposition of hydroxyapatite from aqueous solution is not possible because of the adsorption of water molecules to it [
33]. It was shown that hydroxyapatite can be deposited at the cathode only in non-water solvents, e.g., isopropanol [
14,
34]. Calcium-based positive ions migrating towards cathode are connecting with negative charged ions OH
− and PO
43− to form hydroxyapatite precipitate (Ca
10(PO
4)
6(OH)
2) [
35,
36].
For the chitosan-hydroxyapatite colloidal solution, the number of electrons exchanged (z) can be determined form the following equation:
where
Qt—total electric charge exchanged during electrodeposition over 40 min (C),
—amount of evolved hydrogen over 40 min (mol), and
F—Faraday constant (C/mol).
The obtained values are presented in
Table 3. The integer number calculated for all voltages can be approximated to 2. These calculations confirm that during electrochemical reaction taking place on electrode two electrons are exchange, which does not deny the correctness of the water electrolysis described earlier (Equation (1)). At the outer electrode, which serves as an anode, gas evolution and corrosion of iron was not observed. Nevertheless, oxidation of iron to the ions Fe
2+ might take place. On the other hand, the calculated number of electrons exchanged also suggests the presence of other reactions.
Pictures taken with an optical microscope (
Figure 5) during the process show a sharp pH drop at the interface of the deposit and solution as indicated by a violet colour of phenolphthalein only at the closest area of the cathode. This observation confirms that electrodeposition results from deprotonation of positive-charged chemical particles. An analysis of the average deposit thickness over time indicates its constant increase during the initial period. Upon reaching the maximum value of thickness, shrinkage of deposit is observed. This phenomenon might be caused by hydrogen detaching from the bulk of the deposited layer. In addition, it might result from a lack of new hydroxide ions. The secondary protonation of chitosan chain is hindered. As a consequence, it leads to the partial dissolution of the deposited layer exposed to the direct contact with the electrodeposition solution. Comparing changes in thickness, the total electric charge exchanged, and hydrogen volume, it can be observed that after 20 min, the deposit does not increase in thickness, a smaller amount of charge is exchanged, and hydrogen evolution is nearly entirely suppressed. Moreover, almost steady value of current is reached. It suggests that the charge transfer induces electrochemical reduction of water, which provides hydroxide ions, which in turn cause the hydrogel deposition.
The lower the set voltages, the lower irregularity of the external surface of the deposit. It is an effect of the slower rate of hydrogen formation and less amperage fluctuation during the process. Optical microscope photographs taken during electrodeposition (
Figure 5) show a higher irregularity of deposited material on the cathode rod at the beginning of the process. Taking into consideration the average mass of the obtained conduits from CH-HApcs, an insignificant influence of voltage on the final dry product weight can be found. Moreover, looking at the thickness gain rate, the highest local maximum can be observed for 16 and 20 V. Analysing the total electric charge exchanged during the process, the received values are the highest for 12 and 16 V. The water content is the highest for 8 V, whereas the apparent density is the lowest. The mass of the deposit (m
h and m
d) is the highest for 12 V. Moreover, the total amount of evolved hydrogen is the highest for 16 V. In addition, the inhibiting effect of a higher voltage on hydrogen liberation can be noticed. For 24 V, the volume of evolved gas is two times lower than for 12 and 16 V.
Comparison of FTIR spectra of inner and outer surfaces of CH-HAp deposit with the ones of chitosan and hydroxyapatite indicates creation of heterogeneous chemical structure. Both the outer and inner surface spectra show signals at 3633 cm
−1 that are characteristic for the stretching mode of the -OH bond. They are also characterised by peaks located in the range from 1020 to 1140 cm
−1, which can be assigned to chitosan. However, for the outer surface, these signals are more pronounced. Weak signals, characteristic for phosphate ions as well as lactate, indicate that these moieties created interactions with chitosan chains. Considering the possible interactions between the ingredients of the deposit, it can be concluded that Ca
2+ ions originating from hydroxyapatite might interact with dissociated carboxyl groups of lactic acid or amino groups of chitosan [
7]. The intensity of the peaks at 3633, 1401 and 880 cm
−1 is higher for the inner surface of the CH-HAp deposit than for the outer one. It may suggest that the ratio of hydroxyapatite-derived species to chitosan chains is higher for the inner surface.
Co-deposition of chitosan and hydroxyapatite is possible while hydroxyapatite-derived species are chelated by previously deprotonated amino groups, which can be confirmed by higher values of zeta potential for particles in CH-HApcs. After water electrolysis, during which hydroxide ions are produced, chitosan chains bonded with calcium ions connect with them and form porous semi-solid gel on the cathode. Hydroxyl groups can be observed also on outer sidewall of deposit, although in smaller amounts (comparing FTIR signals for inner and outer surface). This can also be an explanation of further inhibition of chitosan deposition. While hydroxyl groups are connected to the gel, they cannot bind to other chitosan chains. Moreover, subsequent production of hydroxide ions on electrode is hindered because of a prior deposited layer. The formed layer can also obstruct negative charge of the electrode for positive charged particles of chitosan and hydroxyapatite, which as a consequence leads to the inhibition of particle migration towards the cathode.
SEM images of the obtained deposits show higher surface irregularities for samples obtained at higher voltages. The water content for deposits obtained from electrodeposition processes is higher for deposits prepared at lower voltages, whereas the apparent density is higher for deposits prepared at higher voltages. The appropriate combination of the parameters influencing deposit porosity is a crucial factor in electrodeposition, which ensures the transport of hydrogen and ions between the solution and cathode.


