A Novel Tool for Visualization of Water Molecular Structure and Its Changes, Expressed on the Scale of Temperature Influence
Abstract
1. Introduction
2. Results and Discussion
2.1. Results of Temperature Experiment
2.2. Results of Potassium Chloride Experiment
3. Materials and Methods
3.1. Samples
3.2. The Temperature Experiment
3.3. The Potassium Chloride Experiment
3.4. NIR Spectral Acquisition
3.5. Statistical Data Analysis
3.5.1. Calculation Protocol of “Classic” Aquagram
3.5.2. Calculation Protocol for Newly Developed (Temperature-Based) Aquagram
- Step 1.
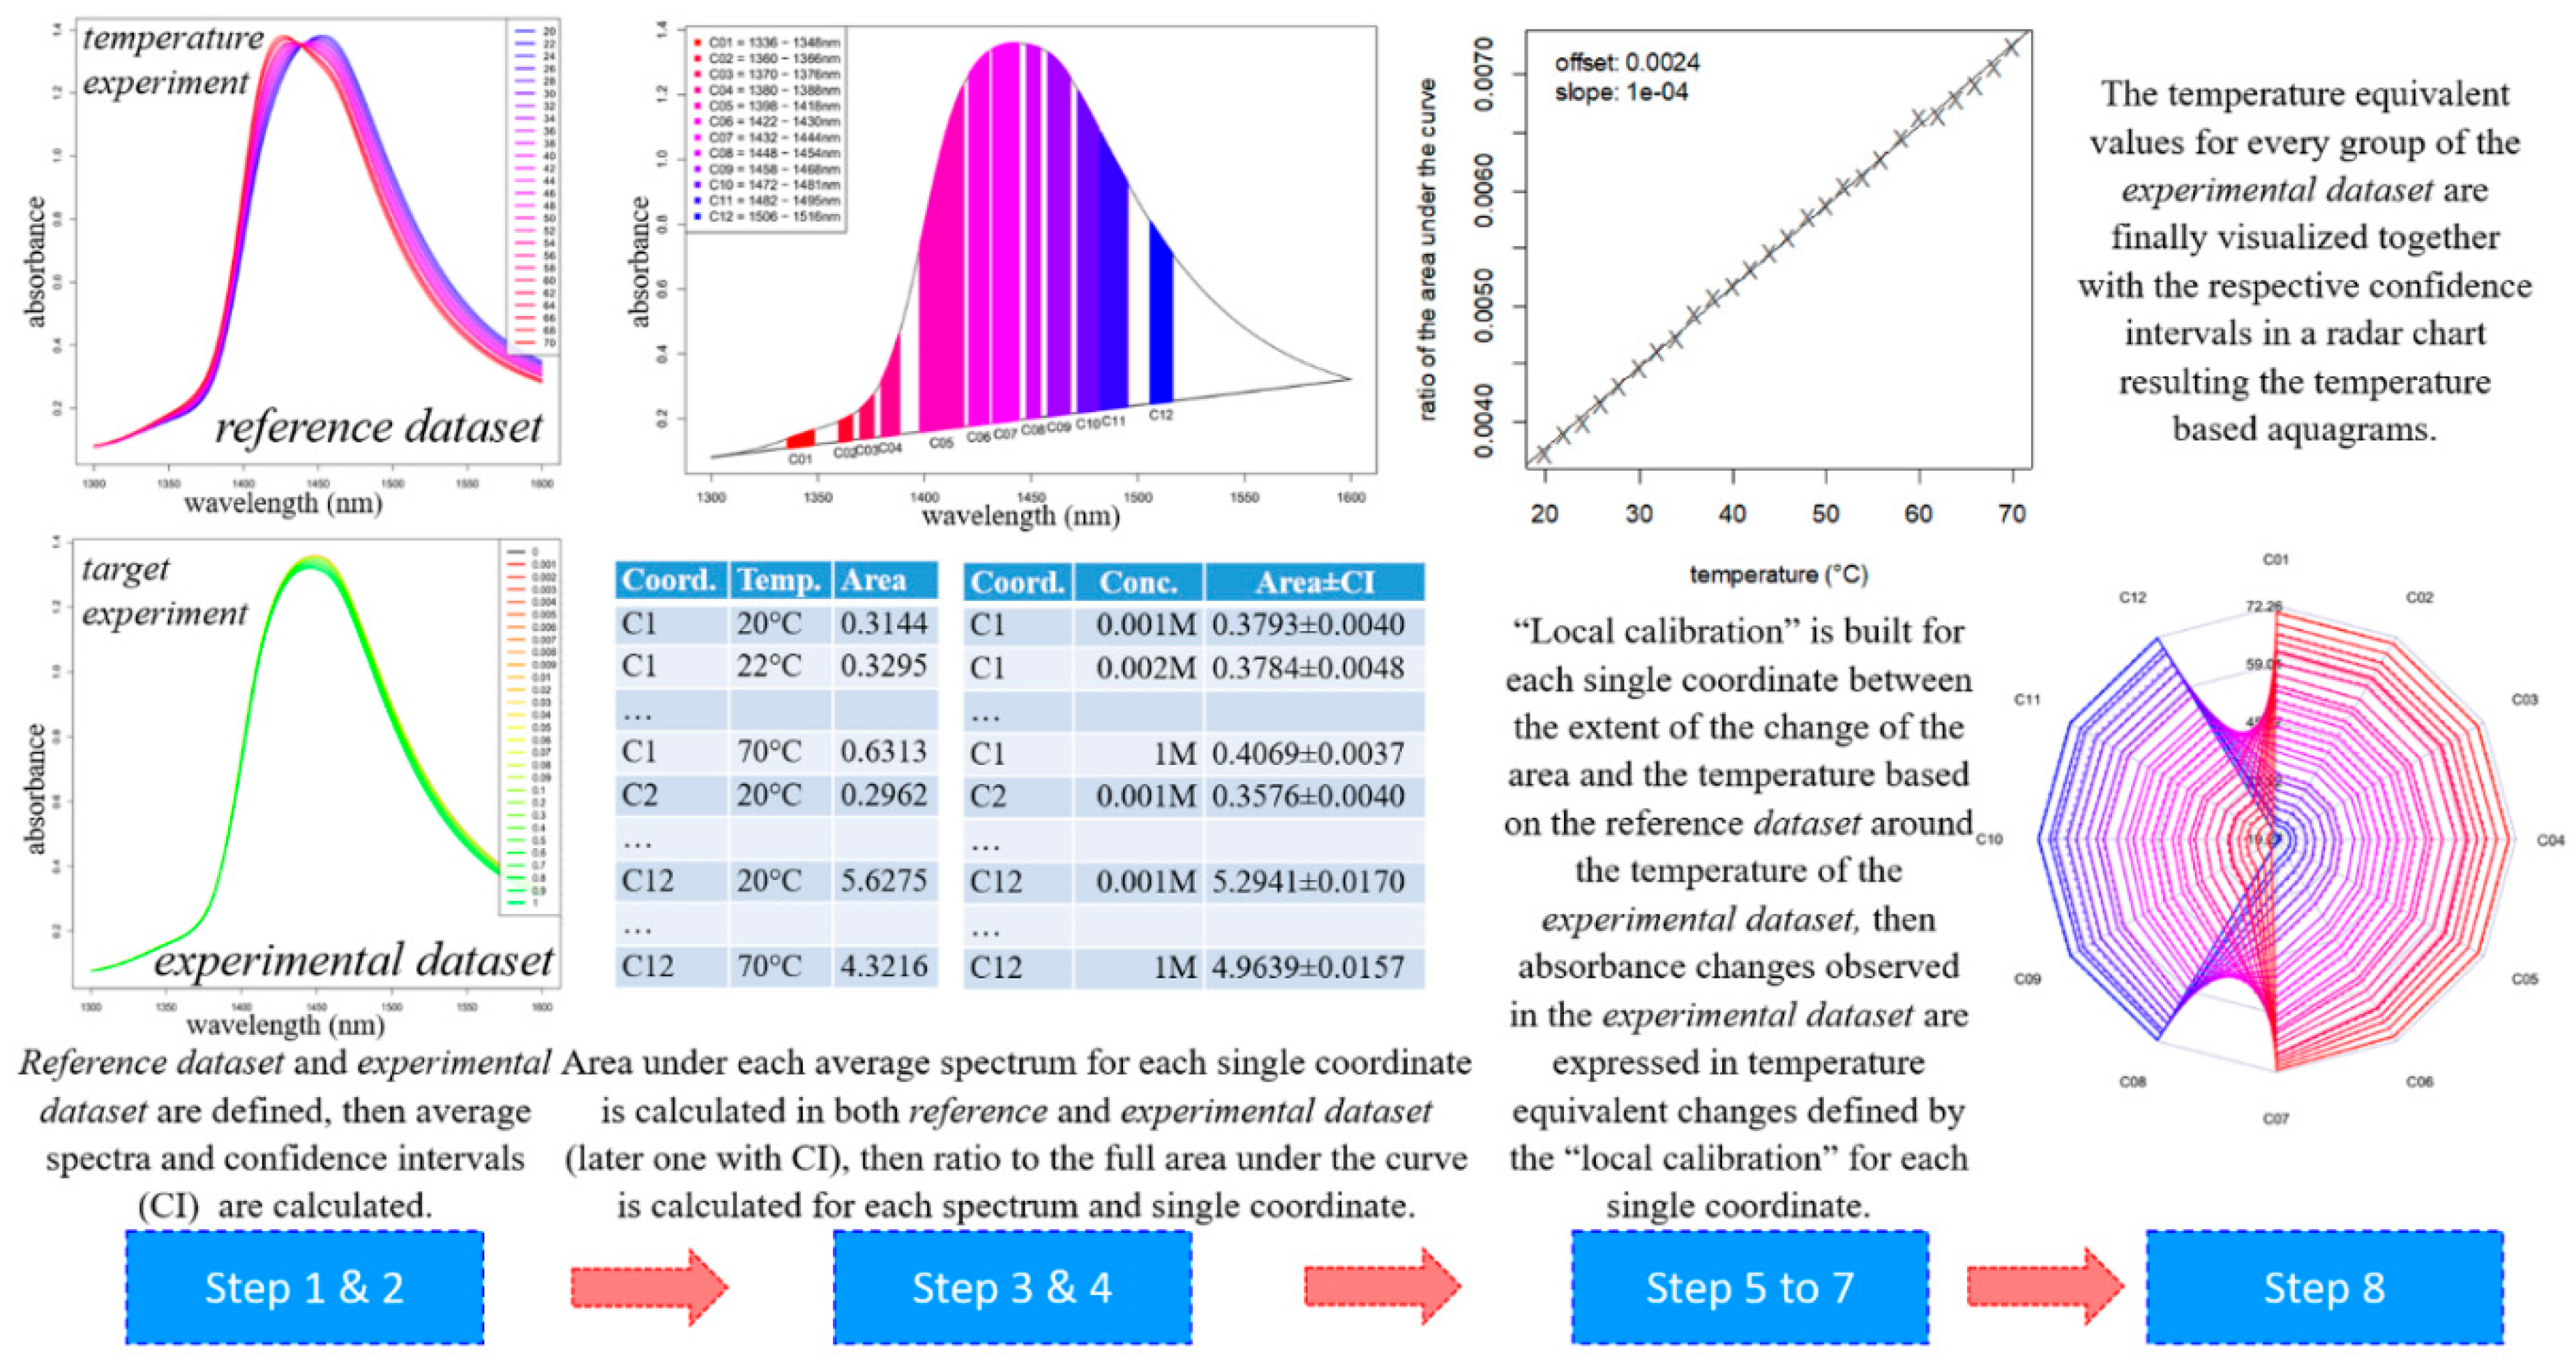
- The dataset of the temperature experiment (i.e., the spectra of the Milli-Q water samples acquired during the temperature experiment in the temperature range between 20–70 °C) is defined as the reference dataset.The dataset of the experiment of interest is defined as the experimental dataset.
- Step 2.
- The average spectra of the consecutive scans are calculated for each temperature step, yielding 26 single, unique spectra in the reference dataset.The average spectra of the groups of interest (in this case, salt concentration levels) are calculated in the experimental dataset together with their respective confidence intervals using the Bootstrap method [55], yielding as many single, unique spectra as there are groups are in the experimental dataset (plus their upper and lower 95% confidence interval limits).
- Step 3.
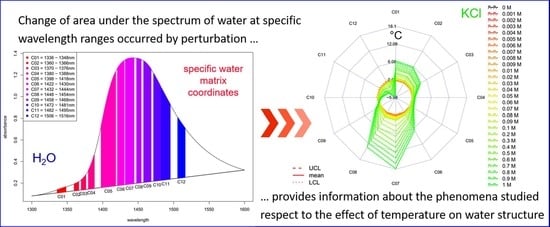
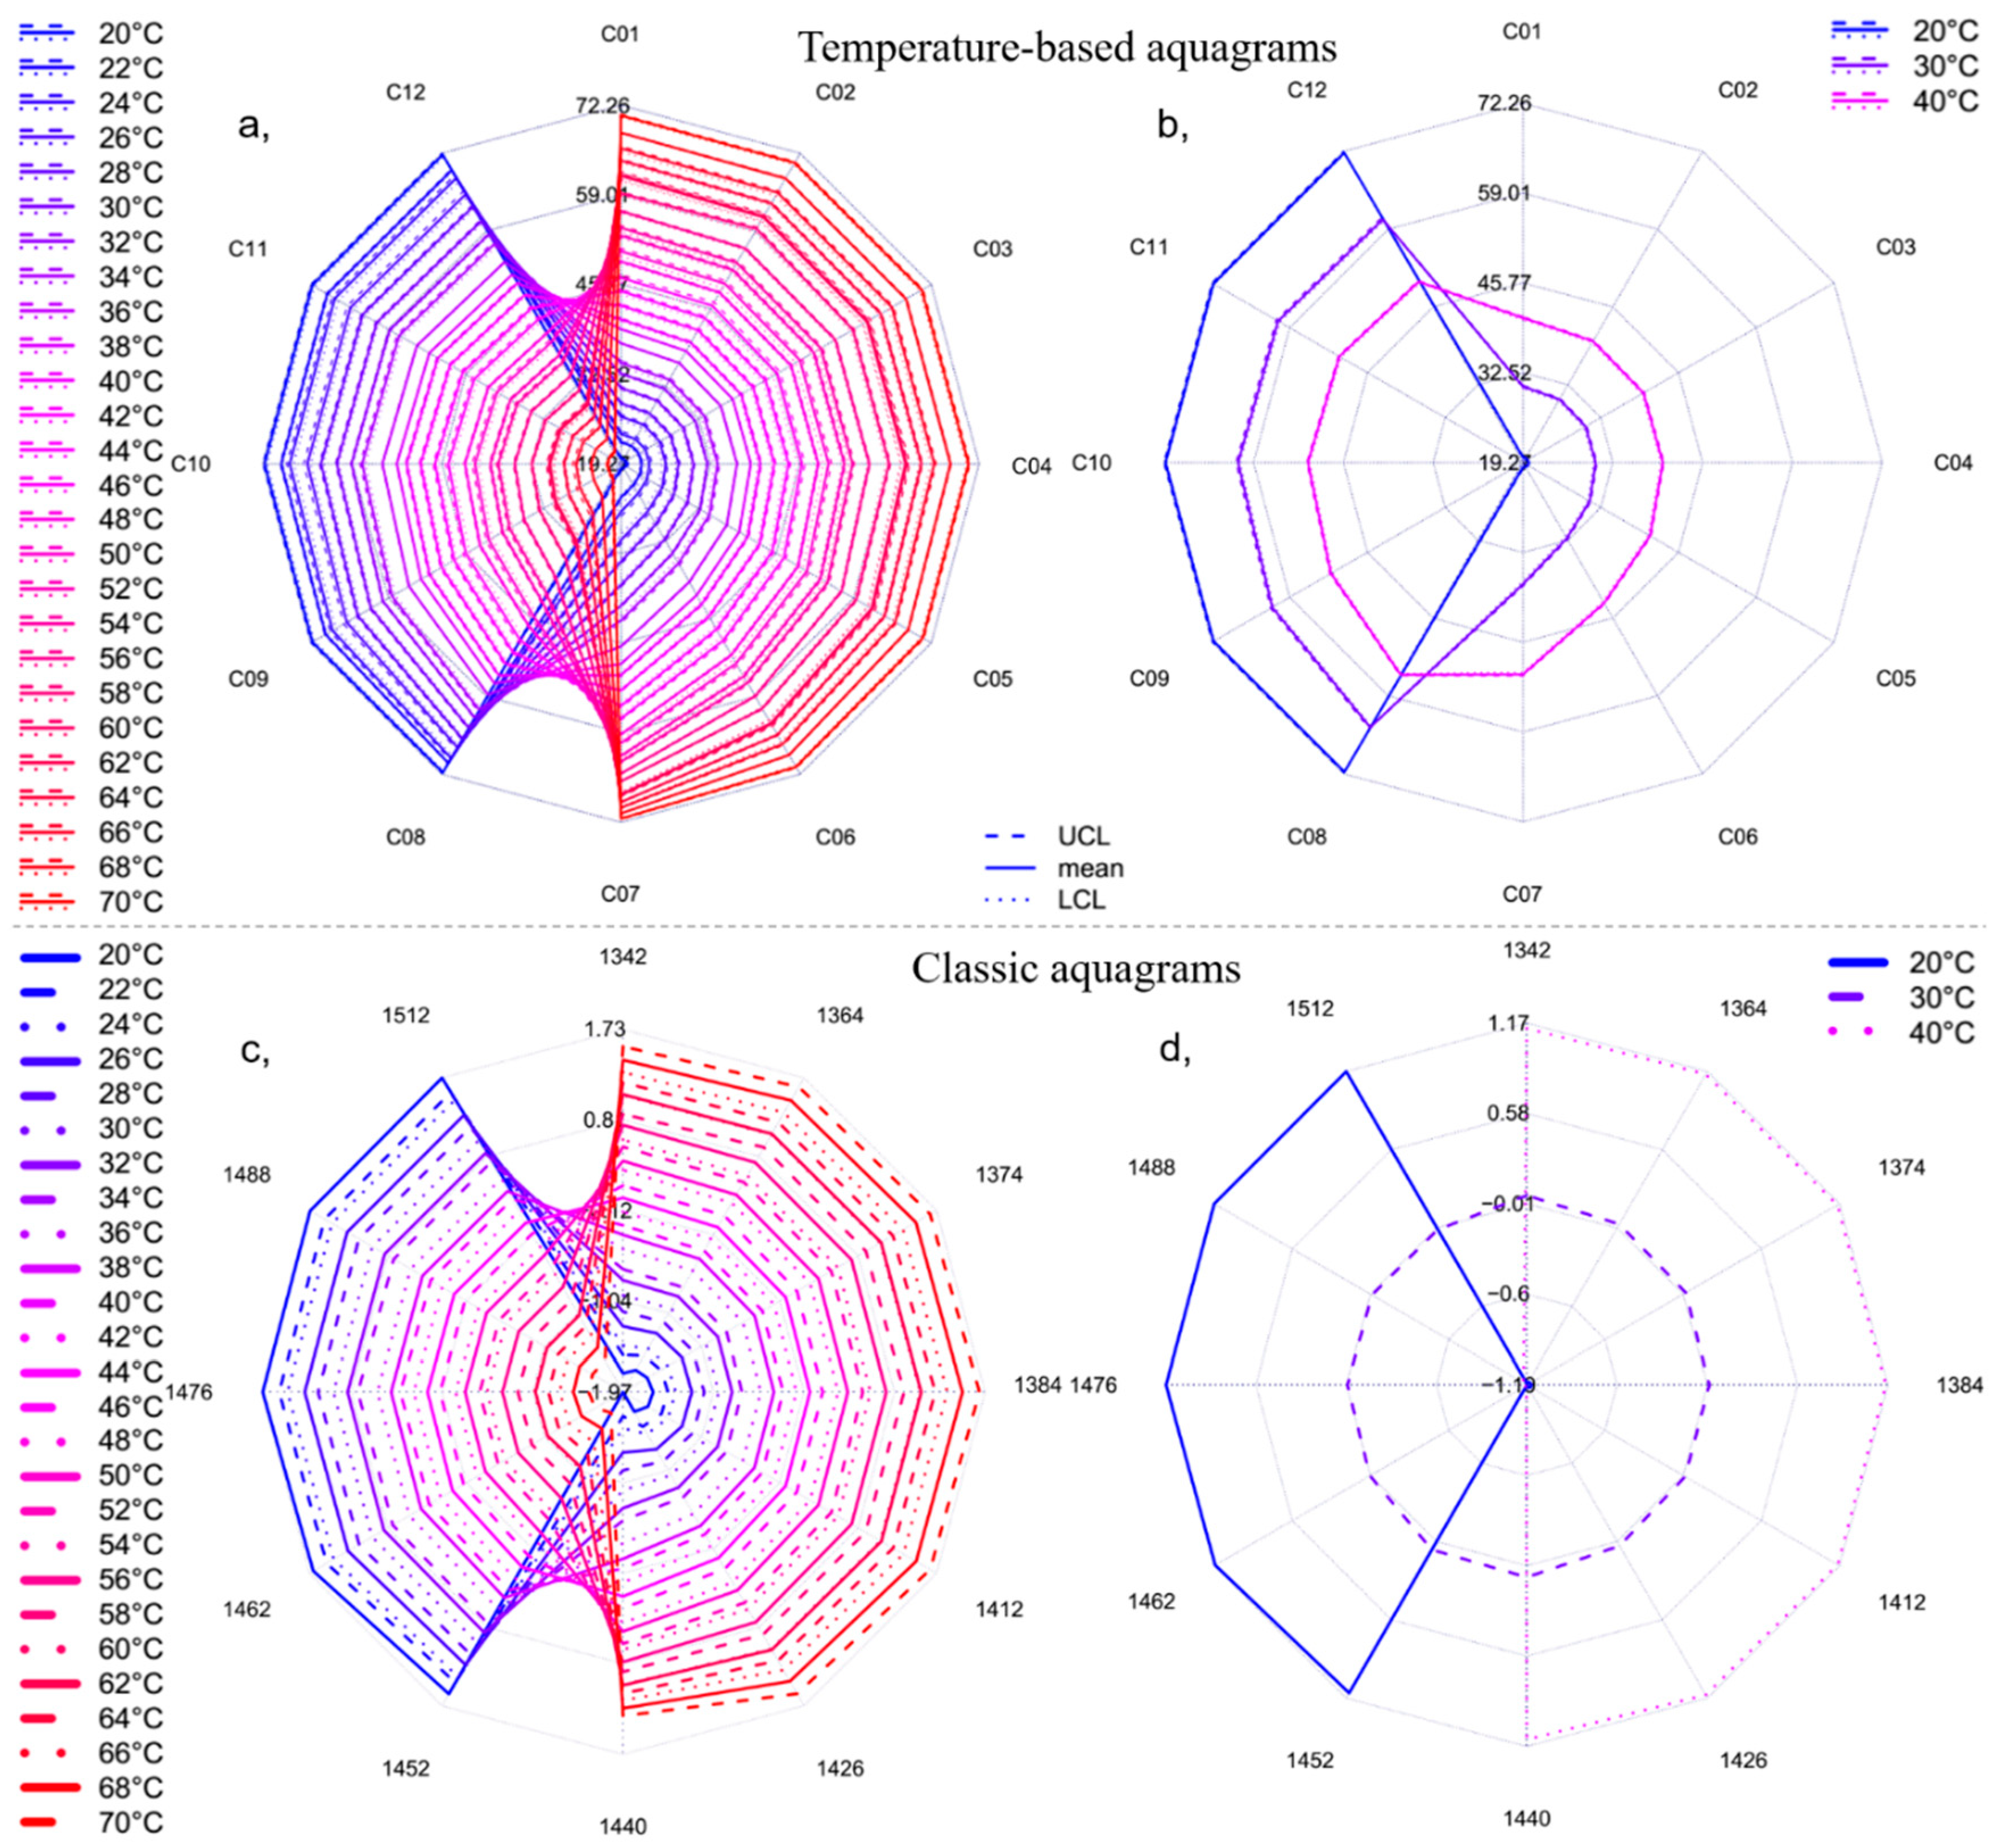
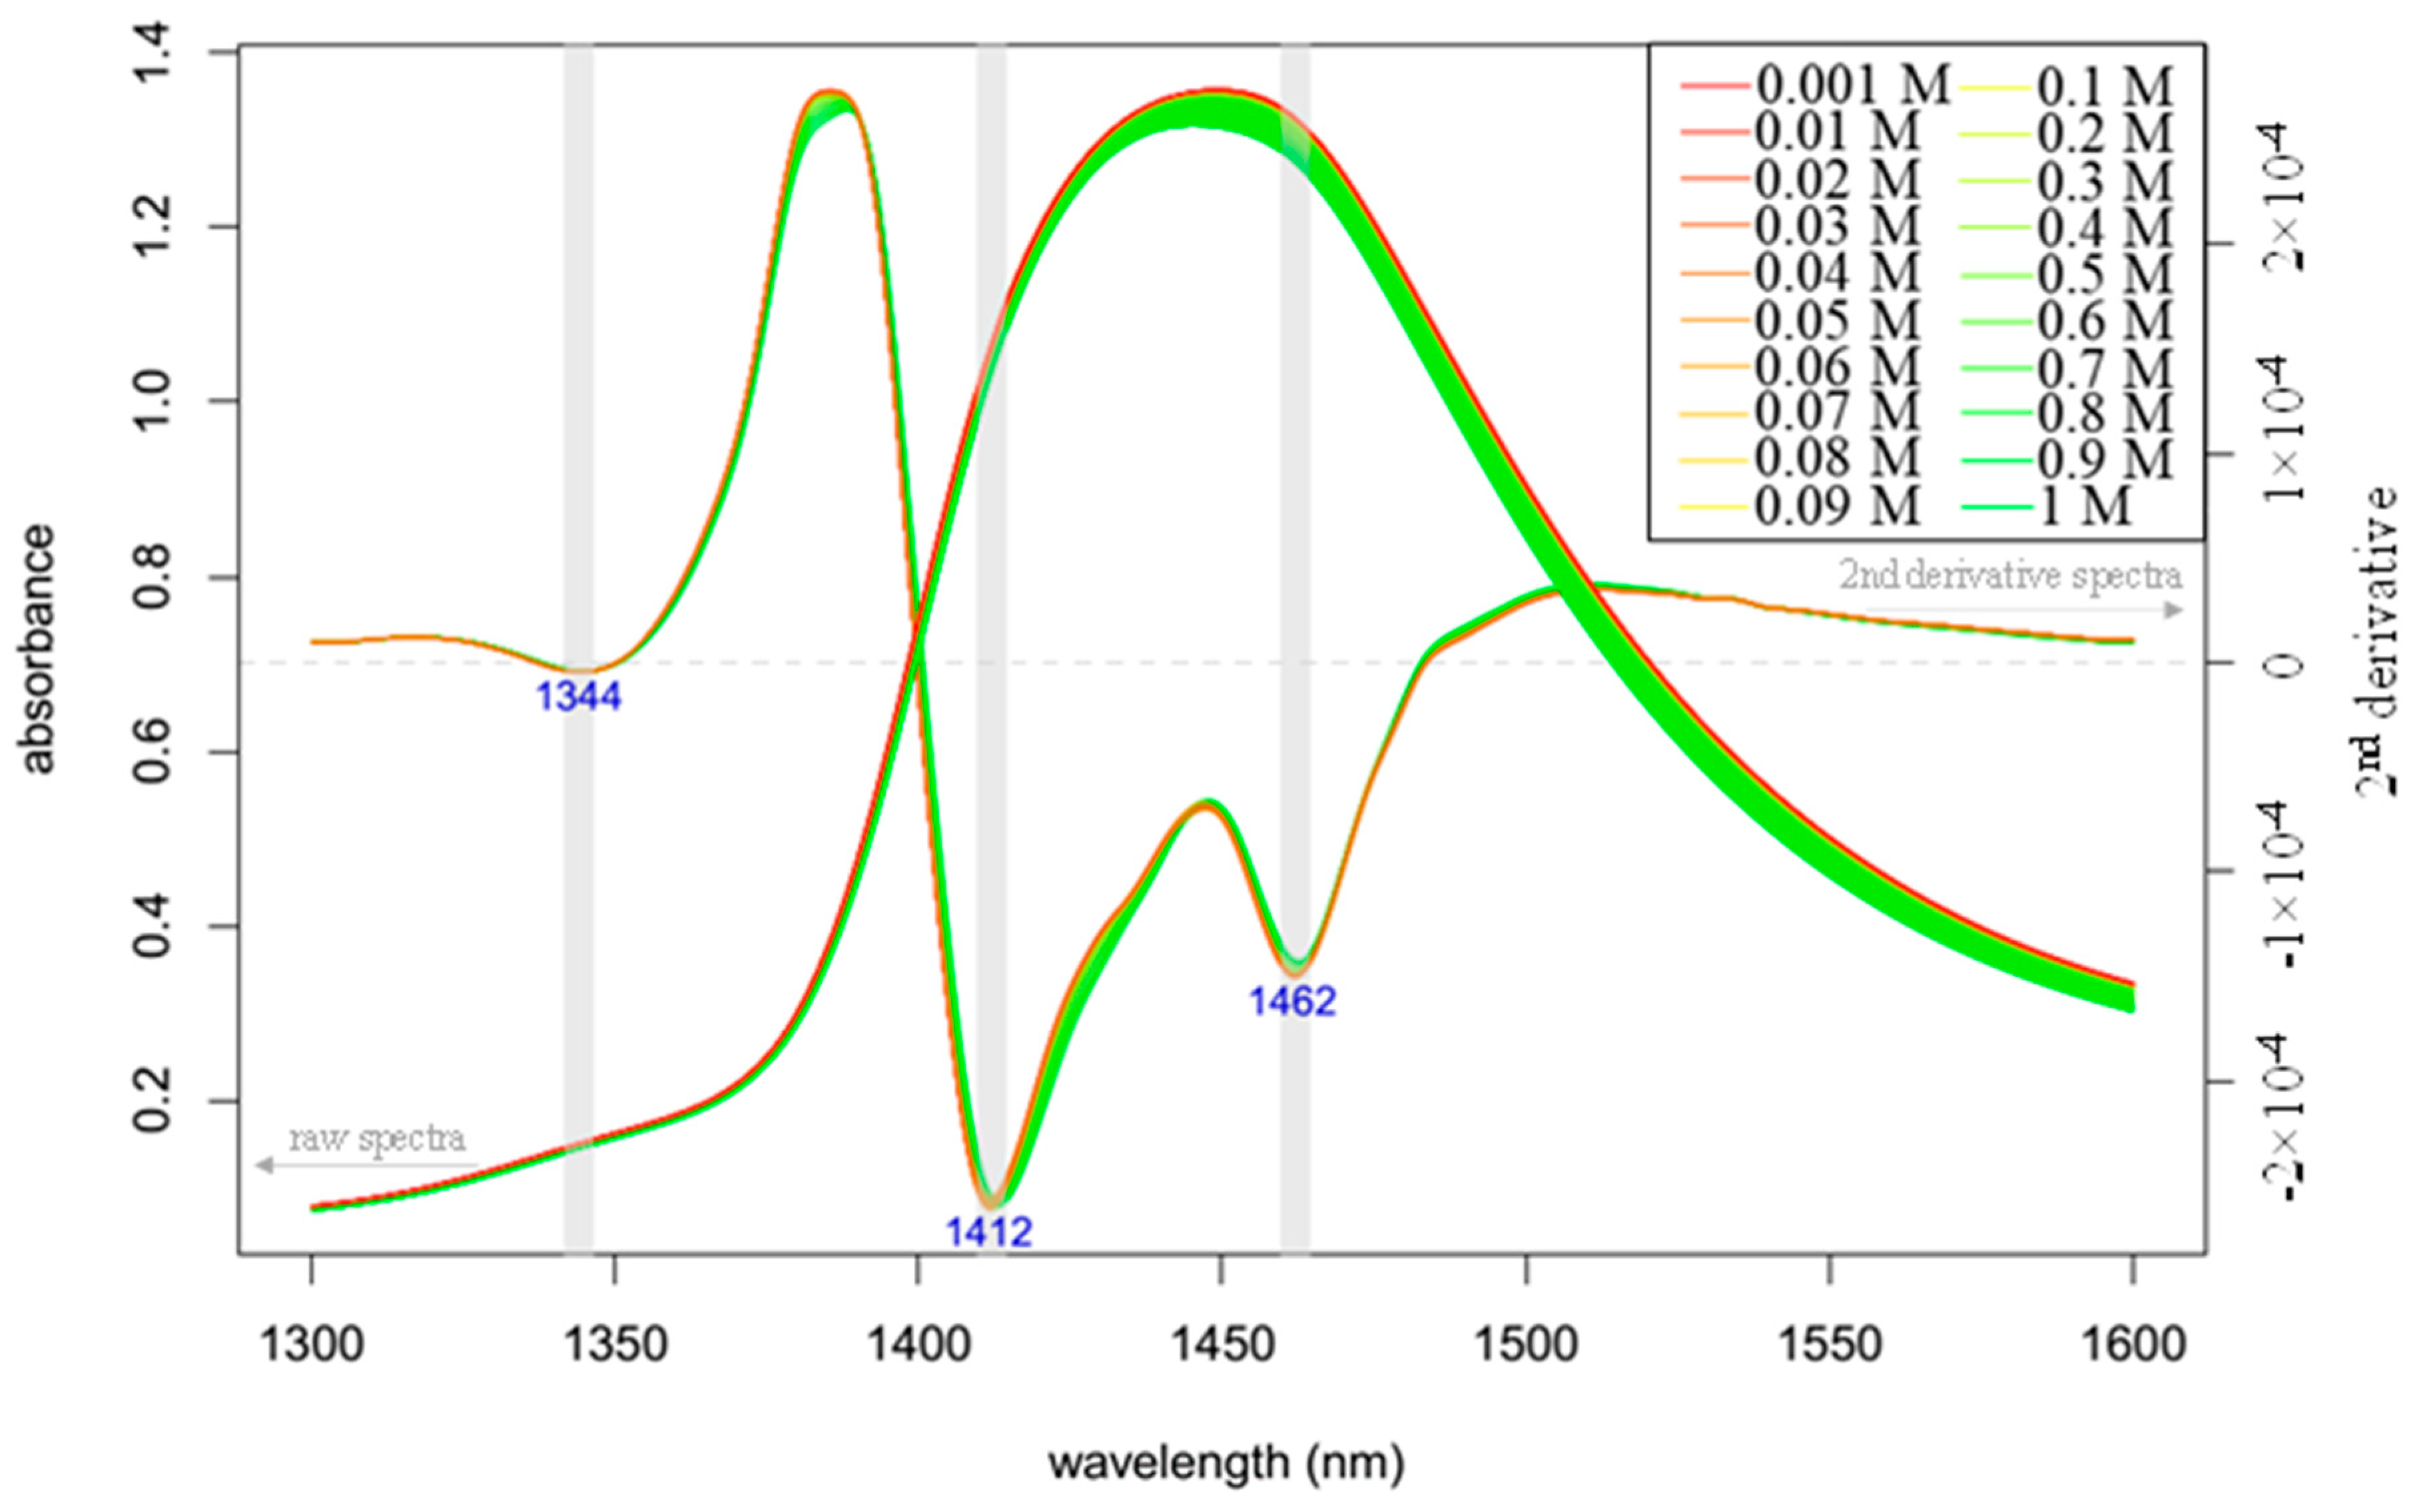
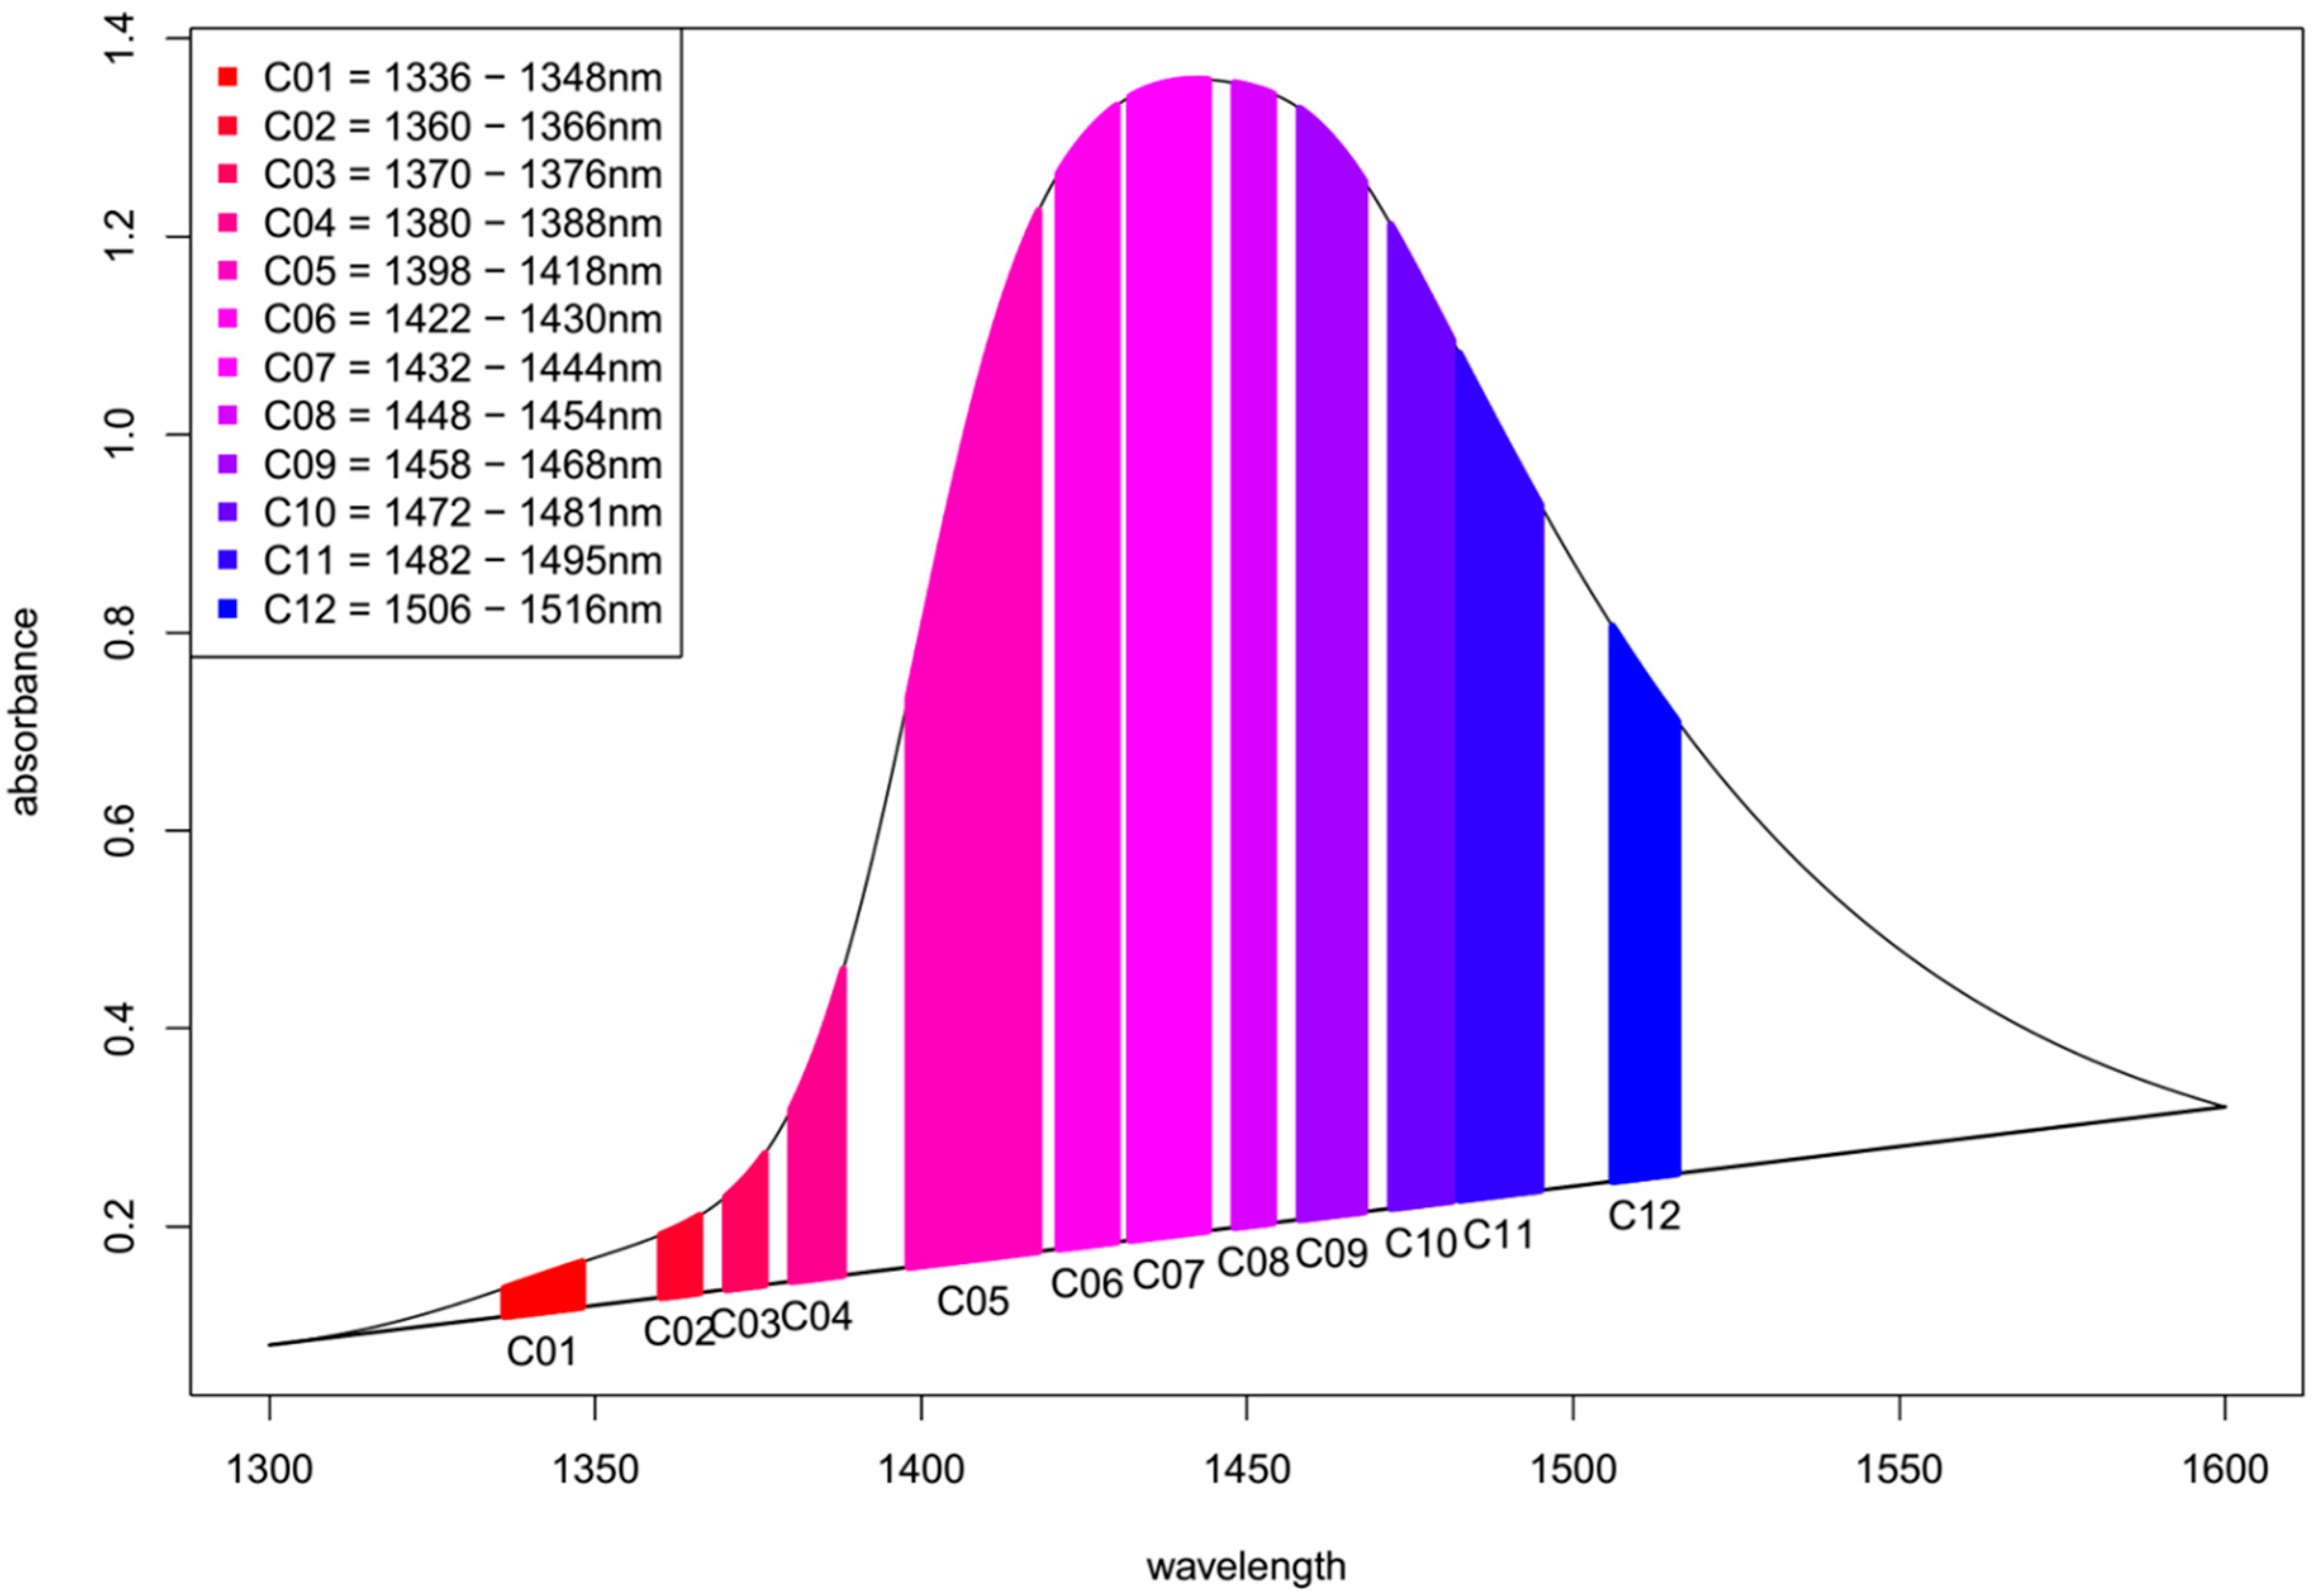
- The area under the spectrum for every single average spectrum—in the reference dataset and in the experimental dataset—at the wavelength range of 1336 to 1348 nm (C01) is calculated taking into account the baseline estimated by linear fitting on the two edges of the first overtone region (i.e., 1300 and 1600 nm). In case of the experimental dataset, the areas of the respective confidence interval limits are also calculated in addition to the area of the average spectrum. Figure 8 provides graphical interpretation of the relevant areas and the wavelength regions used for the 12 coordinates.
- Step 4.
- The ratio of the area under the curve for each single coordinate is calculated with respect to the full area under the curve for the first overtone OH region (i.e., the area of C01 is divided by the full area under the spectrum in the range of 1300 to 1600 nm). This is done for every single average spectrum, in the reference dataset and the experimental dataset (together with the respective confidence interval limits for the experimental dataset). This calculation step provides normalized values and avoids possible differences due to scattering and/or pathlength effects.
- Step 5.
- Based on the reference dataset, a continuous array of values for the relative area of C01 (as calculated in Step 1) is calculated for a continuous temperature range from 20 to 70 °C using local polynomial regression. This is an essential step in order to accommodate the data from an experiment performed at specific temperature—see Step 6.
- Step 6.
- The basic principle of the temperature-based aquagram method is to compare the effect of the perturbation used on the system under study which resulted in a certain water spectral pattern to the effect the temperature changes would induce in pure water. Thus, any perturbation can be expressed as an equivalent temperature effect on a Milli-Q water sample. It is necessary to perform a “local calibration” with the reference dataset around the temperature of the experimental dataset. Therefore, in this step, the temperature calibration range is defined. This range is used to express the effect of perturbation in degrees Celsius equivalent. For this, a symmetrical scale is defined from the reference dataset (calculated at Step 5) using two degrees, plus and minus around the temperature of the experiment (hence, a span of 4 °C). For example, if the experiment was performed at 25.0 °C, then the calibration range of 23.0 to 27.0 °C would be used.
- Step 7.
- The temperature calibration equation, the relationship between the change of the temperature and change of the area of C01 at the temperature of the experiment, is determined based on the calculation performed in Step 5 on the reference dataset. (It is known how the area of C01 changes as a function of temperature described by a linear function). Therefore, it is easy to compare the changes for areas for C01 for the experimental dataset (calculated at Step 3) to the changes of the area of C01 caused by temperature, i.e., to express the changes in C01 in units of temperature (degrees Celsius) equivalent.
- Step 8.
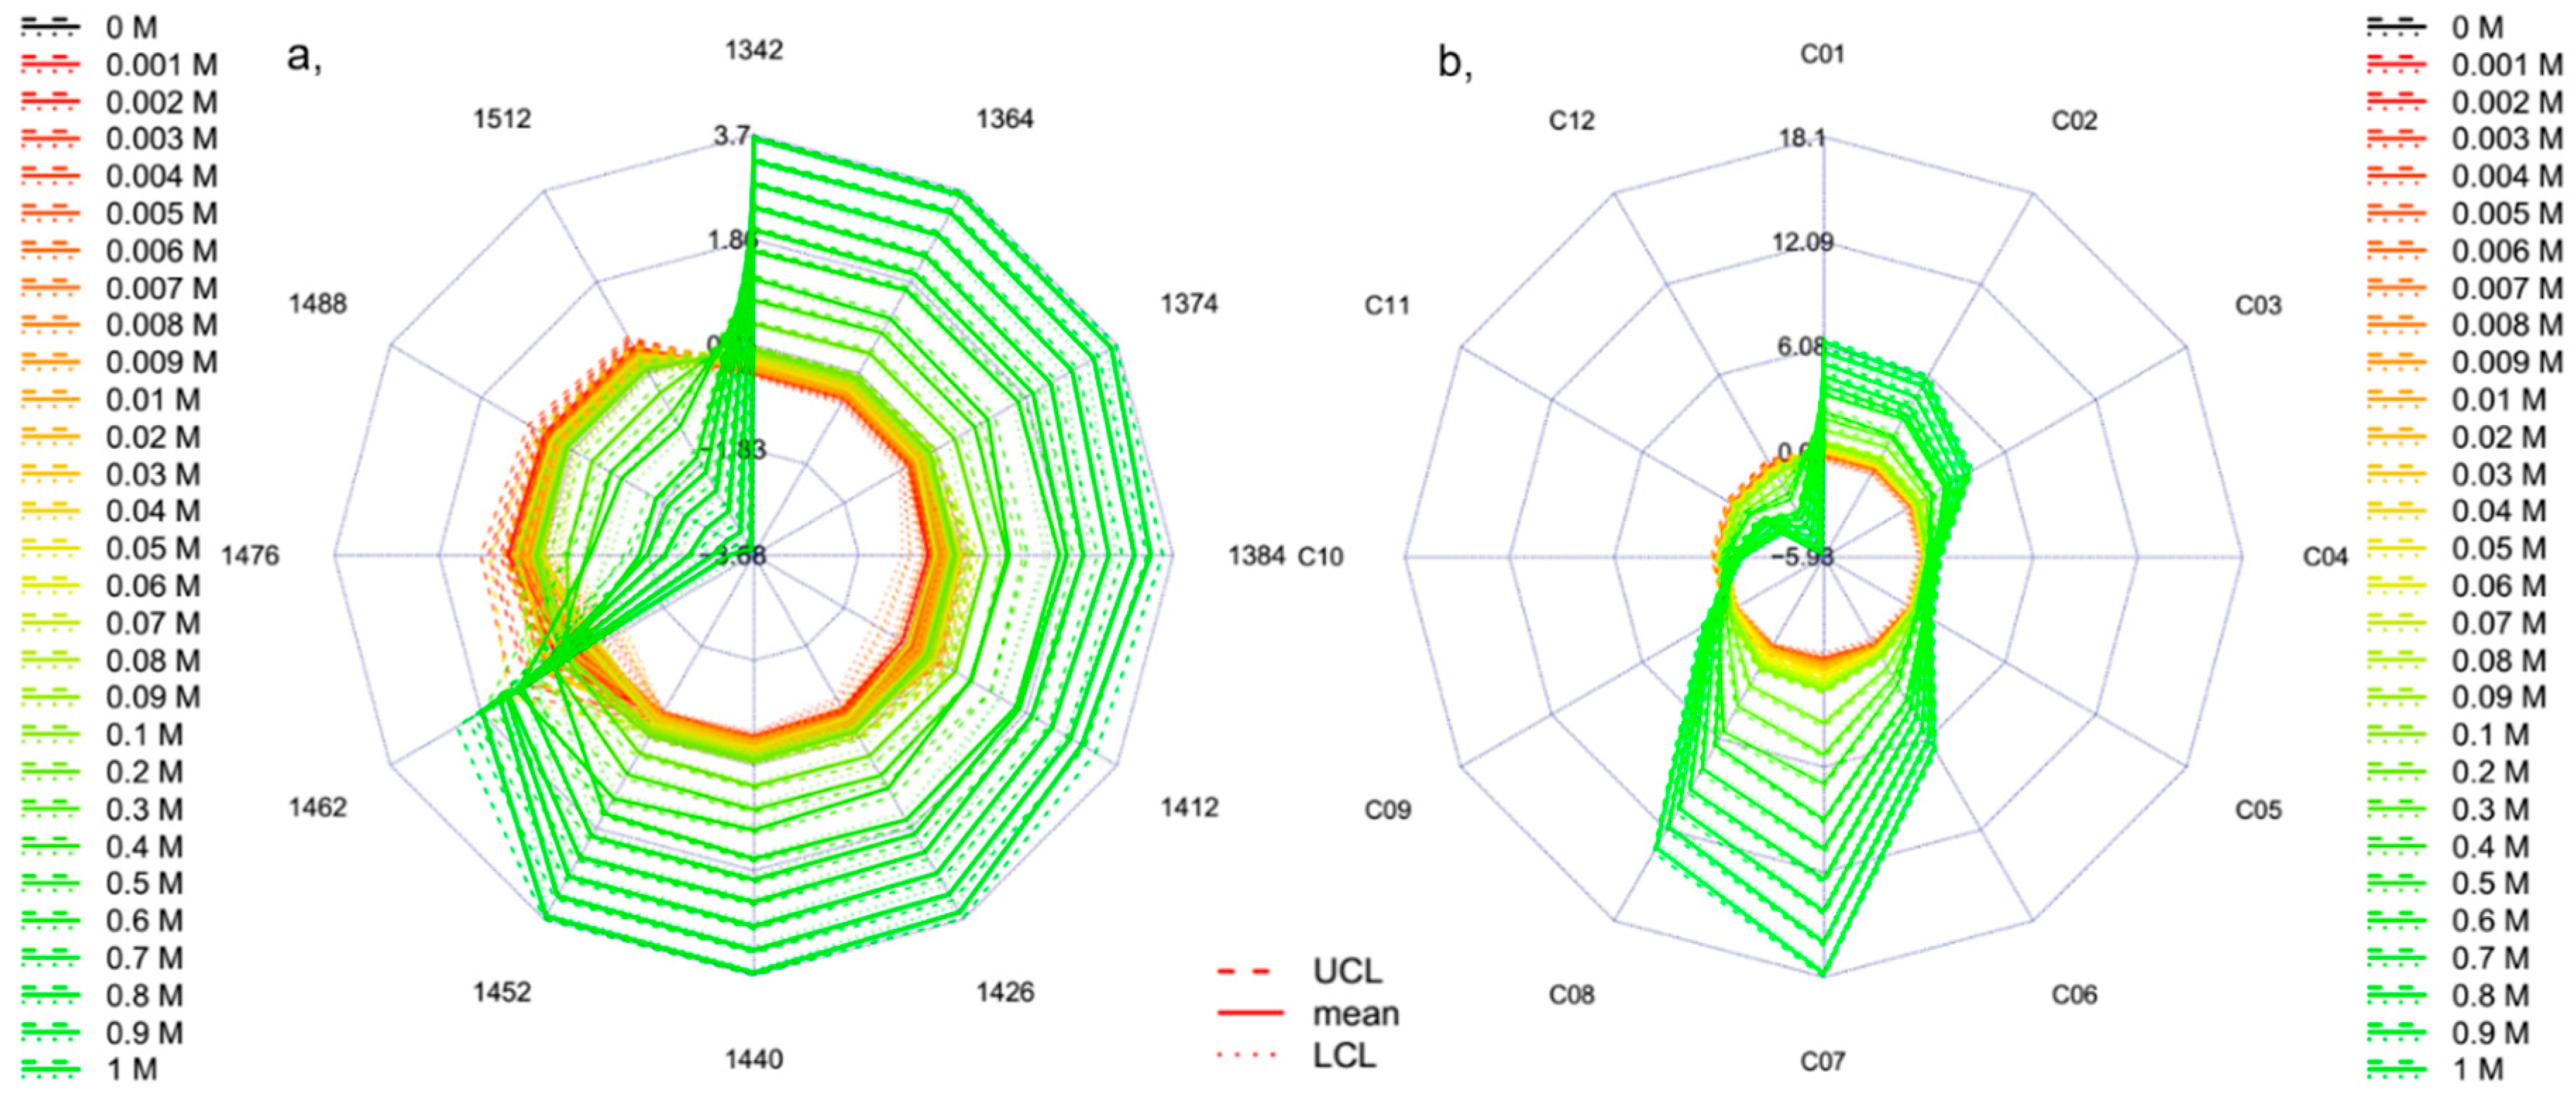
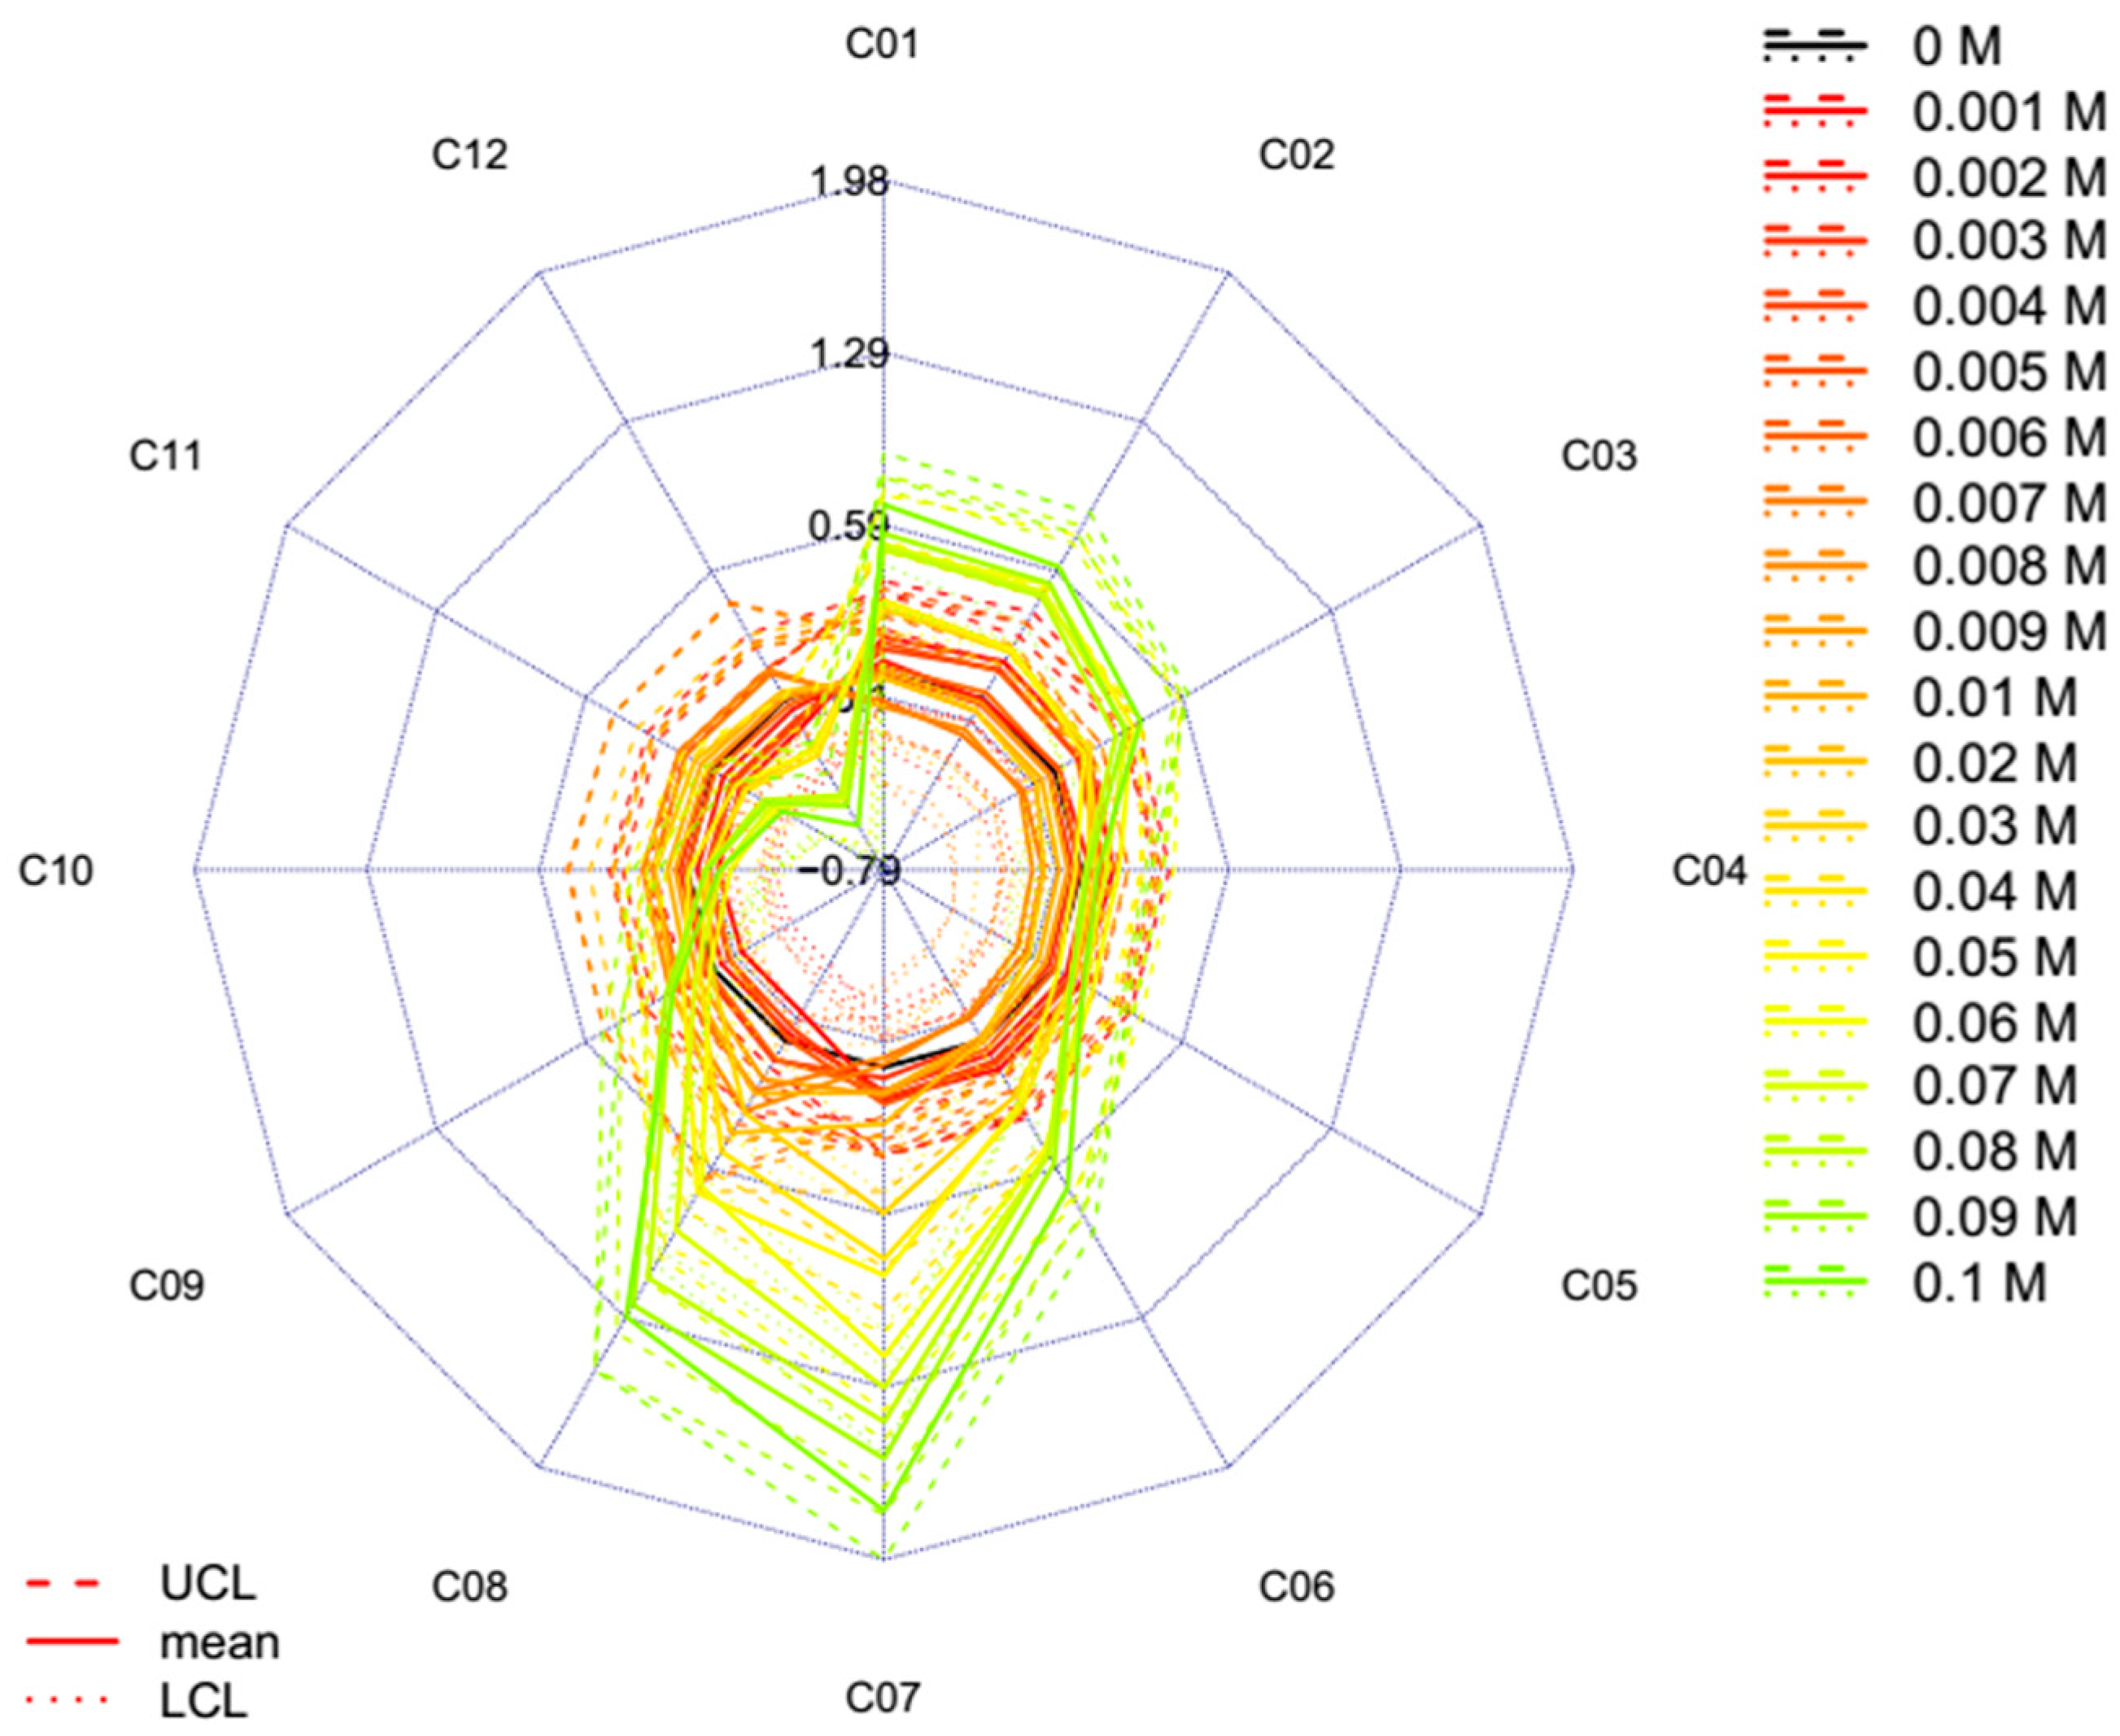
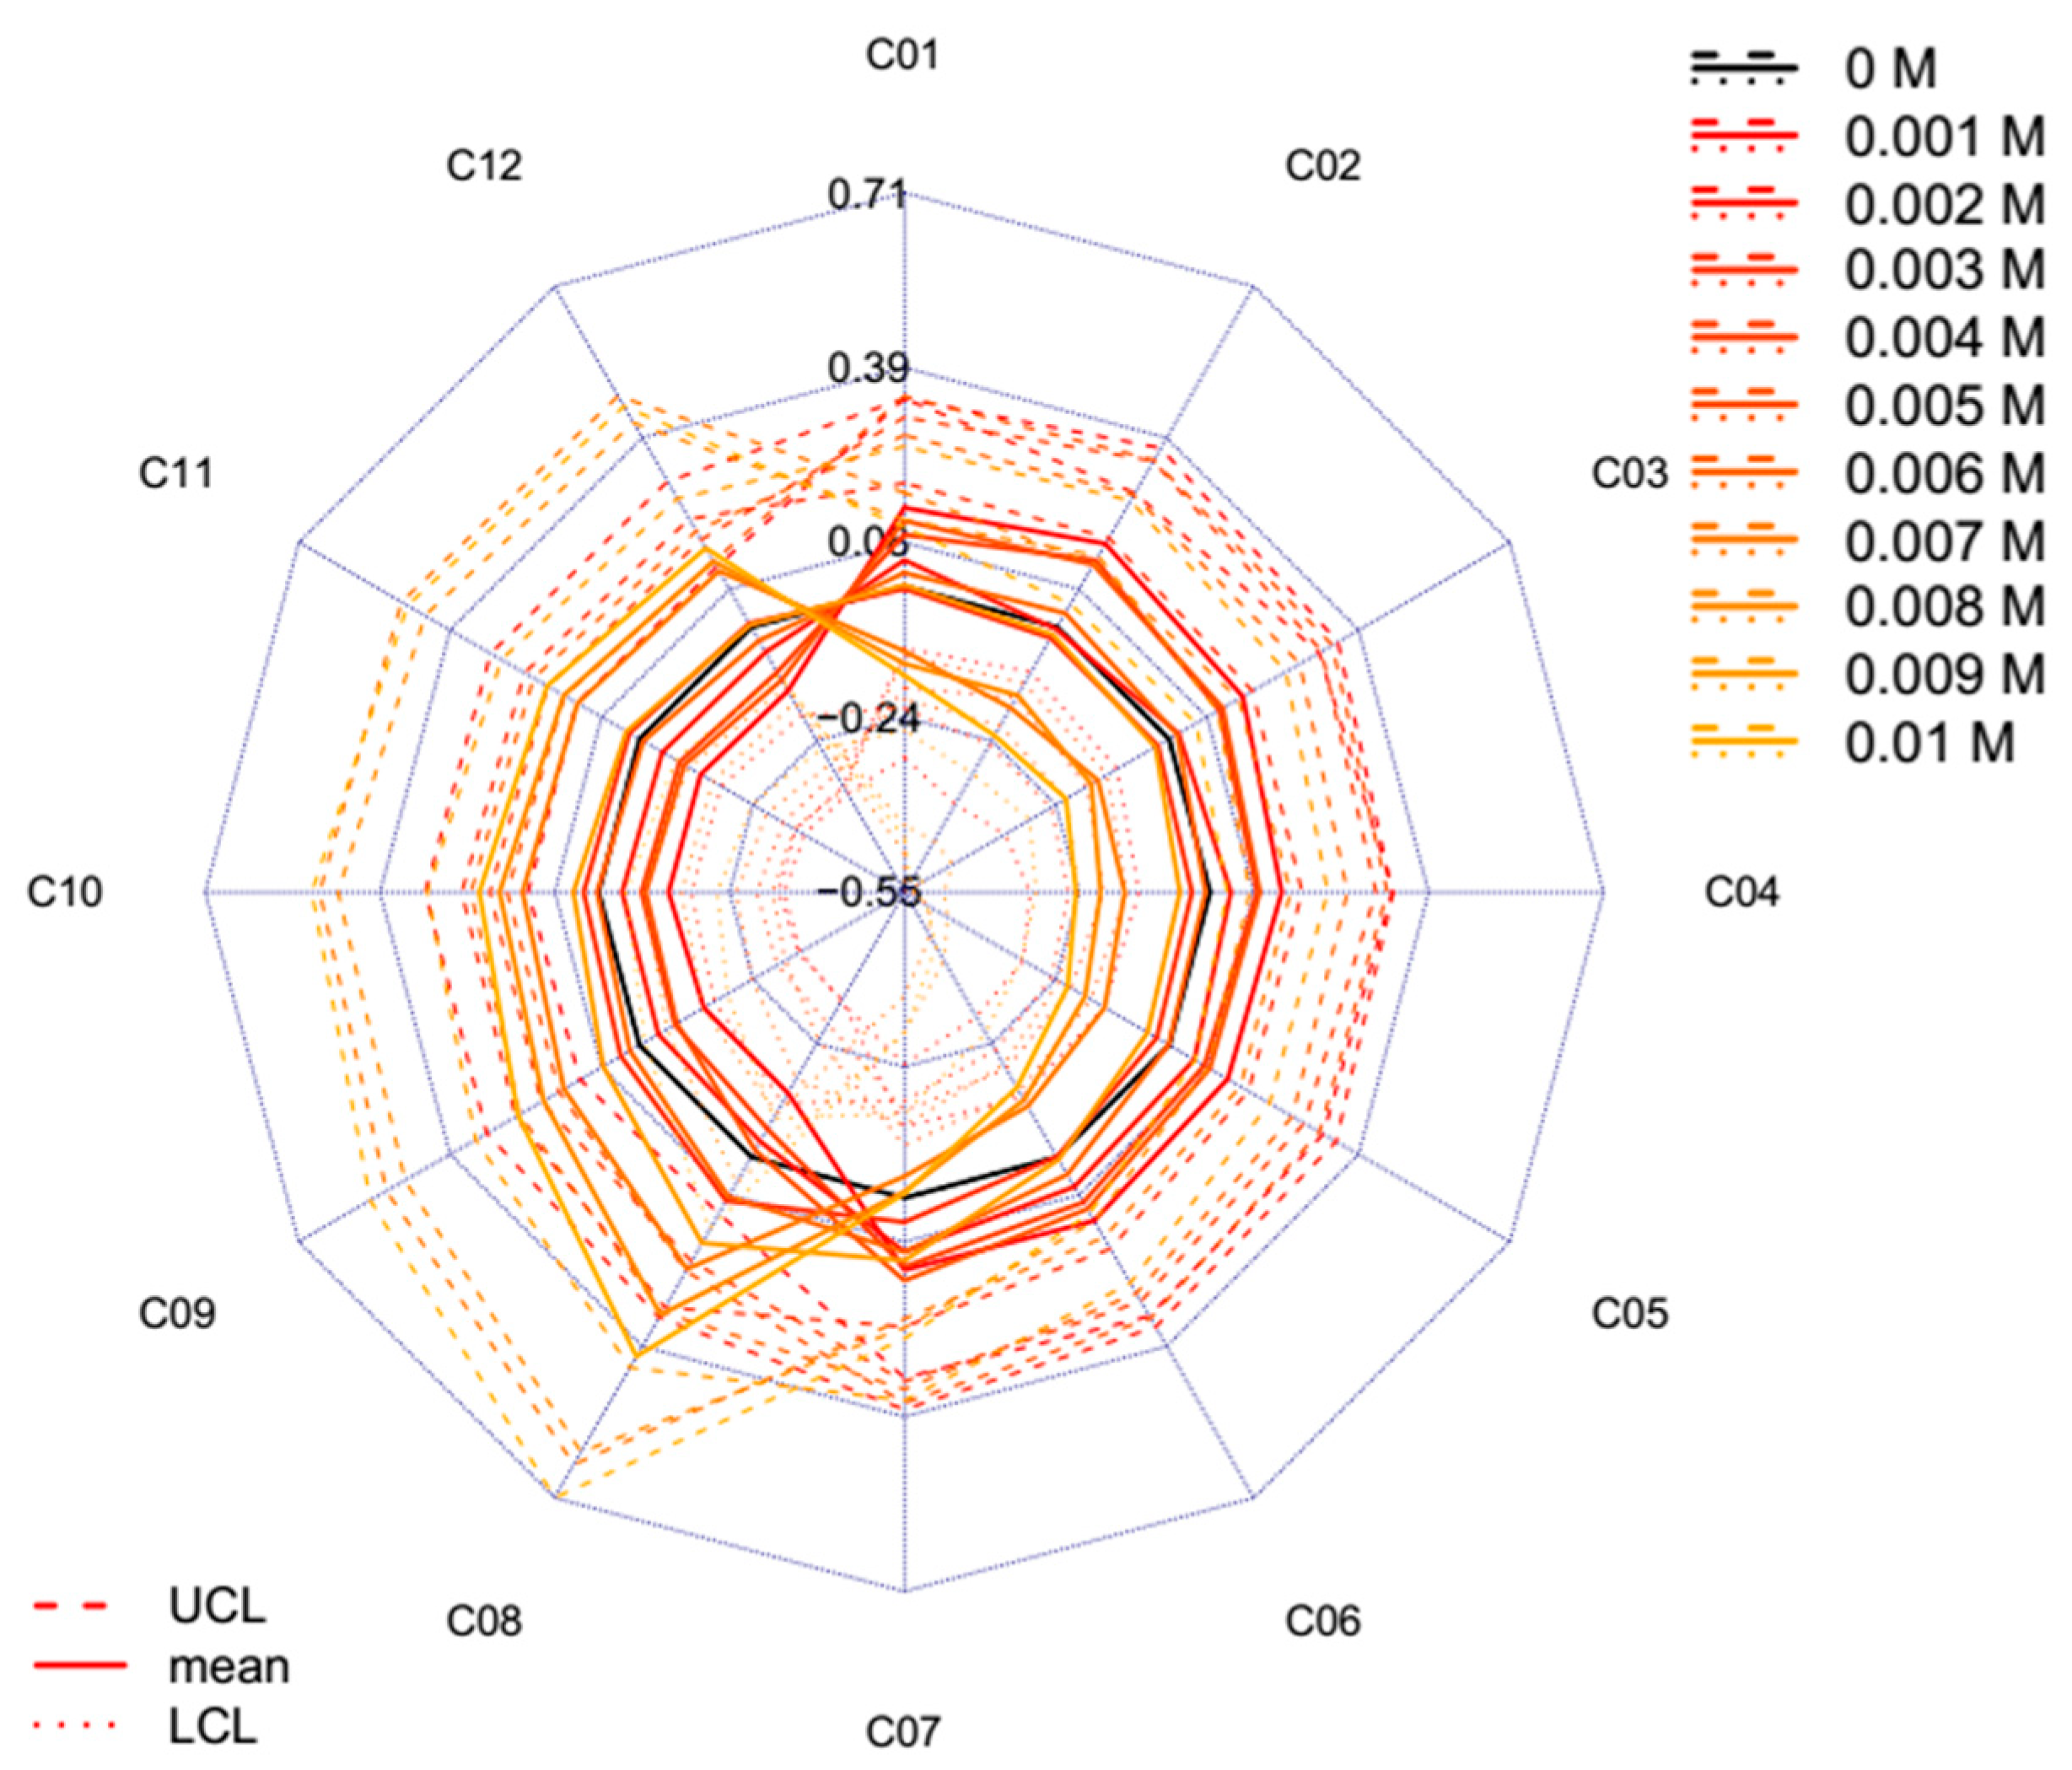
- The calculated temperature (degrees Celsius) equivalent value for every group of the experimental dataset is finally visualized together with the respective 95% confidence intervals in a radar chart, where the units of the axes are in degrees Celsius.
- Step 9.
4. Conclusions
Author Contributions
Funding
Acknowledgments
Conflicts of Interest
Appendix A
Appendix B
References
- Le Bihan, D.; Fukuyama, H. Water; Bihan, D., Fukuyama, H., Eds.; Pan Stanford Publishing: Singapore, 2010; ISBN 978-981-4267-52-6. [Google Scholar]
- Ball, P. Water—An enduring mystery. Nature 2008, 452, 291–292. [Google Scholar] [CrossRef] [PubMed]
- Daviss, B. The Scientist Magazine; LabX Media Group: New York, NY, USA, 2004; pp. 14–15. [Google Scholar]
- Ball, P. Water is an activematrix of life for cell and molecular biology. Proc. Natl. Acad. Sci. USA 2017, 114, 13327–13335. [Google Scholar] [CrossRef] [PubMed]
- Ball, P. Water as an active constituent in cell biology. Chem. Rev. 2008, 108, 74–108. [Google Scholar] [CrossRef]
- Ball, P. Water as a Biomolecule. ChemPhysChem 2008, 9, 2677–2685. [Google Scholar] [CrossRef]
- Tsenkova, R. Aquaphotomics: Dynamic spectroscopy of aqueous and biological systems describes peculiarities of water. J. Near Infrared Spectrosc. 2009, 17, 303–313. [Google Scholar] [CrossRef]
- Tsenkova, R.; Munćan, J.; Pollner, B.; Kovacs, Z. Essentials of aquaphotomics and its chemometrics approaches. Front. Chem. 2018, 6, 363. [Google Scholar] [CrossRef] [PubMed]
- Muncan, J.; Tsenkova, R. Aquaphotomics—From Innovative Knowledge to Integrative Platform in Science and Technology. Molecules 2019, 24, 2742. [Google Scholar] [CrossRef]
- Van de Kraats, E.B.; Munćan, J.; Tsenkova, R.N. Aquaphotomics—Origin, concept, applications and future perspectives. Substantia 2019, 3, 13–28. [Google Scholar]
- Mancinelli, R.; Botti, A.; Bruni, F.; Ricci, M.A.; Soper, A.K. Hydration of sodium, potassium, and chloride ions in solution and the concept of structure maker/breaker. J. Phys. Chem. B 2007, 111, 13570–13577. [Google Scholar] [CrossRef]
- Gallo, P.; Corradini, D.; Rovere, M. Ion hydration and structural properties of water in aqueous solutions at normal and supercooled conditions: A test of the structure making and breaking concept. Phys. Chem. Chem. Phys. 2011, 13, 19814. [Google Scholar] [CrossRef]
- Giangiacomo, R. Study of water–sugar interactions at increasing sugar concentration by NIR spectroscopy. Food Chem. 2006, 96, 371–379. [Google Scholar] [CrossRef]
- Segtnan, V.H.V.; Šašić, Š.; Isaksson, T.; Ozaki, Y.; Šašić, S.; Isaksson, T.; Ozaki, Y.; Sasic, S.; Isaksson, T.; Ozaki, Y. Studies on the structure of water using two-dimensional near-infrared correlation spectroscopy and principal component analysis. Anal. Chem. 2001, 73, 3153–3161. [Google Scholar] [CrossRef] [PubMed]
- Gowen, A.A.; Amigo, J.M.; Tsenkova, R. Characterisation of hydrogen bond perturbations in aqueous systems using aquaphotomics and multivariate curve resolution-alternating least squares. Anal. Chim. Acta 2013, 759, 8–20. [Google Scholar] [CrossRef] [PubMed]
- Goto, N.; Bazar, G.; Kovacs, Z.; Kunisada, M.; Morita, H.; Kizaki, S.; Sugiyama, H.; Tsenkova, R.; Nishigori, C. Detection of UV-induced cyclobutane pyrimidine dimers by near-infrared spectroscopy and aquaphotomics. Sci. Rep. 2015, 5, 11808. [Google Scholar] [CrossRef]
- Jinendra, B. Near Infrared Spectroscopy and Aquaphotomics: Novel Tool for Biotic and Abiotic Stress Diagnosis of Soybean. Ph.D Thesis, Kobe University, Kobe, Japan, 2011. [Google Scholar]
- Tsenkova, R. Aquaphotomics: Water in the biological and aqueous world scrutinised with invisible light. Spectrosc. Eur. 2010, 22, 6–10. [Google Scholar]
- Kinoshita, K.; Miyazaki, M.; Morita, H.; Vassileva, M.; Tang, C.; Li, D.; Ishikawa, O.; Kusunoki, H.; Tsenkova, R. Spectral pattern of urinary water as a biomarker of estrus in the giant panda. Sci. Rep. 2012, 2, 856. [Google Scholar] [CrossRef]
- Kinoshita, K.; Tsenkova, R. Near Infrared Spectra of Body Fluids Reveal the Relationship between Water Spectral Pattern and the Oestrous Cycle. NIR News 2015, 26, 4–5. [Google Scholar] [CrossRef]
- Takemura, G.; Bázár, G.; Ikuta, K.; Yamaguchi, E.; Ishikawa, S.; Furukawa, A.; Kubota, Y.; Kovács, Z.; Tsenkova, R. Aquagrams of raw milk for oestrus detection in dairy cows. Reprod. Domest. Anim. 2015, 50, 522–525. [Google Scholar] [CrossRef]
- Slavchev, A.; Kovacs, Z.; Koshiba, H.; Nagai, A.; Bázár, G.; Krastanov, A.; Kubota, Y.; Tsenkova, R. Monitoring of Water Spectral Pattern Reveals Differences in Probiotics Growth When Used for Rapid Bacteria Selection. PLoS ONE 2015, 10, e0130698. [Google Scholar] [CrossRef]
- Munćan, J.; Mileusnić, I.; Šakota Rosić, J.; Vasić-Milovanović, A.; Matija, L. Water Properties of Soft Contact Lenses: A Comparative Near-Infrared Study of Two Hydrogel Materials. Int. J. Polym. Sci. 2016, 2016, 1–8. [Google Scholar] [CrossRef]
- Šakota Rosić, J.; Munćan, J.; Mileusnić, I.; Kosić, B.; Matija, L. Detection of protein deposits using NIR spectroscopy. Soft Mater. 2016, 14, 264–271. [Google Scholar] [CrossRef]
- Munćan, J.; Rosić, J.; Mileusnić, I.; Matović, V.; Matija, L.; Tsenkova, R. The structure of water in soft contact lenses: Near infrared spectroscopy and Aquaphotomics study. In Proceedings of the 18th International Conference on Near Infrared Spectroscopy, Copenhagen, Denmark, 11–15 June 2017; IM Publications Open: West Sussex, UK, 2019; pp. 99–104. [Google Scholar]
- Scholz-Ahrens, K.E.; Ade, P.; Marten, B.; Weber, P.; Timm, W.; Aςil, Y.; Glüer, C.-C.; Schrezenmeir, J. Prebiotics, Probiotics, and Synbiotics Affect Mineral Absorption, Bone Mineral Content, and Bone Structure. J. Nutr. 2007, 137, 838S–846S. [Google Scholar] [CrossRef] [PubMed]
- Kuroki, S.; Tsenkova, R.; Moyankova, D.P.; Muncan, J.; Morita, H.; Atanassova, S.; Djilianov, D. Water molecular structure underpins extreme desiccation tolerance of the resurrection plant Haberlea rhodopensis. Sci. Rep. 2019, 9, 3049. [Google Scholar] [CrossRef] [PubMed]
- Bernal, J.D.; Fowler, R.H. A theory of water and ionic solution, with particular reference to hydrogen and hydroxyl ions. J. Chem. Phys. 1933, 1, 515–548. [Google Scholar] [CrossRef]
- Marcus, Y. Effect of ions on the structure of water: Structure making and breaking. Chem. Rev. 2009, 109, 1346–1370. [Google Scholar] [CrossRef]
- Hirschfeld, T. Salinity determination using NIRA. Appl. Spectrosc. 1985, 39, 740–741. [Google Scholar] [CrossRef]
- Williams, P.; Norris, K. Near-Infrared Technology in the Agricultural and Food Industry, 2nd ed.; Williams, P., Norris, K., Eds.; American Association of Cereal Chemists, Inc.: Saint Paul, MN, USA, 2001. [Google Scholar]
- Kaffka, K.J.; Horváth, L.; Kulcsár, F.; Váradi, M. Investigation of the state of water in fibrous food stuff by near infrared spectroscopy. Acta Aliment. 1990, 19, 125–137. [Google Scholar]
- Iwamoto, M.; Uozumi, J.; Nishinari, K. Preliminary investigation of water in foods by near infrared spectroscopy. In Proceedings of the International Near Infrared Diffuse Reflectance/Transmittance Spectroscopy Conference; Hello, J., Kaffka, K.J., Gonczy, J.L., Eds.; Akademiai Kiado: Budapest, Hungary, 1987; pp. 3–12. [Google Scholar]
- Maeda, H.; Ozaki, Y.; Tanaka, M.; Hayashi, N.; Kojima, T. Near Infrared Spectroscopy and Chemometrics Studies of Temperature-Dependent Spectral Variations of Water: Relationship between Spectral Changes and Hydrogen Bonds. J. Near Infrared Spectrosc. 1995, 3, 191–201. [Google Scholar] [CrossRef]
- Gowen, A.A.; Esquerre, C.; O’Donnell, C.P.; Downey, G.; Tsenkova, R. Use of near infrared hyperspectral imaging to identify water matrix co-ordinates in mushrooms (Agaricus bisporus) subjected to mechanical vibration. J. Near Infrared Spectrosc. 2009, 17, 363–371. [Google Scholar] [CrossRef]
- Smith, J.D.; Cappa, C.D.; Wilson, K.R.; Geissler, P.L.; Cohen, R.C.; Saykally, R.J. Unified description of temperature-dependent hydrogen-bond rearrangements in liquid water. Proc. Natl. Acad. Sci. USA 2005, 102, 14171. [Google Scholar] [CrossRef]
- Tsenkova, R.; Kovacs, Z.; Kubota, Y. Aquaphotomics: Near infrared spectroscopy and water states in biological systems. In Membrane Hydration; DiSalvo, E.A., Ed.; Springer: Cham, Switzerland, 2015; pp. 189–211. [Google Scholar]
- Collins, J.R. Change in the Infra-Red Absorption Spectrum of Water with Temperature. Phys. Rev. 1925, 26, 771–779. [Google Scholar] [CrossRef]
- Franks, F. (Ed.) Water: A Comprehensive Treatise; Plenum Press: New York, NY, USA, 1973; pp. 276–279. [Google Scholar]
- Inoue, A.; Kojima, K.; Taniguchi, Y.; Suzuki, K. Near-infrared spectra of water and aqueous electrolyte solutions at high pressures. J. Solut. Chem. 1984, 13, 811–823. [Google Scholar] [CrossRef]
- Molt, K.; Niemöller, A.; Cho, Y.J. Analysis of aqueous solutions by near-infrared spectrometry (NIRS) II. Titrations of weak and very weak acids with strong bases. J. Mol. Struct. 1997, 410–411, 565–572. [Google Scholar] [CrossRef]
- Frost, V.J.; Molt, K. Analysis of aqueous solutions by near-infrared spectrometry (NIRS) III. Binary mixtures of inorganic salts in water. J. Mol. Struct. 1997, 410, 573–579. [Google Scholar] [CrossRef]
- Lin, J.; Brown, C.W. Near-IR spectroscopic measurement of seawater salinity. Environ. Sci. Technol. 1993, 27, 1611–1615. [Google Scholar] [CrossRef]
- Xantheas, S.S. Ab initio studies of cyclic water clusters (H2O)n, n=1–6. III. Comparison of density functional with MP2 results. J. Chem. Phys. 1995, 102, 4505. [Google Scholar] [CrossRef]
- Robertson, W.H.; Diken, E.G.; Price, E.A.; Shin, J.-W.; Johnson, M.A. Spectroscopic determination of the OH- solvation shell in the OH-(H2O)n clusters. Science 2003, 299, 1367–1372. [Google Scholar] [CrossRef]
- Cattaneo, T.M.P.; Cabassi, G.; Profaizer, M.; Giangiacomo, R. Contribution of light scattering to near infrared absorption in milk. J. Near Infrared Spectrosc. 2009, 17, 337–343. [Google Scholar] [CrossRef]
- Siesler, H.W.; Ozaki, Y.; Kawata, S.; Heise, H. Near-Infrared Spectroscopy: Principles, Instruments, Applications; Siesler, H.W., Ozaki, Y., Kawata, S., Heise, H., Eds.; Wiley-VCH Verlag GmbH: Weinheim, Germany, 2002. [Google Scholar]
- Headrick, J.M.; Diken, E.G.; Walters, R.S.; Hammer, N.I.; Christie, R.A.; Cui, J.; Myshakin, E.M.; Duncan, M.A.; Johnson, M.A.; Jordan, K.D. Spectral signatures of hydrated proton vibrations in water clusters. Science 2005, 308, 1765–1769. [Google Scholar] [CrossRef]
- Czarnik-Matusewicz, B.; Pilorz, S. Study of the temperature-dependent near-infrared spectra of water by two-dimensional correlation spectroscopy and principal components analysis. Vib. Spectrosc. 2006, 40, 235–245. [Google Scholar] [CrossRef]
- Gowen, A.A.A.; Marini, F.; Tsuchisaka, Y.; De Luca, S.; Bevilacqua, M.; O’Donnell, C.; Downey, G.; Tsenkova, R.; O’Donnell, C.; Downey, G.; et al. On the feasibility of near infrared spectroscopy to detect contaminants in water using single salt solutions as model systems. Talanta 2015, 131, 609–618. [Google Scholar] [CrossRef] [PubMed]
- Büning-Pfaue, H. Analysis of water in food by near infrared spectroscopy. Food Chem. 2003, 82, 107–115. [Google Scholar] [CrossRef]
- Cowe, I.A.; McNicol, J.W. The Use of Principal Components in the Analysis of Near-Infrared Spectra. Appl. Spectrosc. 1985, 39, 257–266. [Google Scholar] [CrossRef]
- Press, W.H.; Teukolsky, S.A.; Vetterling, W.T.; Flannery, B.P. Numerical Recipes in C: The Art of Scientific Computing, 2nd ed.; Cambridge Univ. Press: Cambridge, UK, 1992. [Google Scholar]
- Chatani, E.; Tsuchisaka, Y.; Masuda, Y.; Tsenkova, R. Water molecular system dynamics associated with amyloidogenic nucleation as revealed by real time near infrared spectroscopy and aquaphotomics. PLoS ONE 2014, 9, e101997. [Google Scholar] [CrossRef] [PubMed]
- Davison, A.; Hinkley, D. Bootstrap Methods and their Application (Cambridge Series in Statistical and Probabilistic Mathematics); Cambridge University Press: Cambridge, UK, 1997. [Google Scholar]
- RStudio. RStudio: Integrated Development Environment for R; RStudio: Boston, MA, USA, 2012. [Google Scholar]
- R Development Core Team. R: A Language and Environment for Statistical Computing; R Development Core Team: Vienna, Austria, 2017. [Google Scholar]
- Kovacs, Z.; Pollner, B. Aquaphotomics Course Data analysis and Software. In Proceedings of the Aquaphotomics: Understanding Water in Biology—2nd International Symposium, Kobe, Japan, 26–29 November 2016. [Google Scholar]
Sample Availability: Samples of the compounds KCl are available from the authors. |
© 2020 by the authors. Licensee MDPI, Basel, Switzerland. This article is an open access article distributed under the terms and conditions of the Creative Commons Attribution (CC BY) license (http://creativecommons.org/licenses/by/4.0/).
Share and Cite
Kovacs, Z.; Pollner, B.; Bazar, G.; Muncan, J.; Tsenkova, R. A Novel Tool for Visualization of Water Molecular Structure and Its Changes, Expressed on the Scale of Temperature Influence. Molecules 2020, 25, 2234. https://doi.org/10.3390/molecules25092234
Kovacs Z, Pollner B, Bazar G, Muncan J, Tsenkova R. A Novel Tool for Visualization of Water Molecular Structure and Its Changes, Expressed on the Scale of Temperature Influence. Molecules. 2020; 25(9):2234. https://doi.org/10.3390/molecules25092234
Chicago/Turabian StyleKovacs, Zoltan, Bernhard Pollner, George Bazar, Jelena Muncan, and Roumiana Tsenkova. 2020. "A Novel Tool for Visualization of Water Molecular Structure and Its Changes, Expressed on the Scale of Temperature Influence" Molecules 25, no. 9: 2234. https://doi.org/10.3390/molecules25092234
APA StyleKovacs, Z., Pollner, B., Bazar, G., Muncan, J., & Tsenkova, R. (2020). A Novel Tool for Visualization of Water Molecular Structure and Its Changes, Expressed on the Scale of Temperature Influence. Molecules, 25(9), 2234. https://doi.org/10.3390/molecules25092234


