Article

In-Situ Synthesis and Characterization of Nanocomposites in the Si-Ti-N and Si-Ti-C Systems

by
Maxime Balestrat
1,
Abhijeet Lale
1,2,
André Vinícius Andrade Bezerra
1,3,
Vanessa Proust
2,
Eranezhuth Wasan Awin
4,
Ricardo Antonio Francisco Machado
3,
Pierre Carles
1,
Ravi Kumar
4,
Christel Gervais
5 and
Samuel Bernard
1,*
1
CNRS, IRCER, UMR 7315, University of Limoges, F-87000 Limoges, France
2
Institut Europeen des Membranes (IEM), UMR 5635 (CNRS-ENSCM-UM2), Universite Montpellier 2, Place E. Bataillon, F-34095 Montpellier, France
3
Chemical Engineering, Federal University of Santa Catarina, Florianópolis 88010-970, Brazil
4
Laboratory for High Performance Ceramics, Department of Metallurgical and Materials Engineering, Indian Institute of Technology-Madras (IIT Madras), Chennai 600036, India
5
Laboratoire Chimie de la Matière Condensée de Paris, Collège de France, CNRS, Sorbonne Université, 4 Place de Jussieu, 75005 Paris, France
*
Author to whom correspondence should be addressed.
Molecules 2020, 25(22), 5236; https://doi.org/10.3390/molecules25225236
Submission received: 29 September 2020 / Revised: 30 October 2020 / Accepted: 3 November 2020 / Published: 10 November 2020

Abstract

:
The pyrolysis (1000 °C) of a liquid poly(vinylmethyl-co-methyl)silazane modified by tetrakis(dimethylamido)titanium in flowing ammonia, nitrogen and argon followed by the annealing (1000–1800 °C) of as-pyrolyzed ceramic powders have been investigated in detail. We first provide a comprehensive mechanistic study of the polymer-to-ceramic conversion based on TG experiments coupled with in-situ mass spectrometry and ex-situ solid-state NMR and FTIR spectroscopies of both the chemically modified polymer and the pyrolysis intermediates. The pyrolysis leads to X-ray amorphous materials with chemical bonding and ceramic yields controlled by the nature of the atmosphere. Then, the structural evolution of the amorphous network of ammonia-, nitrogen- and argon-treated ceramics has been studied above 1000 °C under nitrogen and argon by X-ray diffraction and electron microscopy. HRTEM images coupled with XRD confirm the formation of nanocomposites after annealing at 1400 °C. Their unique nanostructural feature appears to be the result of both the molecular origin of the materials and the nature of the atmosphere used during pyrolysis. Samples are composed of an amorphous Si-based ceramic matrix in which TiNxCy nanocrystals (x + y = 1) are homogeneously formed “in situ” in the matrix during the process and evolve toward fully crystallized compounds as TiN/Si3N4, TiNxCy (x + y = 1)/SiC and TiC/SiC nanocomposites after annealing to 1800 °C as a function of the atmosphere.

1. Introduction

Silicon carbide (SiC) and silicon nitride (Si3N4) are technologically relevant high-performance ceramics which attract nowadays strong interest for driving the development of energy, environment and health sectors [1,2,3,4]. By the synergistic cooperation between SiC or Si3N4—as a matrix—and a dispersed ceramic nanophase of different chemical composition—as a nano-precipitate—nanocomposites with peculiar physical and chemical properties (e.g., mechanical, electrical, optical, catalytic, etc.) that are of high scientific and technological importance can be generated [5,6,7,8].
As developed functional properties closely depend on the synthesis route of these materials. For this purpose; ceramic processing methods based on molecular engineering and precursor chemistry are well appropriate approaches to design nanocomposites that can reach performances far beyond those developed by more conventional synthesis routes. In general, such nanocomposites exhibit improved properties when compared to those prepared via classical high temperature metallurgical techniques because of the homogeneous distribution of the nanophase within the matrix (i.e., absence of agglomeration of the nano-precipitates), the small size of the nano-precipitates (no sintering because of the generally low temperature of preparation) and the lack of undesirable elements. A very convenient precursor route to produce these materials in non-oxide ceramic systems such as those based on SiC and Si3N4 is the polymer derived ceramics (PDCs) route [9,10,11,12,13,14,15,16,17,18,19]. Such a method uses preformed preceramic polymers to be modified at molecular scale to form the nanocomposite precursors. The latter offers the advantages for the in-situ synthesis of the ceramic nano-precipitates in a ceramic (possibility of different nature) matrix during the pyrolysis and annealing experiments. In addition, it allows processing materials in particular shapes and morphologies (dense or porous) that are difficult, or even impossible to obtain from conventional routes [20,21,22,23,24,25].
In the present paper, we investigate the PDCs route to design titanium nitride/silicon nitride (TiN/Si3N4) and titanium carbide/silicon carbide (TiC/SiC) nanocomposites using a commercial liquid polysilazane. The preparation of such nanocomposites usually involves the use of polysilazanes (TiN/Si3N4) [26,27,28] and polycarbosilanes (TiC/SiC) [5,29,30] as preformed preceramic polymers. Herein, our approach involves first the synthesis of the nanocomposite precursor containing Si, Ti, C, N and H elements from a poly(vinylmethyl-co-methyl)silazane which has been modified upon reaction with tetrakis(dimethylamido)titanium. The thermo-chemical behavior of this precursor under various atmospheres is directed to tailor the structure of the final materials: the polymer is converted by heat-treatments (=pyrolysis) at 1000 °C under ammonia, nitrogen or argon into single-phase amorphous ceramics with adjusted compositions; in particular their C and N contents. The latter are subsequently annealed at higher temperatures in flowing nitrogen or argon to initiate the crystallization of the nanophase, i.e., TiN, TiCxN1-x or TiC, and then of the matrix, i.e., Si3N4 or SiC. Thus, this approach provides the material with tuned phase composition and nano-/microstructure organization according to the temperature of annealing and the nature of the atmosphere applied during the pyrolysis. To build further knowledge toward a more rational approach to the preparation of ceramic nanocomposites in nitride, carbonitride and carbide systems—Si-Ti-N (TiN/Si3N4), Si-Ti-N-C (TiNxCy (x + y = 1)/SiC), Si-Ti-C (TiC/SiC)—as reported in the schematic representation of the synthetic process in Figure 1, the present work aims at (i) investigating the structure of a novel titanium-modified polysilazane, (ii) providing a comprehensive mechanistic study of the polymer-to-amorphous ceramic conversion during the pyrolysis of the precursor at 1000 °C in flowing ammonia, nitrogen and argon and (iii) characterizing the high temperature behavior of single-phase amorphous ceramics during their annealing and transformation into the titled nanocomposites. Thus, the results allow for a knowledge-based preparative path toward nanostructured polymer-derived ceramics with adjusted compositions and microstructures.

2. Results and Discussion

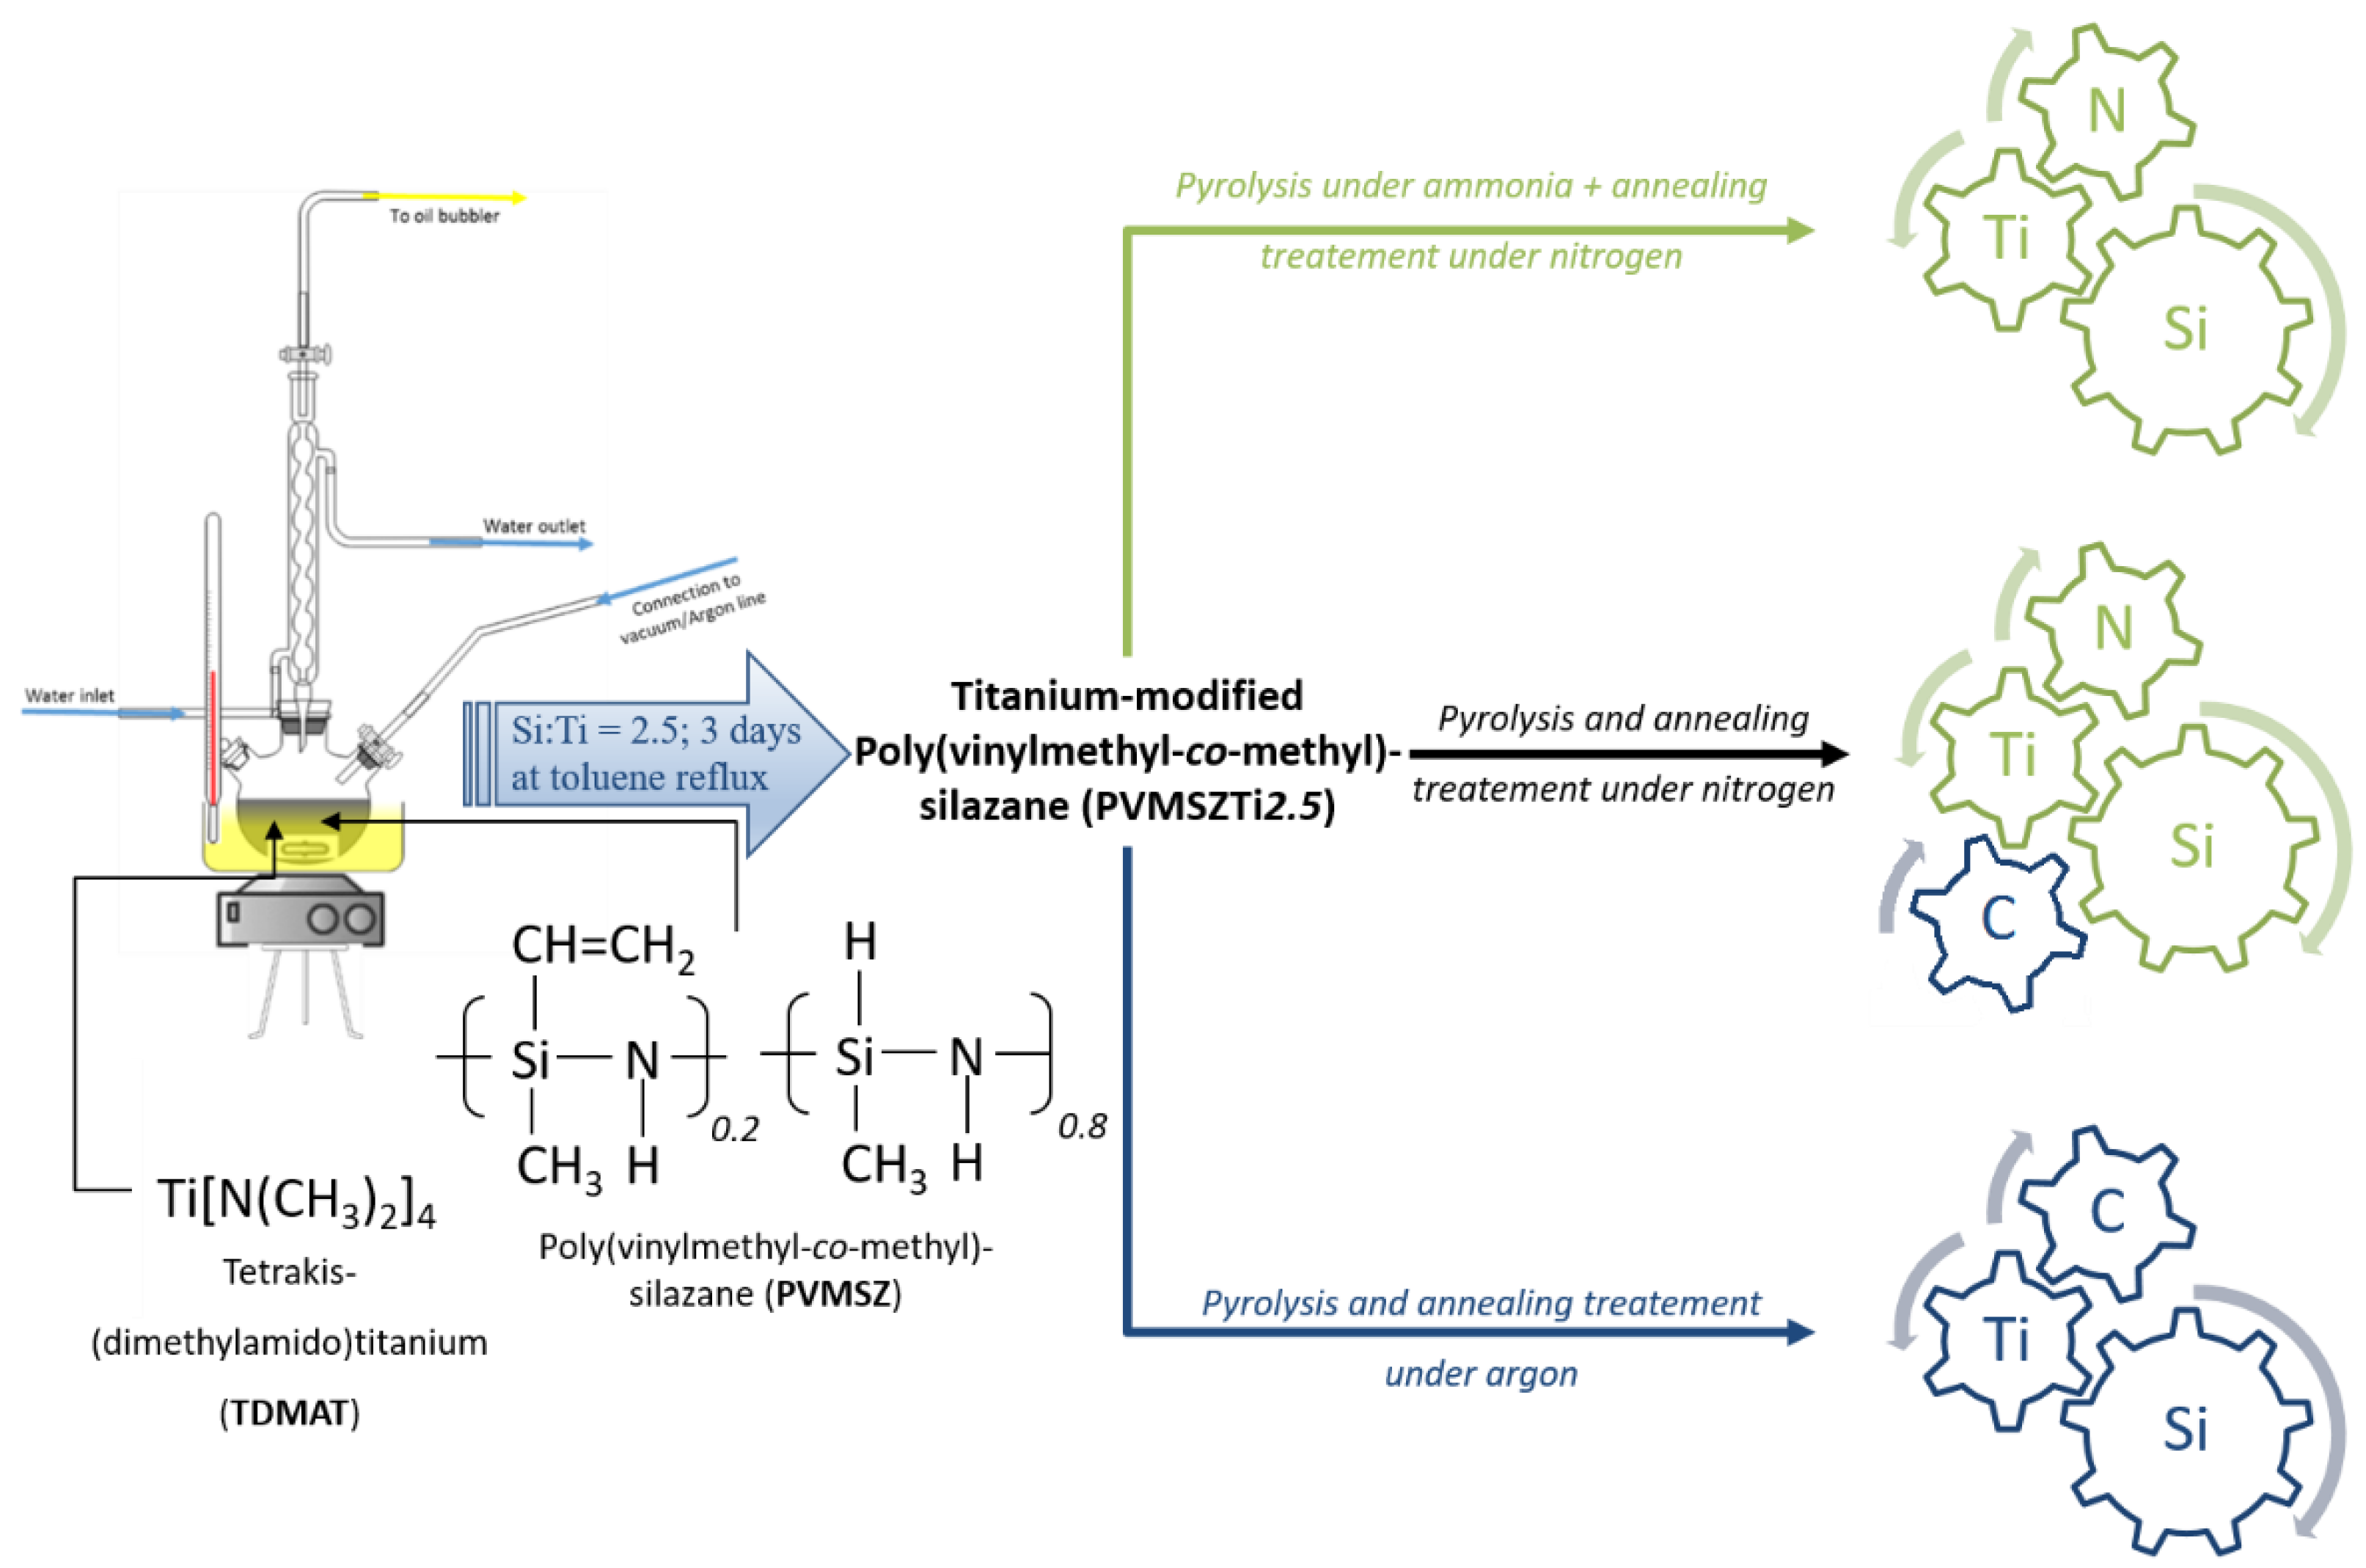
2.1. Polymer Synthesis and Characterization

The titanium-modified polysilazane labeled PVMSZTi2.5 has been synthesized via the reaction between tetrakis(dimethylamido)titanium Ti[N(CH3)2]4 (TDMAT as titanium source) and a commercially available poly(vinylmethyl-co-methyl)silazane labeled PVMSZ by fixing a PMVSZ (monomeric unit):TDMAT ratio of 2.5.
The modification of polysilazanes with TDMAT relies in general on the reaction between the methyl-/dimethylamino groups of TDMAT and the silicon centers of PVMSZ, causing the decrease in the number of Si–NH–Si (Equation (1)) and Si–H (Equation (2)) groups in the obtained precursors and the concomitant evolution of dimethylamine and methane during the synthesis [26,27]. It should be noted that TDMAT can also react with NH groups from the monomeric unit (Si(CH3)(CH=CH2)NH)0.2). Moreover, as-formed -N-Ti[N(CH3)2]3 groups and -Si-N(CH3)-Ti[N(CH3)2]3 units can subsequently condense with free SiH and/or NH units or stay as they stand. To support this discussion, we have characterized the precursor by elemental analysis, FTIR and NMR spectroscopies.
-Si-H + H3C-N(CH3)-Ti[N(CH3)2]3 →-Si-N(CH3)-Ti[N(CH3)2]3 + CH4
-N-H + N(CH3)2-Ti[N(CH3)2]3 →-N-Ti[N(CH3)2]3 + HN(CH3)2
Compared to the chemical formula of PVMSZ ([Si1.0C1.5N1.1H5.5]n (oxygen content in the sample is 0.4 wt% and can be therefore neglected), the elemental analysis data of the air- and moisture-sensitive solid PVMSZTi2.5 sample—which allowed to determine a chemical formula of [Si1.0Ti0.3C3.0N1.6H8.5]n (oxygen content in the sample is 0.6 wt% and can be therefore neglected)—confirms that (i) Ti is incorporated at molecular scale in the structure of PVMSZ and (ii) the carbon, nitrogen and hydrogen contents significantly increase. The measured formula shows that the Si:Ti ratio is higher (i.e., 3.3) than the targeted value fixed before the synthesis, i.e., 2.5, indicating that the Ti content is lower than expected. Most probably, the TDMAT introduced during the polymer synthesis has not completely reacted with PVMSZ. Thus, a certain amount of unreacted TDMAT could be recovered during the extraction of the solvent. Therefore, it is suggested that the reaction cannot be completed when too much TDMAT is added due to a high steric hindrance imposed by the evolutive PVMSZ structure, i.e., the Si:Ti ratio becomes too small and the reactive functions of the neat PVMSZ are no longer accessible. Based on Equations (1) and (2), the significant increase of the carbon, nitrogen and hydrogen contents in the PVMSZTi2.5 sample can be caused by the formation of Si-N(CH3)-Ti bridges. However, this significant increase is most probably related to the high portion of -Ti[N(CH3)2]3 units which are present in as-formed units. They can be considered as side groups that do not further react during the synthesis progress. Thus, this means that the PVMSZTi2.5 sample displays a higher degree of crosslinking than PVMSZ because of the formation of Ni-Ti bonds and -Si-N(CH3)-Ti- bridges and a relative high portion of surrounding-[N(CH3)2]3 groups. In order to obtain a complete view of the titanium-modified polysilazane structure, the PVMSZTi2.5 sample has been characterized by infrared sand solid-state NMR spectroscopies.
The FTIR spectrum of PVMSZTi2.5 (Figure S1 in Supplementary Materials) displays some of the characteristic absorption bands of neat PVMSZ [31,32] attributed to the stretching of N-H bonds at 3376 cm−1 coupled to N-H deformations at 1174 cm−1, the stretching of C-H bonds in CHx groups at 2960 cm−1 and the stretching of Si-H bonds and deformations of Si-CH3 units at 2123 cm−1 and at 1250 cm−1, respectively. Below 1056 cm−1, absorption bands attributed to the stretching and deformation vibrations involving Si-C, Si-N, C-H, C-C and N-Ti bonds overlap and cannot be assigned unambiguously. The main changes occur in the intensity of some of the characteristic bands quoted above. Thus, a decrease in the intensity of the absorption bands assigned to Si-NH-Si groups at 3376 and 1174 cm−1 and Si-H bonds at 2123 cm−1 is observed in the spectrum of PVMSZTi2.5—more significantly for the bands assigned to N-H bonds. In parallel, there is appearance of a set of broad bands in the range of 2750–2900 cm−1 attributed to the vibration of C-H bonds from the methyl/dimethylamino groups present in TDMAT. The band at 1294 cm−1 can be assigned to the N-C bonds in -N(CH3) groups. Another set of bands that can be attributed to deformation of C-H bands appears at around 1417 and 1457 cm−1. Thus, FTIR spectroscopy confirms the incorporation of -N(CH3) groups in PVMSZ possibly via Equations (1) and (2):
(i)
those involving -NH units in PVMSZ and -N(CH3)2 groups in TDMAT to form -N-Ti[N(CH3)2]3 units releasing dimethylamine according to Equation (1). This reaction occurs probably majoritarly;
(ii)
those involving the silicon centers of PVMSZ and -N(CH3)2 groups in TDMAT causing the decrease of Si-H groups while forming -Si-N(CH3)-Ti- bridges in the obtained precursor and the concomitant evolution of methane according to Equation (2).
Moreover, the band at 3046 cm−1, which is assigned to the vibration of C–H bond in the vinyl groups and the typical absorption band arising from the stretching of C=C double bonds in vinyl groups at 1591 cm−1 present in PVMSZ are almost vanished in the FTIR spectrum of PVMSZTi2.5. It is rather suggested that TDMAT acts as a catalyst for the polymerization of the vinyl groups (Equation (3) and/or the hydrosilylation reaction between -Si–H and -Si-CH=CH2 units leading to the formation of carbosilane bonds (-Si-C-C-Si-) (Equation (4)). Indeed, inorganic catalysts such as transition metals or metal complexes could remarkably increase the hydrosilylation rate as well as lower the temperature required for hydrosilylation [33,34,35,36].
n -Si-CH=CH2 → -(CH(-Si)-CH2)n
-Si-CH=CH2 + -Si-H → -Si-CH2-CH2-Si- and/or -Si-CH(CH3)-Si-
To support this discussion, the FTIR spectra of PVMSZTi2.5 and a PVMSZ having undergone the same thermal procedure than PVMSZTi2.5 without TDMAT—it is labeled PVMSZ_T—have been compared (Figure S1 in Supplementary Materials). In the FTIR of PVMSZ_T, the bands attributed to vinyl groups are still present although their intensities decrease. Thus, this confirms the catalytic activity of TDMAT towards reactions involving vinyl groups. These results point out at three or four main effects that took place during the reaction of PVMSZ with TDMAT as depicted in Equations (1) to (4). To achieve an in-depth understanding of the local carbon, silicon and nitrogen environments in the polymer, we investigated 13C, 29Si and 15N solid-state NMR spectroscopy of the PVMSZTi2.5 sample (Figure 2). The cross-polarization (CP) technique has been used for 13C and 15N-NMR experiments to obtain spectra with reasonable acquisition times and signal-to-noise ratios.
The solid-state 13C CP MAS NMR spectrum of PVMSZTi2.5 (Figure 2a) exhibits signals which can be simulated with four components as already performed with titanium-modified polymethylsilazane [27]. The signal emerging around 6 ppm is very broad with shoulders present around 0 and 14 ppm. It is deconvoluted into two main components at 1 and 8 ppm to reproduce the shape of the signal although the shoulder at 14 ppm could not be included in this deconvolution. 13C-NMR signals at around 0 ppm are typical of carbon atoms of aliphatic groups bonded to a silicon atom [31,32,37,38,39,40,41], i.e., in this case, the silylmethyl group -SiCH3 as identified in neat PVMSZ. The presence of two signals can be due to the two types of SiCH3 unit-containing environments proposed in Equations (1) and (2):
(i)
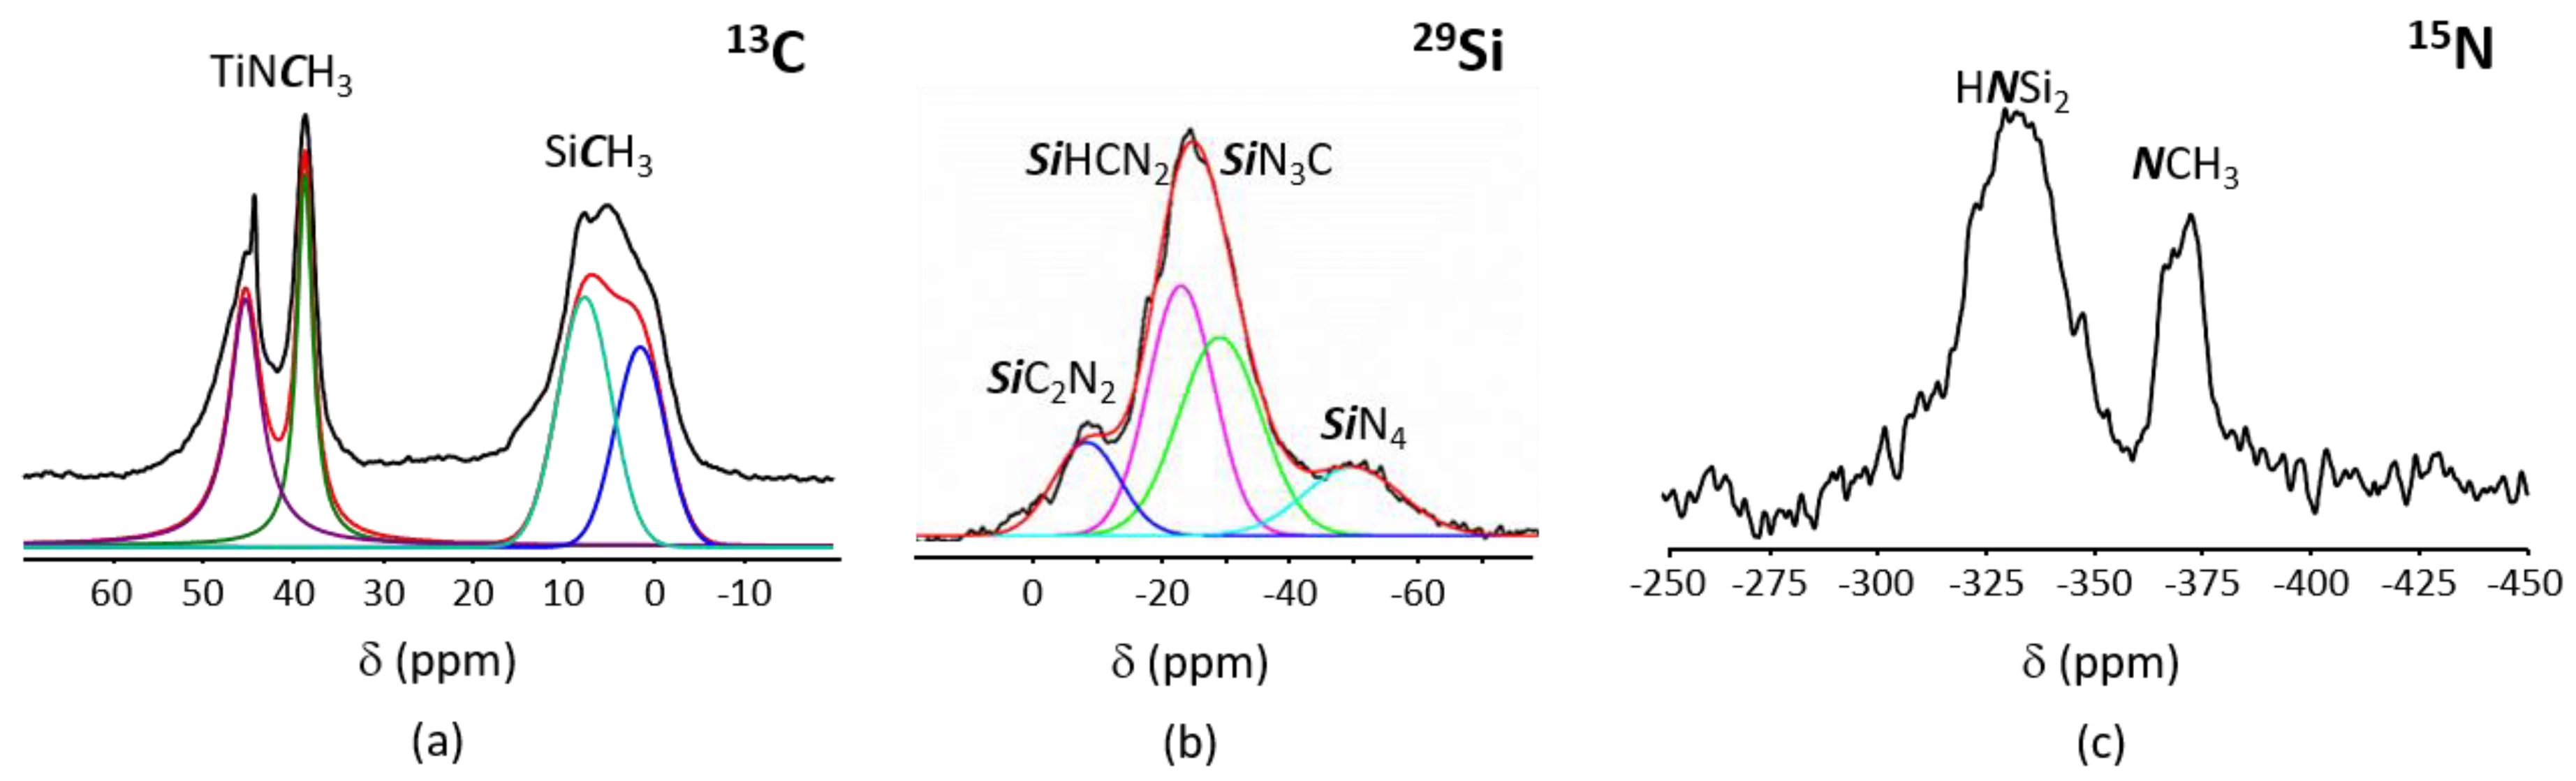
in SiCN3 environments (i.e., Si environment after reaction of the SiH groups in the monomeric unit [Si(CH3)(H)NH]0.8 with TDMAT,
(ii)
in SiCRN2 (R = H (i.e., Si environment in the monomeric unit [Si(CH3)(H)NH]0.8) or R = C (i.e., Si environment in the monomeric unit [Si(CH3)(CH=CH2)NH]0.2)); thus units present in PVMSZ that did not react upon chemical modification with TDMAT.
Moreover, this broad signal probably also contains minor signals corresponding to aliphatic carbon atoms directly linked to a silicon as Si-(CH-CH2)n- groups formed as proposed through Equation (3) or Si-CH2-CH2-Si and Si-CH(CH3)-Si units formed by hydrosilylation reactions as proposed through Equation (4). The weak broad signal at around 14 ppm is in the aliphatic region and can be tentatively assigned to aliphatic carbons not directly linked to a silicon such as Si-(CH-CH2)n or Si-CH(CH3)-Si groups. The resonances at 39 and 45 ppm are assigned to -TiNCH3 groups [27]. In particular, the peak at 45 ppm is attributed to NCH3 groups linked to titanium, i.e., -Si-N(Si-)-Ti[NCH3)2]3 units, resulting from Equation (1). Indeed, its position is similar to the position of the signal identified in the liquid-state 13C-NMR spectrum of TDMAT (Figure S2 in Supplementary Materials). Consequently, the signal at 39 ppm is assigned to -N(CH3) groups in N2Si(CH3)-N(CH3)-Ti[NCH3)2]3 units resulting from Equation (2). It should be mentioned that signals at 124 and 138 ppm—attributed to the carbon of the vinyl groups present in PVMSZ—are identified the PVMSZTi2.5 sample (Figure S3 in Supplementary Materials), but the weak intensity of the signals confirms that hydrosilylation is almost complete during the synthesis of the PVMSZTi2.5 sample. The 29Si MAS spectrum of the PVMSZTi2.5 sample (Figure 2b) is composed of a main broad resonance at around −24 ppm that can be fitted with two components at −21 and −29 ppm similarly to titanium-modified polymethylsilazane [27]. The signal at −21 ppm is related to HSiCN2 environments, i.e., CH3-Si(H)N2 units as present in PVMSZ [31,32]. The other signal at −29 ppm could correspond to SiN3C environments and more precisely to N2Si(CH3)-N(CH3)-Ti[NCH3)2]3 units resulting from Equation (2). In addition, there is a signal at around −9 ppm that is attributed to SiC2N2 environments. The 29Si chemical shift of SiC2N2 environments depends on the conformation of the silazane [41]. Thus, the PVMSZTi2.5 sample is preferentially composed of six- and eight-membered Si-N rings. The signal around −50 ppm is typically for SiN4 environment although it is difficult to imagine such an environment in our polymeric system. One reason could be the presence of a small portion of ending groups in PVMSZ that react with TDMAT for the existence of such an environment. The experimental 15N CP MAS NMR spectrum of the PVMSZTi2.5 sample (Figure 2c) shows two broad signals centered at −330 ppm and −370 ppm and confirms the previous discussion. The signal at −330 ppm is attributed to HNSi2 environments since these groups in the silazane backbone are expected between −335 ppm and −325 ppm [31]. The additional signal centered at −370 ppm is assigned to NCH3 environments based on our data collected for titanium-modified polymethylsilazane [27].
The combination of multinuclear solid-state NMR data with results derived from elemental analyses and FTIR allows to have a complete understanding of the chemistry behind the reaction between PVMSZ and TDMAT and a full view of the structure of the PVMSZTi2.5 sample. At least three reactions depicted in Equations (1) to (4) occur during the synthesis of the PVMSZTi2.5 sample. They allow building the polymer network and extending the degree of cross-linking of the polymeric backbone. Titanium atoms are homogeneously distributed within the PVMSZ structure as bridges i.e., those involving -(Si-N)n-Ti- units (Equation (1)) and those involving N2Si(CH3)-N(CH3)-Ti- units (Equation (2)). In addition, hydrosilylation occurs during the synthesis to form carbosilane bridges (Equation (4)). This leads to a relatively high crosslinked polyme containing a certain portion of side grops of the type -Ti[N(CH3)2]x. The modification of the structure of PVMSZ—because of its reaction with TDMAT—will affect its thermo-chemical behavior. The latter is investigated in the following section through pyrolysis procedures up to 1000 °C in various atmospheres that allowed delivering compounds with controlled phase composition.

2.2. Ceramic Conversion

Here, we first discuss the thermo-chemical transformation of the PVMSZTi2.5 sample into ceramic materials up to 1000 °C in flowing ammonia, nitrogen and argon as monitored by TG experiments. The collection of TG experiments allows having a good overview of the reactivity of the PVMSZTi2.5 sample with the different types of atmospheres. Then, the polymer-to-ceramic conversion has been investigated in more details using tools complementary to TG experiments: (i) MS to identify the gases evolving from the polymer during TG experiments under argon and nitrogen-MS was not possible to be used in flowing ammonia, (ii) ex-situ spectroscopic analyses (FTIR and/or solid-state NMR) of intermediates isolated during pyrolysis in such atmospheres to follow the evolution of the chemical bonding and environments. All samples produced at 1000 °C have been characterized by solid-state NMR.

2.2.1. TG Experiments

The thermo-chemical conversion of preceramic polymers into ceramics occurs through the evolution of gaseous by-products involving a weight loss upon the heat treatment as reported in Figure 3. Results are compared to data recorded from PMVSZ (Figure S4 in Supplementary Materials). In contrast to TG curves recorded in nitrogen and argon atmospheres that exhibit one single-step weight loss which is almost achieved at 700 °C, the TG curve of the PVMSZTi2.5 sample recorded in an ammonia atmosphere is more complex and displays a three-step weight loss similarly to PVMSZ (Figure S4 in Supplementary Materials) in the temperature range 30–1000 °C, i.e., from 30 to 250 °C (1st weight loss), from 250 to 550 °C (2nd weight loss) and from 550 to 1000 °C (3rd weight loss).
The PVMSZTi2.5 sample is decomposed with weight losses measured at 1000 °C higher than those measured for PMVSZ (Figure S4 in Supplementary Materials) in the same atmospheres whereas the degree of crosslinking in PVMSZTi2.5 is supposed to be higher than in PVMSZ. As-formed units are indeed expected to reduce the segment mobility of PVMSZ hindering depolymerization reactions in the polymeric network in the low temperature regime of the polymer-to-ceramic conversion; thereby reducing the total weight loss of the precursor. However, in the present case, we observe that a high cross-linking is not the only prerequisite to design preceramic polymers with high and optimized ceramic yield. Another important issue is a sufficient latent reactivity of the precursors, i.e., the ability to undergo further cross-linking reactions during the heat treatment. This is particularly the case when -Si-H, -N-H and vinyl groups are present in the polymer to occur dehydrocoupling and hydrosilylation reactions. Such units are supposed to be in a significant lower portion in PVMSZTi2.5 compared to PVMSZ because they reacted with TDMAT during its synthesis. Furthermore, TDMAT catalyzed hydrosilylation reactions during the PVMSZTi2.5 synthesis. Therefore, dehydrocoupling and hydrosilylation reactions are limited during the heat-treatment of the PVMSZTi2.5 sample. Finally, the highest weight losses recorded for PVMSZTi2.5 is also a consequence of the presence of -N(CH3)3 as side groups in its structure. They are not able to undergo cross-linking reactions and are decomposed during the polymer-to-ceramic conversion. This is particularly understandable in flowing ammonia because -N[(CH3)x]y units (x = 1 or 2 and y = 1 (for x = 1) and 1 → 3 (for x = 2)) are highly reactive with ammonia to release amines as gaseous by-products via transamination reactions as illustrated in Equation (5).
−Ti[N(CH3)x]y + yNH3 (g) → -Ti[NH2]y + y(CH3)xNH3−x
Since the polymer-to-ceramic conversion of preceramic polymers into ceramic materials is a complex process, spectroscopic analyses (MS, FTIR and/or solid-state NMR) must be very extensive. Thus, detailed discussions of these efforts are reported in detail hereafter.

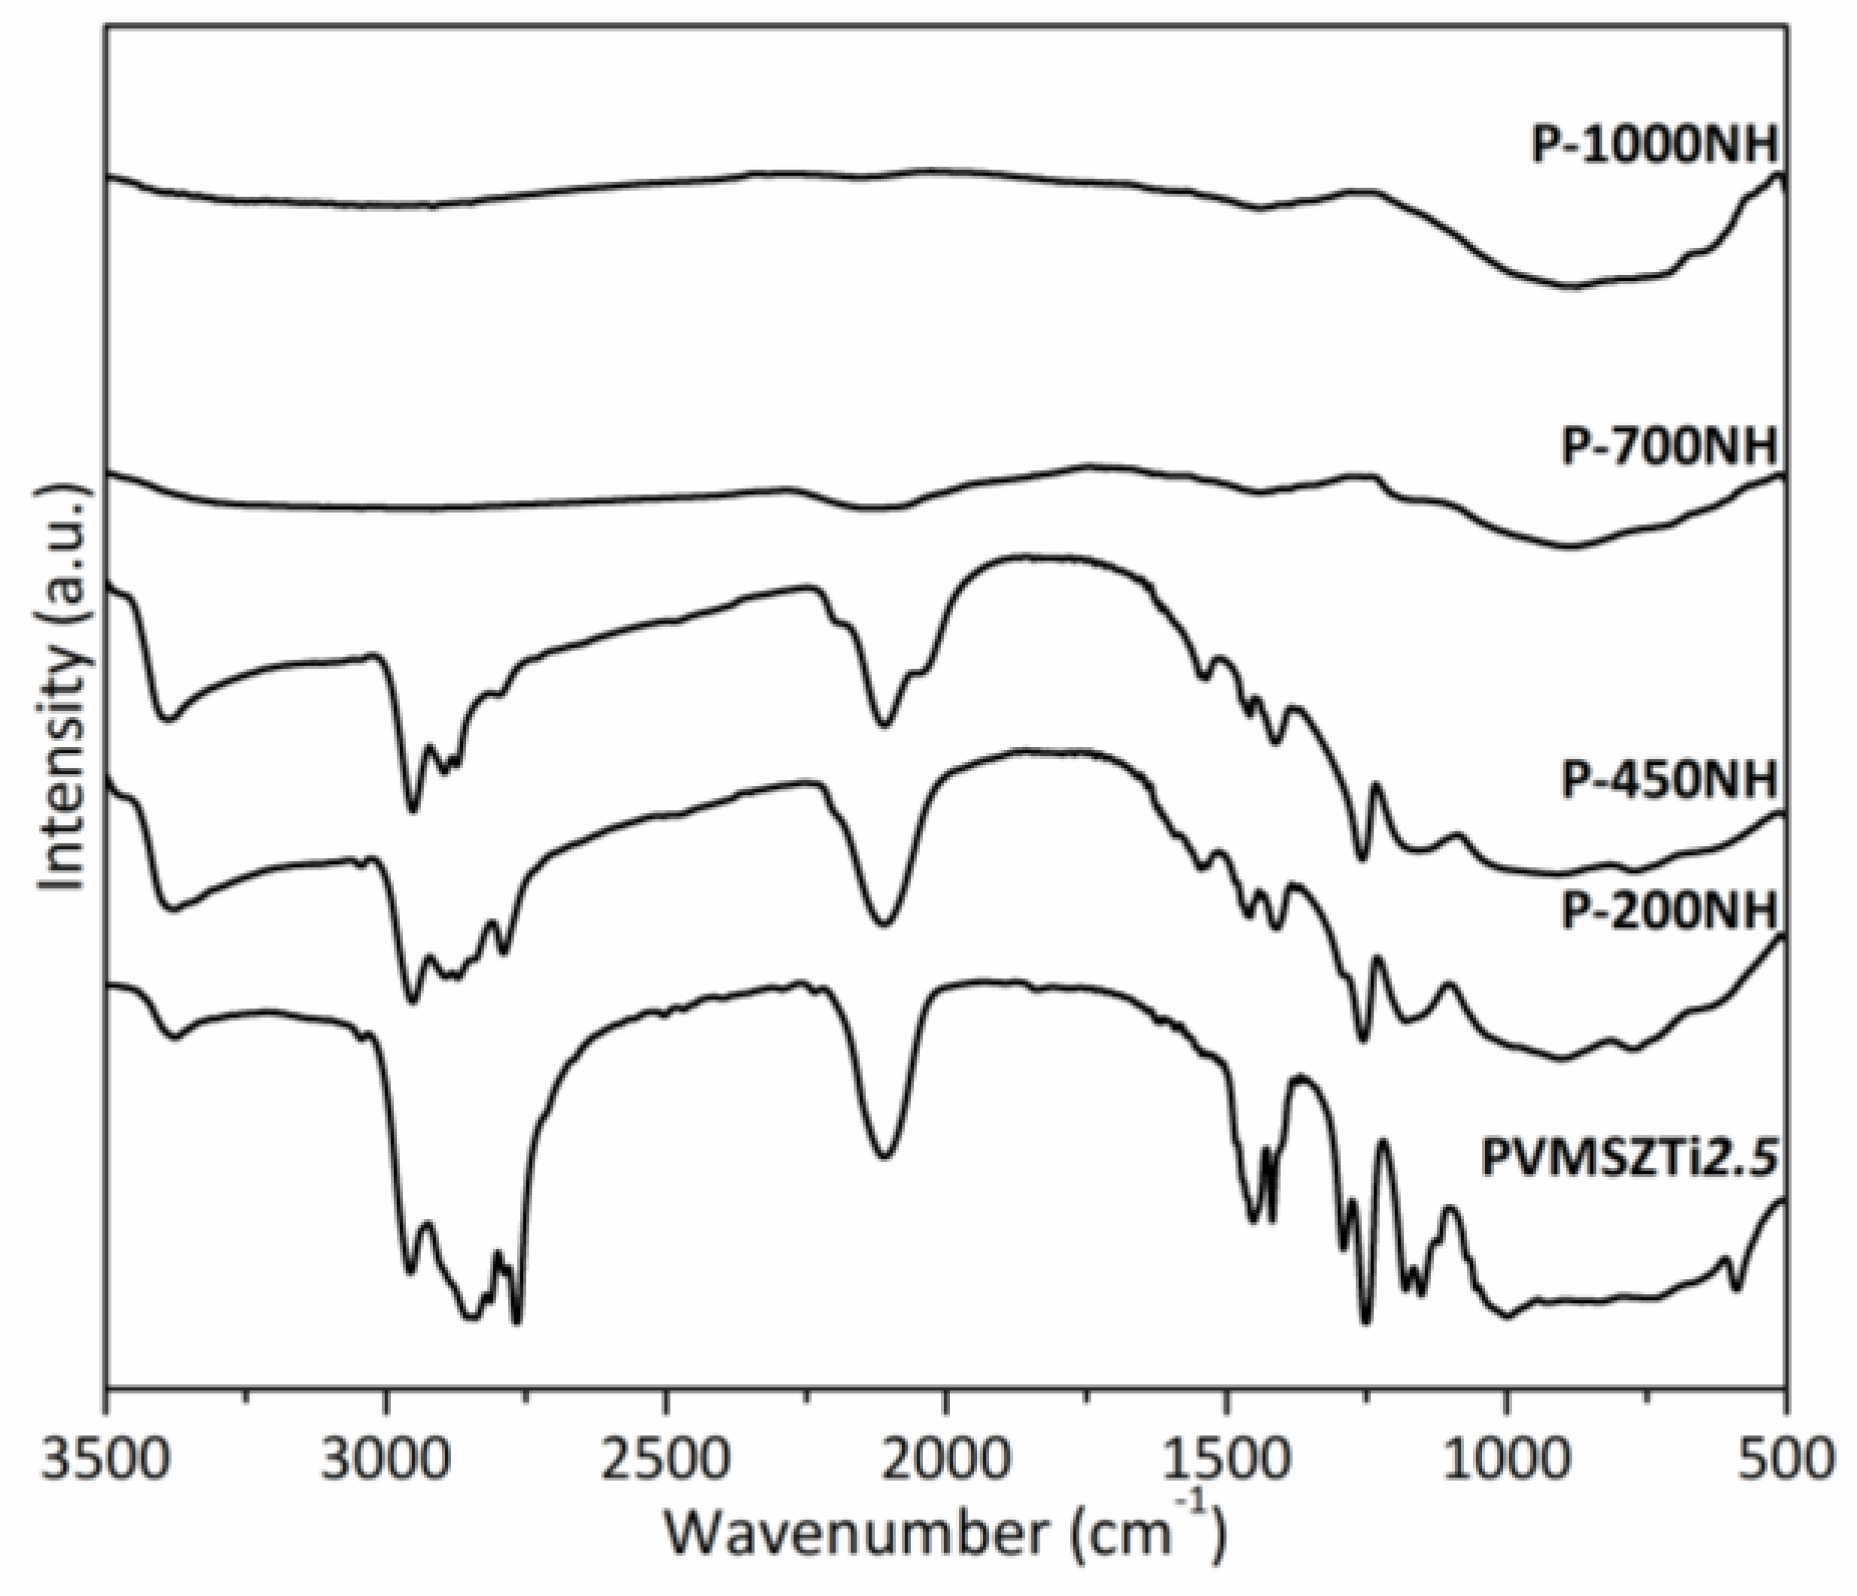
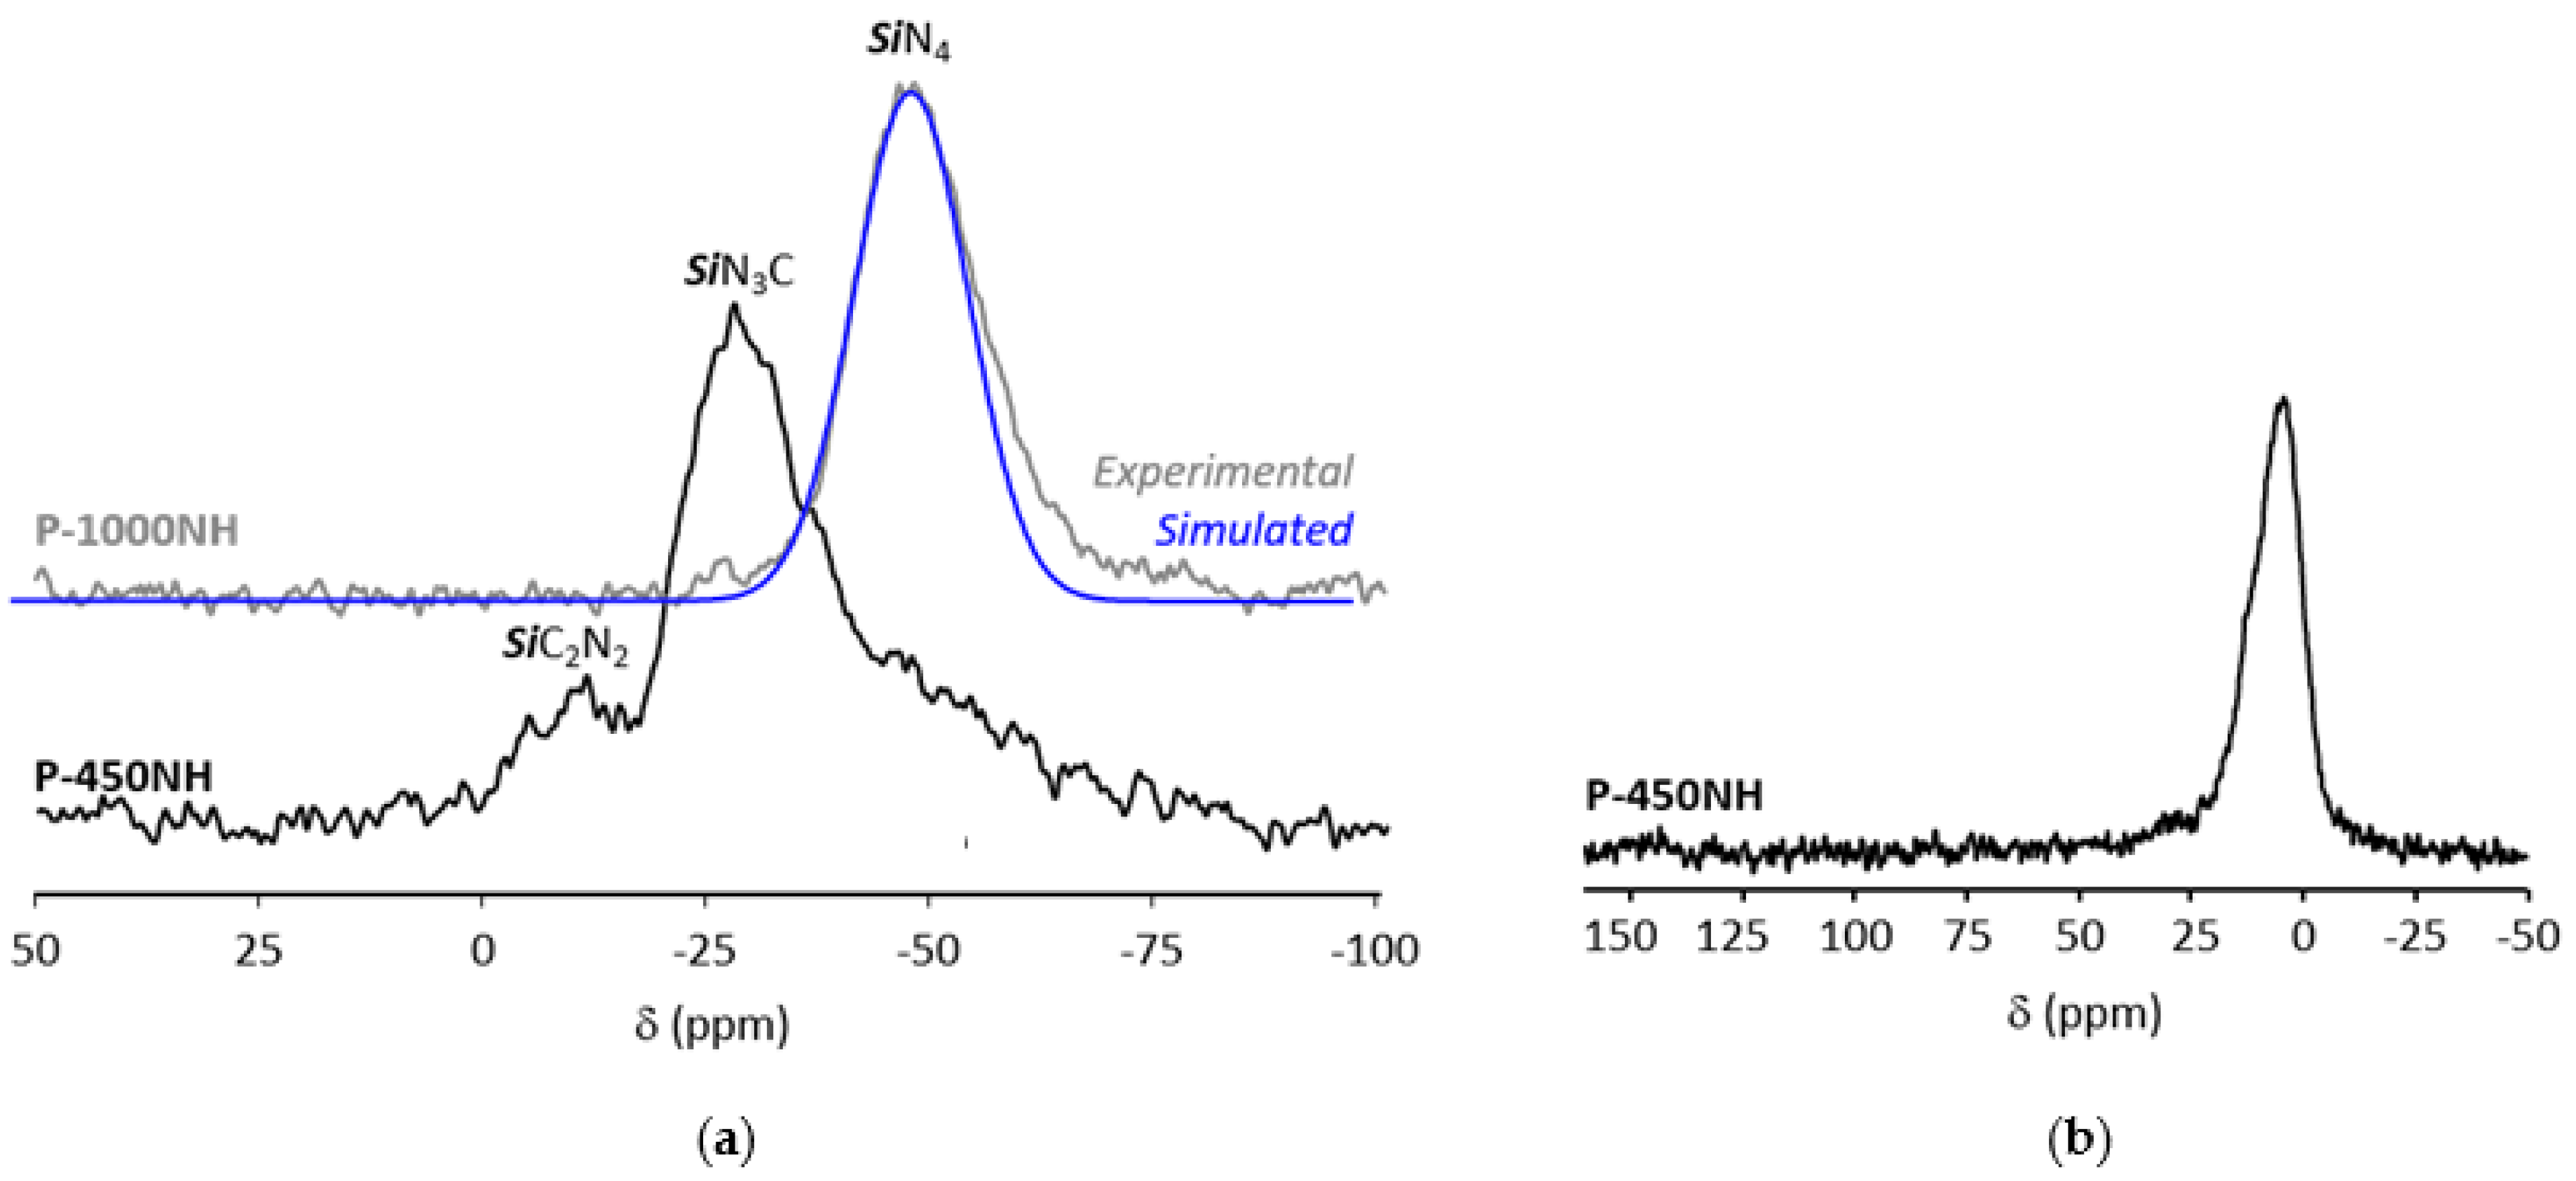
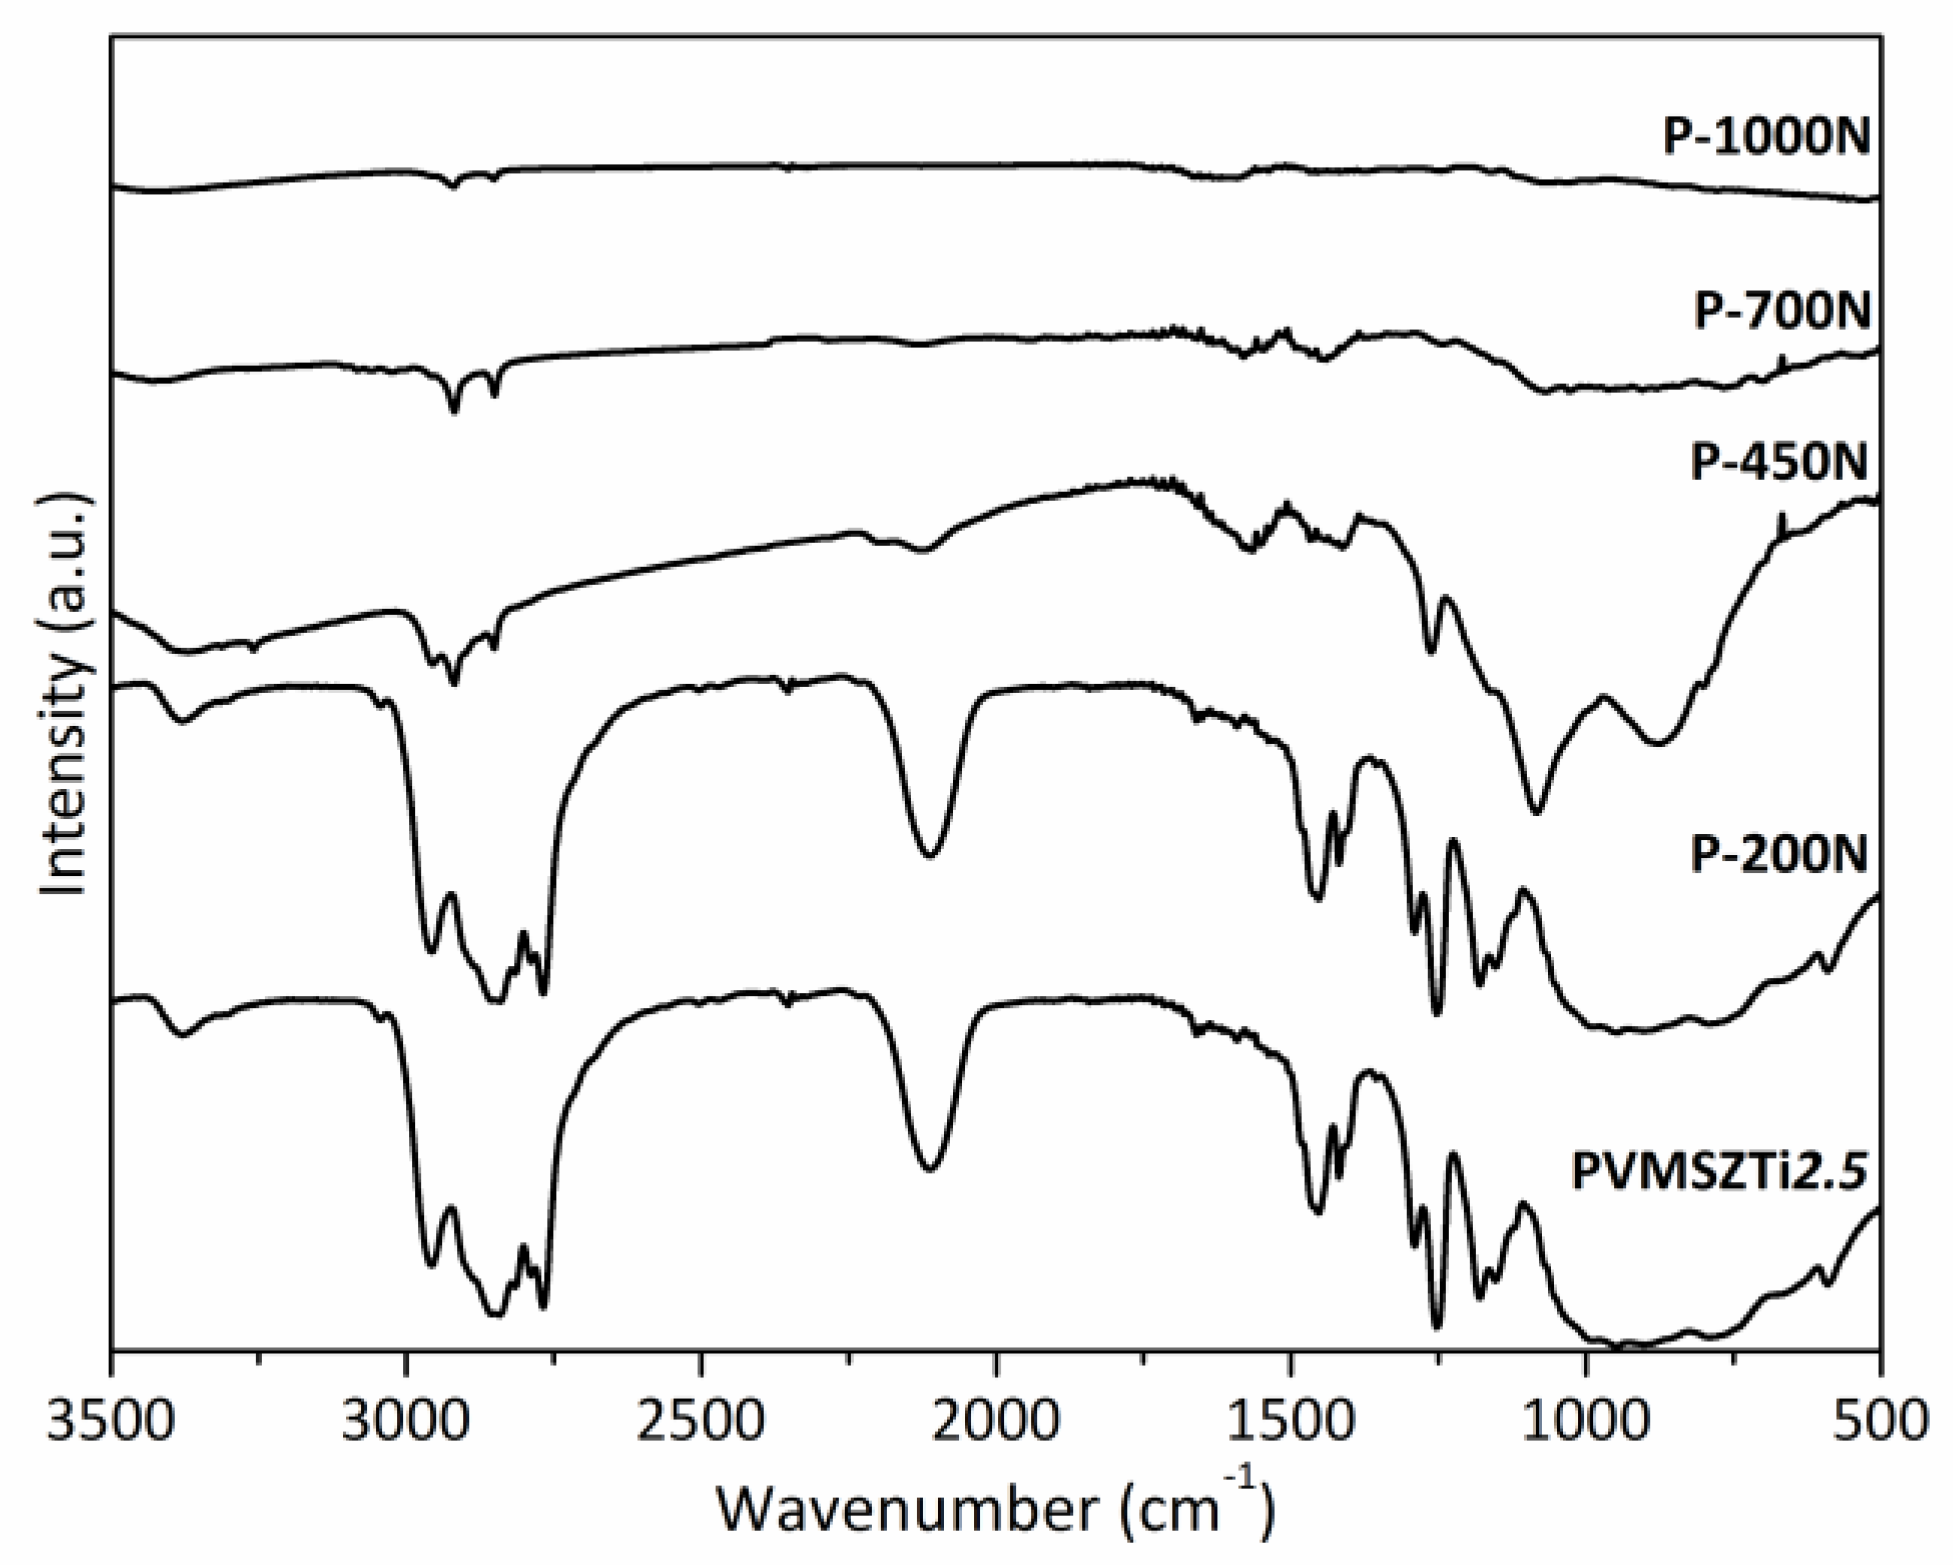
2.2.2. Pyrolysis in Flowing Ammonia

To elucidate the mechanisms governing the polymer-to-ceramic conversion in flowing ammonia, intermediates have been isolated during the pyrolysis of PVMSZTi2.5 at 200, 450, 700 and 1000 °C with a dwelling time of 2 h at each temperature. Pyrolysis intermediates are labeled P-TNH (T being the temperature at which the sample was exposed; NH corresponds to ammonia atmosphere). Representative FTIR has been first carried out. The corresponding spectra are shown in Figure 4.
The P-200NH sample spectrum displays the characteristic absorption bands of the PVMSZTi2.5 sample with a main decrease in intensity of the C-H (from methylamino groups) vibration and deformation bands from 2750 to 2900 cm−1 and from 1375 to 1500 cm−1. These changes are confirmed in the spectrum of the P-450NH sample. Thus, these observations prove the occurrence of the reaction depicted in Equation (5) in the low temperature regime of the pyrolysis (T < 450 °C) as suggested based on TG experiments. To support our observations, the N-H vibration band around 3380 cm−1 becomes much broader toward lower wavenumbers and more intense suggesting the formation of both -NH and-NH2 units as expected through Equation (5). This can be explained by the fact that -Ti[NH2]y groups formed in Equation (5) can further condense with formation of NH-containing bridges such as Ti-NH-Ti bridges by release of ammonia according to Equation (6).
-Ti-NH2 + -Ti-NH2 → -Ti-NH-Ti- + NH3 (g)
In contrast, the intensities of the Si-H vibration band around 2120 cm−1 and SiCH3 deformation band around 1250 cm−1 are relatively stable in the corresponding spectra indicating their poor reactivity under ammonia below 450 °C. Changes occur in the spectrum of the P-700NH sample. The intensity of the bands attributed to these units significantly decrease demonstrating that Si-H and Si-CH3 groups (as well as Si-CH2-CH2-Si/Si-CH(CH3)-Si units) react with ammonia at intermediate temperatures. It is—in general—reported in the temperature range 400–700 °C for polysilazanes [42,43] according to a nucleophilic substitution by ammonia that releases dihydrogen and methane (Equation (7)).
-Si-R + NH3 → -Si-NH2 +RH (R = H, CH3, C2H4Si-)
As proposed by Choong Kwet Yive et al. for polysilazanes [42,43], homolytic cleavages are the most probable reactions occurring in a parallel way according to Equations (8)–(10).
-Si-R → -Si + R (R = H, CH3, C2H4Si-)
R + NH3 (g) → RH + NH2
-Si + NH2 → -SiNH2
As-formed -SiNH2 groups could self-condense at intermediate temperature (Equation (11)) and in the highest temperature regime of the pyrolysis (T > 700 °C, Equation (12)) during the conversion process with formation of Si-NH-Si and -N(Si)3 units by release of ammonia.
-Si-NH2 + -Si-NH2 → -Si-NH-Si- + NH3
-Si-NH-Si- + -Si-NH2 → -N(Si)3 + NH3
Similarly, -Si-NH2 groups (Equation (11)) as well as -TiNH-Ti- units (Equation (6)) can condense with -TiNH2 (Equation (5)) to form -Si-NH-Ti- and -N(Ti)3 units, respectively. In parallel, we cannot exclude that unreacted SiH and NH units can react together at high temperature to release hydrogen. Thus, the decomposition of the majority of functional groups is observed in the P-700NH sample to form -Si-N- and -Ti-N- bonds. In addition to this observation, the alteration in the shape of the absorption bands compared to the earlier state is due to the amorphous character of the material. This is confirmed with the broadness of the main signal in the spectrum recorded after pyrolysis at 1000 °C (P-1000NH). There are no more organic groups and the spectrum is expected to exhibit a mixture of ‘SiN’ and ‘TiN’ units as discussed earlier.
Multinuclear solid-state NMR spectroscopy (Figure 5) has been used to identify the most important structural rearrangements occurring during the thermo-chemical conversion of PVMSZTi2.5 in flowing ammonia. Within this context, the pyrolysis intermediates isolated at 450 °C (P-450NH) and 1000 °C (P-1000NH) have been analyzed by probing the local environment around silicon (29Si, Figure 5a) and carbon (13C, Figure 5b).
Compared to the 29Si MAS spectrum of the PVMSZTi2.5 sample (Figure 2b), the 29Si MAS spectrum of the P-450NH sample (Figure 5a) results in a small shift of the main signal toward the resonance at −28 ppm attributed to SiN3C units while the signal assigned to SiC2N2 units is retained. This suggests that HSiCN2 units (and SiN4 units) are the main environment affected by the pyrolysis under ammonia in the low temperature regime of the pyrolysis. In parallel, the 13C CP MAS signals at 39 and 45 ppm in the spectrum of the P-450NH sample attributed to -TiNCH3 units disappear (Figure 5b) compared to the 13C CP MAS spectrum of the PVMSZTi2.5 sample (Figure 2a). This confirms that such units are decomposed during the first step of the pyrolysis under ammonia as suggested by FTIR. Thus, the spectrum of the P-450NH sample shows one main signal around 10 ppm assigned to carbon atoms of aliphatic groups bonded to a silicon atom and/or a carbon atom linked to another aliphatic carbon. The presence of Si-CH(Si-)-CH3 units or Si-(CH-CH2)n environments confirms that such units persist upon further heat-treatment at intermediate temperature in flowing ammonia. More changes take place in the P-1000NH sample. Obviously, nucleophilic substitutions and rearrangements occur in the temperature range 450–1000 °C that cause a modification of the chemical environment around the silicon atoms. Solid-state NMR suggests a predominantly covalent material in which silicon is mainly present in SiN4 environments (the corresponding signal can be simulated with one component) confirming the occurrence of reactions depicted from Equations (7) and (12). Thus, based on FTIR and NMR spectroscopies and deduced Equations, the P-1000NH sample is made of -N(Si)3 and -N(Ti)3 units. As a consequence, the thermo-chemical conversion of the PVMSZTi2.5 sample in flowing ammonia can be seen as represented in Figure 6.

2.2.3. Pyrolysis in Flowing Nitrogen and Argon

  • Pyrolysis in flowing nitrogen
Pyrolysis intermediates have been also isolated under nitrogen during the pyrolysis of PVMSZTi2.5 at 200, 450, 700 and 1000 °C with a dwelling time of 2 h at each temperature. Pyrolysis intermediates are labeled P-TN (T being the temperature at which the sample was exposed; N corresponds to nitrogen atmosphere). Representative FTIR has been first carried out. The corresponding spectra are shown in Figure 7.
In good agreement with the relative stability of the PVMSZTi2.5 sample during TG experiments up to 200 °C (around 6 wt% of weight loss to be compared to around 17 wt% in flowing ammonia at the same temperature), the P-200N sample spectrum displays the characteristic absorption bands of the PVMSZTi2.5 sample with a relative stability in terms of intensity of bands attributed to the bonds characterizing the functional groups such as C-H, N-H and Si-H. To corroborate this observation, we investigated MS during the TG experiment in flowing nitrogen (Figure 8).
The MS curves show that the temperature range R.T. 200 °C is only associated with a release of dimethylamine (m/z = 44) fragments indicating the occurrence of condensation reactions involving side groups of the type -N((CH3)2)y (y = 1 → 3) and NH units which already took place during the synthesis of the PVMSZTi2.5 sample (Equation (1)). Although the methylamine fragments could not be detected, the release of this gas, however, cannot be excluded in the low temperature regime of the thermo-chemical conversion through the cleavage of the -Si-N(CH3)-Ti units formed by Equation (2), then abstracting hydrogen atoms. In this temperature range, MS also identifies the release of dihydrogen (m/z = 2), most probably because of dehydrocoupling reactions involving NH and SiH groups that did not react during the synthesis of the polymer (-Si-H + -Si-H → -Si-Si- + H2 and -N-H + -Si-H → -N-Si- + H2). These reactions are well known to occur at relatively low temperature [43] and methane (m/z = 15, 16) as a continuity of Equation (2). It should be pointed out that these signals can be also attributed to ammonia because of the occurrence of transamination reactions as depicted in Equations (13)–(15) [44].
2 -Si-NH-Si- → -Si-NH2 + -N(Si)3
-Si-NH2 + -Si-NH-Si- → -N(Si)3 + NH3 (g)
3-Si-NH-Si- → 2-N(Si)3 + NH3 (g)
The release of dihydrogen and methane—in addition to acetylene, ethylene or ethane fragments (m/z = 26)—becomes much more intense above 200 °C in excellent agreement with the significant band intensity changes occurring in the spectrum of the P-450N sample: the band intensity of the bonds characterizing the functional groups significantly decreases indicating that the polymer-to-ceramic conversion mainly takes place between 200 and 450 °C as suggested through the TG experiment that identified a weight loss of around 25 wt% at 450 °C. Associated with the main release of dihydrogen and methane, this band intensity decrease continues between 450 and 700 °C (P-700N); temperature at which the weight loss (32.5 wt%) is almost complete as indicated through the corresponding TG curve. Only the vibration bands attributed to C-H bond are still present as functional groups. Thus, from 200 to 750 °C, the decomposition reactions involve—in part—radical mechanisms [45,46,47]. As observed with FTIR spectra recorder in flowing ammonia, the absorption bands shape is characteristic of the amorphous character of the material after pyrolysis at 1000 °C (P-1000N). They are representative of amorphous ceramics showing no more organic groups and exhibiting a mixture of ‘SiN’, ‘SiC’ units probably also with ‘TiCxNy’ units (x + y = 1). Hence, based on these results, it seems that the decomposition of the PVMSZTi2.5 sample under nitrogen first mainly occurs via the polymerization mechanisms depicted in Equations (1) and (2) to crosslink the polymer backbone. Then, radical reactions (Equation (16)) followed by hydrogen abstraction (Equation (17)) take place at intermediate temperature to consolidate the ceramic structure already at 700 °C through the formation of dihydrogen and hydrocarbons.
-Si-R → -Si + R (R = H, -CH3, -CH2-CH2-Si-/-CH(CH3)Si-)
R + H→ RH (R = H, -CH3, -CH2-CH2-Si-/-CH(CH3)Si-)
Hydrogen radicals are formed by the decomposition of C-H bonds in the high temperature regime of the thermo-chemical conversion. It should be pointed out that the identification of methane can be due to the cleavage of C-C bonds as suggested through Equation (18). Then, the CH3 radical can abstract hydrogen from Si-H bonds (Equation (19)).
-Si-CH(CH3)-Si → -Si-CH-Si + CH3
CH3 + -SiH → -CH4 + Si
The large escape of ethylene CH2=CH2 may arise from the degradation of the Si-CH2-CH2-Si units formed by hydrosilation during the synthesis of the PVMSZTi2.5 sample according to Equations (20) and (21).
Si-CH2-CH2-Si → -Si + CH2-CH2-Si
CH2-CH2-Si → Si + CH2 = CH2
The temperature range 700–1000 °C is probably associated with dihydrogen release due to homolytic cleavage of residual C-H bonds followed by H abstraction (Equations (22) and (23)).
-C-H → C + H
H + H → H2
  • Pyrolysis in flowing argon
The thermo-chemical conversion of the PVMSZTi2.5 sample in an argon atmosphere is similar to that one observed in flowing nitrogen based on the profile of the weight loss curve recorded during the TG experiments. The main difference takes place in the high temperature regime of the TG experiment since the weight loss is not stabilized after pyrolysis at 1000 °C in flowing argon. To understand the behavior of the PVMSZTi2.5 sample in an argon atmosphere, in-situ MS experiments were performed and the corresponding curves are represented in Figure 9.
The nature of the gases that are released from the PVMSZTi2.5 sample in flowing argon and the temperature ranges in which their release significantly occurs matches with the data recorded in nitrogen atmosphere. Only the fragments at m/z = 26, 27 and 30 are identified in either nitrogen (m/z = 26) or argon (m/z = 27 and 30). The ion signals at m/z = 26 and 27 most probably correspond to the C2H2+ and C2H3+ fragments; thereby arising due to the same molecules, i.e., ethane and ethylene evolving in both argon and nitrogen. The ion signal at m/z = 30 corresponds to the release of methylamine that takes place under argon at low temperature as dimethylamine release occurs. The release of methylamine is suggested in flowing nitrogen despite the fact that it is not detected by MS. Thus, the discussion on the thermo-chemical conversion of the PVMSZTi2.5 sample in flowing argon fits the one given previously under nitrogen and the same mechanisms occur in both atmospheres in similar temperature range. Based on the results from FTIR and MS obtained in both nitrogen and argon atmospheres, it is suggested that the thermo-chemical conversion involves three main steps:
(1)
Below 300 °C, the precursor undergoes thermal cross-linking via condensation reactions involving both side groups of the type -N((CH3)2)x (x = 0, 1, 2, 3) and NH units (Equation (1)) and -Si-N(CH3)-Ti- that cleaves upon heating to abstract hydrogen releasing methylamine.
(2)
From 300 to 700 °C, mainly hydrocarbons such as methane and ethane/ethylene and hydrogen are released from the evolving system via radical reactions then H abstraction.
(3)
Above 700 °C, the remaining hydrogen atoms are gradually removed through homolytic cleavage of C-H bonds and then H abstraction to lead to a single-phase amorphous covalently bonded ceramic.
As reported in Figure 10, these reactions lead to P-1000N and P-1000A samples both displaying in their 29Si MAS spectra a relatively broad signal at around −48 ppm ascribed to SiN4 environments. However, its broadness—especially on the left part of the main signal—tends to indicate an enrichment in carbon around silicon to form SiCxN4-x (0 ≤ x ≤ 4) type units compared to the sharper signal identified in the spectrum of the P-1000NH sample that can be simulated with one component as indicated in Figure 5.
Thus, the thermo-chemical conversion of the PVMSZTi2.5 sample in flowing nitrogen and argon can be seen as represented in Figure 11 based on the TG data coupled with in-situ MS and ex-situ FTIR and solid-state spectroscopies of pyrolysis intermediates.

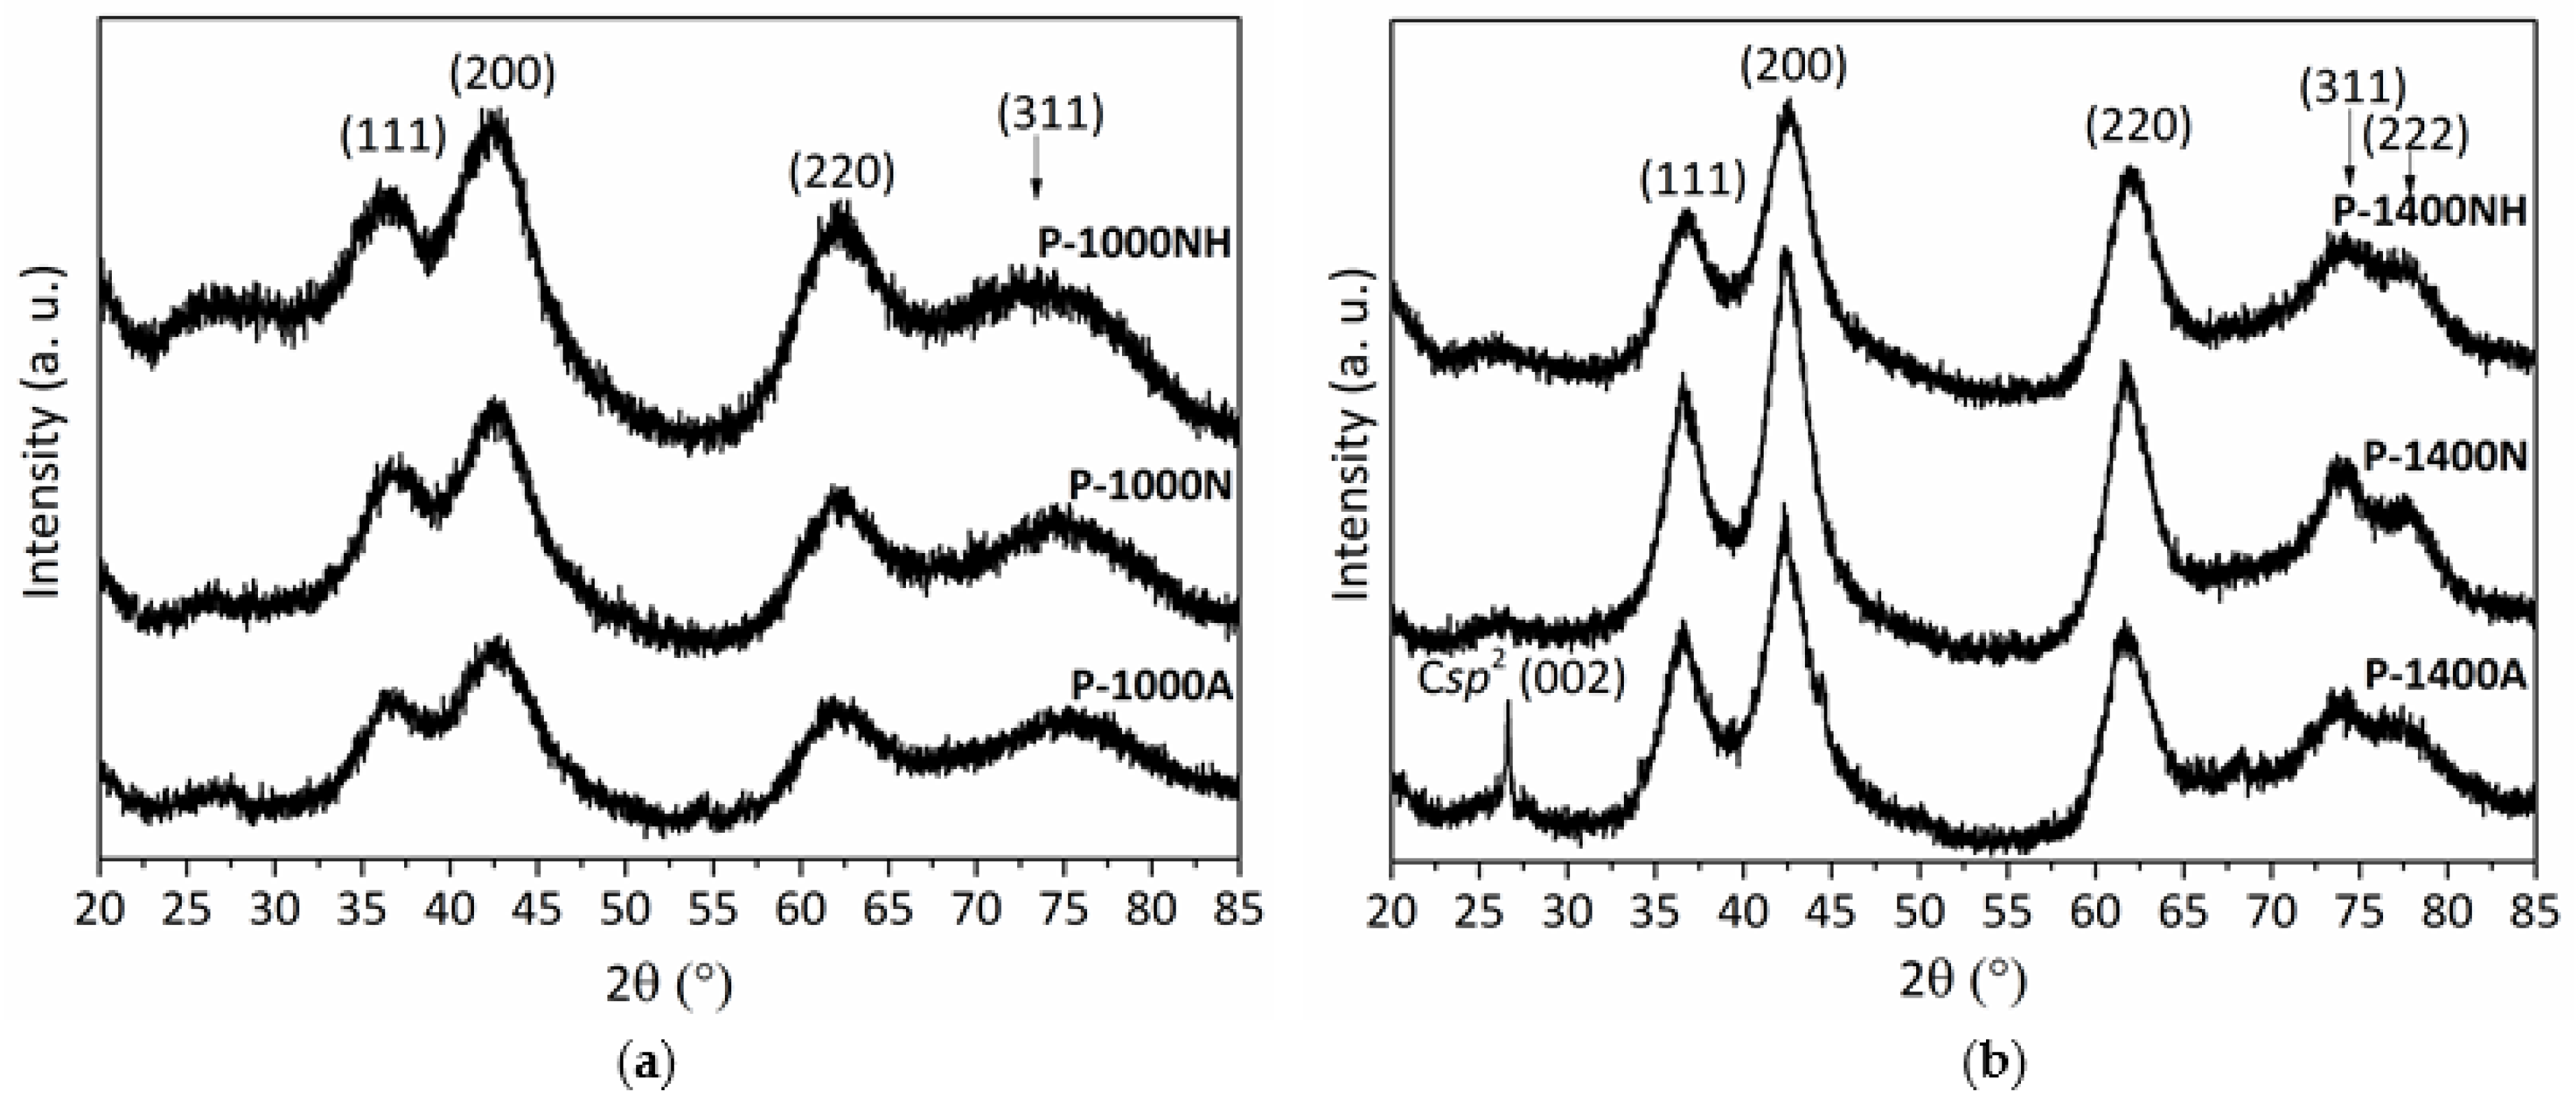
2.3. High-Temperature Phase and Microstructure Evolution of Single-Phase Amorphous Ceramics

After pyrolysis experiments, the X-ray diffractograms reveal that as-pyrolyzed samples are poorly crystallized as shown by the diffuse peaks identified in the patterns of the P-1000NH, P-1000N, P-1000A samples (Figure 12a). In a first approximation, they tend to reveal the slow nucleation of face-centered cubic (fcc) TiN crystals (powder diffraction file (ICDD PDF) number: 00-038-1420) according to the presence of peaks at 2θ around 36.5°, 42.6° and 62.3 which can be attributed to the (111), (200) and (220) TiN reflections, respectively. To support this observation, the very broad peak in the range 72.8–75.2° (peak positions changes according to the nature of the atmosphere) could be attributed to the (311) TiN reflection. The crystallite sizes are low and range from 1.4 (P-1000NH) to 1.7 nm (P-1000A).
For all samples prepared at 1000 °C, EDS analyses demonstrate that:
(i)
the initial Si:Ti ratio (2.5) fixed in the polymer is retained in the derived ceramics,
(ii)
a strong tendency to decrease the carbon content from the sample treated under argon (P-1000A, carbon content of 16.4 wt%) to samples treated under ammonia (P-1000NH, carbon content of 1.5 wt%).
Thus, we can suggest that the P-1000NH sample is only made of Si, Ti and N whereas the P-1000N and P-1000A samples are composed of Si, Ti, C, N. The increase of the annealing temperature to 1400 °C under nitrogen (P-1400NH and P-1400N samples) and argon (P-1400A sample) with a dwelling time of 2 h at 1400 °C does not change the solid-state 29Si NMR response: all spectra report the broad peak characteristic of SiN4 environments with—for the P-1400N and P-1400A samples—emerging peaks in the range −10 to −35 ppm due to SiC4 and SiCxN4-x (0 ≤ x ≤ 4) type units (see Figure S5 in Supplementary Materials). SiC4 environments can be identified in such spectra by comparing them with the spectrum of the P-1800A sample which exhibits only this signal. Although solid-state NMR does not show any changes in the chemical environment of Si, XRD investigations show that annealing to 1400 °C involves further crystallization of the materials (Figure 12b). XRD patterns of the P-1400NH, P-1400N, P-1400A samples reveal better defined and shaper peaks at 2θ = 36.5° (P-1400N and P-1400A) and 36.7° (P-1400NH), from 42.3° (P-1400A) to 42.6° (P-1400NH), from 61.7° (P-1400A) to 62.0° (P-1400NH), 74.1° and 77.5° (all samples). Since the positions tend to slightly change between samples according to the used atmosphere, we tentatively suggested that the XRD patterns exhibit the (111), (200), (220), (311) and (222) peaks from a TiCxNy (x + y = 1) crystalline phase with different stoichiometries. For instance, the peaks (111), (200) and (220) can be indexed according to the TiC0.3N0.7 phase (ICDD PDF 00-042-1488) at 36.45°, 42.35° and 61.44°; the TiC phase (ICDD PDF 00-032-1383) at 35.90°, 41.70° and 60.44°; and the TiN phase (ICDD PDF 00-038-1420) at 36.66°, 42.59° and 61.81°, diffraction patterns, respectively.
As previously reported using the lattice parameter values for pure TiN and TiC and the lattice parameters of various TiCxNy phases, the lattice constant of TiCxNy (x + y = 1) is a linear function of its chemical composition which obeys Vegard’s law [48,49]. Thus, the observed shift of the XRD (200) reflection in Figure 12b was used to estimate the chemical composition of the TiCxNy (x + y = 1) phase in the ceramics prepared at 1400 °C (Table 1) [50].
No further XRD peaks are observed except the (002) peak attributable to sp2 carbon identified in the P-1400A sample. Based on the crystallite size (from 1.9 nm (P-1400NH) to 3.1 nm (P-1400N/P-1400A)), the P-1400NH sample can be considered as a TiN-based ceramic displaying the lowest crystallization degree.
To assess the phase micro-/nanostructure of these materials, the P-1400NH, P-1400N, P-1400A samples have been further studied by means of TEM (Figure 13). Figure 13a depicts a featureless low magnification TEM image of P-1400NH which is significantly different from images recorded for P-1400N and P-1400A samples. In the latter, specimens consist of homogeneously dispersed small nuclei (dark contrast) embedded in an amorphous network. The Selected Area Electron Diffraction (SAED) patterns of the P-1400N and P-1400A samples identify more distinct rings which can be indexed to the (111), (200) and (220) plans of the TiCxNy phase indicating an extent of the crystallization in those samples. In the high-resolution micrographs (Figure 13d–f), the analysis of the P-1400NH sample (Figure 13d) reveals the presence of nanocrystals with a lattice spacing of 0.24 nm corresponding to the d-spacing of the lattice plane of the TiN structure, i.e., the (111) direction of the fcc cubic rocksalt TiN structure which agrees with the phase identified in the X-ray diffractogram of the same sample (Figure 12b). The HRTEM micrographs in Figure 13e,f demonstrate that crystallization occurs in-situ in the P-1400N and P-1400A samples. Lattice fringes of the TiCxNy nanocrystals—with diameter less than 5 nm as better calculated in Figure 13e,f—are observed which confirms that the samples represent nanocomposites with a fringe spacing of 0.25 nm. As a conclusion, heat-treatment above 1400 °C provides access to nanocomposites composed of nano-precipitate homogeneously distributed in an amorphous matrix. Thus, in the following section, we investigated separately ammonia-treated samples and nitrogen/argon-treated samples.

2.3.1. Ammonia-Treated Samples Heat-Treated in the Temperature Range 1500–1800 °C

After heat-treatment at 1500 °C, the P-1500NH sample shows sharper and more intense TiN XRD peaks (crystallite size = 16 nm) as well as emerging XRD peaks corresponding to nanosized α-Si3N4 (ICDD PDF number: 04-005-5074) crystals (Figure 14a). HRTEM (Figure 15a) confirms clear evidence for the crystallization process of the TiN nanophase (P-1500NH) appearing as small nuclei (around 10 nm). We can clearly distinguish the fcc structure of TiN nanocrystals with a fringe spacing of 0.24 nm (Figure S7a in Supplementary Materials). This is confirmed through the SAED pattern (inset in Figure 15a).
The increase of the annealing temperature confirms TiN crystal growth as shown through the XRD patterns of samples annealed at 1600 °C (P-1600NH, crystallite size = 22.4 nm) and 1800 °C (P-1800NH, crystallite size = 27.4 nm). Samples represent nanocomposites made of crystallized TiN and Si3N4 (α and β (ICDD PDF number: 04-033-1160)) phases (Figure 14a). In the following section, we discussed the crystallization behavior of the samples pyrolyzed then annealed in flowing nitrogen and argon together.

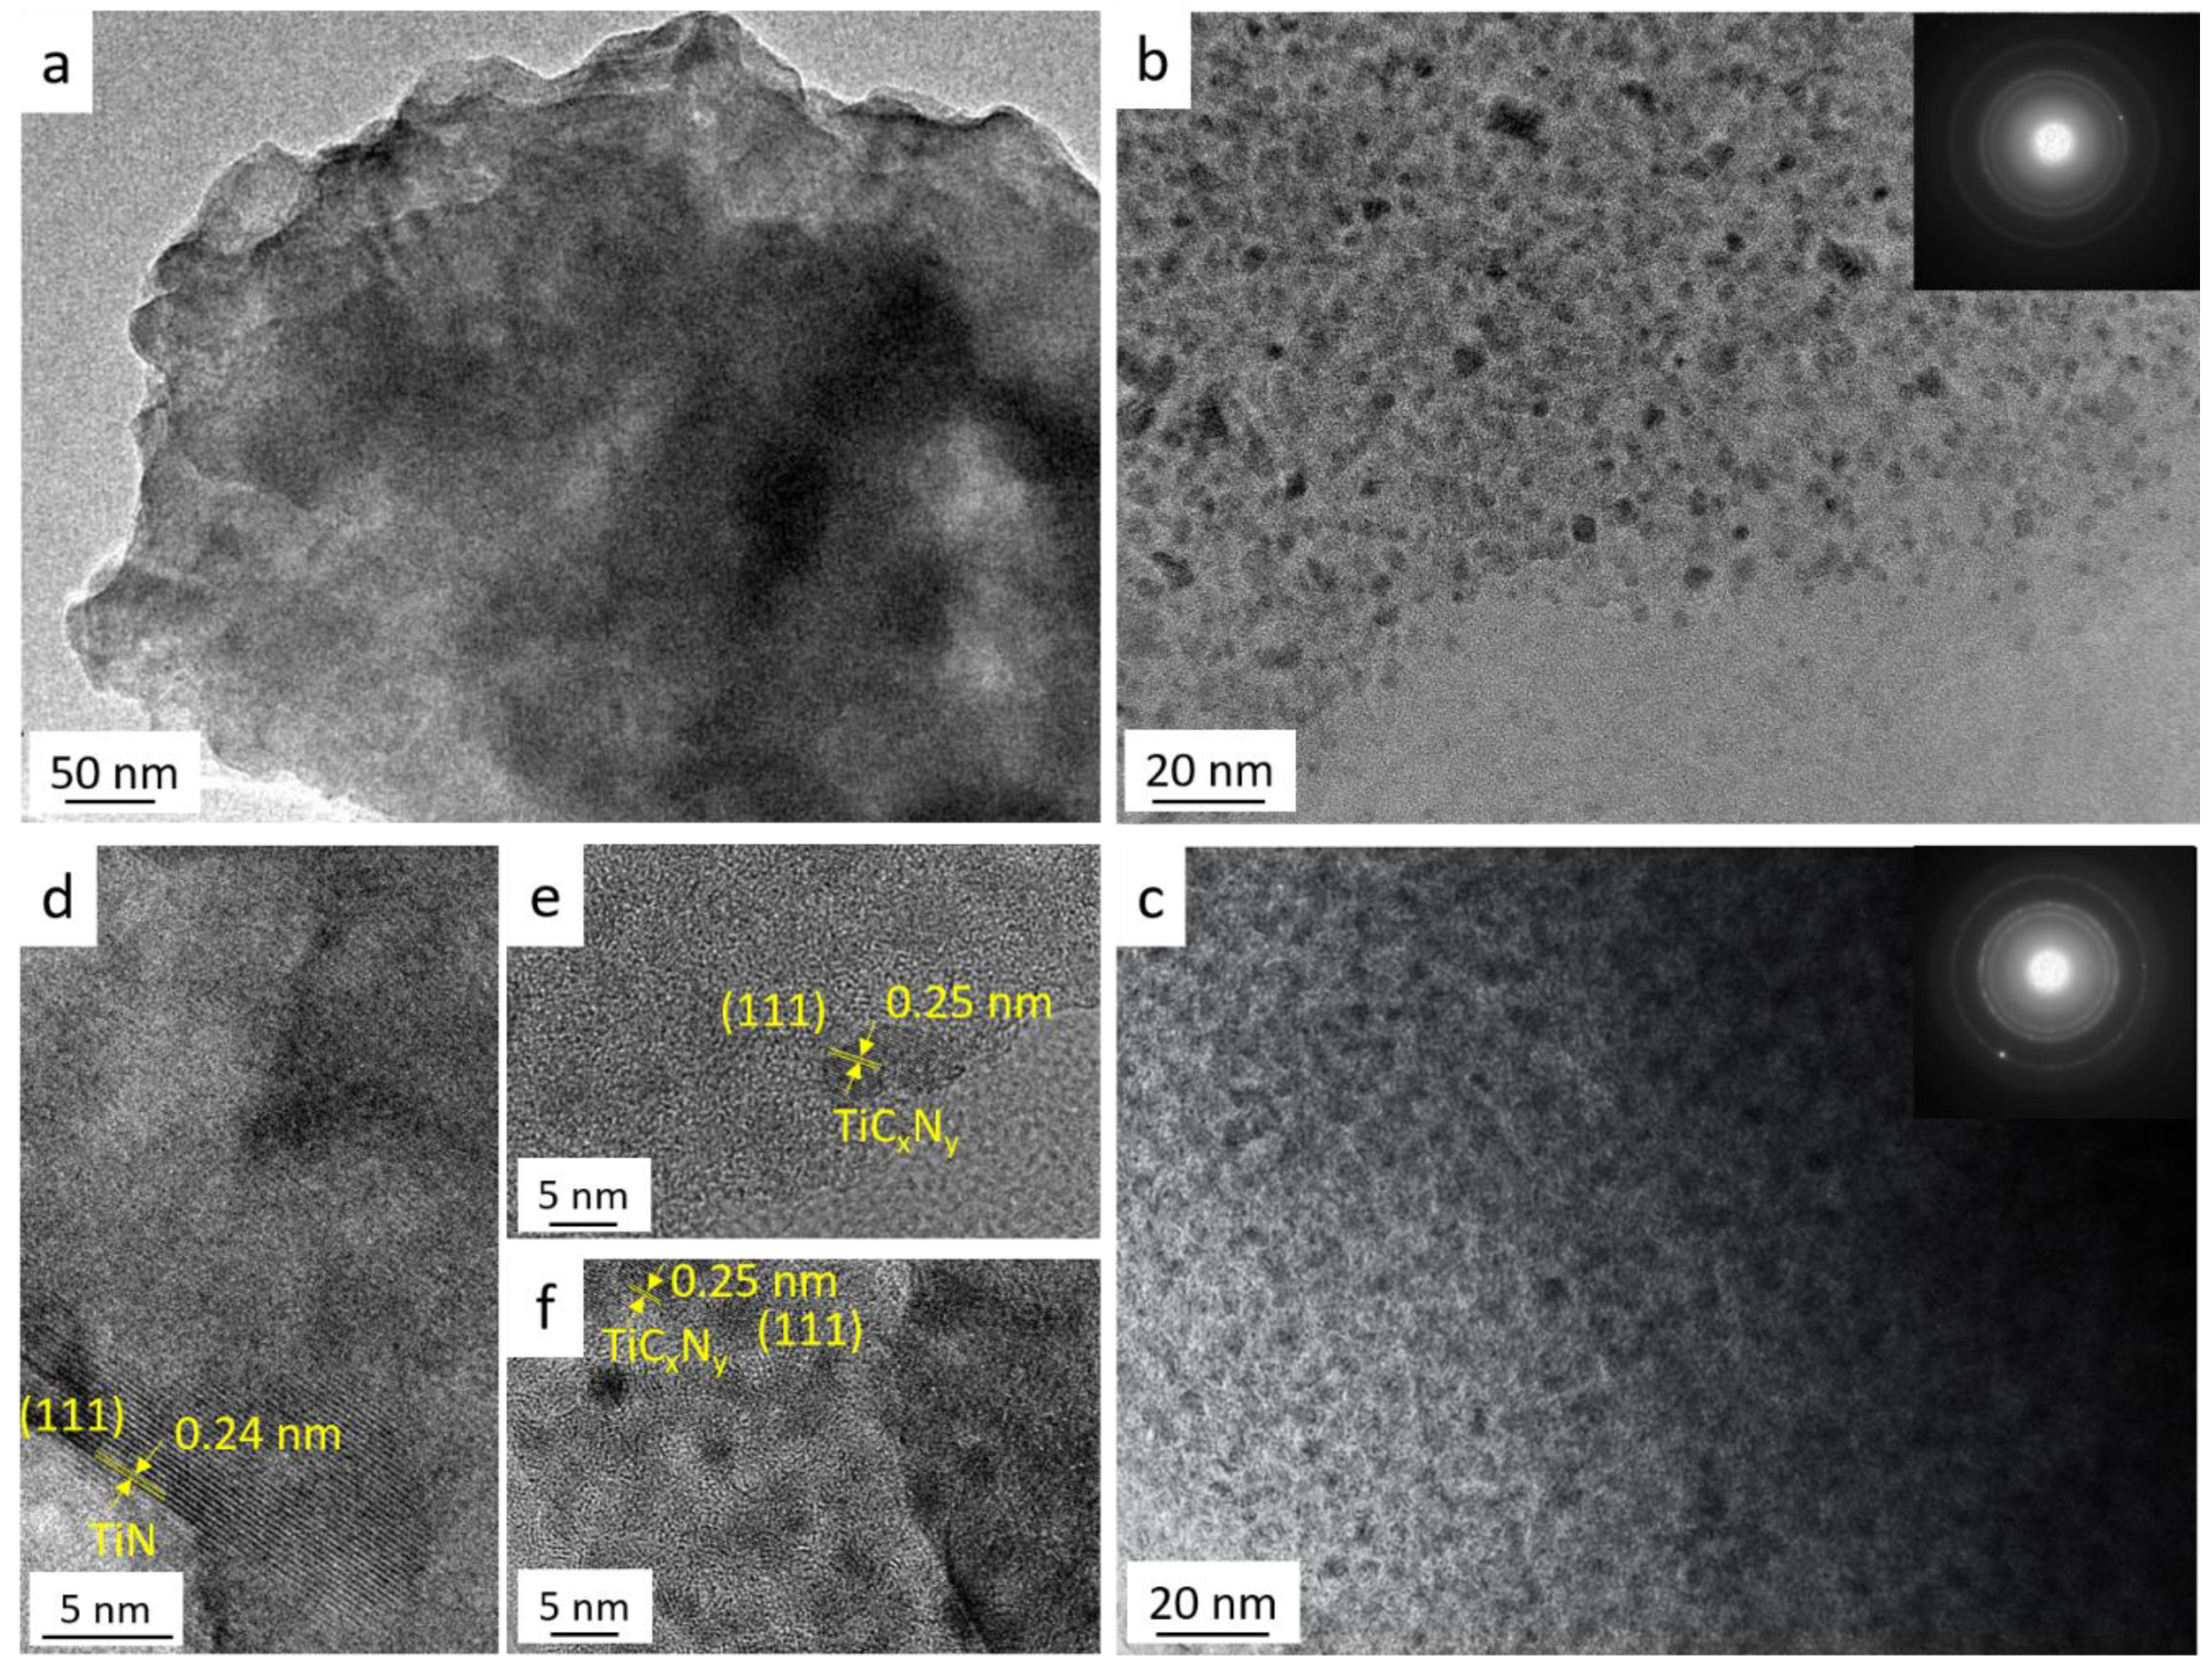
2.3.2. Nitrogen and Argon-Treated Samples Heat-Treated in the Temperature Range 1500–1800 °C

The increase of the temperature to 1500 °C (P-1500N (Figure 14b) and P-1500A (Figure 14c)) involves further crystallization of both TiC0.3N0.7 (crystalline size = 10.8 nm) and α and β-Si3N4 phases in P-1500N (see Figure S6 in Supplementary Materials) and both TiC0.4N0.6 (crystalline size = 28.4 nm) and β-SiC (ICDD PDF number: 00-029-1129) phases in P-1500A. In the latter, we cannot exclude the presence of α/β-Si3N4 phases because of the relative broadness of the XRD peaks. Thus, compared to the (200) XRD peak position in the XRD pattern of the P-1400N and P-1400A samples (Figure 12b, Table 1), the reflections of the TiCxNy (x + y = 1) phase slightly shift towards lower diffraction angles indicating that the TiCxNy (x + y = 1) phase becomes enriched in carbon. This is illustrated in Figure 16 for the P-1500A sample and its derivatives at 1600 °C (P-1600A) and 1800 °C (P-1800A).
Figure 15b,c displays the low magnification images of the P-1500N and P-1500A samples. They show that nanocrystals with a size that can exceed 20 nm—in particular for the sample formed under argon—co-exist with an amorphous phase appearing as a bright-appearing network. The SAED patterns (insets in Figure 15b,c) are composed of distinct spots that indicate the high degree of crystallinity of TiCxNy (x + y = 1) nanocrystals. The high magnification of HRTEM images of both samples exhibit lattice fringe of the TiCxNy (x + y = 1) nanophase with an equal fringe spacing of 0.25 nm. (Figure S7 in Supplementary Materials). Pyrolysis temperatures of 1600 °C identified compositions of TiC0.4N0.6 (P-1600N; crystalline size = 25.8 nm) and TiC0.6N0.4 (P-1600A; crystalline size = 43.3 nm) (Table 1) along with SiC. The heat-treatment to 1800 °C involves further crystallization of the phases and we noticed that the diffraction (200) peaks shift toward lower diffraction angles of TiC indicating an increase in the lattice parameter and the formation of the TiC0.5N0.5 (P-1800N; crystalline size = 109.6 nm) and TiC0.8N0.2 (P-1800A; crystalline size = 109.8 nm) solid solutions whereas β-/α-SiC could be assigned to other peaks (Figure 14b,c). From line broadening of the (220) reflection, the β-SiC crystallite size is estimated to be 99.8 nm.
EDS analyses (See EDS mapping in Figures S8 and S9 in Supplementary Materials) of the P-1600A and P-1800A, samples indicated the gradual formation of TiC/SiC nanocomposites with the increase of the temperature to 1800 °C, especially using argon as an atmosphere. The identification of SiC4 environments has been confirmed in the P-1800A sample via 29Si solid-state NMR (See Figure S5 in Supplementary Materials). To be more accurate in the C, N and O contents, we investigated C/S and N/O/H analysis for these samples and, by considering the measurement of Si and Ti contents by EDS, we found that they exhibited chemical formulas of Si1.0Ti0.2C0.8N0.200.02 (P-1600A) and Si1.0Ti0.2C1.1N0.100.01 (P-1800A) indicating the formation of a nanocomposite composed of 20 wt% of TiC in a SiC matrix free of carbon whereas nitrogen could be neglected according to the very low content (1.5 wt%). Thus, through the modulation of the atmosphere of pyrolysis, we succeeded in the design of nitride, carbonitride and carbide nanocomposites using an unique titanium-modified polysilazane.

3. Materials and Methods

3.1. General Comments

The synthesis of the precursor is carried out in a purified argon atmosphere passing through a column of phosphorus pentoxide and then a vacuum/argon line by means of standard Schlenk techniques. The cleaned glassware is stored in an oven at 90 °C overnight before being connected to the vacuum/argon line, assembled and pumped under vacuum for 30 min and then filled with argon. All chemical products are handled in an argon-filled glove box (Jacomex, Campus-type; O2 and H2O concentrations kept at ≤0.1 ppm and ≤0.8 ppm, respectively). Toluene (99.85%, Extra Dry over Molecular Sieve, AcroSeal(R)) was purchased from Acros Organics™. The poly(vinylmethyl-co-methyl)silazane (commercial name: Durazane® 1800) was provided by Merck company, Germany, stored in a fridge and used as-received. It is labeled PVMSZ. Anal. Found (wt%): Si, 41.3; C, 27.3; N, 22.7; H, 8.3; O, 0.4. [Si1.0C1.5N1.1H5.5]n (Referenced to Si1.0 and oxygen content was omitted in the empirical formulae). FTIR (ATR/cm−1): ν (N−H) = 3388 (m), ν (C−H) = 3046 (s), 3010 (s), 2954 (s), 2895 (s), 2852 (m), ν (Si−H) = 2121 (vs), δ (vinyl) = 1591 (m), δ (CH2) = 1405 (m), δ (Si−CH3) = 1251 (s), δ (N-H): 1166 (m), δ (C-H + C-C + N−Si−N + Si-C) = 1005-630 (vs); 1H NMR (300 MHz, CDCl3, δ/ppm): 0.4–0.1 (br, SiCH3), 1.1–0.5 (br, NH), 4.9–4.4 (br, SiH), 6.3–5.7 (br, vinyl). Tetrakis(dimethylamido)titanium (Ti[N(CH3)2]4, 99.99%) was obtained from Acros Organics™, stored in a fridge and used without further purification. It is labeled TDMAT.

3.2. Polymer Synthesis

The reaction between PVMSZ and TDMAT is done in toluene at temperature of reflux (115 °C) in a three-neck round-bottom flask. In a typical experiment, 5.7 g of TDMAT (16.5 mmol) is quickly added with a syringe under flowing argon to a solution of 2.7 g of PVMSZ (41.2 mmol referred to the theoretical monomeric unit of the polymer) in 80 mL of toluene at RT under vigorous stirring. Then, the temperature is increased up to 115 °C under static argon and kept at this temperature under vigorous stirring for three days. After cooling down, the solvent is extracted via an ether bridge (100 °C/1.5.10−1 mbar) to release an air- and moisture-sensitive titanium-modified PVMSZ labeled PVMSZTi2.5 (2.5 being the Si:Ti ratio) that appears as a brownish-black powder. Anal. Found (wt %): Si 25.8, Ti 11.9, C 33.1, N 20.7, H 7.9, O 0.6. [Si1.0Ti0.3C3.0N1.6H8.5]n (Referenced to Si1.0 and oxygen content was omitted in the empirical formulae). FTIR (KBr/cm−1): ν(N−H) = 3376 (w), ν (C−H) = 2960 (s), 2848 (s), 2761 (s), ν(Si−H) = 2123 (m), δ(CH3) = 1457 (s), δ(CH2) = 1417 (m), δ(C-N) = 1294 (m), δ(Si−CH3) = 1250 (s), δ (N-H): 1174 (m), δ (C-H + C-C + N−Si−N + Si-C + Si−N−Ti) = 1054-655 (vs).

3.3. Synthesis of the Ceramic Materials

Polymeric powders are placed in alumina boats in the glove-box, then introduced in a sealed tube under argon atmosphere to prevent any oxygen contamination of the samples during the transfer to the furnace. Powders are then introduced under argon flow into a silica tube inserted in a horizontal furnace (Carbolite BGHA12/450B). The tube is evacuated (0.1 mbar) and refilled with anhydrous ammonia (99.99%), nitrogen (99.995%) or argon (99.995%) to atmospheric pressure. Subsequently, the samples are subjected to a cycle of ramping of 5 °C.min−1 in the temperature range 200–1000 °C in flowing ammonia, nitrogen or argon (dwelling time of 2 h at the temperature selected among 200, 450, 700 and 1000 °C). A constant flow (120 mL min−1) is passed through the tube during the pyrolysis cycle. After cooling under argon atmosphere, ammonia-, nitrogen- and argon-pyrolyzed samples are stored in the glove-box for characterization. Samples are labeled P-TX with T being the temperature at which the polymer has been exposed and X corresponding to the nature of the atmosphere: X = A for argon, X = N for nitrogen and X = NH for ammonia. For the high temperature (T > 1000 °C) investigation, samples pyrolyzed at 1000 °C (P-1000NH, P-1000N and P-1000A) are subsequently introduced in a graphite furnace (Gero Model HTK 8 for ammonia-pyrolyzed samples and a Nabertherm VHT-GR for nitrogen- and argon-pyrolyzed samples) for annealing treatments. The furnaces are pumped under vacuum (1.10−1 mbar), refilled with nitrogen for ammonia- and nitrogen-pyrolyzed samples or with argon for argon-pyrolyzed samples and maintained under a constant flow of gas (200 mL min−1) during the whole heat treatment. The program consists of a 5 °C.min−1 heating ramp up to the maximum temperature fixed in the range 1400–1800 °C, dwelling at the selected temperature for 2 h and cooling down to RT at 5 °C.min−1. Samples are labeled P-TX with T the temperature at which the polymer has been exposed (1400, 1500, 1600 and 1800 °C) and X corresponds to the nature of the atmosphere: X = A for argon, X = N for nitrogen and X = NH for ammonia (200 °C ≤ T ≤ 1000 °C) and then nitrogen T > 1000 °C.

3.4. Material Characterization

As the polymers are reactive towards moisture and oxygen, the following sample preparations were performed within a glove box. The chemical structure of polymers was determined by transmission FTIR spectroscopy using a Nicolet Magna 550 Fourier transform-infrared spectrometer. 1H NMR data of PMVSZ solutions in CDCl3 were obtained using a Bruker AM 300 spectrometer operating at 300 MHz. Tetramethylsilane (TMS) was used as a reference for the NMR data. Solid-state 13C CP MAS, 15N CP MAS and 29Si MAS NMR spectra were recorded on a Bruker AVANCE 300 spectrometer (7.0 T, ν0(1H) = 300.29 MHz, ν0(13C) = 75.51 MHz, ν0(15N) = 30.44 MHz, ν0(29Si) = 59.66 MHz) using 4 mm and 7 mm Bruker probes and a spinning frequencies of 10 and 5 kHz, respectively. 13C and 15N CP MAS experiments were recorded with ramped-amplitude cross-polarization in the 1H channel to transfer magnetization from 1H to 13C and 15N. (Recycle delay = 3 s, CP contact time = 1 ms, optimized 1H spinal-64 decoupling). Single pulse 29Si MAS NMR spectra were recorded with a recycle delay of 60 s. Chemical shift values were referenced to tetramethylsilane for 13C and 29Si and CH3NO2 for 15N. Chemical analyses of the polymers were performed using a combination of several methods at Mikroanalytisches Labor Pascher (Remagen, Germany). Thermogravimetric analyses (TGA) of samples were performed in flowing ammonia at 5 °C.min−1 to 1000 °C using silica crucibles (Setaram TGA 92 16.18, SETARAM Instrumentation (Caluire, France)). In addition, they were done in flowing nitrogen or argon at 5 °C.min−1 to 1000 °C using alumina crucibles at ambient atmospheric pressure (STA 449 F3, Netzsch GmbH, Selb, Germany) coupled with mass spectrometer (Omnistar, Pfeiffer Vacuum GmbH, Asslar, Germany) in outlet. The phase composition of ceramic samples was determined by XRD analysis (Bruker AXS D8 Discover, CuKα radiation, Billerica, MA, USA). The scans were performed in the range of 2θ ∈ 〈20°; 85°〉 with a step of 0.015° and an exposure time of 0.7 s. The diffractograms were analyzed using the Diffrac + EVA software with the JCPDS-ICDD database. Crystallite sizes of TiCxNy crystals were calculated from the FWHM of the (200) diffraction lines using the Scherrer’s equation while their chemical composition was measured by considering the interlayer spacing d200 and the lattice parameter a considering both the Scherrer equation and the Vegard’s law. The chemical analysis of selected powders was determined by scanning electron microscopy equipped with energy dispersive spectroscope (EDS-SEM, JEOL IT 300 LV, Tokyo, Japan) and confirmed for some of them using hot gas extraction techniques with a Horiba EMGA-830 for oxygen, nitrogen and hydrogen contents and using a combustion analysis method for carbon content on a Horiba Emia-321V. Structural and morphological characterizations were conducted by Transmission Electron Microscopy with a JEM-2100F model from JEOL (Japan) for nitrogen- and argon-treated samples and at the Indian Institute of Technology Madras, Chennai using TECNAI 20G2, FEI instruments (Hillsboro, OR, USA) with an accelerating voltage of 200 kV & JEOL 3010 (Japan) at an accelerating voltage of 300 kV for ammonia-treated samples.

4. Conclusions

Within the present study, a titanium-modified polysilazane has been synthesized by adding tetrakis(dimethylamido)titanium Ti[N(CH3)2]4 (TDMAT as titanium source) to a commercially available poly(vinylmethyl-co-methyl)silazane labeled PVMSZ according to an atomic Si:Ti ratio of 2.5. The effect of the nature of the atmosphere including ammonia, nitrogen and argon behind its thermo-chemical conversion and the crystallization behavior of derived amorphous ceramics has been critically investigated. Synthesis reactions involved N-H and Si-H bonds in polysilazanes and N(CH3)-based groups in TDMAT as well as hydrosilylation reactions based on complementary characterization tools including FTIR, solid-state NMR and elemental analysis. Thus, the incorporation of Ti increased the crosslinking degree of the polysilazane and introduced side groups that affect the weight change during the further polymer-to-ceramic conversion. Titanium plays a major role in modifying the mechanisms of the polysilazane-to-ceramic transformation, especially in the low temperature regime of the thermal decomposition by prohibiting the distillation of small polymer fragments occurring with PVMSZ and then releasing amines most probably from side groups and hydrocarbons based on radical reactions. Pyrolysis mechanisms have been identified based on TG experiments, FTIR, solid-state NMR and MS spectroscopies. After pyrolysis to 1000 °C, materials are X-ray amorphous (although nucleation of TiCxNy (x + y = 1) nanocrystals could be considered) and display a Si:Ti ratio in good agreement with the ratio fixed the polymers. The final nano-/microstructure evolved according to the annealing temperature fixed in the range 1400–1800 °C. Ammonia-treated amorphous ceramics evolved toward nanocrystalline-TiN/amorphous-Si3N4 whereas nitrogen- and argon-treated ceramics led to nanocrystalline-TiCxN1-x/amorphous-SiC(N) nanocomposites after annealing at 1400 °C. At 1800 °C, highly crystallized nanocomposites are obtained in the Si-Ti-N (ammonia-treated ceramics) and Si-Ti-C (argon-treated ceramics) systems. The nitrogen-treated samples represent TiCxNy (x + y = 1)/SiC nanocomposites.

Supplementary Materials

The following are available online, Figure S1: FTIR spectra of PVMSZ, PVMSZ_T and PVMSZTi2.5 samples, Figure S2: liquid-state 13C-NMR spectrum of TDMAT, Figure S3: experimental 13C CP MAS NMR recorded for the PVMSZTi2.5 sample from −20 to 160 ppm, Figure S4: TG curves recorded during decomposition of PVMSZ in flowing ammonia, nitrogen and argon, Figure S5: experimental 29Si CP MAS NMR for the P-1400NH, P-1400N, P-1400A and P-1800A samples at 7 T, Figure S6: identification of the α and β-Si3N4 phases in the XRD pattern of P-1500N, Figure S7: HRTEM micrographs of P-1500NH (a), P-1500N (b) and P-1500A (c) samples with FFT images obtained from HRTEM images of P-1500N (b) and P-1500A (c) samples as insets, Figure S8: EDS mapping of the P-1600A sample, Figure S9: EDS mapping of the P-1800A sample.

Author Contributions

Conceptualization, M.B., A.L., V.P., A.V.A.B. and S.B.; methodology, M.B., A.L., V.P., A.V.A.B. and S.B.; validation, R.K., C.G. and S.B.; investigation, M.B., A.L., V.P., A.V.A.B., P.C., C.G. and E.W.A.; formal analysis, E.W.A. and C.G.; writing—original draft preparation, S.B.; writing—review and editing, R.K., R.A.F.M., C.G. and S.B.; visualization, supervision and funding acquisition, R.K., R.A.F.M. and S.B. All authors have read and agreed to the published version of the manuscript.

Funding

This research was funded by the funding agency Agence Nationale de la Recherche (ANR) through the Carapass project (Project number ANR-16-CE08-0026), the funding received from Indo-French Centre for the Promotion of Advanced Research (CEFIPRA, Project No. 5108-1), the financial contribution from COFECUB through the Ph-C 956/19 project.

Acknowledgments

S.B. acknowledges Agence Nationale de la Recherche (ANR) for supporting this work through the Carapass project (PhD thesis of M.B.). S.B. and R.K. would like to thank CEFIPRA to carry out this work and to support the PhD theses of A.L. and E.W.A. S.B. gratefully acknowledge the financial contribution from CNRS and DGA for the PhD thesis of V.P., S.B. and R.A.F.M. acknowledge the CNPq for providing financial support for the PhD thesis of A.V.A.B. as well as COFECUB.

Conflicts of Interest

The authors declare no conflict of interest.

References

  1. Hnatko, M.; Hičák, M.; Labudová, M.; Galusková, D.; Sedláček, J.; Lenčéš, Z.; Šajgalík, P. Bioactive silicon nitride by surface thermal treatment. J. Eur. Ceram. Soc. 2020, 40, 1848–1858. [Google Scholar] [CrossRef]
  2. Sandra, F.; Ballestero, A.; NGuyen, V.L.; Tsampas, M.N.; Vernoux, P.; Balan, C.; Iwamoto, Y.; Demirci, U.B.; Miele, P.; Bernard, S. Silicon Carbide-based Membranes with High Filtration Efficiency, Durability and Catalytic Activity for CO/HC Oxidation and Soot Combustion. J. Membr. Sci. 2016, 501, 79–92. [Google Scholar] [CrossRef]
  3. Lale, A.; Wasan, A.; Kumar, R.; Miele, P.; Demirci, U.B.; Bernard, S. Organosilicon Polymer-Derived Mesoporous 3D Silicon Carbide, CarboNitride and Nitride Structures as Platinum Supports for Hydrogen Generation by Hydrolysis of Sodium Borohydride. Int. J. Hydro. Energy 2016, 41, 15477–15488. [Google Scholar] [CrossRef]
  4. Dong, L.; Wang, Y.; Tong, X.; Lei, T. Silicon carbide encapsulated graphite nanocomposites supported Pt nanoparticles as high-performance catalyst for methanol and ethanol oxidation reaction. Diam. Relat. Mater. 2020, 104, 107739–107744. [Google Scholar] [CrossRef]
  5. Feng, Y.; Yang, Y.; Wen, Q.; Riedel, R.; Yu, Z. Dielectric Properties and Electromagnetic Wave Absorbing Performance of Single-Source-Precursor Synthesized Mo4.8Si3C0.6/SiC/Cfree Nanocomposites with an In Situ Formed Nowotny Phase. ACS Appl. Mater. Int. 2020, 12, 16912–16921. [Google Scholar] [CrossRef]
  6. Lale, A.; Mallmann, M.D.; Tada, S.; Bruma, A.; Özkar, S.; Kumar, R.; Haneda, M.; Machado, R.A.F.; Iwamoto, Y.; Demirci, U.B.; et al. Highly Active, Robust and Reusable Micro-/Mesoporous TiN/Si3N4 Nanocomposite-based Catalysts: Understanding the Key Role of TiN Nanoclusters and Amorphous Si3N4 Matrix in the Performance of the Catalyst System. Appl. Catal. B Environ. 2020, 272, 118975–118984. [Google Scholar] [CrossRef]
  7. Mera, G.; Gallei, M.; Bernard, S.; Ionescu, E. Ceramic Nanocomposites from Tailor-Made Preceramic Polymers. Nanocomposites 2015, 5, 468–540. [Google Scholar] [CrossRef]
  8. Eckardt, M.; Zaheer, M.; Kempe, R. Nitrogen-doped mesoporous SiC materials with catalytically active cobalt nanoparticles for the efficient and selective hydrogenation of nitroarenes. Sci. Rep. 2018, 8, 2567–2572. [Google Scholar] [CrossRef] [Green Version]
  9. Colombo, P.; Soraru, G.D.; Riedel, R.; Kleebe, H.-J. Polymer Derived Ceramics: From Nano-Structure to Applications; DEStech Publications: Lancaster, PA, USA, 2009. [Google Scholar]
  10. Bill, J.; Aldinger, F. Precursor-derived covalent ceramics. Adv. Mater. 1995, 7, 775–787. [Google Scholar] [CrossRef]
  11. Greil, P. Polymer derived engineering ceramics. Adv. Eng. Mater. 2000, 2, 339–348. [Google Scholar] [CrossRef]
  12. Colombo, P.; Mera, G.; Riedel, R.; Soraru, G.D. Polymer-derived ceramics: 40 years of research and innovation in advanced ceramics. J. Am. Ceram. Soc. 2010, 93, 1805–1837. [Google Scholar] [CrossRef]
  13. Ionescu, E.; Kleebe, H.-J.; Riedel, R. Silicon-containing polymer-derived ceramic nanocomposites (PDC-NCs): Preparative approaches and properties. Chem. Soc. Rev. 2012, 41, 5032–5052. [Google Scholar] [CrossRef] [PubMed]
  14. Zaheer, M.; Schmalz, T.; Motz, G.; Kempe, R. Polymer derived non-oxide ceramics modified with late transition metals. Chem. Soc. Rev. 2012, 41, 5102–5116. [Google Scholar] [CrossRef] [PubMed]
  15. Bernard, S.; Miele, P. Polymer-derived boron nitride: A review on the chemistry, shaping and ceramic conversion of borazine derivatives. Materials 2014, 7, 7436–7459. [Google Scholar] [CrossRef] [PubMed] [Green Version]
  16. Stabler, C.; Ionescu, E.; Graczyk-Zajac, M.; Gonzalo-Juan, I.; Riedel, R. Silicon oxycarbide glasses and glass-ceramics: “All-Rounder” materials for advanced structural and functional applications. J. Am. Ceram. Soc. 2018, 101, 4817–4856. [Google Scholar] [CrossRef]
  17. Viard, A.; Fonblanc, D.; Lopez-Ferber, D.; Schmidt, M.; Lale, A.; Durif, C.; Balestrat, M.; Rossignol, F.; Weinmann, M.; Riedel, R.; et al. Polymer derived Si-B-C-N ceramics: 30 years of research. Adv. Eng. Mater. 2018, 20, 1800360–1800371. [Google Scholar] [CrossRef]
  18. Ionescu, E.; Bernard, S.; Lucas, R.; Kroll, P.; Ushakov, S.; Navrotsky, A.; Riedel, R. Ultrahigh temperature ceramics (UHTCs) and related materials—Syntheses from polymeric precursors and energetics. Adv. Eng. Mater. 2019, 21, 1900269–1900292. [Google Scholar] [CrossRef] [Green Version]
  19. Wen, Q.; Yu, Z.; Riedel, R. The fate and role of in situ formed carbon in polymer-derived ceramics. Prog. Mater. Sci. 2020, 109, 100623–100685. [Google Scholar] [CrossRef]
  20. Lale, A.; Schmidt, M.; Mallmann, M.D.; Bezerra, A.V.A.; Diz Acosta, E.; Machado, R.A.F.; Demirci, U.B.; Bernard, S. Polymer-derived ceramics with engineered mesoporosity: From design to application in catalysis. Surf. Coat. Technol. 2018, 350, 569–586. [Google Scholar] [CrossRef]
  21. Viard, A.; Miele, P.; Bernard, S. Polymer-derived ceramics route toward SiCN and SiBCN fibers: From chemistry of polycarbosilazanes to the design and characterization of ceramic fibers. J. Ceram. Soc. Jpn. 2016, 124, 967–980. [Google Scholar] [CrossRef] [Green Version]
  22. Flores, O.; Bordia, R.K.; Nestler, D.; Krenkel, W.; Motz, G. Ceramic fibers based on SiC and SiCN systems: Current research, development, and commercial status. Adv. Eng. Mater. 2014, 16, 621–636. [Google Scholar] [CrossRef]
  23. Barroso, G.; Li, Q.; Bordia, R.K.; Motz, G. Polymeric and ceramic silicon-based coatings—A review. J. Mater. Chem. A 2019, 7, 1936–1963. [Google Scholar] [CrossRef]
  24. Vakifahmetoglu, C.; Zeydanli, D.; Colombo, P. Porous polymer derived ceramics. Mater. Sci. Eng. R 2016, 106, 1–30. [Google Scholar] [CrossRef]
  25. Hotza, D.; Nishihora, R.; Machado, R.; Geffroy, P.-M.; Chartier, T.; Bernard, S. Tape casting of preceramic polymers towards advanced ceramics: A review. Int. J. Ceramic Eng. Sci. 2019, 1, 21–41. [Google Scholar] [CrossRef]
  26. Bechelany, M.C.; Proust, V.; Gervais, C.; Ghisleni, R.; Bernard, S.; Miele, P. In-situ controlled growth of titanium nitride in amorphous silicon nitride: A general route toward bulk non-oxide nitride nanocomposites with very high hardness. Adv. Mater. 2014, 26, 6548–6553. [Google Scholar] [CrossRef]
  27. Bechelany, M.C.; Proust, V.; Lale, A.; Miele, P.; Malo, S.; Gervais, C.; Bernard, S. Nanocomposites through chemistry of single-source precursors: Understanding the role of chemistry behind the design of monolith-type nanostructured titanium nitride/silicon nitride. Chem. Eur. J. 2017, 23, 832–845. [Google Scholar] [CrossRef]
  28. Lale, A.; Proust, V.; Bechelany, M.C.; Viard, A.; Malo, S.; Bernard, S. A comprehensive study on the influence of the polyorganosilazane chemistry and material shape on the high temperature behavior of titanium nitride/silicon nitride nanocomposites. J. Eur. Ceram Soc. 2017, 37, 5167–5175. [Google Scholar] [CrossRef]
  29. Yu, Z.; Min, H.; Zhan, J.; Yang, L. Preparation and dielectric properties of polymer-derived SiCTi ceramics. Ceram. Int. 2013, 39, 3999–4007. [Google Scholar] [CrossRef]
  30. Yu, Z.; Yang, L.; Min, H.; Zhang, P.; Zhou, C.; Riedel, R. Single-source-precursor synthesis of high temperature stable SiC/C/Fe nanocomposites from a processable hyperbranched polyferrocenylcarbosilane with high ceramic yield. J. Mater. Chem. C 2014, 2, 1057–1067. [Google Scholar] [CrossRef]
  31. Fonblanc, D.; Lopez-Ferber, D.; Wynn, M.; Lale, A.; Soleilhavoup, A.; Leriche, A.; Iwamoto, Y.; Rossignol, F.; Gervais, C.; Bernard, S. Crosslinking chemistry of poly(vinylmethyl-co-methyl)silazanes toward low-temperature formable preceramic polymers as precursors of functional aluminium-modified Si-C-N ceramics. Dalton Trans. 2018, 47, 14580–14593. [Google Scholar] [CrossRef]
  32. Viard, A.; Fonblanc, D.; Schmidt, M.; Lale, A.; Salameh, C.; Soleilhavoup, A.; Wynn, M.; Champagne, P.; Cerneaux, S.; Babonneau, F.; et al. Molecular chemistry and engineering of boron-modified polyorganosilazanes as new processable and functional SiBCN precursors. Chem. Eur. J. 2017, 23, 9076–9090. [Google Scholar] [CrossRef] [PubMed]
  33. Gibson, V.C.; Spitzmesser, S.K. Advances in non-metallocene olefin polymerization catalysis. Chem. Rev. 2003, 103, 283–316. [Google Scholar] [CrossRef] [PubMed]
  34. Jazzar, R.; Hitce, J.; Renaudat, A.; Sofack-Kreutzer, J.; Baudoin, O. Functionalization of organic molecules by transition-metal-catalyzed C (sp3); H activation. Chem. A Eur. J. 2010, 16, 2654–2672. [Google Scholar] [CrossRef] [PubMed]
  35. Daugulis, O.; Do, H.-Q.; Shabashov, D. Palladium- and copper-catalyzed arylation of carbon-hydrogen bonds. Acc. Chem. Res. 2009, 42, 1074–1086. [Google Scholar] [CrossRef] [PubMed] [Green Version]
  36. Giri, R.; Maugel, N.; Li, J.-J.; Wang, D.-H.; Breazzano, S.P.; Saunders, L.B.; Yu, J.-Q. Palladium-catalyzed methylation and arylation of sp2 and sp3 C-H bonds in simple carboxylic acids. J. Am. Chem. Soc. 2007, 129, 3510–3511. [Google Scholar] [CrossRef]
  37. Schmidt, M.; Durif, C.; Diz Acosta, E.; Salameh, C.; Plaisantin, H.; Miele, P.; Backov, R.; Machado, R.; Gervais, C.; Alauzun, J.G.; et al. Molecular-level processing of Si-(B)-C materials with tailored nano/microstructures. Chem. Eur. J. 2017, 23, 17103–17117. [Google Scholar] [CrossRef]
  38. Majoulet, O.; Alauzun, J.G.; Gottardo, L.; Gervais, C.; Schuster, M.E.; Bernard, S.; Miele, P. Ordered Mesoporous Silicoboron Carbonitride Ceramics from Boron-Modified Polysilazanes: Polymer Synthesis, Processing and Properties. Micro. Meso. Mater. 2011, 140, 40–50. [Google Scholar] [CrossRef]
  39. Berger, F.; Müller, A.; Aldinger, F.; Müller, K. Solid-state NMR investigations on Si-B-C-N ceramics derived from boron-modified poly (allylmethylsilazane). Z. Anorg. Allg. Chem. 2005, 631, 355–363. [Google Scholar] [CrossRef]
  40. Gottardo, L.; Bernard, S.; Gervais, C.; Inzenhofer, K.; Motz, G.; Weinmann, M.; Balan, C.; Miele, P. Chemistry, Structure and Processability of Boron-Modified Polysilazanes as Tailored Precursors of Ceramic Fibers. J. Mater. Chem. 2012, 22, 7739–7750. [Google Scholar] [CrossRef]
  41. Seitz, J.; Bill, J.; Egger, N.; Aldinger, F. Structural investigations of Si/C/N-ceramics from polysilazane precursors by nuclear magnetic resonance. J. Eur. Ceram. Soc. 1996, 16, 885–891. [Google Scholar] [CrossRef]
  42. Choong Kwet Yive, N.S.; Corriu, R.J.P.; Leclercq, D.; Mutin, P.H.; Vioux, A. Silicon carbonitride from polymeric precursors: Thermal cross-linking and pyrolysis of oligosilazane model compounds. Chem. Mater. 1992, 4, 141–146. [Google Scholar] [CrossRef]
  43. Choong Kwet Yive, N.S.; Corriu, R.J.P.; Leclercq, D.; Mutin, P.H.; Vioux, A. Thermogravimetric analysis/mass spectrometry investigation of the thermal conversion of organosilicon precursors into ceramics under argon and ammonia. 2. Poly (silazanes). Chem. Mater. 1992, 4, 1263–1271. [Google Scholar] [CrossRef]
  44. Allan, J.D.; Delia, A.E.; Coe, H.; Bower, K.N.; Alfarra, M.R.; Jimenez, J.L.; Middlebrook, A.M.; Drewnick, F.; Onasch, T.B.; Canagaratna, M.R.; et al. A generalized method for the extraction of chemically resolved mass spectra from aerodyne aerosol mass spectrometer data. J. Aerosol Sci. 2004, 35, 909–922. [Google Scholar] [CrossRef]
  45. Lavedrine, A.; Bahloul, D.; Goursat, P.; Choong Kwet Yive, N.S.; Corriu, R.; Leclerq, D.; Mutin, H.; Vioux, A. Pyrolysis of polyvinylsilazane precursors to silicon carbonitride. J. Eur. Ceram. Soc. 1991, 8, 221–227. [Google Scholar] [CrossRef]
  46. Bahloul, D.; Pereira, M.; Goursat, P.; Choong Kwet Yive, N.S.; Corriu, R.J.P. Preparation of silicon carbonitrides from an organosilicon polymer: I, thermal decomposition of the cross-linked polysilazane. J. Am. Ceram. Soc. 1993, 76, 1156–1162. [Google Scholar] [CrossRef]
  47. Bahloul, D.; Pereira, M.; Goursat, P. Preparation of silicon carbonitrides from an organosilicon polymer: II, thermal behavior at high temperature under argon. J. Am. Ceram. Soc. 1993, 76, 1163–1168. [Google Scholar] [CrossRef]
  48. Guilemany, J.; Alcobe, X.; Sanchiz, I. X-Ray Diffraction Analysis of Titanium Carbonitride 30/70 and 70/30 Solid Solutions. Powder Diffr. 1992, 7, 34–35. [Google Scholar] [CrossRef]
  49. Hering, N.; Schreiber, K.; Riedel, R.; Lichtenberger, O.; Woltersdorf, J. Synthesis of polymeric precursors for the formation of nanocrystalline Ti-C-N/amorphous Si-C-N composites. Appl. Organomet. Chem. 2001, 15, 879–886. [Google Scholar] [CrossRef]
  50. Cordoba, J.M.; Sayagues, M.J.; Alcalà, M.D.; Gotor, F.J. Synthesis of Titanium Carbonitride Phases by Reactive Milling of the Elemental Mixed Powders. J. Am. Ceram. Soc. 2005, 88, 1760–1764. [Google Scholar] [CrossRef]
Figure 1. Schematic diagram of the general process of design of nanocomposites in the Si-Ti-N and Si-Ti-C systems from poly(vinylmethyl-co-methyl)silazane.
Molecules 25 05236 g001
Figure 2. Experimental 13C CP MAS NMR (a), 29Si MAS NMR (b) and 15N CP MAS NMR (c) spectra recorded for the PVMSZTi2.5 sample at 7 T.
Molecules 25 05236 g002
Figure 3. TG curves recorded during decomposition of the PVMSZTi2.5 sample in flowing ammonia, nitrogen and argon.
Molecules 25 05236 g003
Figure 4. FTIR spectra of pyrolysis intermediates isolated in flowing ammonia and derived from PVMSZTi2.5.
Molecules 25 05236 g004
Figure 5. Experimental 29Si MAS NMR (a) and 13C CP MAS NMR (b) spectra recorded for the pyrolysis intermediates derived from PVMSZTi2.5 at 7 T.
Molecules 25 05236 g005
Figure 6. Schematic diagram of the thermo-chemical conversion of titanium-modified poly(vinylmethyl-co-methyl)silazanes into Si-Ti-N ceramics in flowing ammonia.
Molecules 25 05236 g006
Figure 7. FTIR spectra of pyrolysis intermediates isolated in flowing nitrogen and derived from PVMSZTi2.5.
Molecules 25 05236 g007
Figure 8. MS curves recorded during TG experiments of the PVMSZTi2.5 sample in flowing nitrogen: dihydrogen (a), hydrocarbons (b) and amines (c).
Molecules 25 05236 g008
Figure 9. MS curves recorded during TG experiments of the PVMSZTi2.5 sample in flowing argon: dihydrogen (a), hydrocarbons (b) and amines (c).
Molecules 25 05236 g009
Figure 10. Experimental 29Si MAS NMR for the pyrolysis samples isolated at 1000 °C in flowing argon and nitrogen at 7 T.
Molecules 25 05236 g010
Figure 11. Schematic diagram of the thermo-chemical conversion of titanium-modified poly(vinylmethyl-co-methyl)silazanes into Si-Ti-C-N ceramics in flowing nitrogen and argon.
Molecules 25 05236 g011
Figure 12. XRD patterns of P-1000NH, P-1000N and P-1000A (a) and P-1400NH, P-1400N and the P-1400A (b).
Molecules 25 05236 g012
Figure 13. TEM images of P-1400NH (a,d), P-1400N (b,e) and the P-1400A samples (c,f) with inserted selected area electron diffraction patterns in (ac).
Molecules 25 05236 g013
Figure 14. Evolution of the XRD patterns of P-1000NH (a), P-1000N (b) and P-1000A (c) samples in the temperature range 1500–1800 °C.
Molecules 25 05236 g014
Figure 15. TEM micrographs of P-1500NH (a), P-1500N (b) and P-1500A (c) samples with selected area electron diffraction pattern as insets.
Molecules 25 05236 g015
Figure 16. Evolution of the (200) peak position in the X-ray patterns of P-1500A, P-1600A and P-1800A samples.
Molecules 25 05236 g016
Table 1. Structural parameters measured based on XRD pattern of nanocomposite samples.
Samples(200) Peak Position (2θ, °)d200 (nm)Lattice Parameter a (nm)Composition of the TiCxNy from XRD
P-1400NH42.60.2120.4245TiN
P-1400N42.450.2130.4264TiC0.2N0.8
P-1400A42.30.2140.4273TiC0.3N0.7
P-1500NH42.60.2120.4245TiN
P-1500N42.30.2140.4273TiC0.3N0.7
P-1500A42.250.2140.4273TiC0.4N0.6
P-1600NH42.60.2120.4245TiN
P-1600N42.20.2140.4283TiC0.4N0.6
P-1600A42.10.2150.4293TiC0.6N0.4
P-1800NH42.60.2120.4245TiN
P-1800N42.150.2140.4288TiC0.5N0.5
P-1800A41.90.2160.4312TiC0.8N0.2
Sample Availability: Samples of the compounds P1000 to P1800 under argon and nitrogen are available from the authors.
Publisher’s Note: MDPI stays neutral with regard to jurisdictional claims in published maps and institutional affiliations.

