Abstract
(1) Background: Flavonoids are the primary medicinal ingredient of Saussurea involucrate, which have significant antioxidant capacity. Optimizing the extraction of Saussurea involucrate flavonoids (SIFs) and exploring the ability to block melanin deposition caused by reactive oxygen can greatly promote the development of S. involucrate whitening products. (2) Methods: Ultrasonic extraction process was optimized using the Box–Behnken design (BBD) and response surface methodology (RSM). Then, the effect of SIFs on antioxidant activity and anti-deposition of melanin, and genes related to the melanin synthesis are studied. (3) Results: The optimal extraction procedures are as follows: the extraction time, ethanol content, and solvent ratio (v/w) are 64 min, 54%, and 54:1, respectively. The reducing activity and scavenging rates of 2,2-diphenyl-1-picrylhydrazyl (DPPH), superoxide anion, hydroxyl radical, and ABTS+ were promoted as more S. involucrate flavonoid extract was added. The SIFs extract induced a decrease in the melanin synthesis by inhibiting the human melanoma A375 cell tyrosinase activity. SIFs also depress expression of melanin synthesis related genes. (4) Conclusions: the highest SIFs content was obtained by using 54% ethanol and 54:1 solvent ratio (v/w) for 64 min. The extract of SIFs exhibited good ability of antioxidant and anti-deposition of melanin in human melanocytes.
1. Introduction
Saussurea involucrate (Kar. et Kir.) Sch.-Bip. belongs to the Asteraceae family of the genus Saussurea, which is used to treat rheumatoid arthritis and regulate the menstrual cycle [1]. Pharmacologic studies show that many medicinal values of S. involucrate are derived from its flavonoids, and these include anti-neoplastic [2], anti-arthritic [3], anti-oxidative, anti-aging [4,5], and anti-fatigue [6] properties. Flavonoids also play an important role in blocking melanin deposition and skin whitening products. Previously, we found that the extracts of flavonoid from Panax notoginseng stem and leaf had a good inhibitory effect on tyrosinase activity and melanin production in B16 cells [7]. Kudo et al. [8] reported that flavones from Scutellaria baicalensis Georgi could inhibit melanogenesis and intracellular melanosome transport in B16F10 cells. But it is unknown whether the S. involucrate flavonoids (SIFs) possess a whitening function, which could allow SIFs to become a main raw material of whitening products.
Reducing melanin synthesis and pigmentation is the goal of whitening products. Tyrosinase is a major rate-limiting enzyme in melanin formation. Moreover, tyrosinase activity is regulated by free radicals, and thus, the melanin synthesis could be blocked by enhancing antioxidation. In vitro antioxidant study is a method to evaluate antioxidant capacities of plants, which is widely used in many fields, such as food, health products, drugs and cosmetics, etc. [9].
An effective method for the extraction of effective compounds from natural products is through ultrasonic extraction, which can make the extract continue to shock, contribute to the solute diffusion, improve the extraction rate of total flavonoids and the use of raw materials, which is the relatively new method for flavonoids extraction. Compared with the heated extraction method, ultrasonic extraction can reduce extraction time and increase extraction rate [10]. The response surface methodology (RSM) has been widely used for process optimization and the Box–Behnken design (BBD) is one statistical model of the response surface design methods. BBD represents an independent quadratic design that does not contain an embedded factorial or fractional factorial design. Compared with other design methods, BBD is easy to design and to analyze statistically [11]. It can reduce the number of experimental runs, cost, and time. Therefore, it is widely used in the extraction process optimization of flavonoids, and can obtain a better technological condition to extracting total flavonoids from S. involucrate by using a BBD of response surface methodology.
This study, for the first time, optimized the SIFs ultrasonic extraction processing technology and explored if SIFs could inhibit melanin synthesis in human melanoma A375 cells.
2. Results and Discussion
2.1. Optimization of the SIFs Extraction
Three major factors which included time (A), ethanol content (B) and solvent ratio (v/w) (C) were selected (Table 1). The proper ranges of these three factors were selected by single factor experiment on the bases of flavonoids content (Supplementary Figure S1), and the content of flavonoid was defined as the response value Y.

Table 1.
Level and code of independent variable used for response surface analysis.
The designed matrix, experimental values, and predicted values are shown in Table 2. Multiple regression analysis of these experimental results was conducted using Design-Expert Software. The relationship between the response variable and the independent variables was expressed according to the equation:
where Y represented the SIFs content, and A, B, and C represented time, ethanol content, and solvent ratio, respectively.
Y = −33.37 + 0.33A + 0.69B + 0.29C − 0.0021AB + 0.0025AC − 0.0030BC − 0.0027A2 − 0.0037B2 − 0.0024C2
Table 2.
Experimental design and results for response surface analysis. A, B, and C are extraction time, alcohol content, and ratio of liquor to material (v/w), respectively.
2.2. Analyses of the Regression Coefficients and Variances
The ANOVA test (F-test) was used to check the statistical significance of the second-order polynomial Equation (1). The F-test showed that the F value of the second model was as high as 25.8661, and the values of “Prob > F” less than 0.0500 indicate model terms are significant. This shows that the model is very suitable for experimental data. The adjusted R2 (R2Adj) showed that the sample variation of 0.9333 for the SIFs content can be attributed to the independent variable. The quadratic regression model (R2 of 0.9708) showed that the actual results fit well with the predicted results by the model, which is verified in Figure 1A [12]. Therefore, the curves of the experimental and predicted values are linear [13]. A relatively low coefficient of variation (3.5499%) illustrated that further experiments were feasible with good accuracy and reliability [14]. The coefficient estimates of the second-order polynomial equation (7), with the corresponding p-values, are presented in Table 3.
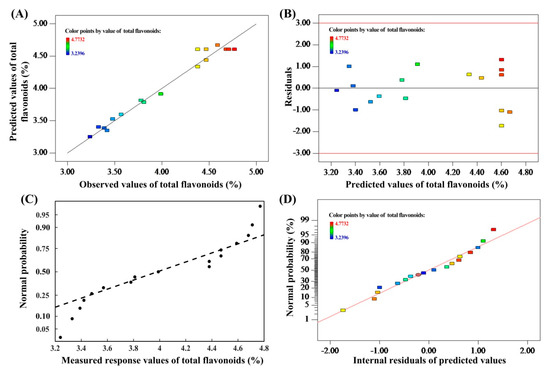
Figure 1.
Plot of predicted vs observed values of the total flavonoids (A); the plot of the residuals versus the predicted response (B); the normal probability for the measured response values (C); Normal probability plots of residuals (D).
Table 3.
The results of analysis on variance (ANOVA) for the effects of variables. A, B, and C are extraction time, alcohol content, and ratio of liquor to material (v/w), respectively.
Furthermore, the internal residuals of the model were randomly distributed (Figure 1B), so the uniformity of the residuals variance were consistent with the optimization requirements [15]. In addition, the fitted curve of the residuals was linear, indicating that the measured response values and internal residuals were normally distributed (Figure 1C,D) [13].
What is most needed is an insignificant lack of fit, because a significant lack of fit shows that the regression response relationship is not considered in the model [16]. In the study, the p-values showed the lack of fit at 0.7866 (more than the 0.05, confidence level is 95%), which meant that the lack of fit in this model was insignificant (Table 3), and the response value in the model fit well with the experimental results (Figure 1). It could be concluded from the above results that the RSM developed in this study predicted SIFs contents satisfactorily.
2.3. Analysis of the RSM
To optimally extract conditions, RSM plots provide a method to visualize the relationship between the response value and factor level. Table 3 and Table 4 inferred that A2, B2, and AC were the strongest variables regarding the operating efficacy of SIFs concentrations with a p-value < 0.0001, 0.0011, and 0.0012, respectively. The coefficient estimates were −0.61, −0.37, and 0.38, respectively. In this model, the p-values and coefficient estimates (as tools) were used to check significance and the efficacy of each coefficient, which, in turn, could indicate the type of interaction between the variables. Thus, the lower the p-value, the higher the absolute value of the coefficient estimate, which made the corresponding coefficient effect more significant [17].
Table 4.
Regression coefficients estimate of the predicted quadratic polynomial model.
A 3D surface graph (Figure 2I–III) of the total flavonoid content and the contour curve (Figure 2IV–VI) of the two test variables were generated from the final model to describe the interaction between the independent variables and the optimal process parameters. Each graph was completed with other factors were kept each time at their respective zero levels. If the contour plot has a circular shape, the interactions between the corresponding factors are negligible. The elliptical shape of the contour plot indicated that the interaction between the variables contributed to the content of total flavonoids at a significant level.
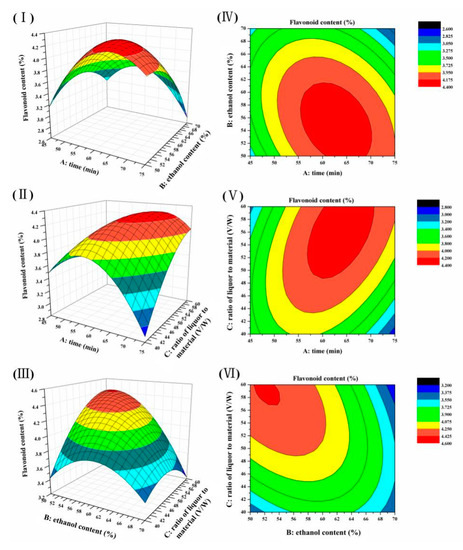
Figure 2.
Response surface plots. (I–III) were showing the effects of extraction time (A), ethanol content (B), and (C) ratio of liquor to material on the content of total flavonoids, respectively. (IV–VI) were their contour plots, respectively.
Based on the data shown in Table 3 and Figure 2, the ranking of the interaction effect in the model between the independent variables from high to low is AC > AB > BC. The effects of A (time) and C (liquid to material ratio) on the SIFs content are shown as a 3D-plot and the associated contour plot. The elliptical shape of the contour plot illustrates a significant (p = 0.0012) correlation between A and C, which contributes to the different SIFs contents. The SIFs contents increase when the time increased from 45 to 64 and the solvent ratio increased from 40:1 to 55:1 (Table 3; Figure 2II,V). What’s more, the SIFs content was greater than 4.67%, when the ethanol content increased from 50% to 56%, and the extraction time increased from 45 and 64 min (Figure 2I,IV). In addition, the interaction between B (ethanol content) and C also has a significant effect on the flavonoids content (p = 0.0041) (Table 3; Figure 2III,VI). In this study, it was most important that the extraction technology was economical and feasible in whole extraction process, and could reduce the cost and time of mass production in future.
2.4. Validation of the Model
The predicted optimum parameters for obtaining a high SIFs content were as follows: an extraction time of 63.93 min, an ethanol content of 54.21%, a solvent ratio (v/w) of 54.32:1, and a maximal response of 4.80% as predicted by the model equation. However, this optimal condition could be modified in actual production as follows: an extraction time of 64 min, and ethanol content of 54%, and a solvent ratio (v/w) of 54:1. Under the optimum conditions, the average SIFs yield was 4.89% ± 0.54% (n = 5), which showed no significant difference from the predicted value. The results showed that the regression model could accurately predict the extraction of SIFs.
Ultrasonic extraction of flavonoids from plants is widely applied of Clerodendrum cyrtophyllum Turcz [18], Sparganii rhizome [19], and Aconitum gymnandrum [20]. Compared with the traditional method of heat extraction, ultrasound promotes the penetration of solvents into plant raw materials, and releases intracellular products by destroying the cell wall [21], thereby increasing extraction efficiency and shortening extraction time.
2.5. SIFs Extract Antioxidant Activities
The reduction ability of SIFs extract was evaluated by measuring the conversion of Fe3+ to Fe2+. Generally, the SIFs extract shows a dose-dependent reducing power at 700 nm [22]. The extract reducing power (Figure 3A) and ascorbic acid concentrations increased with the extract concentrations; however, even though they were all positively correlated, significance was not obtained (multiple R were 0.976 and 0.995, respectively; p > 0.05 respectively). The EC50 values of the extract and ascorbic acid were 0.69 and 0.032 mg/mL, respectively (these concentrations were taken at an OD700 = 0.5).
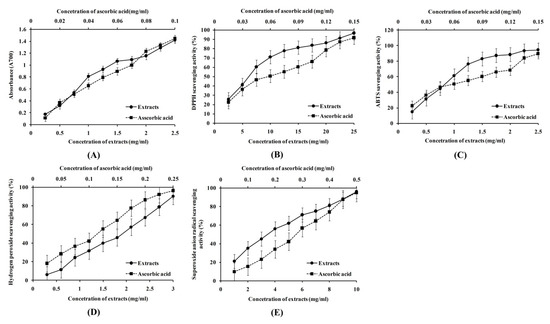
Figure 3.
Antioxidant activities of ascorbic acid and the Saussurea involucrate flavonoids (SIFs) extract. (A–E) were the ferric ion reducing activity, DPPH radical scavenging rate, ABTS+ radical scavenging rate, hydroxyl radical scavenging rate and superoxide anion scavenging rate, respectively.
Moreover, DPPH reducing power, DPPH scavenging activity, the formation of the superoxide radical, hydrogen peroxide, and ABTS+ are the 5 most common antioxidant indices measured, in vitro [9]. In this study, as shown in Table 5 and Figure 3B–E, DPPH, ABTS+, hydrogen peroxide, and superoxide anion radical scavenging activities of SIFs and ascorbic acid were increased significantly with increasing concentrations. There were significant correlations between the scavenging activities and extract concentrations (multiple R were 0.935, 0.945, 0.995, and 0.989, respectively; p < 0.05). There were also significant correlations between the scavenging activities and ascorbic acid measurements (multiple R were 0.990, 0.984, 0.996, 0.997, respectively; p < 0.05). The EC50 of the extracts were 6.13, 0.88, 1.8, and 3.84 mg/mL, respectively, which was higher than the EC50 of ascorbic acid (0.063, 0.065, 0.11, and 0.27 mg/mL), respectively.
Table 5.
EC50 and correlation analysis between antioxidant activities and content of extract and ascorbic acid.
2.6. The Effect of SIFs Extract on A375 Cell Activity
The safety of the SIFs extract is extremely important in the investigation of cell viability, cellular tyrosinase activity and melanin level in A375 cells. The results showed that the cell viability was still about 85% at a 0.12 mg/mL SIFs extract concentration (Figure 4A). Thus, SIFs extract concentrations below 0.12 mg/mL could be adopted for subsequent experiments in the study.
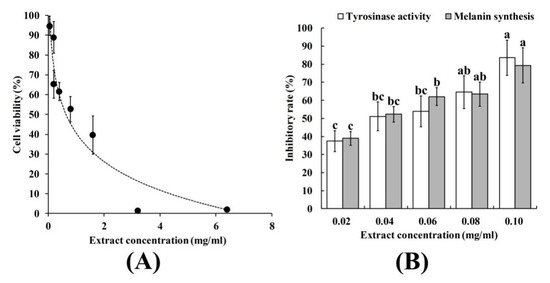
Figure 4.
The effect of SIFs extract on cell activity (A) and inhibition rate of tyrosinase and melanin synthesis in melanoma cells A375 (B). Different small letters mean significant differences at p < 0.05.
Tyrosinase activity and melanin production were significantly reduced by extract in a dose-dependent manner (Figure 4B), and the inhibition ratio was positively correlated with extract concentration (multiple R were 0.979 and 0.962, respectively; the p-values were 0.00586 and 0.0113, respectively), and the IC50 was 0.13 and 0.10 mg/mL, respectively. Tyrosinase is a major rate-limiting enzyme that regulates melanin synthesis. Flavonoids have been shown to have inhibitory effects on melanin synthesis (Liu-Smith and Meyskens 2016). Arung et al. [23] reported that a prenylated flavonoid from the wood of Artocarpus heterophyllus had good activity against melanin synthesis through a reduction in tyrosinase activity. Worrawat et al. [24] isolated flavonoids from Dalbergia parviflora and showed that the flavonoids had inhibitory activity against murine tyrosinases and effectively inhibited melanin formation in B16 melanoma cells without being significantly toxic to the cells. These reports collectively suggest that SIFs extract could have good inhibitory activity against tyrosinase.
2.7. The effect of SIFs Extract on Antioxidant Enzymes Activities in A375 Cells
The antioxidant enzymes, such as catalase (CAT), glutathione peroxidase (GPX), and superoxide dismutase (SOD), are important for cells to maintain redox homeostasis. Cells can resist peroxidation damage by increasing the activity of these antioxidant enzymes. In melanocytes, α-MSH increase peroxide to promote melanin synthesis [25]. Antioxidants, like flavonoids, can regulate melanogenesis in melanocytes by regulating the antioxidant enzymes activities [26]. In the study, the activities of antioxidant enzymes (CAT, GPX, and SOD) in A375 cells were analyzed. The results showed that the activities of SOD, CAT, and GPX were increased in A375 cells when different SIFs extract concentrations were added (Figure 5). Therefore, it was hypothesized that SIFs could increase the activities of antioxidant enzymes (SOD, GPX and CAT) and thus inhibited the oxidative stress of A375 cells.
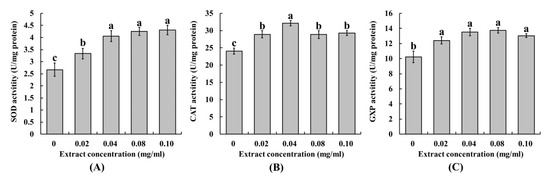
Figure 5.
The effect of SIFs extract on the activities of antioxidant enzymes SOD (A), CAT (B), and GPX (C) in melanoma cells A375. Different small letters mean significant differences at p < 0.05. SOD: superoxide dismutase; GPX: glutathione peroxidase; CAT: catalase.
2.8. The Effect of SIFs Extract on Genes Related to the Melanin Synthesis Signaling Pathway
α-MSH regulates melanin synthesis via a cAMP-dependent signaling pathway. When α-MSH binds to the melanocortin 1 receptor (MC1R), adenylate cyclase (AC) is activated by a G-protein-coupled receptor producing the intracellular second messenger, cyclic adenosine monophosphate (cAMP) [27]. The cAMP activates protein kinase (PKA), which phosphorylates the cAMP-response element binding protein (CREB) and activates gene expression of the microphthalmia-associated transcription factor (MITF) [28], further regulating genes related to melanin synthesis, such as tyrosinase (TYR), tyrosinase-related protein 1 (TYRP1), and tyrosinase-related protein 2 (TYRP2). Eventually, these enzymes promote the synthesis of intracellular melanin [29]. To study the effects of extract on melanin synthesis in A375 cells, we used qRT-PCR to detect genes related to melanin synthesis. Results showed that TYP, TYPR1, TYPR2, and MITF expression were downregulated, but that MC1R expression remained unchanged (Figure 6). Previous research reported that decreased MITF expression could be responsible for melanogenesis downregulation, which included decreases in TYP, TYPR1, and TYPR2 expression [30]. It was shown that SIFs extract could decrease melanin synthesis by inhibiting MITF expression and its associated regulating genes (TYR, TYPR1, and TYPR2) in A375 cells.
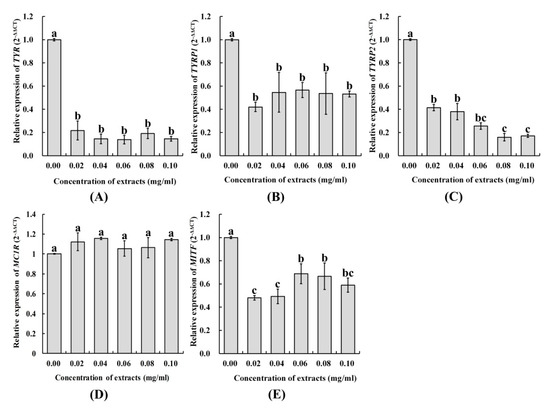
Figure 6.
The effect of SIFs extract on relative expression of TYR (A), TYRP1 (B), TYRP2 (C), MCIR (D), and MITF (E) in melanoma cells A375.
3. Materials and Methods
3.1. Material
S. involucrate was bought from Wholesale market of medicinal materials, Xining, Qinghai Province. S. involucrate herbs were grounded into powder and used for ultrasound extraction experiment after overnight soaking.
3.2. Experimental Design
Single-factor experiments were used to preliminary study the different extraction process parameters, which including factors such as solvent ratio, ethanol content, and extraction time. The one factor was changed with the other factors remaining constant in each single factor experiment. The best processing of ultrasonic extraction of SIFs was determined by Box-Benhnken analysis method. For statistical calculations, the experimental variable xi was coded as Xi, the equation was used as follows:
where Xi, x0 and Δx are the dimensionless coded value of the variable, the value of xi at the center point, and the step change, respectively.
The experimental data were analyzed and processed for Equation (3) using Design Expert software including analysis of variance (ANOVA), which is suitable for experimental design.
where Y is the measured response value which associated with each factor level combination. β0 is an intercept and βi is the regression coefficients computed from the observed experimental values of Y, and Xi is the coded level of independent factor [31]. The Xi, Xj and are the interaction and quadratic terms, respectively.
The coefficient of determination R2, adjusted R2 and adequate precision were employed to evaluate the fit quality of the polynomial model equation. Model terms are chosen or rejected according to the probability of error (p) value with 95% confidence level. The polynomial equation fitted was expressed as 3D surface plots to visualize the relationship between the responses and the experimental level of each factor utilized in the design. The optimum region is also identified based on the main parameters in the overlay plot. The analysis of the data was accomplished by using the general factorial design of response surface methodology (RSM). The experimental conditions and results are displayed in Table 1 and Table 2.
3.3. Determination of Total Flavonoid Content
The determination method of total flavonoid content was referred to the method proposed of Jia et al. [32] with modifications. After added 0.3 mL of NaNO2 (5%, w/v) into 2 mL of samples, the mixture was allowed to stand at room temperature for 6 min. Then, 0.3 mL of Al(NO3)3 (10%, w/v) was added into this mixture and incubated for 10 min at room temperature. Finally, after 2 mL of NaOH (4%, w/v) added into this mixture, its absorbance was determined at 510 nm. The standard curve was prepared using various rutin concentrations as the standard. The SIFs content was calculated with the following equation:
where the m was total flavonoids in the 1 mL measured extracts, V was the total volume of extraction solution and M was the quality of the S. involucrate extracts.
3.4. Determination of Antioxidant Activities In Vitro
3.4.1. Determination of Reducing Power
Ferrous ion reducing power was measured by using the method proposed of Sun et al. [33]. The different concentrations of extract (2.5 mL) were added into 2.5 mL of PBS (0.2 mg/mL, pH 6.6) and potassium ferricyanide (2.5 mL, 1%, w/v), followed by incubation at 50 °C for 20 min and then put into 2.5 mL of trichloroacetic acid (10%, w/v) to end the reaction. Finally, 2.5 mL of the supernatant was added 2.5 mL of deionized water and 0.5 mL of FeCl3 (0.1%, w/v). Then, it was plunged into darkness at 25 °C for 10 min, and the absorbance was determined at 700 nm. The L-ascorbic acid was used to prepare a standard solution for evaluating the reducing power. Each experiment was replicated for 3 times in the study.
3.4.2. Determination of DPPH Scavenging Activity
DPPH scavenging ability was measured by using the method proposed of Qu et al. [34] with modifications. Different content of extract (1 mL) was added into 1 mL of 0.002 mg/mL DPPH (1.0 × 10⁻⁴ M in 50% ethanol). This mixture was measured at 517 nm after it incubated at room temperature in the dark for 30 min. The ascorbic acid was used as a positive control. Each experiment was replicated for 3 times in the study. The percentage of DPPH scavenging was calculated as the following equation:
where An is the absorbance of sample, and A0 is the absorbance of blank control solution without sample.
3.4.3. Determination of ABTS+ Scavenging Activity
ABTS+ scavenging activity of SIFs extract was measured by using the method of Wang et al. [35] with slight modification. The 0.007 mg/mL ABTS+ was dissolved into 0.00245 mg/mL potassium persulphate solution. Then this mixture was incubated at 25 °C for 12 h in the dark. After diluted it with 75% of ethanol to adjust its absorbance to 0.70 ± 0.02 at 734 nm. The 0.1 mL of different content of extract was put into 3.9 mL of ABTS+ solution. After incubating at room temperature for 10 min, the absorbance of this solution was measured at 734 nm. Each experiment was replicated for 3 times in the study. The calculation equation is consistent with the equation of DPPH scavenging activity.
3.4.4. Determination of Hydroxyl Radical Scavenging Activity
The radical scavenging capability was measured by using the method of Mao et al. [36] with slight modification. Before added 2 mL of 0.006 mg/mL H2O2 into the mixture to start the reaction, the 2 mL of 0.006 mg/mL FeSO4 was added to 2 mL different concentrations of extract, and incubated this mixture at 37 °C for 30 min. Then 2 mL of 0.006 mg/mL salicylic acid was added into it, mixed, and incubated at 37 °C for 10 min. The absorbance was measured at 510 nm. Ascorbic acid was used as the reference compound for measuring the hydroxyl radical scavenging activity. Each experiment was replicated for 3 times in the study. The percentage of hydroxyl radical scavenging was calculated by the following equation:
where A1 and A2 are the absorbance of a sample (with and without hydrogen peroxide, respectively), and A0 was the absorbance of distilled water.
3.4.5. Determination of Superoxide Anion Scavenging Activity
The superoxide anion radical scavenging activity was measured using phenazine methyl sulfate (PMS), reduced coenzyme I (NADH), and nitro-blue tetrazolium (NBT) [37,38]. The 20 μL of NADH (2 mM) was added into the 180 μL of mixture which included 10 μL different content of extract, 20 μL NBT (1 mM), 20 μL PMS (0.1 mM), 40 μL potassium phosphate buffer (250 mM, pH 7.4) and 90 μL water. After this mixture was incubated for 20 min at room temperature, the discoloration was measured at 570 nm. Ascorbic acid was used as the reference compound. Each experiment was replicated for 3 times in the study, and the calculation equation of superoxide anion scavenging activity is consistent with the equation of DPPH scavenging activity.
3.5. Cell Experiment
3.5.1. Cell Culture
Human melanoma A375 cells were bought from Kunming Institute of Kunming Institute of Zoology, Chinese Academy of Sciences (Kunming, China). The cells were cultured in DMEM which included 10% fetal bovine serum, and 1% of penicillin and streptomycin at 37 °C in a humidified atmosphere with 5% CO2.
Cell viability was detected by the colorimetric MTT method [39]. Cells were plated in 6-well plates (105/well). Twenty-four hours after plating, extract (0–0.08 mg/mL) were added and cultures were incubated for an additional 24 h, each well was treated with 0.5 mg/mL MTT solution for 3 h at 37 °C. The resulting violet formazan precipitates were dissolved in DMSO and the absorbance of each well was detected at 590 nm using a microplate reader with a 630 nm reference.
3.5.2. α-MSH Treatment
Human melanoma A375 cells were cultured for 24 h at a density of 105 cells/mL in 6-well plates which contained 10% fetal bovine serum and 1% penicillin/streptomycin at 37 °C in a humidified atmosphere with 5% CO2. Then the medium was replaced by fresh one which included 100 nM α-MSH. These α-MSH-stimulated cells were used to all experiments treatment in next sections.
3.5.3. Intracellular Tyrosinase Activity
After the α-MSH-stimulated cells (6-well, 105 cells/well) incubated with different content of extract for 24 h, each well was washed and lysed with PBS (50 mM, pH 6.8) which contained 0.1 mM phenylmethyl-sulfonyl fluoride and 1% Triton X-100. The cells were disrupted by freezing and thawing, and lysates were clarified by centrifugation at 12,000 rpm for 30 min at 4 °C, the protein content of supernatant was determined by the Bradford method using BSA as standard. The supernatant was incubated in 1.25 mM L-DOPA and 25 mM PBS (pH 6.8) for for 1 h at 37 °C. The absorbance was measured at 475 nm [40]. The inhibition rate of tyrosinase activity was calculated by the following equation:
where A0 is the absorbance control (without both test sample and α-MSH (L-DOPA alone)), A1 is the absorbance of reaction mixture containing test sample and α-MSH; A2 is the absorbance in the presence of the negative control (with α-MSH and without test sample).
3.5.4. Melanin Content
The α-MSH-stimulated cells (6-well, 105 cells/well) were incubated with different content of extract for 24 h. After being washed with PBS, a small number of cells were used to determine the protein content, and the rest of the cells were lysed with 1 mol NaOH and treated at 100 °C for 1 h. The cell lysates were clarified by centrifugation for 10 min at 10,000× g. Melanin contents were determined by the absorbance measured at 405 nm [40]. The inhibition rate of melanin synthesis activity was estimated as a percentage of the control culture.
3.5.5. Determination of Gene Expression by qRT-PCR
The α-MSH-stimulated cells (2.5 × 10⁵ cells/well) were incubated with different content of extract for 24 h. Total RNA of cells in each well was extracted by Trizol (RNAiso Plus, Takara Biomedical Technology, Beijing, China). For the reverse transcription, 2 μg of total RNA was mixed with 1 μL of Oligo (dT)18 primer (Thermo Fisher Scientific, Waltham, MA, USA), 200 U of Revert Aid M-MuL Virus RT (Thermo) included 20 U of RiboLock RNase inhibitor (Thermo). After reverse transcription, 20 ng of cDNA was used to qPCR to amplify all genes in triplicate in a total reaction volume of 20 μL using GOTaq® qPCR Master Mix (Promega, Madison, WI, USA), and the required amount of forward and reverse primers. Reactions were conducted on an LightCycler® 96 (Roche Life Science, Penzberg, Germany) using the following cycling conditions: pre-incubation at 95 °C for 10 min, 3-step amplification at 95 °C for 10 sec, 60 °C for 30 sec, and 72 °C for 1 min. Expression of β-actin was used as an internal control for target gene expression. The genes and their sequences in melanin synthesis signaling pathway were from KEGG PATHWAY (map04916) and NCBI GenBank. Primers were designed by primer 5.0 software (Table 6). All primers were synthesized by Beijing Genomics Institute. The gene expression was calculated based on the 2−ΔΔCt method [41].
Table 6.
The primer sequences of genes in qRT-PCR.
3.5.6. Detection of Superoxide Dismutase (SOD), Catalase (CAT) and Glutathione Peroxidase (GXP) Activities
The α-MSH-stimulated A375 cells (2.5 × 10⁵ cells/well) were incubated with different concentrations of the SIFs extract for 24 h, after which time the total protein was quantified using the BCA method; all results were fixed by the protein concentration [42,43].
To detect SOD activity, 100 μL of a 5 mg/mL NBT solution was placed into each well and cultured for 3 h. Then, 200 μL of dimethyl sulfoxide (DMSO) and 200 µL of 2 M NaOH were added dissolved in formazan blue. Absorbance was measured at 550 nm using a microplate reader. One unit of SOD activity was defined as the amount of enzyme that inhibited the formazan blue production rate per one hour [44].
For CAT activity, the cells were lysed into 200 μL of 1% Triton-X at 4 °C for 10 min. After centrifugation at 10,000 rpm for 10 min at 4 °C, the supernatant was collected in new tubes and mixed with 40 μL of 1 μM of H2O2. The absorbance was measured at 240 nm using a microplate reader. One unit of CAT activity was defined as the amount of enzyme that decomposed in 1 μM H2O2 per minute [45].
GPX activity was detected using the Sigma-Aldrich GPX Cellular Activity Assay Kit (Sigma-Aldrich, St. Louis, MO, USA) following the manufacturer’s instructions. One unit of GPX activity was defined as the amount of enzyme that oxidized 1 nM NADPH per minute, as measured by absorbance at 340 nm [46].
4. Conclusions
The optimum conditions for the ultrasonic extraction of SIFs were: extraction time of 64 min, an ethanol content of 54%, and a solvent ratio (v/w) of 54:1. The experimental value (4.89 ± 0.54%) was in agreement with the predicted value (4.80%). The extract of SIFs inhibited the oxidative stress and lipid peroxidation of A375 melanoma cells by increasing CAT, SOD, and GPX activities. In addition, SIFs extract could anti-deposition of melanin in human melanocytes by down-regulating genes (TYP, TYPR1, and TYPR2).
Supplementary Materials
The following are available online at https://www.mdpi.com/1420-3049/25/2/313/s1.
Author Contributions
Y.Q. and L.-S.Q. conceived and designed the experiments; C.-Y.D., M.-Z.Z., and P.-R.L. performed the experiments and analyzed the data; C.-Y.D., P.-R.L., and Y.D. drafted and revised the manuscript. During the revision of the manuscript, C.G. also gave a lot of valuable opinions and participated in the revision of the manuscript. All authors have read and agreed to the published version of the manuscript.
Funding
This research was funded by the Ministry of Science and Technology of Yunnan Province, China (No. 2017ZF004).
Conflicts of Interest
The authors declare no conflicts of interest in this work.
Abbreviations
ABTS—2,2-azino-bis-3-ethylbenzthiazoline-6-sulphonic acid; BBD—Box-Behnken design; DPPH—2, 2-diphenyl-1-picrylhydrazyl; RSM—Response surface methodology; SIFs—Saussurea involucrate flavonoids; CAT—Catalase; GPX—Glutathione peroxidase; SOD—Superoxide Dismutase
References
- Chik, W.I.; Zhu, L.; Fan, L.L.; Yi, T.; Zhu, G.Y.; Gou, X.J.; Tang, Y.N.; Xu, J.; Yeung, W.P.; Zhao, Z.Z.; et al. Saussurea involucrata: A review of the botany, phytochemistry and ethnopharmacology of a rare traditional herbal medicine. J. Ethnopharmacol. 2015, 172, 44–60. [Google Scholar] [CrossRef]
- Byambaragchaa, M.; Dela Cruz, J.F.; Yang, S.H.; Hwang, S.G. Anti-metastatic potential of ethanol extract of Saussurea involucrata against hepatic cancer in vitro. Asian Pac. J. Cancer Prev. 2013, 14, 5397–5402. [Google Scholar] [CrossRef] [PubMed][Green Version]
- Yi, T.; Zhao, Z.Z.; Yu, Z.L.; Chen, H.B. Comparison of the anti-inflammatory and anti-nociceptive effects of three medicinal plants known as “Snow Lotus” herb in traditional Uighur and Tibetan medicines. J. Ethnopharmacol. 2010, 128, 405–411. [Google Scholar] [CrossRef] [PubMed]
- Qiu, J.; Xue, X.F.; Chen, F.D.; Li, C.H.; Bolat, N.; Wang, X.J.; Baima, Y.Z.; Zhao, Q.; Zhao, D.X.; Ma, F.S. Quality evaluation of snow lotus (Saussurea): Quantitative chemical analysis and antioxidant activity assessment. Plant Cell Rep. 2010, 29, 1325–1337. [Google Scholar] [CrossRef] [PubMed]
- Qiu, J.; Gao, F.H.; Shen, G.A.; Li, C.H.; Han, X.Y.; Zhao, Q.; Zhao, D.X.; Hua, X.J.; Pang, Y.Z. Metabolic engineering of the phenylpropanoid pathway enhances the antioxidant capacity of Saussurea involucrata. PLoS ONE 2013, 8, e70665. [Google Scholar] [CrossRef]
- Jia, J.M.; Wu, C.F. Antifatigue activity of tissue culture extracts of Saussurea involucrata. Pharm. Biol. 2008, 46, 433–436. [Google Scholar] [CrossRef]
- Dai, C.Y.; Liu, P.F.; Liao, P.R.; Qu, Y.; Wang, C.X.; Yang, Y.; Cui, X.M. Optimization of flavonoids extraction process in Panax notoginseng stem leaf and a study of antioxidant activity and its effects on mouse melanoma B16 Cells. Molecules 2018, 23, 2219. [Google Scholar] [CrossRef]
- Kudo, M.; Kobayashi-Nakamura, K.; Tsuji-Naito, K. Bifunctional effects of O-methylated flavones from Scutellaria baicalensis Georgi on melanocytes: Inhibition of melanin production and intracellular melanosome transport. PLoS ONE 2017, 12, e0171513. [Google Scholar] [CrossRef]
- Tsoi, B.; Yi, R.N.; Cao, L.F.; Li, S.B.; Tan, R.R.; Chen, M.; Li, X.X.; Wang, C.; Li, Y.F.; Hiroshi, K.; et al. Comparing antioxidant capacity of purine alkaloids: A new, efficient trio for screening and discovering potential antioxidants in vitro and in vivo. Food Chem. 2015, 176, 411–419. [Google Scholar] [CrossRef]
- Liu, C.H.; Qin, K.; Qi, Y.X.; Li, K.; Li, Y.Q.; Jia, B.X. Optimization of ultrasonic extraction of total flavonoids from Tussilago farfara L. using response surface methodology. Pharmazie 2014, 69, 311–315. [Google Scholar]
- Fan, T.; Hu, J.G.; Fu, L.D.; Zhang, L.J. Optimization of enzymolysis-ultrasonic assisted extraction of polysaccharides from Momordica charabtia L. by response surface methodology. Carbohydr. Polym. 2015, 115, 701–706. [Google Scholar] [CrossRef] [PubMed]
- Qiao, D.L.; Hu, B.; Gan, D.; Sun, Y.; Ye, H.; Zeng, X.X. Extraction optimized by using response surface methodology, purification and preliminary characterization of polysaccharides from Hyriopsis cumingii. Carbohydrate Polym. 2009, 76, 422–429. [Google Scholar] [CrossRef]
- Preece, D.; Montgomery, D. Design and Analysis of Experiments; Wiley: New York, NY, USA, 2008. [Google Scholar]
- Lee, H.V.; Yunus, R.; Juan, J.C.; Taufiq-Yap, Y.H. Process optimization design for jatropha-based biodiesel production using response surface methodology. Fuel Process Technol. 2011, 92, 2420–2428. [Google Scholar] [CrossRef]
- Draper, N.R.; Smith, H. Applied Regression Analysis; Wiley: New York, NY, USA, 1966; pp. 325–328. [Google Scholar]
- Noordin, M.Y.; Venkatesh, V.C.; Sharif, S.; Elting, S.; Abdullah, A. Application of response surface methodology in describing the performance of coated carbide tools when turning AISI 1045 steel. J. Mater. Process Technol. 2004, 145, 46–58. [Google Scholar] [CrossRef]
- Nguyen, H.X.; Nguyen, T.B.N.; Bae, W.; Dang, T.Q.C.; Chung, T. An approach for the prediction of optimum conditions for thesteam assisted gravity drainage process by response surface methodology. Energy Source Part-A 2014, 36, 1103–1114. [Google Scholar] [CrossRef]
- Jing, Z.; Zheng, X.X.; Yang, Q.; Liang, Z.Y.; Li, D.H.; Yang, X.B.; Xu, J. Optimization of ultrasonic-assisted extraction and radical-scavenging capacity of phenols and flavonoids from Clerodendrum cyrtophyllum Turcz leaves. PLoS ONE 2013, 8, e68392. [Google Scholar]
- Wang, X.; Wu, Q.; Wu, Y.; Chen, G.; Yue, W.; Liang, Q. Response surface optimized ultrasonic-assisted extraction of flavonoids from Sparganii rhizoma and evaluation of their in vitro antioxidant activities. Molecules 2012, 17, 6769–6783. [Google Scholar] [CrossRef]
- Gao, F.; Zheng, L.L.; Wang, D.; Li, Y.Y.; Peng, H.Y.; Yuan, M.Y. Ultrasound-assisted extraction of total flavonoids from aconitum gymnandrum. Pharmacognosy Mag. 2014, 10, 141–146. [Google Scholar] [CrossRef]
- Lee, M.H.; Lin, C.C. Comparison of techniques for extraction of isoflavones from the root of Radix Puerariae: Ultrasonic and pressurized solvent extractions. Food Chem. 2007, 105, 223–228. [Google Scholar] [CrossRef]
- Gulcin, I. Comparison of in vitro antioxidant and antiradical activities of L-tyrosine and L-Dopa. Amino Acids 2007, 32, 431–438. [Google Scholar] [CrossRef]
- Arung, E.T.; Shimizu, K.; Tanaka, H.; Kondo, R. 3-Prenyl luteolin, a new prenylated flavone with melanin biosynthesis inhibitory activity from wood of Artocarpus heterophyllus. Fitoterapia 2010, 81, 640–643. [Google Scholar] [CrossRef] [PubMed]
- Promden, W.; Viriyabancha, W.; Monthakantirat, O.; Umehara, K.; Noguchi, H.; de-Eknamkul, W. Correlation between the potency of flavonoids on mushroom tyrosinase inhibitory activity and melanin synthesis in melanocytes. Molecules 2018, 23, 1403. [Google Scholar] [CrossRef] [PubMed]
- Panich, U.; Onkoksoong, T.; Limsaengurai, S.; Akarasereenont, P.; Wongkajornsilp, A. UVA-induced melanogenesis and modulation of glutathione redox system in different melanoma cell lines: The protective effect of gallic acid. J. Photochem. Photobiol.-B 2012, 108, 16–22. [Google Scholar] [CrossRef] [PubMed]
- Wrzesniok, D.; Beberok, A.; Otreba, M.; Buszman, E. Modulation of melanogenesis and antioxidant defense system in melanocytes by amikacin. Toxicol. In Vitro 2013, 27, 1102–1108. [Google Scholar] [CrossRef]
- Busca, R.; Ballotti, R. Cyclic AMP a key messenger in the regulation of skin pigmentation. Pigment. Cell Res. 2000, 13, 60–69. [Google Scholar] [CrossRef]
- Goding, C.R. Mitf from neural crest to melanoma: Signal transduction and transcription in the melanocyte lineage. Genes Dev. 2000, 14, 1712–1728. [Google Scholar]
- Vance, K.W.; Goding, C.R. The transcription network regulating melanocyte development and melanoma. Pigment. Cell Res. 2004, 17, 318–325. [Google Scholar] [CrossRef]
- Chou, T.H.; Ding, H.Y.; Hung, W.J.; Liang, C.H. Antioxidative characteristics and inhibition of alpha-melanocyte-stimulating hormone-stimulated melanogenesis of vanillin and vanillic acid from Origanum vulgare. Exp. Dermatol. 2010, 19, 742–750. [Google Scholar] [CrossRef]
- Ren, X.Y.; He, L.; Cheng, J.W.; Chang, J.M. Optimization of the solid-state fermentation and properties of a polysaccharide from Paecilomyces cicadae (Miquel) Samson and its antioxidant activities in vitro. PLoS ONE 2014, 9, e87578. [Google Scholar] [CrossRef]
- Jia, Z.S.; Tang, M.C.; Wu, J.M. The determination of flavonoid content in mulberry and their scavenging effects on superoxide radicals. Food Chem. 1999, 64, 555–559. [Google Scholar]
- Sun, Y.X.; Liu, J.C.; Kennedy, J.F. Extraction optimization of antioxidant polysaccharides from the fruiting bodies of Chroogomphis rutilus (Schaeff.: Fr.) O.K. Miller by Box-Behnken statistical design. Carbohydrate Polym. 2010, 82, 209–214. [Google Scholar] [CrossRef]
- Qu, Y.; Li, C.X.; Zhang, C.; Zeng, R.; Fu, C.M. Optimization of infrared-assisted extraction of Bletilla striata polysaccharides based on response surface methodology and their antioxidant activities. Carbohydr. Polym. 2016, 148, 345–353. [Google Scholar] [CrossRef]
- Wang, J.L.; Yang, W.; Tang, Y.Y.; Xu, Q.; Huang, S.L.; Yao, J.; Zhang, J.; Lei, Z.Q. Regioselective sulfation of Artemisia sphaerocephala polysaccharide: Solution conformation and antioxidant activities in vitro. Carbohydr. Polym. 2016, 136, 527–536. [Google Scholar] [CrossRef]
- Mao, G.H.; Zou, Y.; Feng, W.W.; Wang, W.; Zhao, T.; Ye, C.W.; Zhu, Y.; Wu, X.S.; Yang, L.Q.; Wu, X.Y. Extraction, preliminary characterization and antioxidant activity of Se-enriched maitake polysaccharide. Carbohydr. Polym. 2014, 101, 213–219. [Google Scholar] [CrossRef]
- Gulcin, I. Antioxidant activity of caffeic acid (3,4-dihydroxycinnamic acid). Toxicology 2006, 217, 213–220. [Google Scholar] [CrossRef] [PubMed]
- Wang, B.S.; Yu, H.M.; Chang, L.W.; Yen, W.J.; Duh, P.D. Protective effects of pu-erh tea on LDL oxidation and nitric oxide generation in macrophage cells. Food Sci. Technol. 2008, 41, 1122–1132. [Google Scholar] [CrossRef]
- Mosmann, T. Rapid colorimetric assay for cellular growth and survival: Application to proliferation and cytotoxicity assays. J. Immunol. Methods 1983, 65, 55–63. [Google Scholar] [CrossRef]
- Pintus, F.; Spano, D.; Corona, A.; Medda, R. Antityrosinase activity of Euphorbia characias extracts. Peer J. 2015, 3, e1305. [Google Scholar] [CrossRef]
- Livak, K.J.; Schmittgen, T.D. Analysis of relative gene expression data using real-time quantitative PCR and the 2(-Delta Delta C(T)) Method. Methods 2001, 25, 402–408. [Google Scholar] [CrossRef]
- Roe, J.H. The determination of sugar in blood and spinal fluid with anthrone reagent. J. Biol. Chem. 1955, 212, 335–343. [Google Scholar]
- Bradford, M.M. A rapid and sensitive method for the quantitation of microgram quantities of protein utilizing the principle of protein-dye binding. Anal. Biochem. 1976, 72, 248–254. [Google Scholar] [CrossRef]
- Jambunathan, N. Determination and detection of reactive oxygen species (ROS), lipid peroxidation, and electrolyte leakage in plants. Methods Mol. Biol. 2010, 639, 292–298. [Google Scholar] [PubMed]
- Correa, M.; Sanchis-Segura, C.; Aragon, C.M.G. Brain catalase activity is highly correlated with ethanol-induced locomotor activity in mice. Physiol. Behav. 2001, 73, 641–647. [Google Scholar] [CrossRef]
- Qasem, A.; Abdel-Aty, A.; Abu-Suwa, H.; Naser, S.A. Oxidative stress due to Mycobacterium avium subspecies paratuberculosis (MAP) infection upregulates selenium-dependent GPx activity. Gut Pathog. 2016, 8, 12. [Google Scholar] [CrossRef]
Sample Availability: Samples of the extracts are available from the authors. |


© 2020 by the authors. Licensee MDPI, Basel, Switzerland. This article is an open access article distributed under the terms and conditions of the Creative Commons Attribution (CC BY) license (http://creativecommons.org/licenses/by/4.0/).