
A Preliminary Study on Metabolome Profiles of Buffalo Milk and Corresponding Mozzarella Cheese: Safeguarding the Authenticity and Traceability of Protected Status Buffalo Dairy Products

 , ,
, ,  ,
,  ,
, 
Abstract
1. Introduction
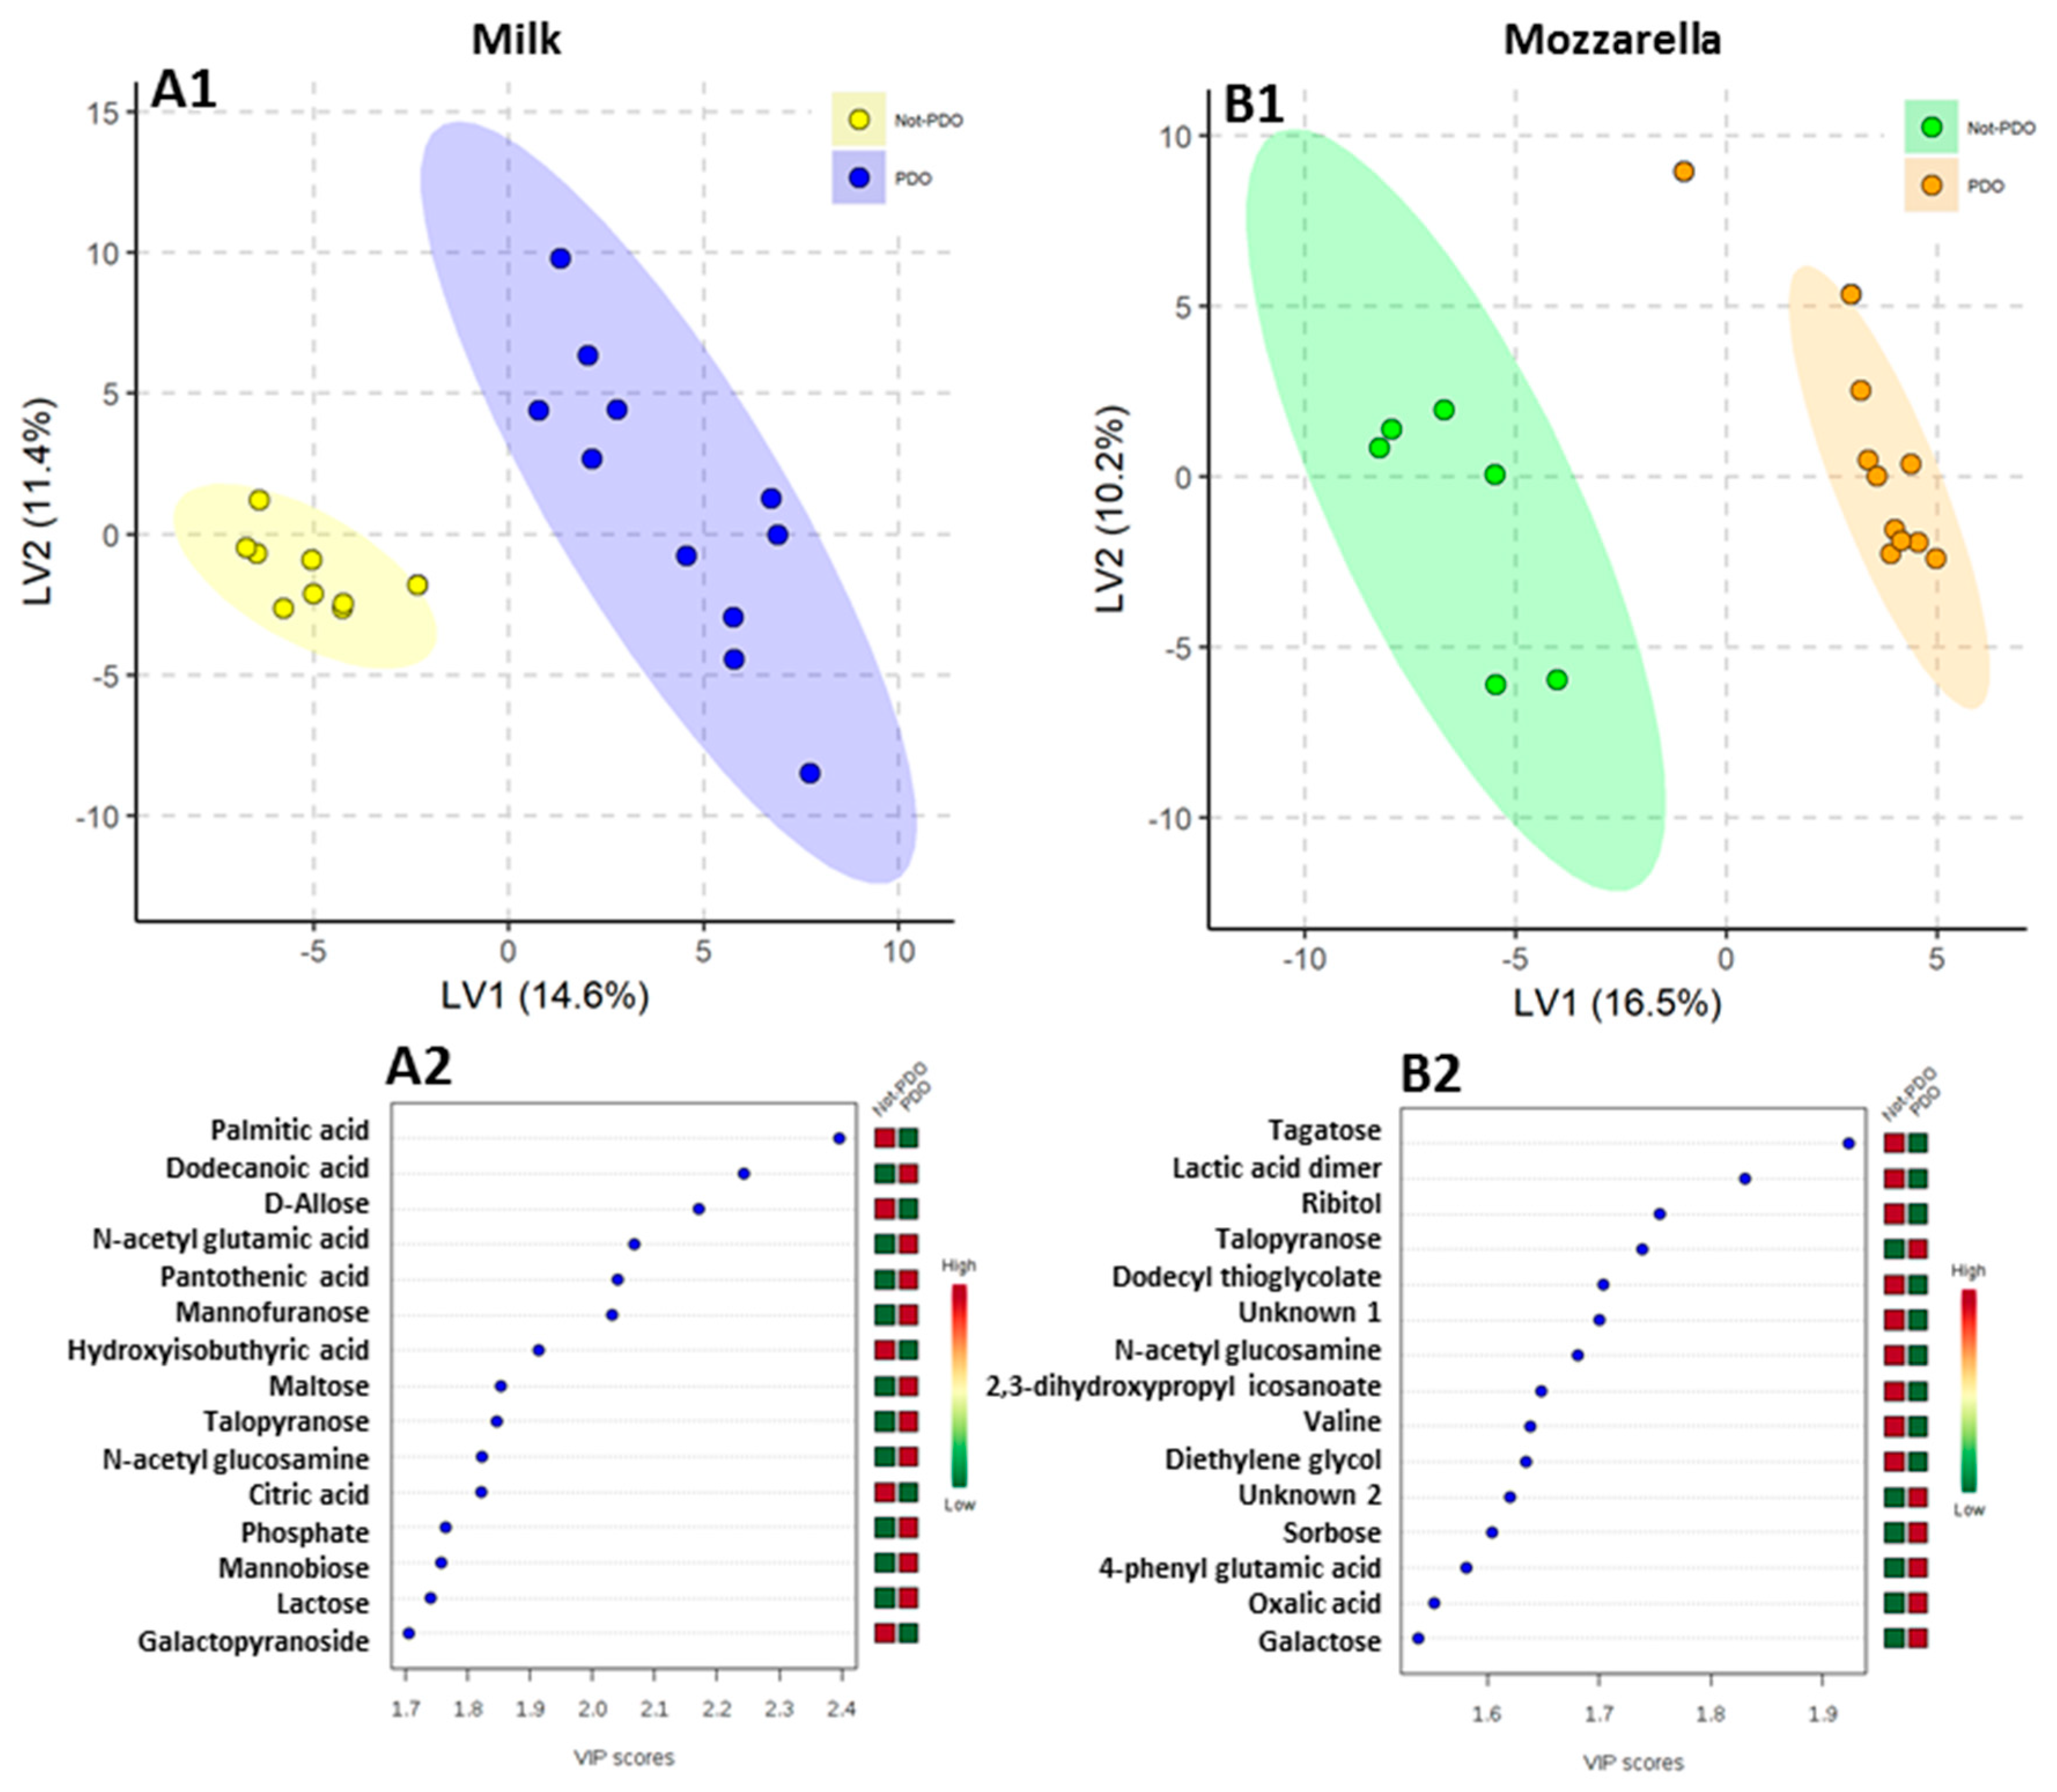
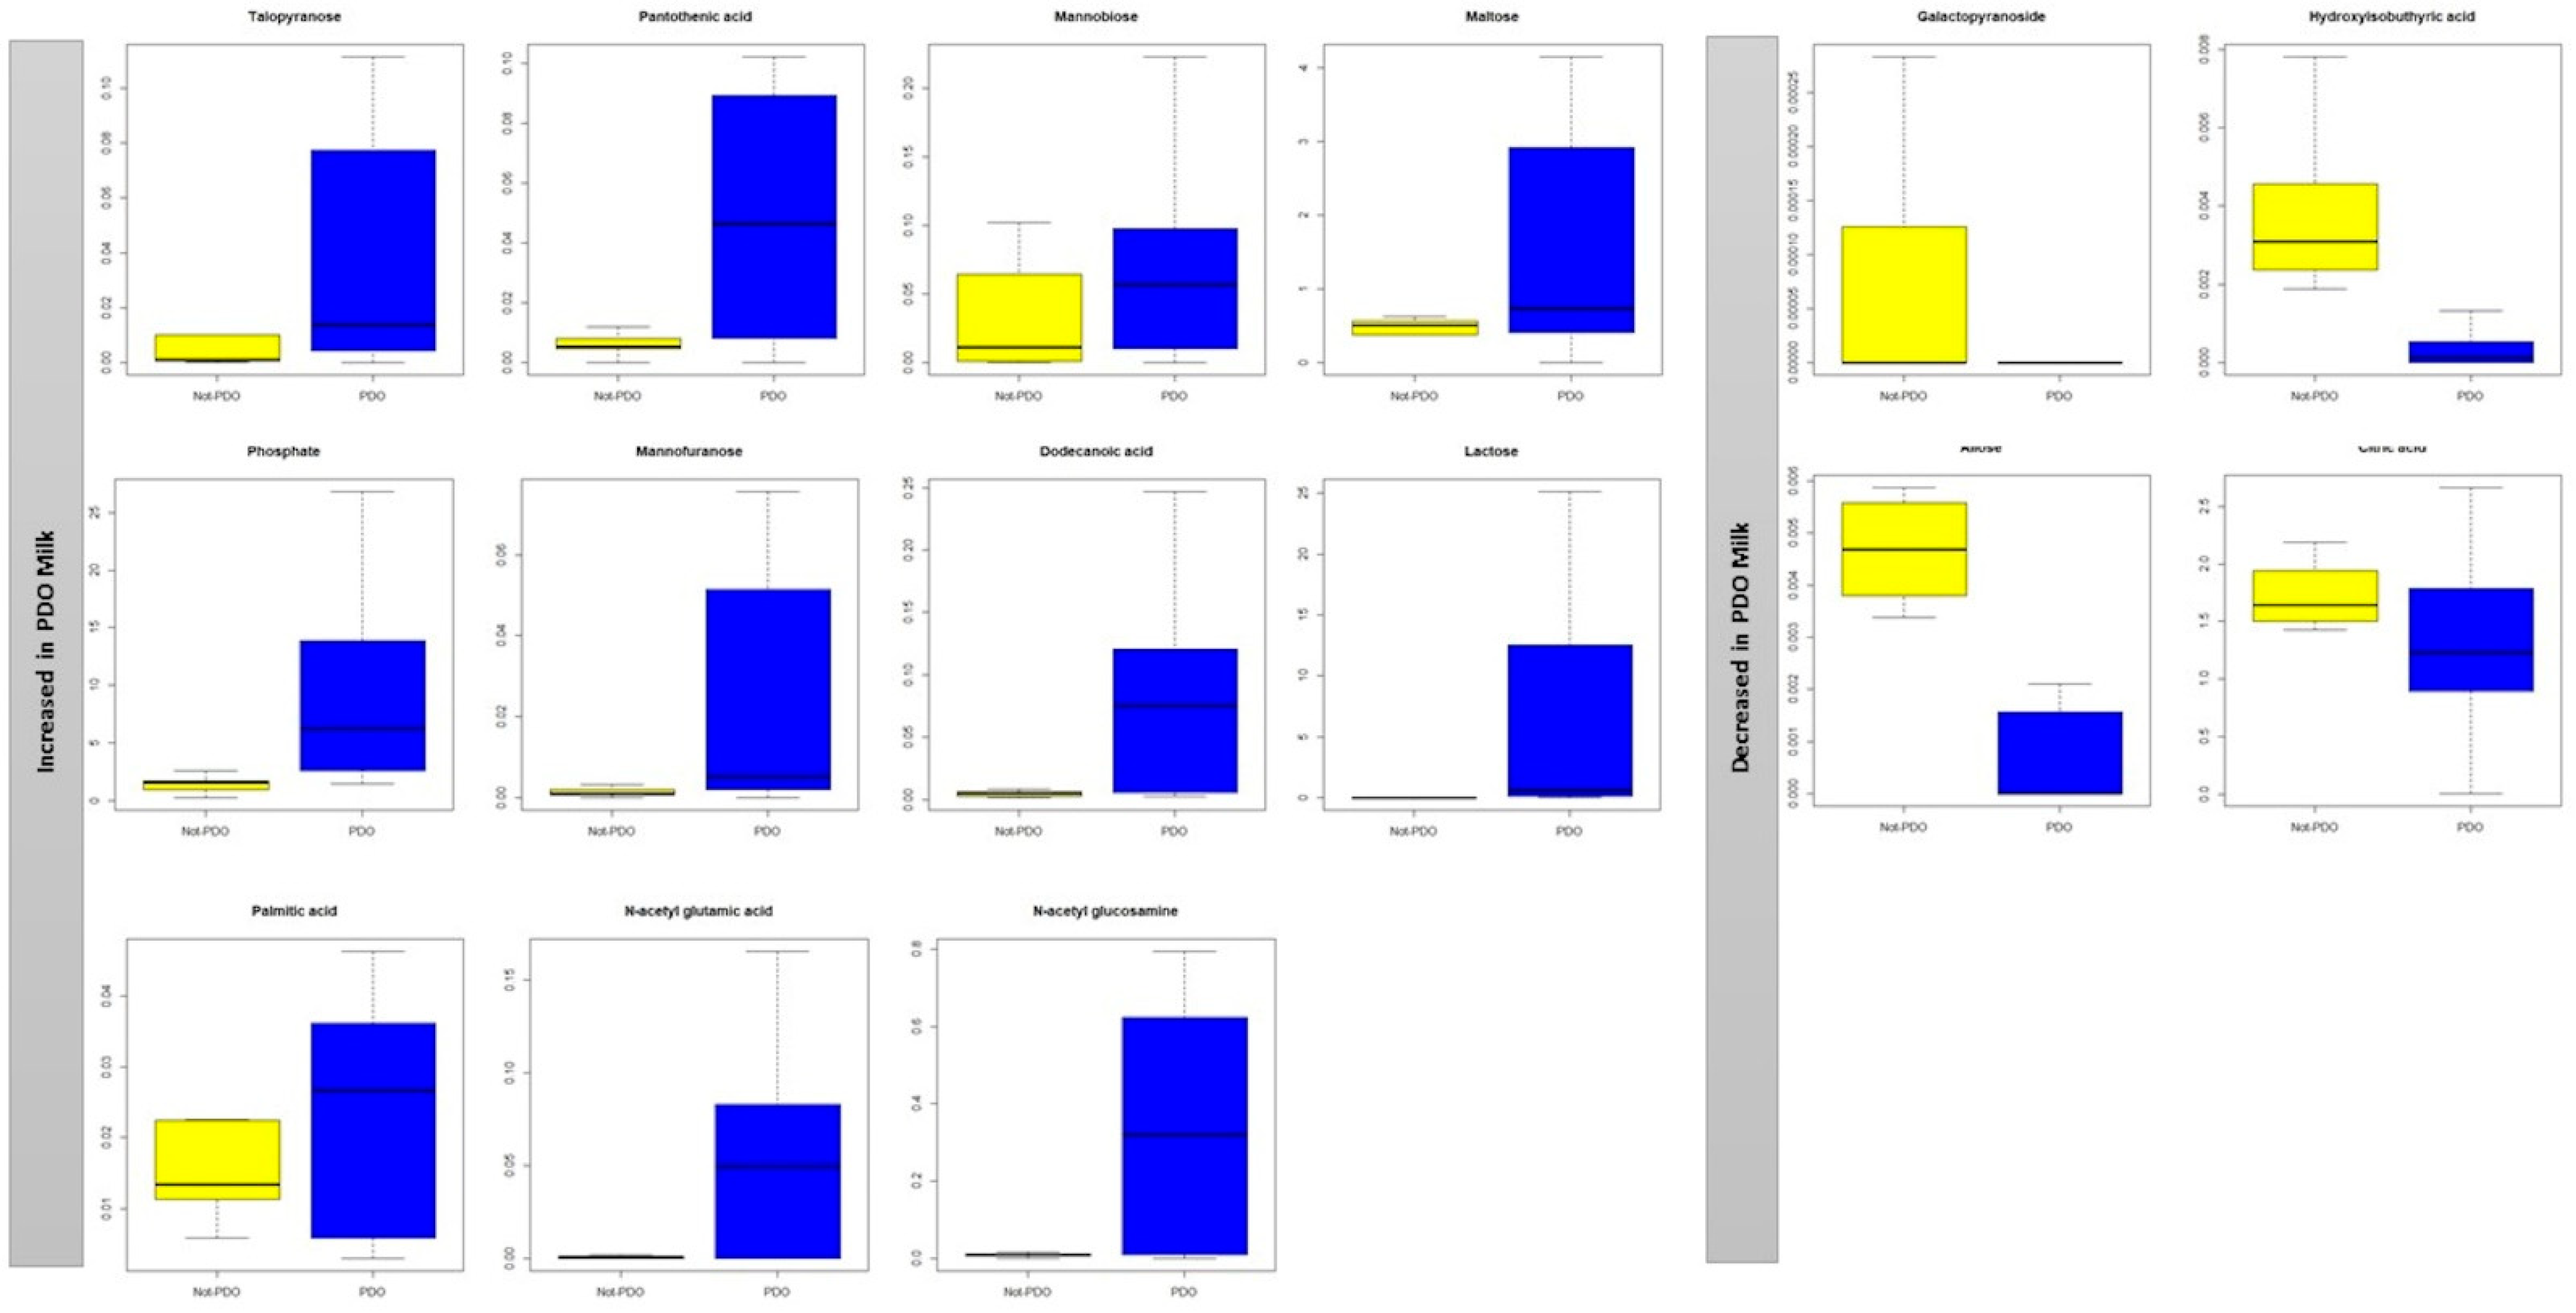
2. Results
3. Discussion
4. Materials and Methods
4.1. Sample Collection
4.2. Metabolomics Analysis
4.2.1. Metabolite Extraction and Derivatization
4.2.2. GC-MS Analysis
4.3. Metabolites Identification
4.4. Statistical Analyses
Author Contributions
Funding
Conflicts of Interest
References
- Cubero-Leon, E.; Peñalver, R.; Maquet, A. Review on metabolomics for food authentication. Food Res. Int. 2014, 60, 95–107. [Google Scholar] [CrossRef]
- Danezis, G.P.; Tsagkaris, A.S.; Brusic, V.; Georgiou, C.A. Food authentication: State of the art and prospects. Curr. Opin. Food Sci. 2016, 10, 22–31. [Google Scholar] [CrossRef]
- Danezis, G.P.; Tsagkaris, A.S.; Camin, F.; Brusic, V.; Georgiou, C.A. Food authentication: Techniques, trends & emerging approaches. TrAC Trends Anal. Chem. 2016, 85, 123–132. [Google Scholar]
- Pustjens, A.; Muilwijk, M.; Weesepoel, Y.; van Ruth, S. Advances in Authenticity Testing of Geographical Origin of Food Products. In Advances in Food Authenticity Testing; Elsevier: Amsterdam, The Netherlands, 2016; pp. 339–367. [Google Scholar]
- Álvarez, B.; Pascual-Alonso, M.; Rusu, A.; Bogason, S. A review on existing databases relevant for food fraud and authenticity. Arch. Zootec. 2013, 62, 73–91. [Google Scholar]
- Tsopelas, F.; Konstantopoulos, D.; Kakoulidou, A.T. Voltammetric fingerprinting of oils and its combination with chemometrics for the detection of extra virgin olive oil adulteration. Anal. Chim. Acta 2018, 1015, 8–19. [Google Scholar] [CrossRef]
- Merás, I.D.; Manzano, J.D.; Rodríguez, D.A.; de la Peña, A.M. Detection and quantification of extra virgin olive oil adulteration by means of autofluorescence excitation-emission profiles combined with multi-way classification. Talanta 2018, 178, 751–762. [Google Scholar] [CrossRef]
- Agrimonti, C.; Pirondini, A.; Marmiroli, M.; Marmiroli, N. A quadruplex PCR (qxPCR) assay for adulteration in dairy products. Food Chem. 2015, 187, 58–64. [Google Scholar] [CrossRef]
- Azad, T.; Ahmed, S. Common milk adulteration and their detection techniques. Int. J. Food Contam. 2016, 3, 22. [Google Scholar] [CrossRef]
- Gonçalves, J.; Pereira, F.; Amorim, A.; van Asch, B. New method for the simultaneous identification of cow, sheep, goat, and water buffalo in dairy products by analysis of short species-specific mitochondrial DNA targets. J. Agric. Food Chem. 2012, 60, 10480–10485. [Google Scholar] [CrossRef] [PubMed]
- Bonetti, E. The effectiveness of meta-brands in the typical product industry: Mozzarella cheese. Br. Food J. 2004, 106, 746–766. [Google Scholar] [CrossRef]
- Hajdukiewicz, A. European Union agri-food quality schemes for the protection and promotion of geographical indications and traditional specialities: An economic perspective. Folia Hortic. 2014, 26, 3–17. [Google Scholar] [CrossRef]
- Pignata, M.C.; Ferrão, S.P.B.; Oliveira, C.P.; Faleiro, A.S.; Bonomo, R.C.; Silva, W.S.; Rodrigues, L.B.; de Albuquerque Fernandes, S.A. Mechanical Parameters of the Mozzarella from Buffalo with Inclusion Levels of The Cow’s Milk: Preliminary Study at the Lab Scale. J. Bioanal. Biomed. 2015, 7, 1. [Google Scholar] [CrossRef]
- Caira, S.; Pinto, G.; Nicolai, M.A.; Chianese, L.; Addeo, F. Simultaneously tracing the geographical origin and presence of bovine milk in Italian water buffalo Mozzarella cheese using MALDI-TOF data of casein signature peptides. Anal. Bioanal. Chem. 2016, 408, 5609–5621. [Google Scholar] [CrossRef] [PubMed]
- Russo, R.; Severino, V.; Mendez, A.; Lliberia, J.; Parente, A.; Chambery, A. Detection of buffalo mozzarella adulteration by an ultra-high-performance liquid chromatography tandem mass spectrometry methodology. J. Mass Spectrom. 2012, 47, 1407–1414. [Google Scholar] [CrossRef] [PubMed]
- Mazzei, P.; Piccolo, A. 1H HRMAS-NMR metabolomic to assess quality and traceability of mozzarella cheese from Campania buffalo milk. Food Chem. 2012, 132, 1620–1627. [Google Scholar] [CrossRef]
- Sassi, M.; Arena, S.; Scaloni, A. MALDI-TOF-MS platform for integrated proteomic and peptidomic profiling of milk samples allows rapid detection of food adulterations. J. Agric. Food Chem. 2015, 63, 6157–6171. [Google Scholar] [CrossRef]
- Cevallos-Cevallos, J.M.; Reyes-De-Corcuera, J.I.; Etxeberria, E.; Danyluk, M.D.; Rodrick, G.E. Metabolomic analysis in food science: A review. Trends Food Sci. Technol. 2009, 20, 557–566. [Google Scholar] [CrossRef]
- Gianferri, R.; Maioli, M.; Delfini, M.; Brosio, E. A low-resolution and high-resolution nuclear magnetic resonance integrated approach to investigate the physical structure and metabolic profile of Mozzarella di Bufala Campana cheese. Int. Dairy J. 2007, 17, 167–176. [Google Scholar] [CrossRef]
- He, Q.; Kong, X.; Wu, G.; Ren, P.; Tang, H.; Hao, F.; Huang, R.; Li, T.; Tan, B.; Li, P. Metabolomic analysis of the response of growing pigs to dietary L-arginine supplementation. Amino Acids 2009, 37, 199–208. [Google Scholar] [CrossRef]
- Nicholson, J.; Lindon, J. Metabonomics. Nature 2008, 455, 1054–1056. [Google Scholar] [CrossRef]
- Sacco, D.; Brescia, M.; Sgaramella, A.; Casiello, G.; Buccolieri, A.; Ogrinc, N.; Sacco, A. Discrimination between Southern Italy and foreign milk samples using spectroscopic and analytical data. Food Chem. 2009, 114, 1559–1563. [Google Scholar] [CrossRef]
- Shintu, L.; Ziarelli, F.; Caldarelli, S. Is high-resolution magic angle spinning NMR a practical speciation tool for cheese samples? Parmigiano Reggiano as a case study. Magn. Reson. Chem. 2004, 42, 396–401. [Google Scholar] [CrossRef] [PubMed]
- Sun, H.-Z.; Wang, D.-M.; Wang, B.; Wang, J.-K.; Liu, H.-Y.; Guan, L.L.; Liu, J.-X. Metabolomics of four biofluids from dairy cows: Potential biomarkers for milk production and quality. J. Proteome Res. 2015, 14, 1287–1298. [Google Scholar] [CrossRef] [PubMed]
- Caboni, P.; Murgia, A.; Porcu, A.; Manis, C.; Ibba, I.; Contu, M.; Scano, P. A metabolomics comparison between sheep’s and goat’s milk. Food Res Int. 2019, 119, 869–875. [Google Scholar] [CrossRef] [PubMed]
- Caboni, P.; Murgia, A.; Porcu, A.; Demuru, M.; Pulina, G.; Nudda, A. Gas chromatography-mass spectrometry metabolomics of goat milk with different polymorphism at the αS1-casein genotype locus. J. Anim. Sci. 2016, 99, 6046–6051. [Google Scholar] [CrossRef]
- Pisano, M.B.; Scano, P.; Murgia, A.; Cosentino, S.; Caboni, P. Metabolomics and microbiological profile of Italian mozzarella cheese produced with buffalo and cow milk. Food Chem. 2016, 192, 618–624. [Google Scholar] [CrossRef]
- Scano, P.; Murgia, A.; Pirisi, F.M.; Caboni, P. A gas chromatography-mass spectrometry-based metabolomic approach for the characterization of goat milk compared with cow milk. J Dairy Sci. 2014, 97, 6057–6066. [Google Scholar] [CrossRef]
- Chen, J.K.; Shen, C.R.; Liu, C.L. N-acetylglucosamine: Production and applications. Mar. Drugs 2010, 8, 2493–2516. [Google Scholar] [CrossRef]
- Mendoza, M.R.; Olano, A.; Villamiel, M. Chemical indicators of heat treatment in fortified and special milks. J. Agric. Food Chem. 2005, 53, 2995–2999. [Google Scholar] [CrossRef]
- Troyano, E.; Villamiel, M.; Olano, A.; Sanz, J.; Martínez-Castro, I. Monosaccharides andmyo-inositol in commercial milks. J. Agric. Food Chem. 1996, 44, 815–817. [Google Scholar] [CrossRef]
- Coppola, S.; Parente, E.; Dumontet, S.; La Peccerella, A. The microflora of natural whey cultures utilized as starters in the manufacture of Mozzarella cheese from water–buffalo milk. Le Lait 1988, 68, 295–310. [Google Scholar] [CrossRef]
- Coppola, S.; Blaiotta, G.; Ercolini, D.; Moschetti, G. Molecular evaluation of microbial diversity occurring in different types of Mozzarella cheese. J. Appl. Microbiol. 2001, 90, 414–420. [Google Scholar] [CrossRef] [PubMed][Green Version]
- Bonizzi, I.; Feligini, M.; Aleandri, R.; Enne, G. Genetic traceability of geographical origin of typical Italian water buffalo mozzarella cheese: A preliminary approach. J. App. Microbiol. 2006, 102, 667–673. [Google Scholar] [CrossRef] [PubMed]
- Lucey, J.A.; Johnson, M.E.; Horne, D.S. Invited review: Perspectives on the basis of the rheology and texture properties of cheese. J Dairy Sci. 2003, 86, 2725–2743. [Google Scholar] [CrossRef]
- MEGlobal. Fast Facts Diethylene Glycol. Available online: http://www.meglobal.biz/media/MEGlobal_FastFacts_DEG.pdf (accessed on 15 February 2019).
- Kabata-Pendias, A.; Pendias, H. Trace Elements in Soils and Plant, 3rd ed.; CRC Press: Boca Raton, FL, USA, 2001; p. 403. [Google Scholar]
- Rotz, C.A.; Muck, R.E. Changes in forage quality during harvest and storage. In Forage Quality, Evaluation, and Utilization, 1st ed.; Fahey, G.C., Collins, M., Mertens, D.R., Moser, L.E., Eds.; American Society of Agronomy, Crop Science Society of America, Soil Science Society of America: Madison, WI, USA, 1994; pp. 828–868. [Google Scholar]
- Bontempo, L.; Paolini, M.; Franceschi, P.; Ziller, L.; García-González, D.L.; Camin, F. Characterisation and attempted differentiation of European and extra-European olive oils using stable isotope ratio analysis. Food Chem. 2019, 276, 782–789. [Google Scholar] [CrossRef]
- Henderson, G.; Cox, F.; Ganesh, S.; Jonker, A.; Young, W.; Abecia, L.; Angarita, E.; Aravena, P.; Arenas, G.N.; Ariza, C. Rumen microbial community composition varies with diet and host, but a core microbiome is found across a wide geographical range. Sci. Rep. 2015, 5, 14567. [Google Scholar] [CrossRef]
- Jami, E.; White, B.A.; Mizrahi, I. Potential role of the bovine rumen microbiome in modulating milk composition and feed efficiency. PLoS ONE 2014, 9, e85423. [Google Scholar] [CrossRef]
- Lima, F.S.; Oikonomou, G.; Lima, S.F.; Bicalho, M.L.; Ganda, E.K.; de Oliveira Filho, J.C.; Lorenzo, G.; Trojacanec, P.; Bicalho, R.C. Prepartum and postpartum rumen fluid microbiomes: Characterization and correlation with production traits in dairy cows. Appl. Environ. Microbiol. 2015, 81, 1327–1337. [Google Scholar] [CrossRef]
- Berardo, N. Prediction of the chemical composition of white clover by near-infrared reflectance spectroscopy. Grass Forage Sci. 1997, 52, 27–32. [Google Scholar] [CrossRef]
- Troisi, J.; Sarno, L.; Martinelli, P.; Di Carlo, C.; Landolfi, A.; Scala, G.; Rinaldi, M.; D’Alessandro, P.; Ciccone, C.; Guida, M. A metabolomics-based approach for non-invasive diagnosis of chromosomal anomalies. Metabolomics 2017, 13, 140. [Google Scholar] [CrossRef]
- Sumner, L.W.; Amberg, A.; Barrett, D.; Beale, M.H.; Beger, R.; Daykin, C.A.; Fan, T.W.-M.; Fiehn, O.; Goodacre, R.; Griffin, J.L.; et al. Proposed minimum reporting standards for chemical analysis Chemical Analysis Working Group (CAWG) Metabolomics Standards Initiative (MSI). Metabolomics Off. J. Metabolomic Soc. 2007, 3, 211–221. [Google Scholar] [CrossRef]
- Wold, S.; Sjöström, M.; Eriksson, L. PLS-regression: A basic tool of chemometrics. PLS Methods 2001, 58, 109–130. [Google Scholar] [CrossRef]
- Mevik, B.H.; Wehrens, R. The pls Package: Principal Component and Partial Least Squares Regression in R. J. Stat. Softw. 2007, 18, 148–152. [Google Scholar] [CrossRef]
- Kuhn, M. Building Predictive Models in R Using the caret Package. J. Stat. Softw. 2008, 28, 1–26. [Google Scholar] [CrossRef]
Sample Availability: Samples of the compounds extract of milk and mozzarella cheese are available from the authors. |


| BUFFALO MILK | |||||
|---|---|---|---|---|---|
| Nutrition Facts for 100 g of Product (Reg. UE 1169/2011) | NON-PDO REGION (n = 9) | PDO REGION (n = 11) | p Value | ||
| U.M | VALUE | U.M | VALUE | ||
| Energy net value | KJ/100 g | 473 ± 8.4 | KJ/100 g | 479 ± 7.9 | 0.82 |
| Kcal/100 g | 112 ± 3.5 | Kcal/100 g | 116 ± 3.7 | 0.77 | |
| Total protein | g/100 g | 4.5 ± 0.7 | g/100 g | 4.6 ± 0.6 | 0.85 |
| Total fat | g/100 g | 8.4 ± 0.9 | g/100 g | 8.6 ± 0.8 | 0.69 |
| Saturated fat | g/100 g | 4.9 ± 0.5 | g/100 g | 4.9 ± 0.5 | 0.91 |
| Total carbohydrates | g/100 g | 5.2 ± 0.4 | g/100 g | 5.2 ± 0.5 | 0.82 |
| Sugars | g/100 g | 0.8 ± 0.1 | g/100 g | 0.9 ± 0.1 | 0.86 |
| Salt | g/100 g | Nd | g/100 g | Nd | |
| Ashes | g/100 g | 0.8 ± 0.0 | g/100 g | 0.8 ± 0.1 | 0.90 |
| BUFFALO MOZZARELLA CHEESE | |||||
|---|---|---|---|---|---|
| Nutrition Facts for 100 g of Product (Reg. UE 1169/2011) | NON-PDO REGION (n = 9) | PDO REGION (n = 11) | p Value | ||
| U.M. | VALUE | U.M. | VALUE | ||
| Energy net value | KJ/100 g | 1129.9 ± 9.4 | KJ/100 g | 1131.1 ± 8.2 | 0.72 |
| Kcal/100 g | 268.6 ± 4.0 | Kcal/100 g | 269.2 ± 3.2 | 0.84 | |
| Total protein | g/100 g | 13.4 ± 1.0 | g/100 g | 13.5 ± 0.9 | 0.86 |
| Total fat | g/100 g | 23.3 ± 2.6 | g/100 g | 23.5 ± 2.9 | 0.73 |
| Saturated fat | g/100 g | 14.6 ± 0.4 | g/100 g | 14.6 ± 0.6 | 0.79 |
| Total carbohydrates | g/100 g | 0.8 ± 0.0 | g/100 g | 0.8 ± 0.0 | 0.91 |
| Sugars | g/100 g | 0.8 ± 0.1 | g/100 g | 0.8 ± 0.0 | 0.88 |
| Salt | g/100 g | 0.9 ± 0.1 | g/100 g | 0.9 ± 0.1 | 0.90 |
| Ashes | g/100 g | 1.4 ± 0.2 | g/100 g | 1.4 ± 0.2 | 0.93 |
© 2020 by the authors. Licensee MDPI, Basel, Switzerland. This article is an open access article distributed under the terms and conditions of the Creative Commons Attribution (CC BY) license (http://creativecommons.org/licenses/by/4.0/).
Share and Cite
Salzano, A.; Manganiello, G.; Neglia, G.; Vinale, F.; De Nicola, D.; D’Occhio, M.; Campanile, G. A Preliminary Study on Metabolome Profiles of Buffalo Milk and Corresponding Mozzarella Cheese: Safeguarding the Authenticity and Traceability of Protected Status Buffalo Dairy Products. Molecules 2020, 25, 304. https://doi.org/10.3390/molecules25020304
Salzano A, Manganiello G, Neglia G, Vinale F, De Nicola D, D’Occhio M, Campanile G. A Preliminary Study on Metabolome Profiles of Buffalo Milk and Corresponding Mozzarella Cheese: Safeguarding the Authenticity and Traceability of Protected Status Buffalo Dairy Products. Molecules. 2020; 25(2):304. https://doi.org/10.3390/molecules25020304
Chicago/Turabian StyleSalzano, Angela, Gelsomina Manganiello, Gianluca Neglia, Francesco Vinale, Donato De Nicola, Michael D’Occhio, and Giuseppe Campanile. 2020. "A Preliminary Study on Metabolome Profiles of Buffalo Milk and Corresponding Mozzarella Cheese: Safeguarding the Authenticity and Traceability of Protected Status Buffalo Dairy Products" Molecules 25, no. 2: 304. https://doi.org/10.3390/molecules25020304
APA StyleSalzano, A., Manganiello, G., Neglia, G., Vinale, F., De Nicola, D., D’Occhio, M., & Campanile, G. (2020). A Preliminary Study on Metabolome Profiles of Buffalo Milk and Corresponding Mozzarella Cheese: Safeguarding the Authenticity and Traceability of Protected Status Buffalo Dairy Products. Molecules, 25(2), 304. https://doi.org/10.3390/molecules25020304