Exciton Coupling and Conformational Changes Impacting the Excited State Properties of Metal Organic Frameworks
Abstract
1. Introduction
2. Results and Discussion
2.1. Molecular Properties and Solvent Effects
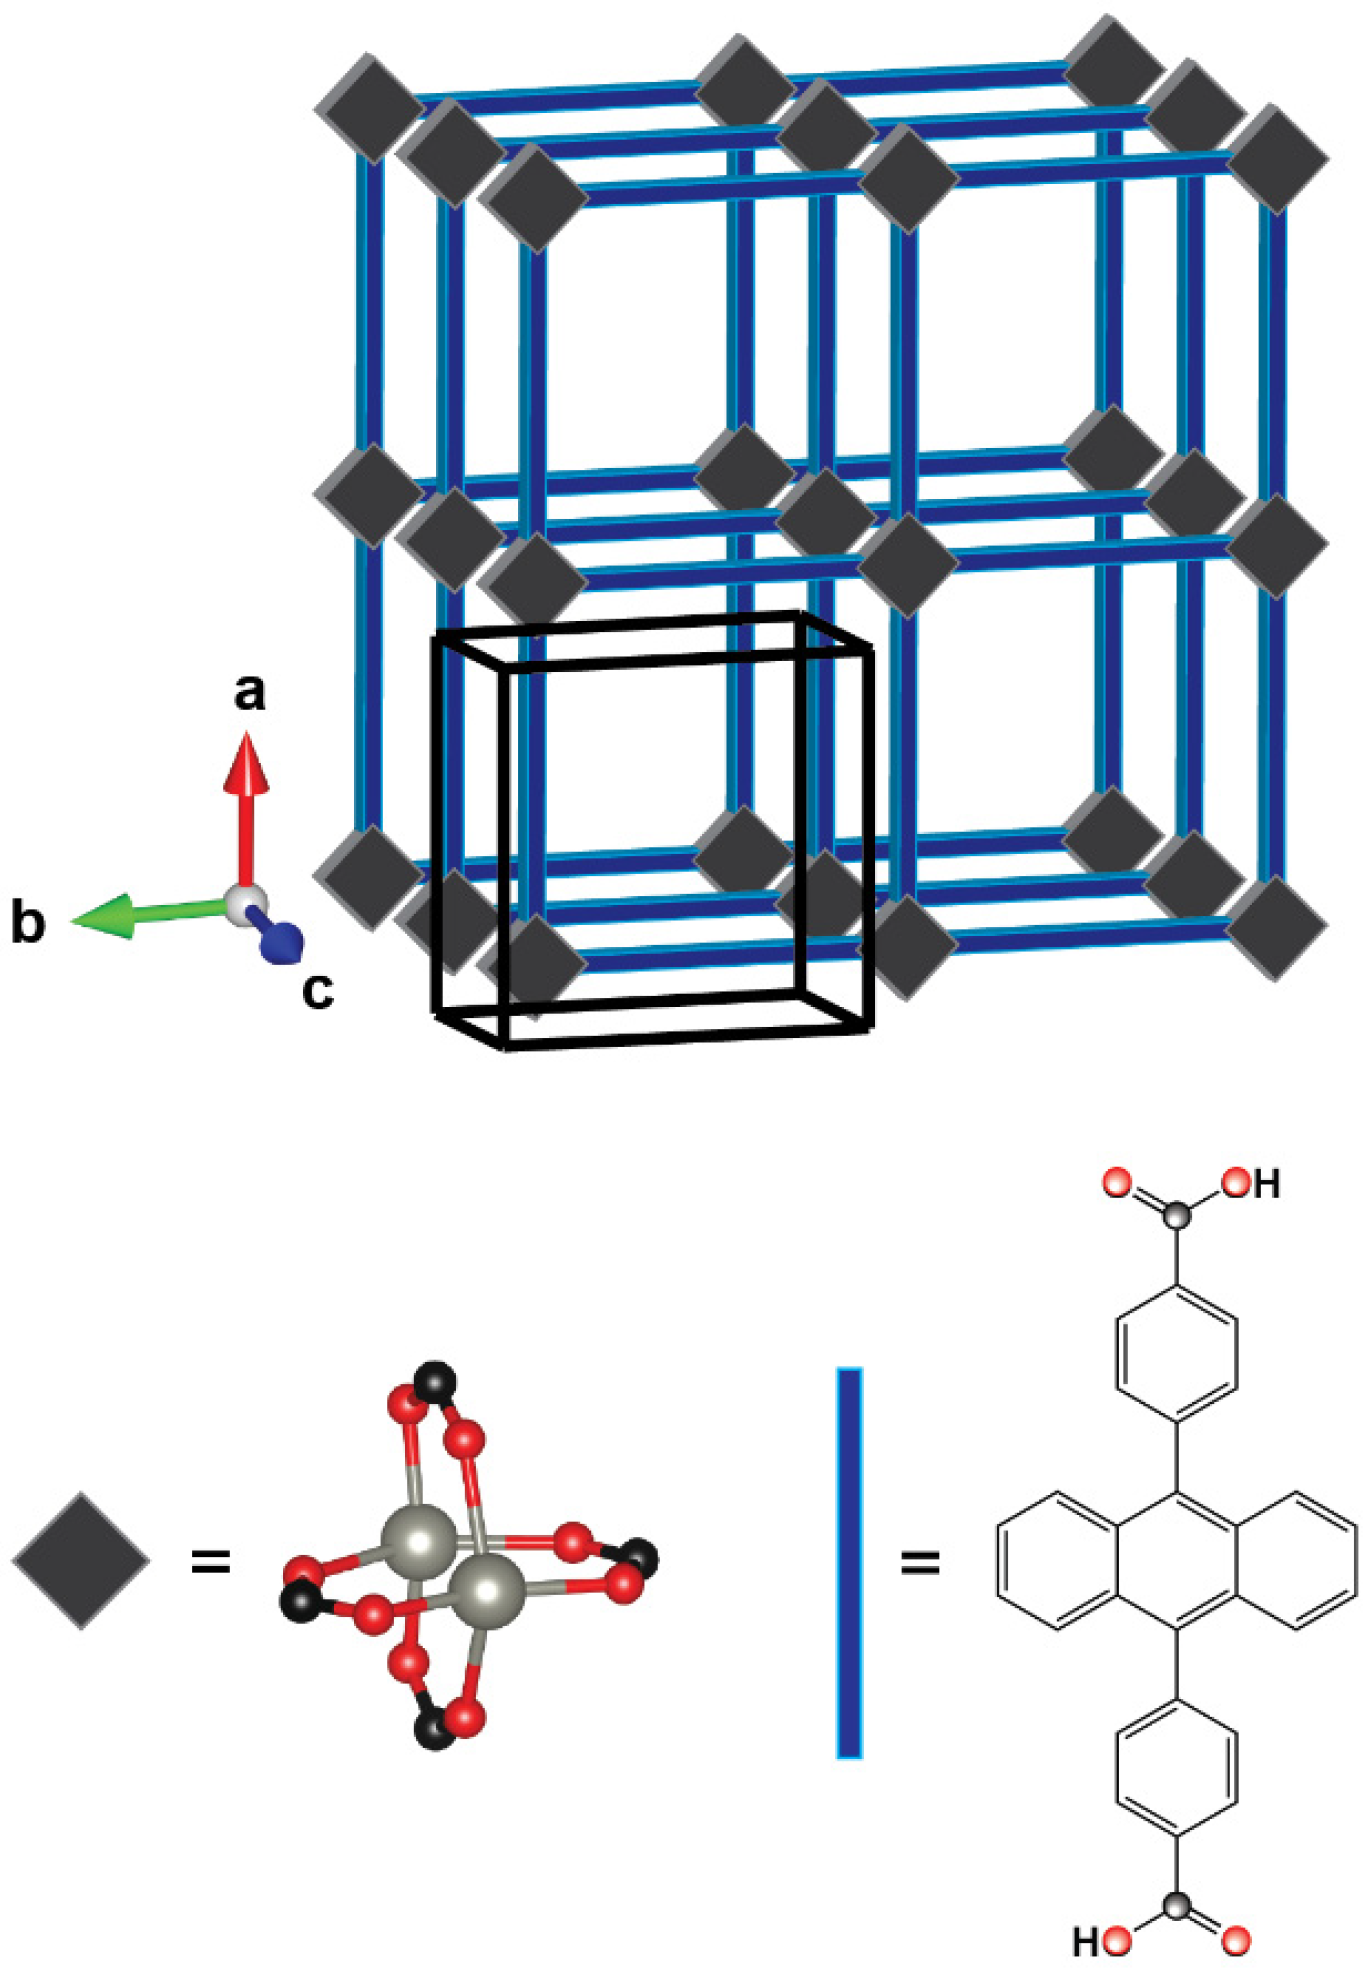
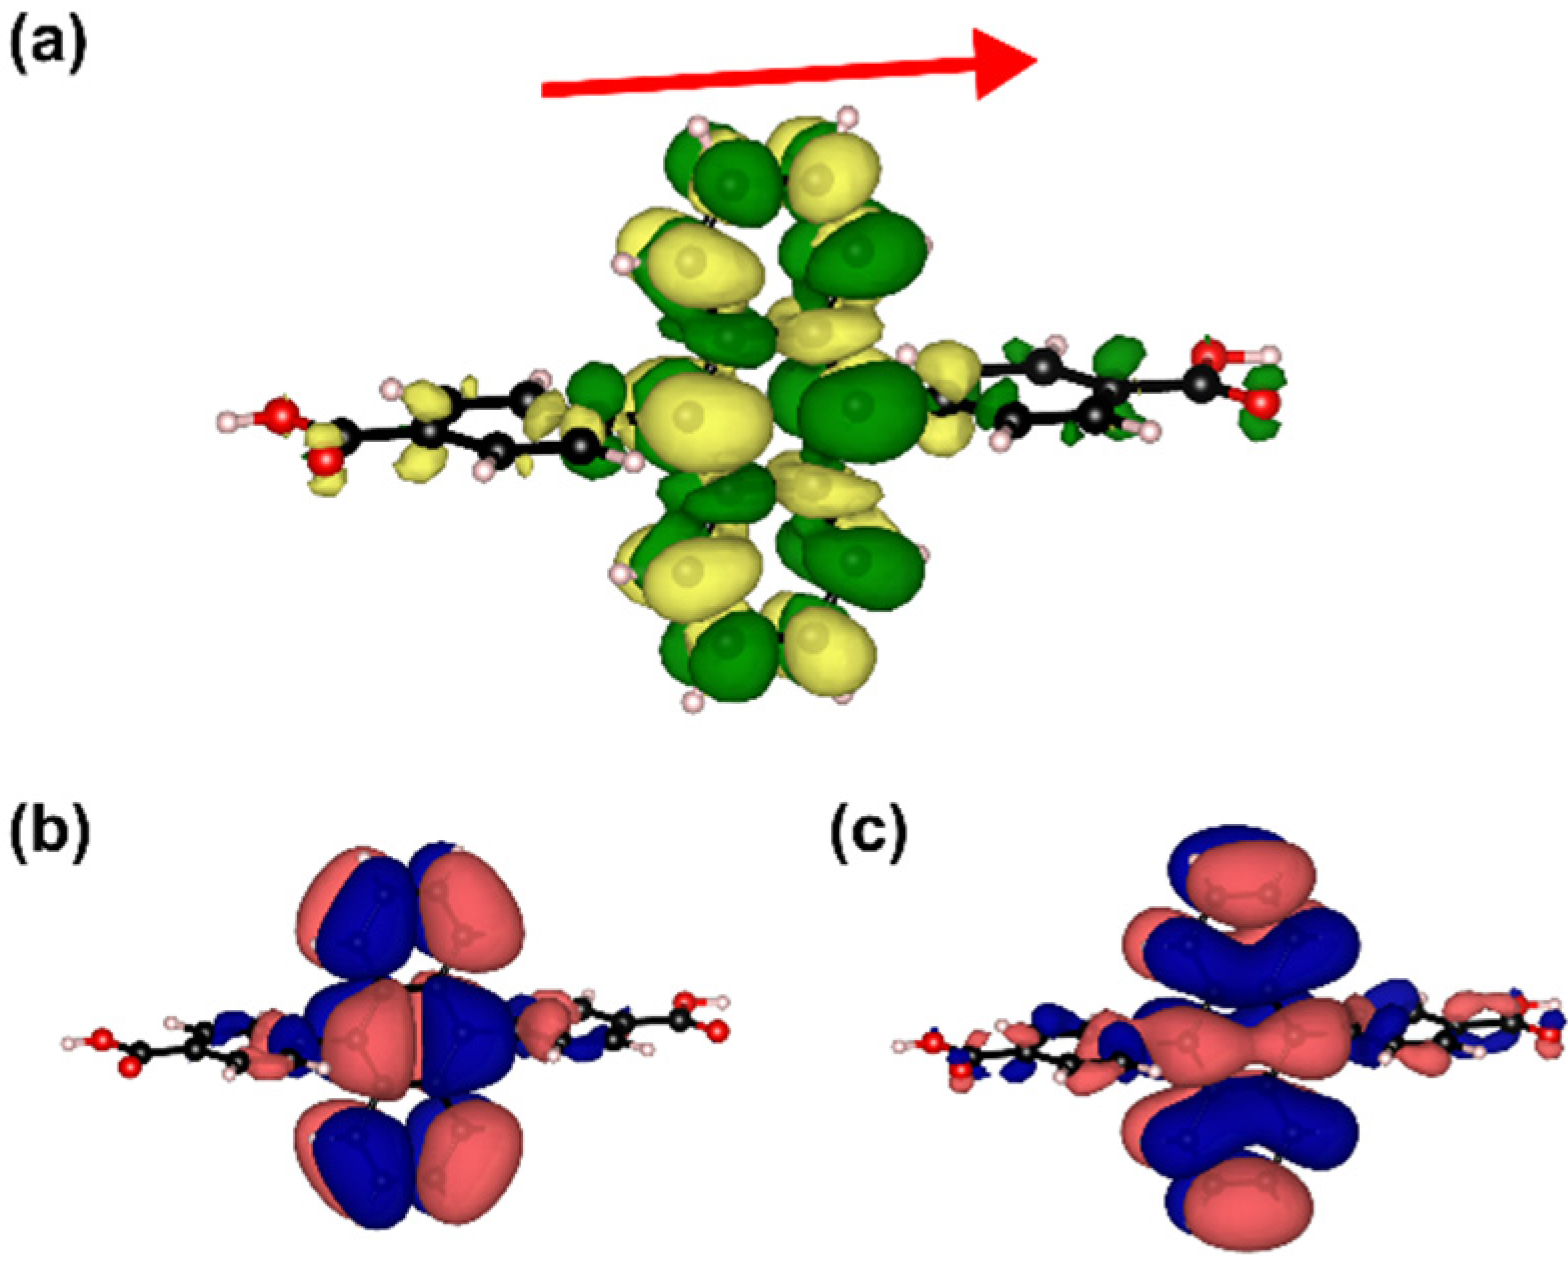
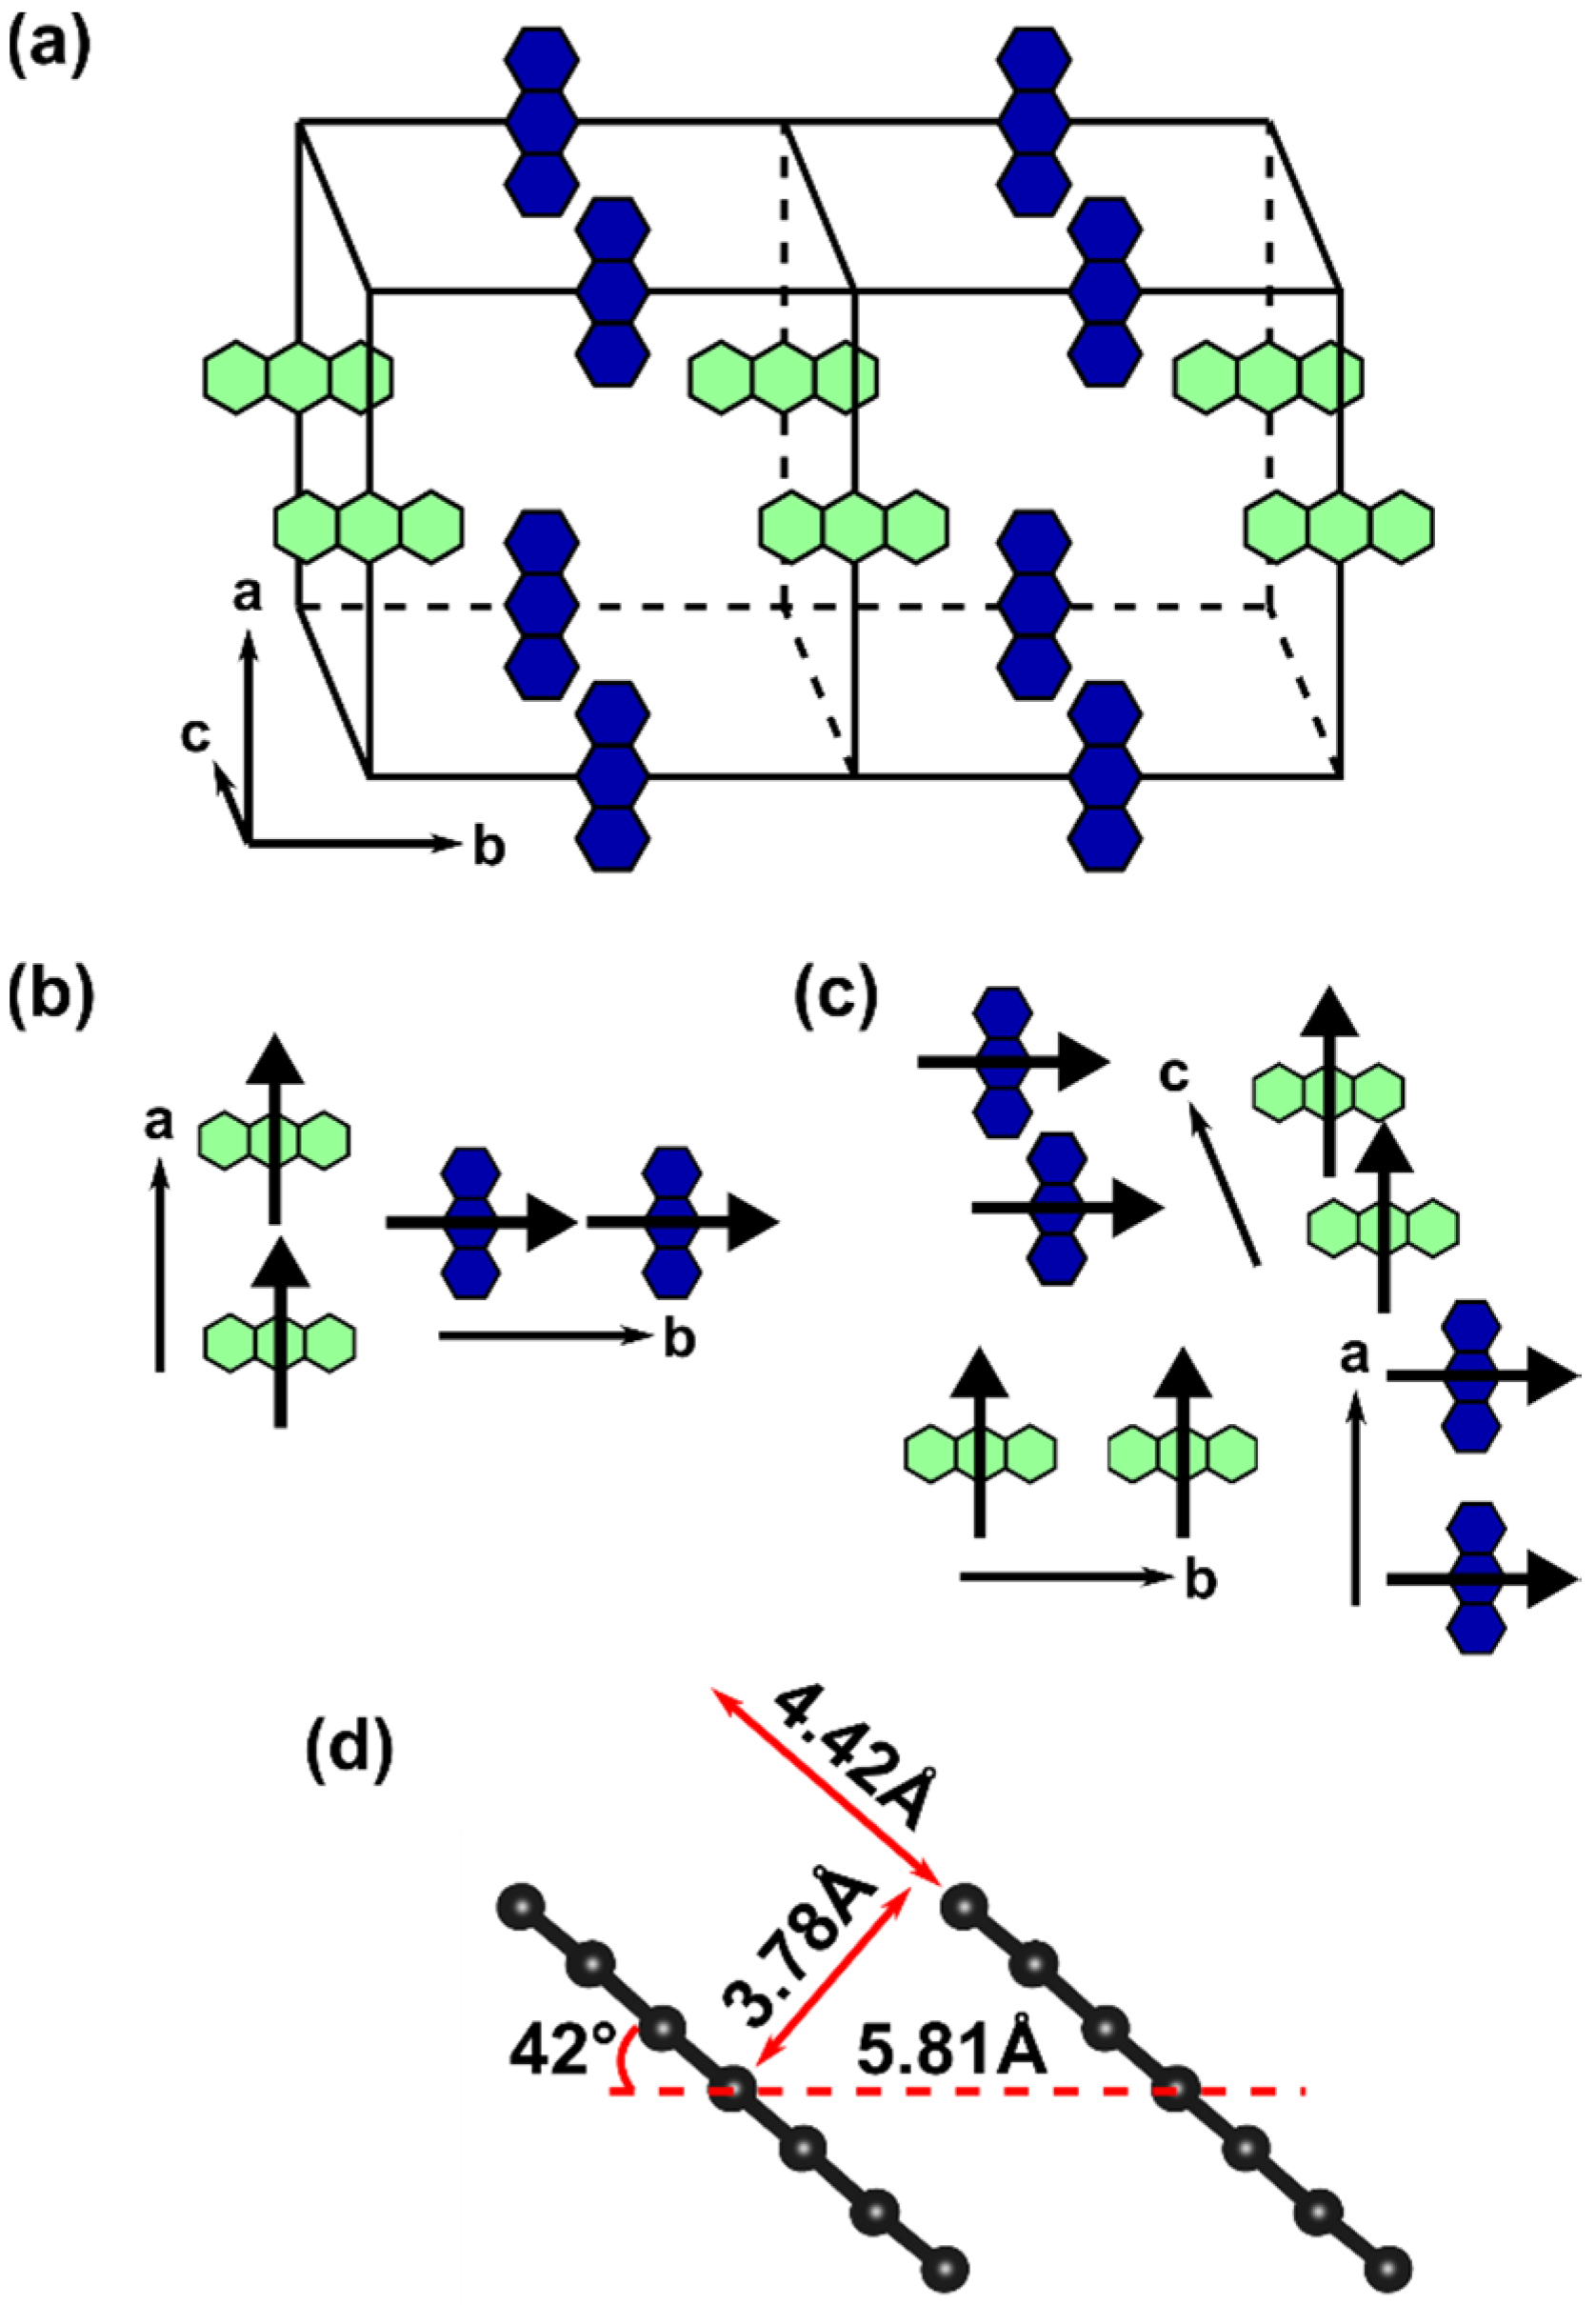
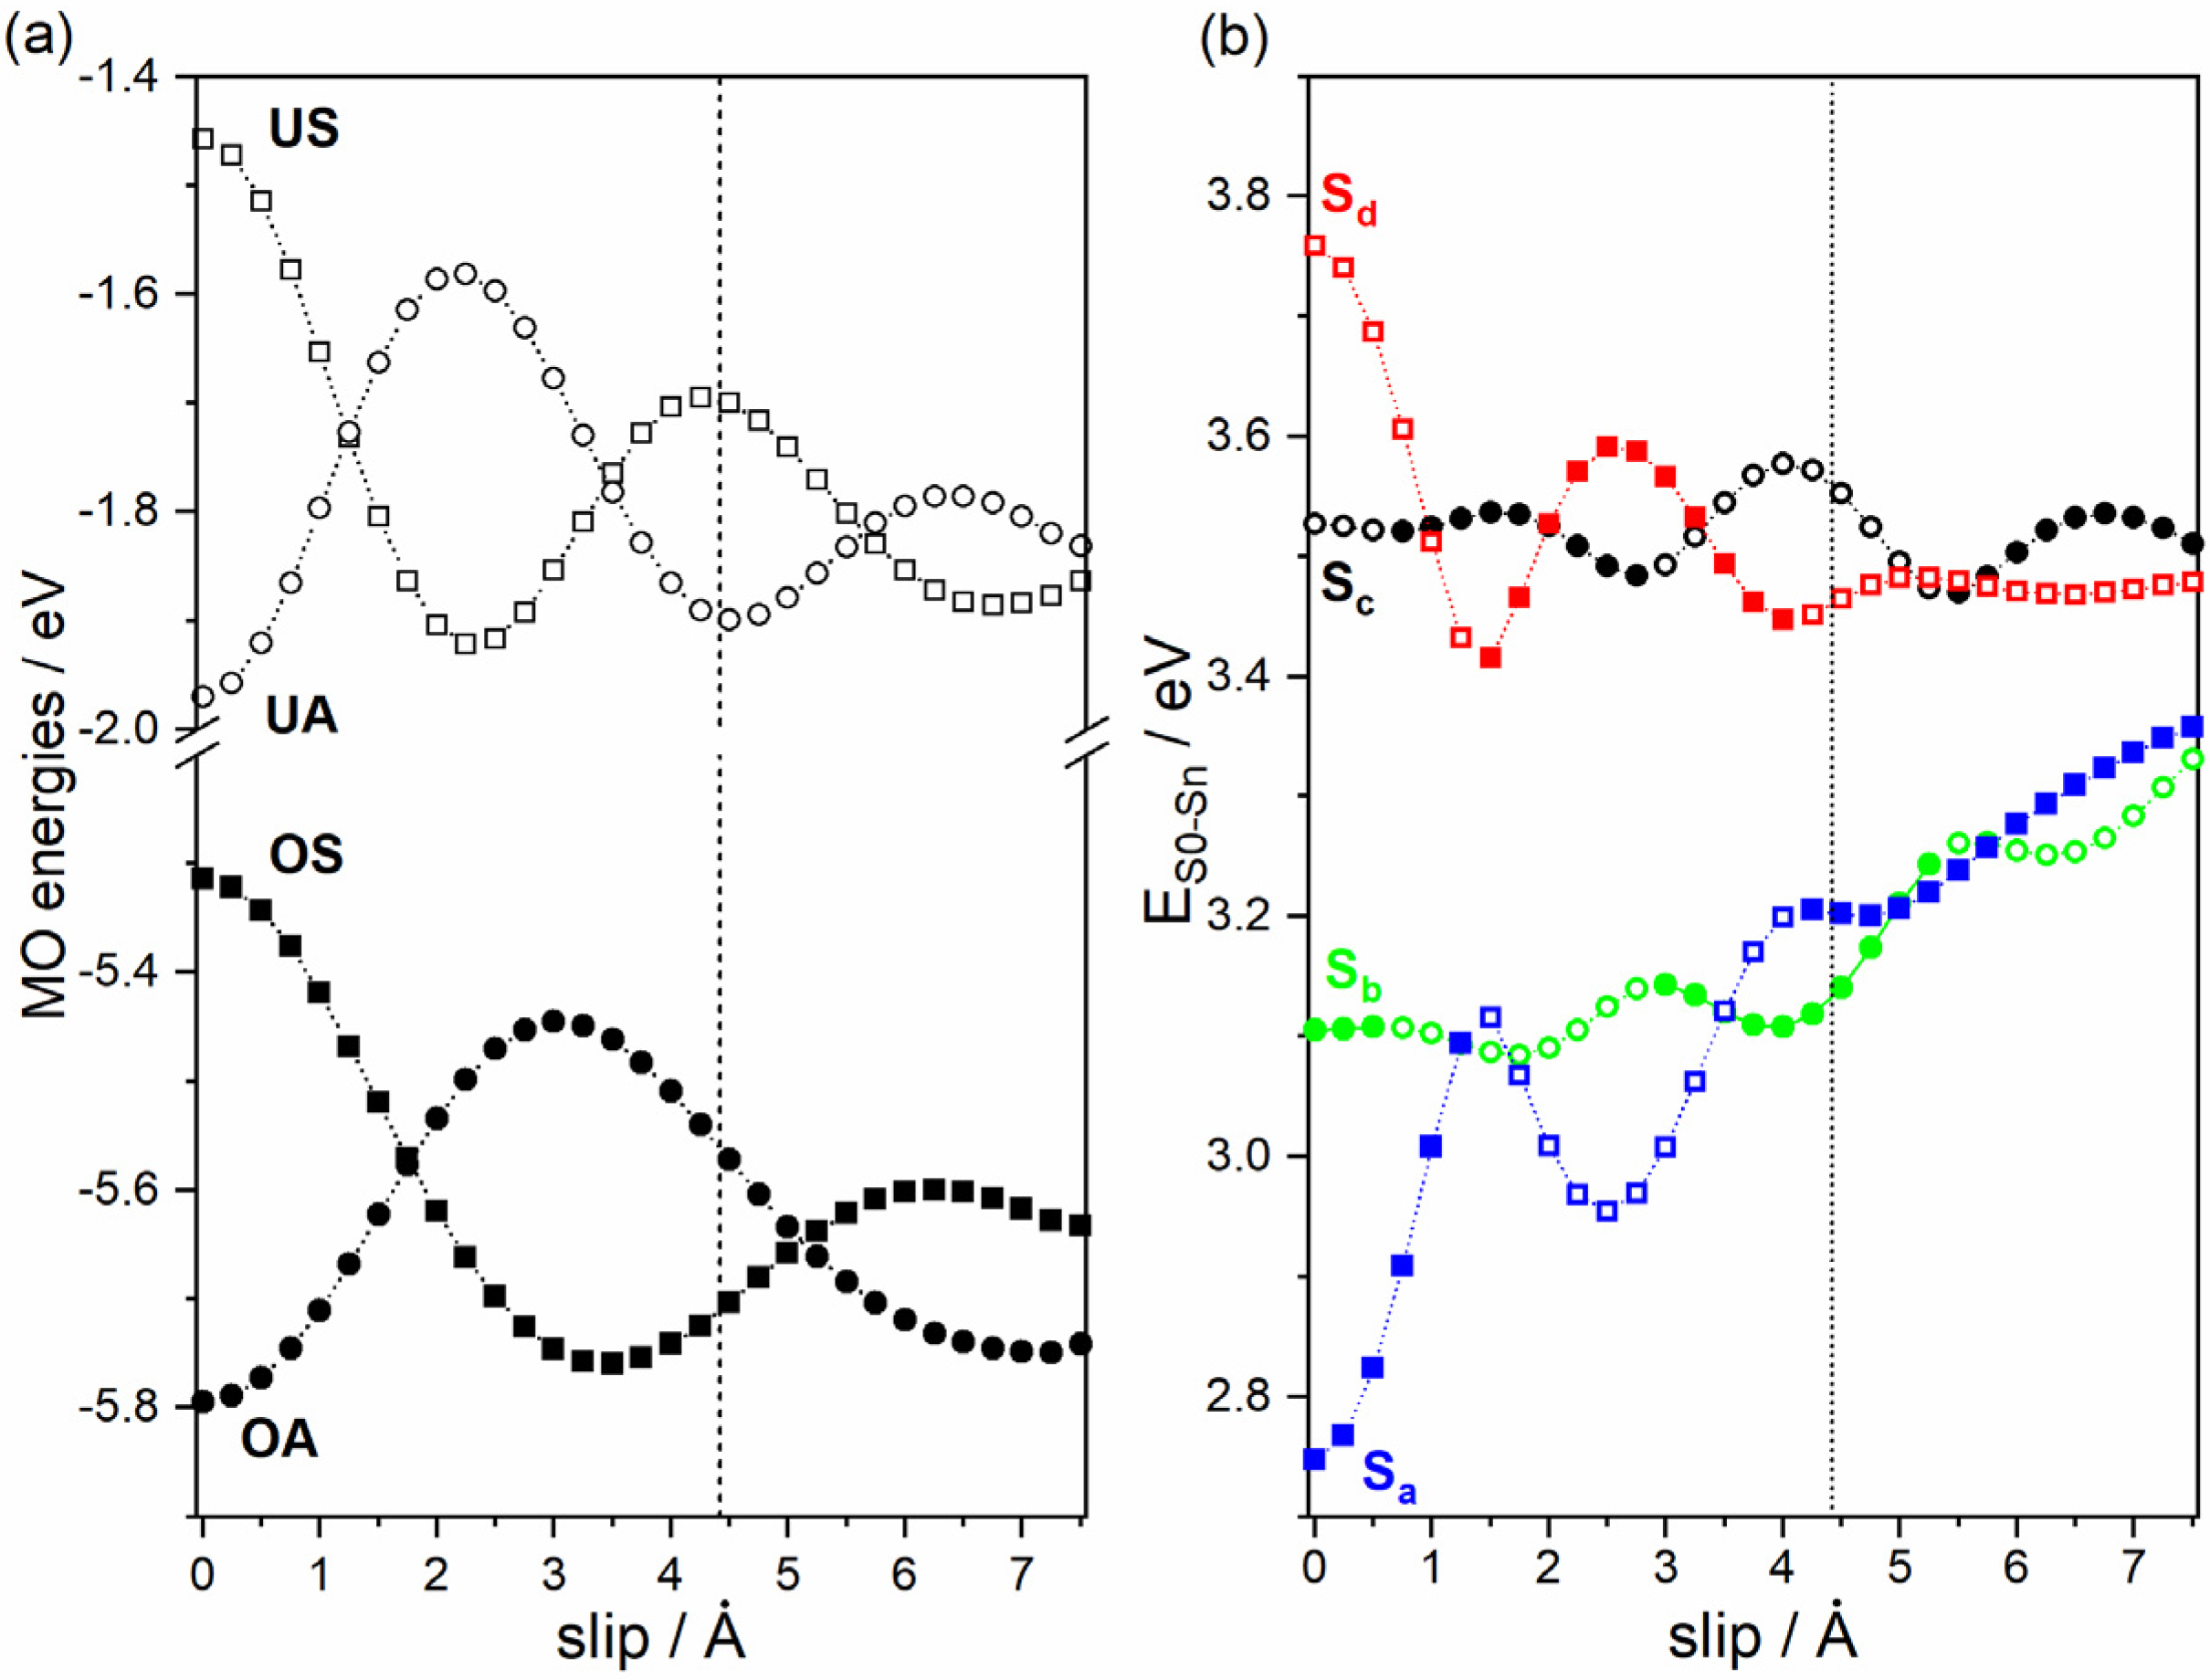
2.2. Formation of H- and J-Aggregates in Zn-ADB SURMOF-2: Anthracene Dimers as Model Systems
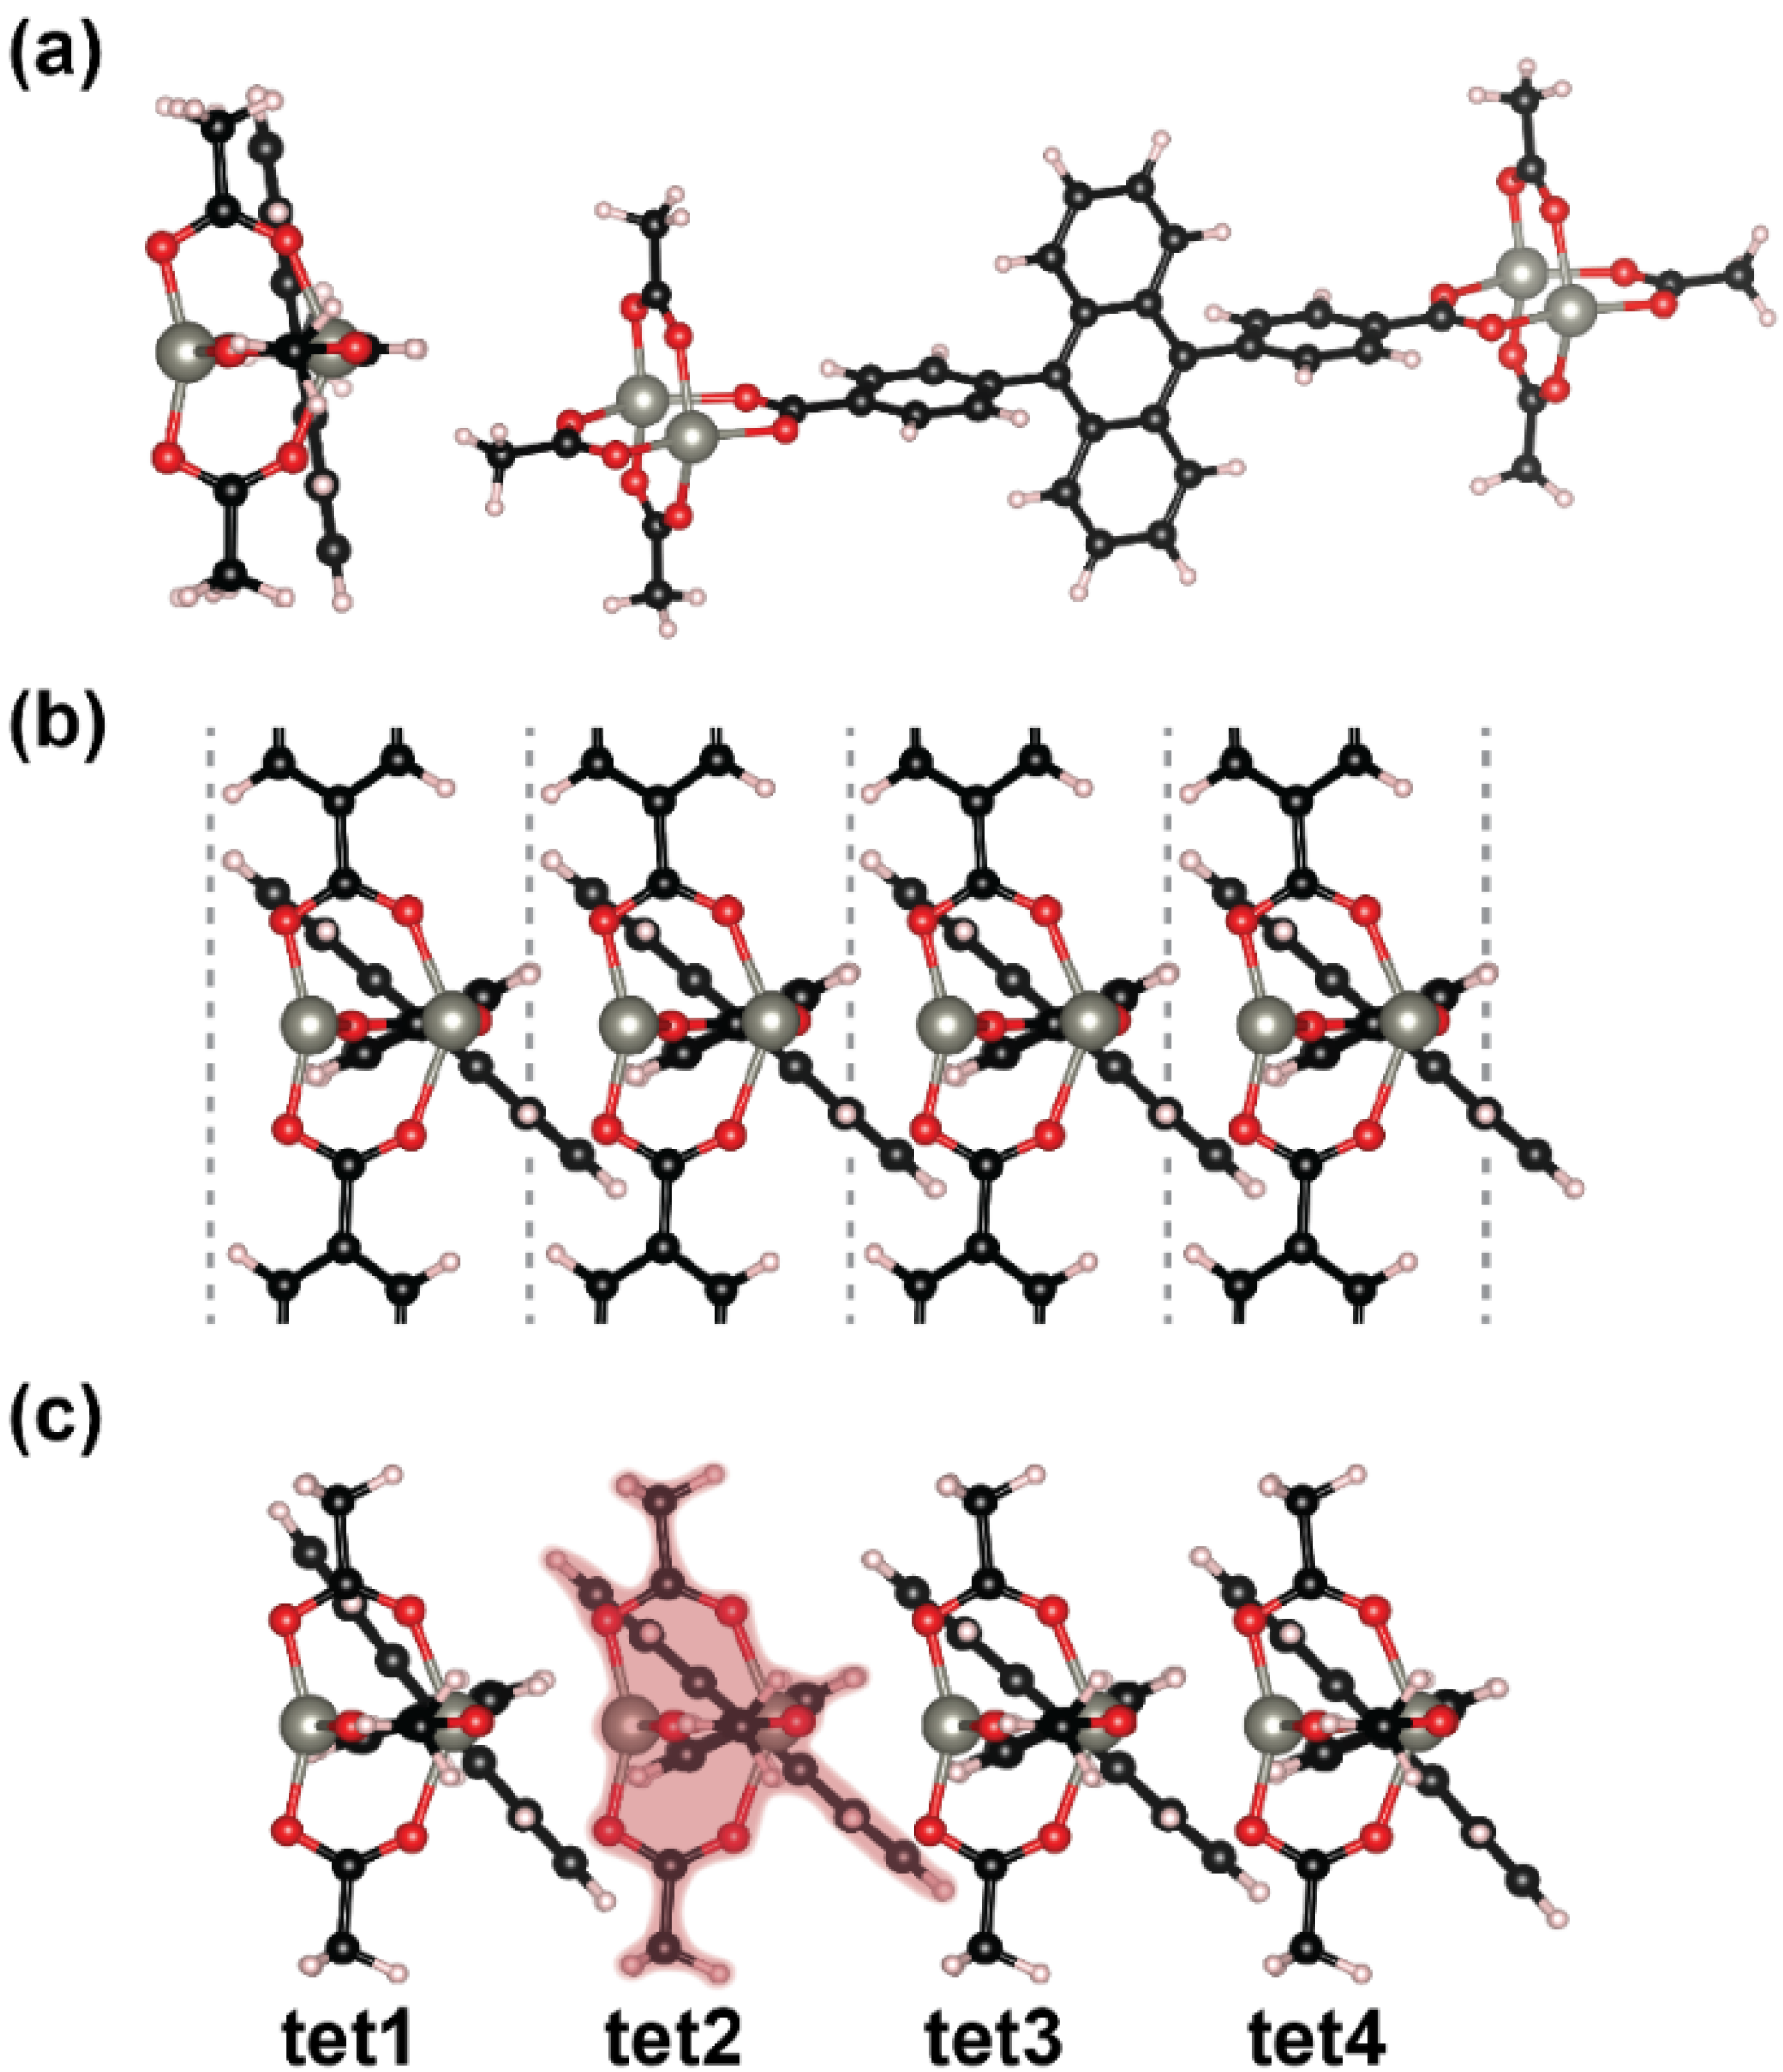
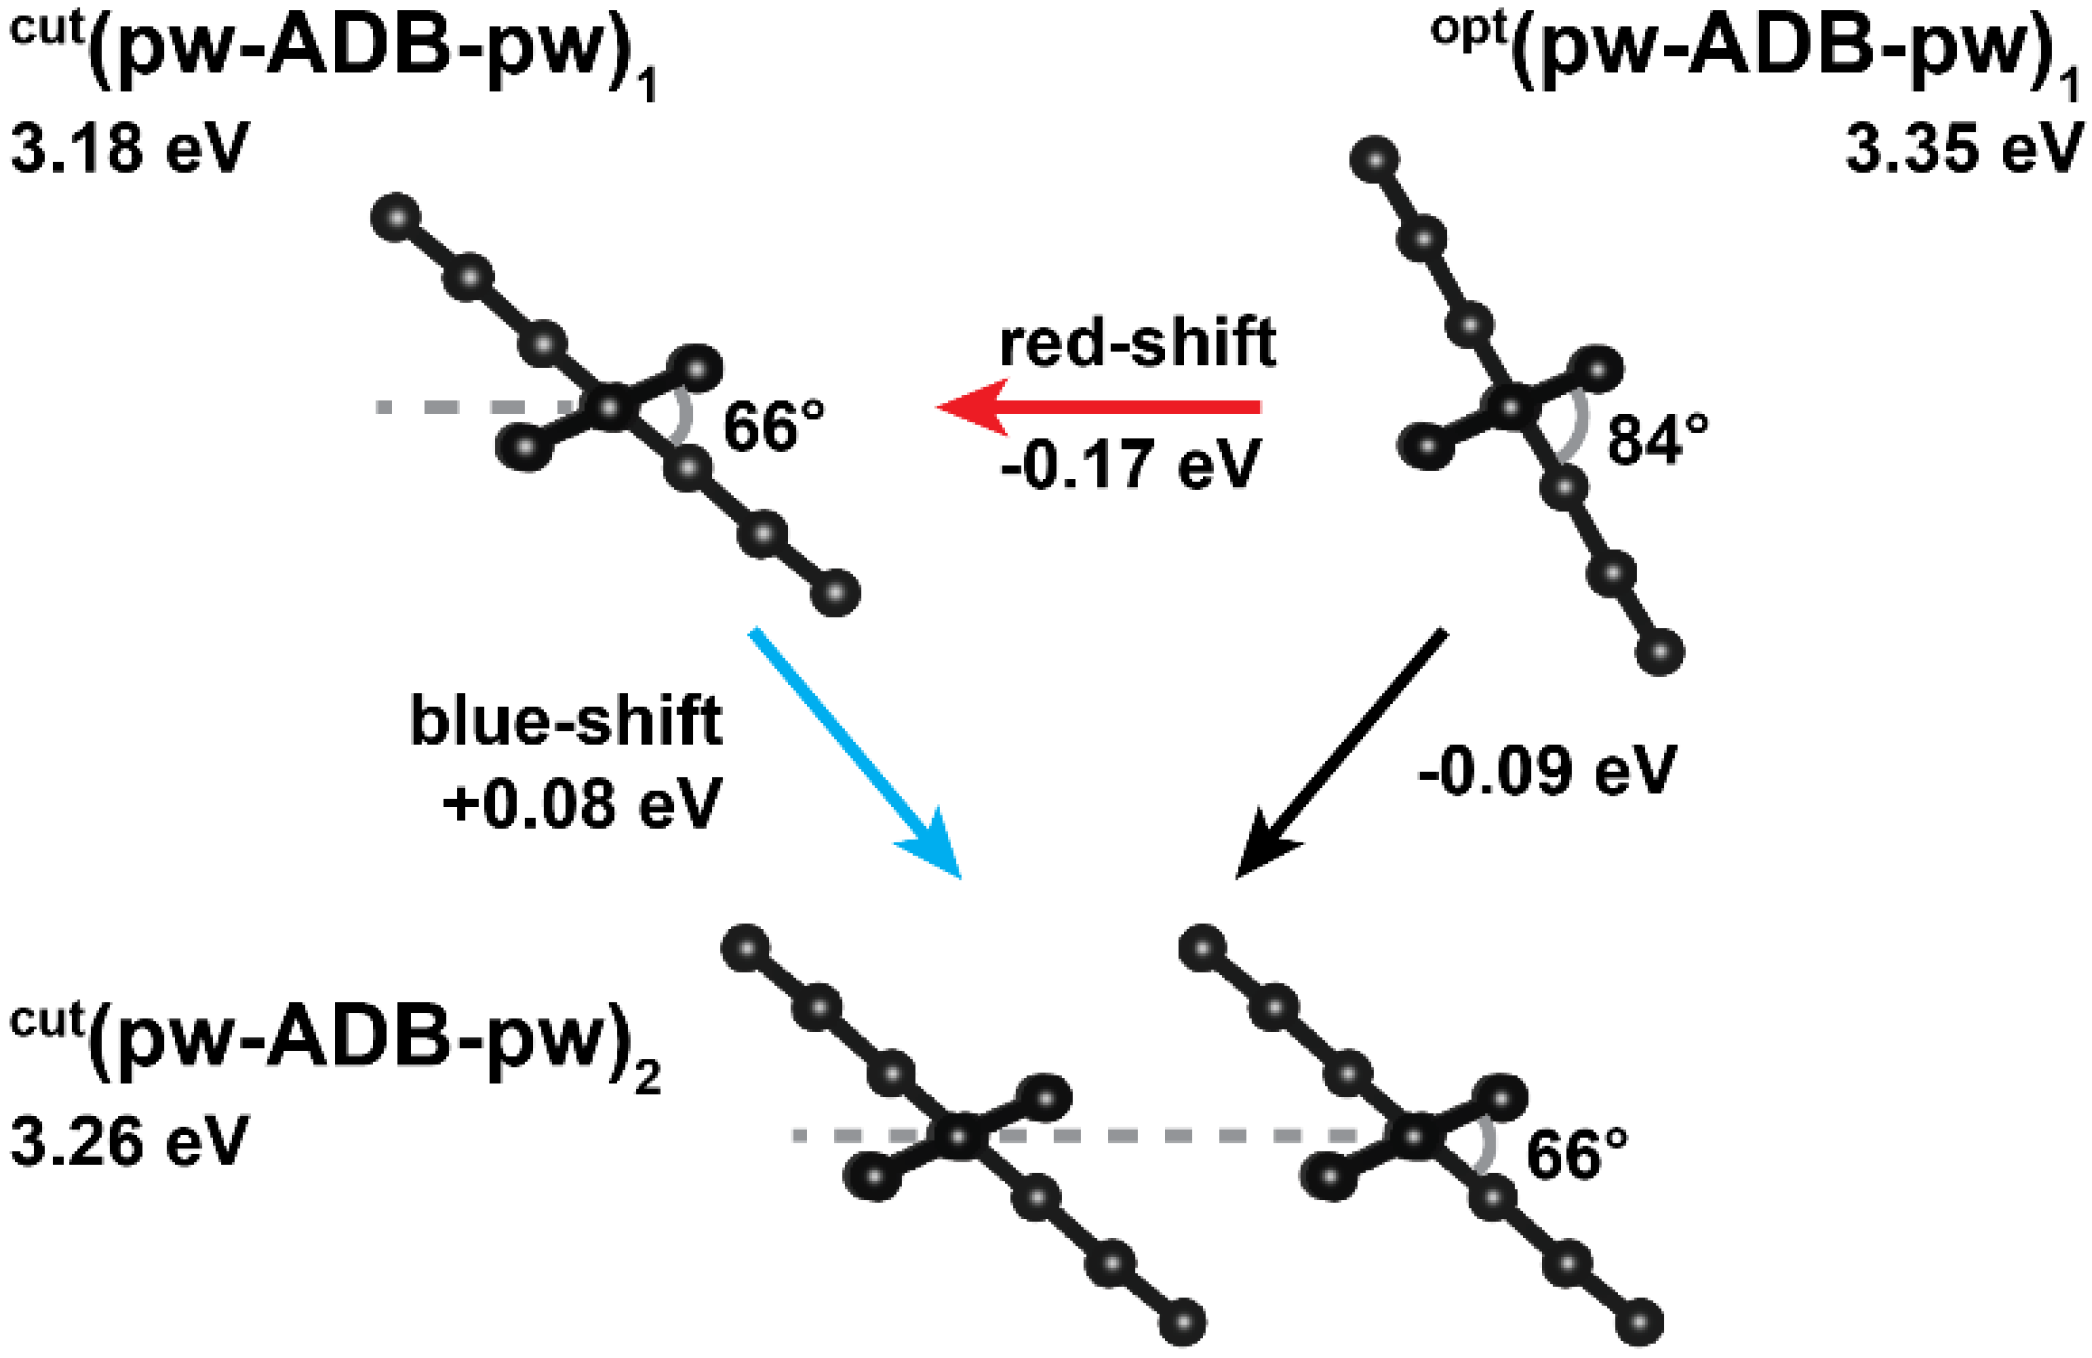
2.3. Impact of the Chemical Linkages and The Solid-State Conformation on the Optical Properties of ADB in Zn-ADB SURMOF-2
2.4. The Final Absorption Spectrum of Zn-ADB SURMOF-2: Combining Conformational Changes and Aggregate Formation
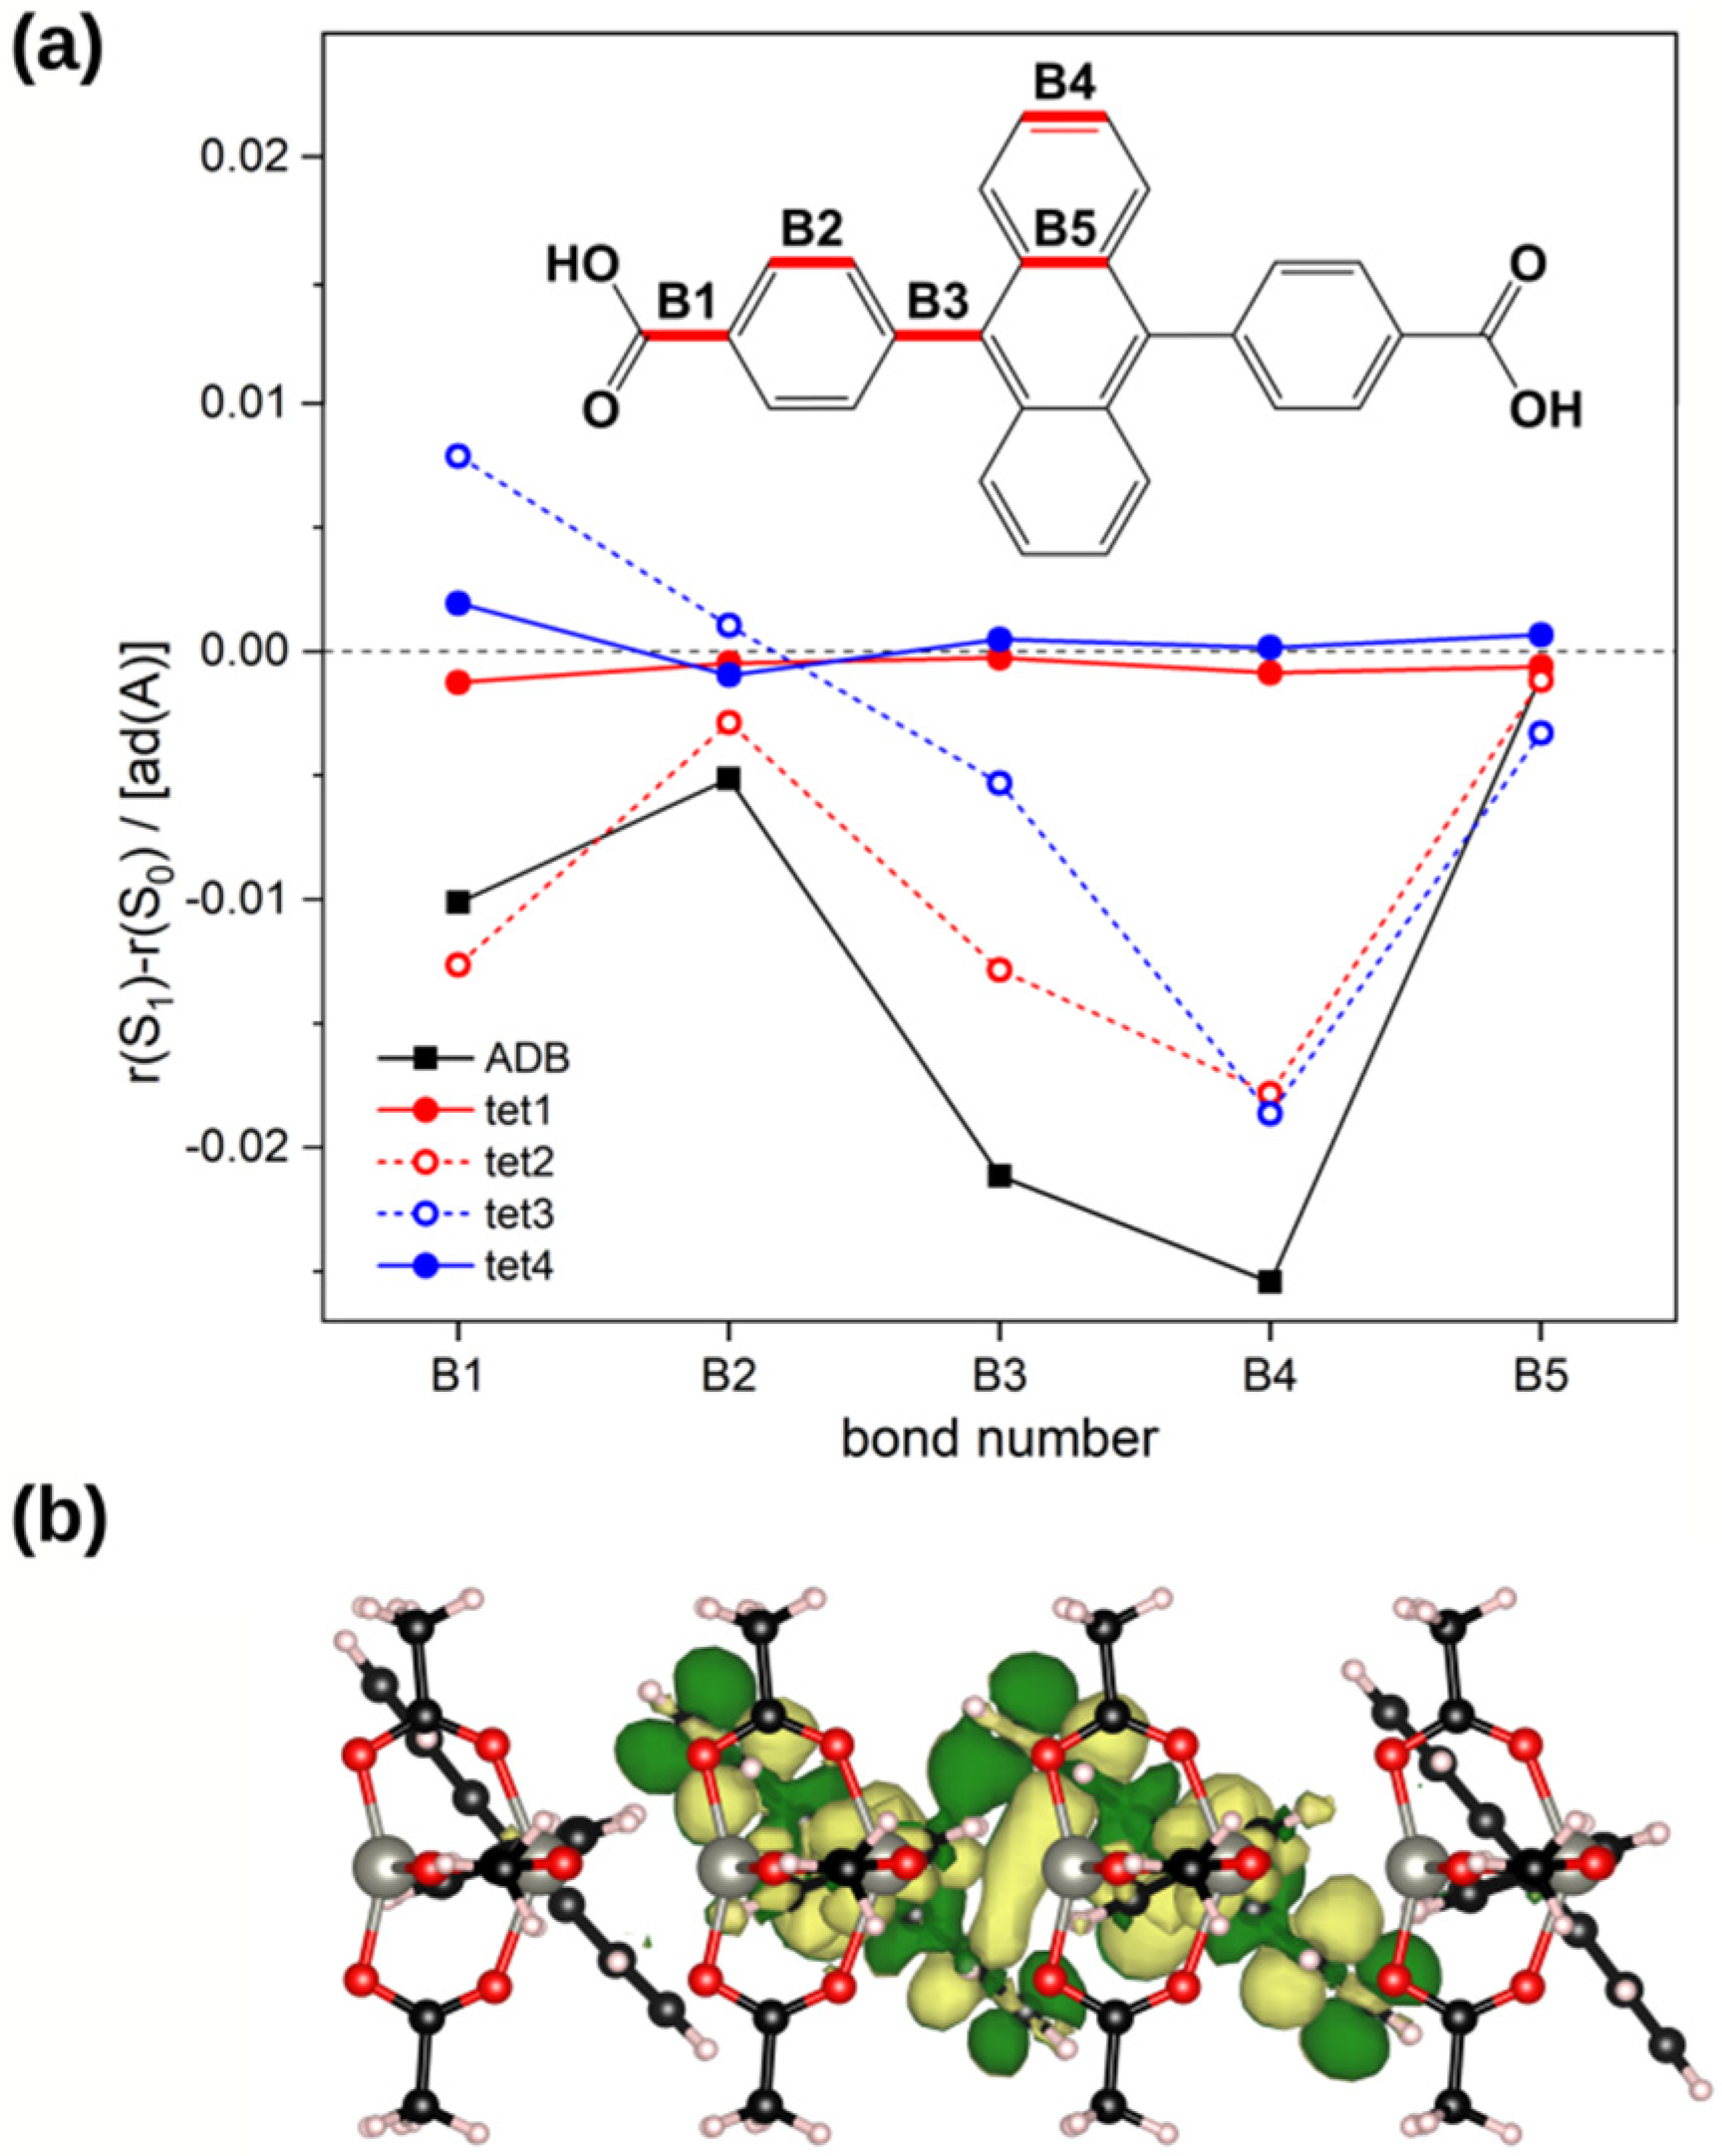
2.5. Explaining the Red-Shifted Emission of ADB Molecules Incorporated into Zn-ADB SURMOF-2
3. Methods
4. Conclusions
Supplementary Materials
Author Contributions
Funding
Acknowledgments
Conflicts of Interest
References
- Furukawa, H.; Cordova, K.E.; O’Keeffe, M.; Yaghi, O.M. The chemistry and applications of metal-organic frameworks. Science 2013, 341, 1230444. [Google Scholar] [CrossRef] [PubMed]
- Moghadam, P.Z.; Li, A.; Liu, X.W.; Bueno-Perez, R.; Wang, S.D.; Wiggin, S.B.; Wood, P.A.; Fairen-Jimenez, D. Targeted classification of metal–organic frameworks in the Cambridge structural database (CSD). Chem. Sci. 2020, 11, 8373–8387. [Google Scholar] [CrossRef]
- Liu, J.; Chen, L.; Cui, H.; Zhang, J.; Zhang, L.; Su, C.Y. Applications of metal–organic frameworks in heterogeneous supramolecular catalysis. Chem. Soc. Rev. 2014, 43, 6011–6061. [Google Scholar] [CrossRef] [PubMed]
- Zhu, L.; Liu, X.Q.; Jiang, H.L.; Sun, L.B. Metal–Organic frameworks for heterogeneous basic catalysis. Chem. Rev. 2017, 117, 8129–8176. [Google Scholar] [CrossRef] [PubMed]
- Pascanu, V.; Miera, G.G.; Inge, A.K.; Martín-Matute, B. Metal-organic frameworks as catalysts for organic synthesis: A critical perspective. J. Am. Chem. Soc. 2019, 141, 7223–7234. [Google Scholar] [CrossRef]
- Eddaoudi, M.; Kim, J.; Rosi, N.; Vodak, D.; Wachter, J.; O’Keeffe, M.; Yaghi, O.M. Systematic design of pore size and functionality in isoreticular MOFs and their application in methane storage. Science 2002, 295, 469–472. [Google Scholar] [CrossRef]
- Rowsell, J.L.C.; Yaghi, O.M. Effects of functionalization, catenation, and variation of the metal oxide and organic linking units on the low-pressure hydrogen adsorption properties of metal-organic frameworks. J. Am. Chem. Soc. 2006, 128, 1304–1315. [Google Scholar] [CrossRef]
- Murray, L.J.; Dincă, M.; Long, J.R. Hydrogen storage in metal–organic frameworks. Chem. Soc. Rev. 2009, 38, 1294–1314. [Google Scholar] [CrossRef]
- Chen, B.; Liang, C.; Yang, J.; Contreras, D.S.; Clancy, Y.L.; Lobkovsky, E.B.; Yaghi, O.M.; Dai, S. A Microporous metal-organic framework for gas-chromatographic separation of alkanes. Angew. Chem. Int. Ed. 2006, 45, 1390–1393. [Google Scholar] [CrossRef]
- Bloch, E.D.; Queen, W.L.; Krishna, R.; Zadrozny, J.M.; Brown, C.M.; Long, J.R. Hydrocarbon separations in a metal-organic framework with open iron (II) coordination sites. Science 2012, 335, 1606–1610. [Google Scholar] [CrossRef]
- Sun, L.; Campbell, M.G.; Dincă, M. Electrically conductive porous metal-organic frameworks. Angew. Chem. Int. Ed. 2016, 55, 3566–3579. [Google Scholar] [CrossRef] [PubMed]
- Allendorf, M.; Foster, M.E.; Leonard, F.; Stavila, V.; Feng, P.L.; Doty, F.P.; Leong, K.; Ma, E.Y.; Johnston, S.R.; Talin, A.A. Guest-induced emergent properties in metal-organic frameworks. J. Phys. Chem. Lett. 2015, 6, 1182–1195. [Google Scholar] [CrossRef] [PubMed]
- Haldar, R.; Heinke, L.; Wöll, C. Advanced photoresponsive materials using the metal-organic framework approach. Adv. Mater. 2019, 32, e1905227. [Google Scholar] [CrossRef] [PubMed]
- Xie, L.S.; Skorupskii, G.; Dincă, M. Electrically conductive metal-organic frameworks. Chem. Rev. 2020, 120, 8536–8580. [Google Scholar] [CrossRef]
- Haldar, R.; Sastre-Santos, A.; Howard, I.A.; Richards, B.S.; Martin-Gomis, L.; Wöll, C.; Herrero, D.; Joseph, R.; Fu, Z.H. Guest-responsive polaritons in porous framework: Chromophoric sponges in optical QED cavities. Chem. Sci. 2020, 11, 7972–7978. [Google Scholar] [CrossRef]
- Stassen, I.; Burtch, N.C.; Talin, A.; Falcaro, P.; Allendorf, M.; Ameloot, R. An updated roadmap for the integration of metal–organic frameworks with electronic devices and chemical sensors. Chem. Soc. Rev. 2017, 46, 3185–3241. [Google Scholar] [CrossRef]
- Kreno, L.E.; Leong, K.; Farha, O.K.; Allendorf, M.; Van Duyne, R.P.; Hupp, J.T. Metal-organic framework materials as chemical sensors. Chem. Rev. 2012, 112, 1105–1125. [Google Scholar] [CrossRef]
- Son, H.-J.; Jin, S.; Patwardhan, S.; Wezenberg, S.J.; Jeong, N.C.; So, M.; Wilmer, C.E.; Sarjeant, A.A.; Schatz, G.C.; Snurr, R.Q.; et al. Light-harvesting and ultrafast energy migration in porphyrin-based metal-organic frameworks. J. Am. Chem. Soc. 2013, 135, 862–869. [Google Scholar] [CrossRef]
- Zhang, T.; Lin, W. Metal–organic frameworks for artificial photosynthesis and photocatalysis. Chem. Soc. Rev. 2014, 43, 5982–5993. [Google Scholar] [CrossRef]
- Oldenburg, M.; Turshatov, A.; Busko, D.; Wollgarten, S.; Adams, M.; Baroni, N.; Welle, A.; Redel, E.; Wöll, C.; Richards, B.S.; et al. Photon upconversion at crystalline organic-organic heterojunctions. Adv. Mater. 2016, 28, 8477–8482. [Google Scholar] [CrossRef]
- Allendorf, M.D.; Bauer, C.A.; Bhakta, R.K.; Houk, R.J.T. Luminescent metal-organic frameworks. Chem. Soc. Rev. 2009, 38, 1330–1352. [Google Scholar] [CrossRef] [PubMed]
- Haldar, R.; Mazel, A.; Krstić, M.; Zhang, Q.; Jakoby, M.; Howard, I.A.; Richards, B.S.; Jung, N.; Jacquemin, D.; Diring, S.; et al. A de novo strategy for predictive crystal engineering to tune excitonic coupling. Nat. Commun. 2019, 10, 1–7. [Google Scholar] [CrossRef] [PubMed]
- Kuc, A.; Springer, M.A.; Batra, K.; Juarez-Mosqueda, R.; Wöll, C.; Heine, T. Proximity effect in crystalline framework materials: Stacking-induced functionality in MOFs and COFs. Adv. Funct. Mater. 2020, 1908004. [Google Scholar] [CrossRef]
- Manna, B.; Nandi, A. Exploration of photophysics and presence of Long singlet exciton diffusion length in dibenz[a,h]anthracene nanoaggregates. J. Photochem. Photobiol. A Chem. 2020, 392, 112407. [Google Scholar] [CrossRef]
- Más-Montoya, M.; Janssen, R.A.J. The effect of H- and J-aggregation on the photophysical and photovoltaic properties of small thiophene-pyridine-DPP molecules for bulk-heterojunction solar cells. Adv. Funct. Mater. 2017, 27, 1605779. [Google Scholar] [CrossRef]
- Tamai, Y.; Ohkita, H.; Benten, H.; Ito, S. Exciton diffusion in conjugated polymers: From fundamental understanding to improvement in photovoltaic conversion efficiency. J. Phys. Chem. Lett. 2015, 6, 3417–3428. [Google Scholar] [CrossRef]
- Menke, S.M.; Holmes, R.J. Exciton diffusion in organic photovoltaic cells. Energy Environ. Sci. 2014, 7, 499–512. [Google Scholar] [CrossRef]
- Zhang, Q.; Zhang, C.; Cao, L.; Wang, Z.; An, B.; Lin, Z.; Huang, R.; Zhang, Z.; Wang, C.; Lin, W. Förster energy transport in metal-organic frameworks is beyond step-by-step hopping. J. Am. Chem. Soc. 2016, 138, 5308–5315. [Google Scholar] [CrossRef]
- Adams, M.; Kozlowska, M.; Baroni, N.; Oldenburg, M.; Ma, R.; Busko, D.; Turshatov, A.; Emandi, G.; Senge, M.O.; Haldar, R.; et al. Highly efficient one-dimensional triplet exciton transport in a palladium–Porphyrin-based surface-anchored metal-organic framework. ACS Appl. Mater. Interfaces 2019, 11, 15688–15697. [Google Scholar] [CrossRef]
- Thomas, R.; Varghese, S.; Kulkarni, G.U. The influence of crystal packing on the solid state fluorescence behavior of alkyloxy substituted phenyleneethynylenes. J. Mater. Chem. 2009, 19, 4401–4406. [Google Scholar] [CrossRef]
- Zhang, H.Y.; Zhang, Z.L.; Ye, K.Q.; Zhang, J.Y.; Wang, Y. Organic crystals with tunable emission colors based on a single organic molecule and different molecular packing structures. Adv. Mater. 2006, 18, 2369–2372. [Google Scholar] [CrossRef]
- Varghese, S.; Das, S. Role of molecular packing in determining solid-state optical properties of π-conjugated materials. J. Phys. Chem. Lett. 2011, 2, 863–873. [Google Scholar] [CrossRef] [PubMed]
- Hinoue, T.; Shigenoi, Y.; Sugino, M.; Mizobe, Y.; Hisaki, I.; Miyata, M.; Tohnai, N. Regulation of π-stacked anthracene arrangement for fluorescence modulation of organic solid from monomer to excited oligomer emission. Chem. A Eur. J. 2012, 18, 4634–4643. [Google Scholar] [CrossRef] [PubMed]
- Li, J.; Yuan, S.; Qin, J.S.; Huang, L.; Bose, R.; Pang, J.; Zhang, P.; Xiao, Z.; Tan, K.; Malko, A.V.; et al. Fluorescence enhancement in the solid state by isolating perylene fluorophores in metal-organic frameworks. ACS Appl. Mater. Interfaces 2020, 12, 26727–26732. [Google Scholar] [CrossRef] [PubMed]
- Calahorro, A.J.; Sebastián, E.S.; Salinas-Castillo, A.; Seco, J.M.; Mendicute-Fierro, C.; Fernández, B.; Rodríguez-Diéguez, A. Effect of π–π stacking interactions on the emission properties of cadmium metal–organic frameworks based on 1,4-bis(4-pyridyl)-2,3-diaza-1,3-butadiene. CrystEngComm 2015, 17, 3659–3666. [Google Scholar] [CrossRef]
- Keller, N.; Calik, M.; Sharapa, D.I.; Soni, H.R.; Zehetmaier, P.M.; Rager, S.; Auras, F.; Jakowetz, A.C.; Görling, A.; Clark, T.; et al. Enforcing extended porphyrin J-aggregate stacking in covalent organic frameworks. J. Am. Chem. Soc. 2018, 140, 16544–16552. [Google Scholar] [CrossRef]
- Kharissova, O.V.; Kharisov, B.I.; González, L.T. Recent trends on density functional theory–assisted calculations of structures and properties of metal–organic frameworks and metal–organic frameworks-derived nanocarbons. J. Mater. Res. 2020, 35, 1424–1438. [Google Scholar] [CrossRef]
- Gu, Z.G.; Heinke, L.; Wöll, C.; Neumann, T.; Wenzel, W.; Li, Q.; Fink, K.; Gordan, O.D.; Zahn, D.R. Experimental and theoretical investigations of the electronic band structure of metal-organic frameworks of HKUST-1 type. Appl. Phys. Lett. 2015, 107, 2–7. [Google Scholar] [CrossRef]
- Kamencek, T.; Bedoya-Martínez, O.N.; Zojer, K. Understanding phonon properties in isoreticular metal-organic frameworks from first principles. Phys. Rev. Mater. 2019, 3, 116003. [Google Scholar] [CrossRef]
- Wilbraham, L.; Coudert, F.X.; Ciofini, I. Modelling photophysical properties of metal–organic frameworks: A density functional theory based approach. Phys. Chem. Chem. Phys. 2016, 18, 25176–25182. [Google Scholar] [CrossRef]
- Heinrich, G.; Schoof, S.; Güsten, H. 9,10-diphenylanthracene as a fluorescence quantum yield standard. J. Photochem. 1974, 3, 315–320. [Google Scholar] [CrossRef]
- Morris, J.V.; Mahaney, M.A.; Huber, J.R. Fluorescence quantum yield determinations. 9,10-Diphenylanthracene as a reference standard in different solvents. J. Phys. Chem. 1976, 80, 969–974. [Google Scholar] [CrossRef]
- Rowe, J.M.; Hay, J.M.; Maza, W.; Chapleski, R.C.; Soderstrom, E.; Troya, D.; Morris, A.J. Systematic investigation of the excited-state properties of anthracene-dicarboxylic acids. J. Photochem. Photobiol. A Chem. 2017, 337, 207–215. [Google Scholar] [CrossRef]
- Abd-El-Aziz, A.S.; AbdelGhani, A.; Wagner, B.D.; Pearson, J.K.; Awad, M. Design of blue fluorescence emitter star-shaped macromolecules based on pyrene and anthracene. Polymers 2016, 98, 210–228. [Google Scholar] [CrossRef]
- Huang, J.; Su, J.; Tian, H. The development of anthracene derivatives for organic light-emitting diodes. J. Mater. Chem. 2012, 22, 10977–10989. [Google Scholar] [CrossRef]
- Huang, N.; Ding, X.; Kim, J.; Ihee, H.; Jiang, D. A photoresponsive smart covalent organic framework. Angew. Chem. Int. Ed. 2015, 54, 8704–8707. [Google Scholar] [CrossRef]
- Liu, X.; Liu, B.; Li, G.; Liu, Y. Two anthracene-based metal-organic frameworks for highly effective photodegradation and luminescent detection in water. J. Mater. Chem. A 2018, 6, 17177–17185. [Google Scholar] [CrossRef]
- Zeng, J.-Y.; Wang, X.-S.; Qi, Y.-D.; Yu, Y.; Zeng, X.; Zhang, X. Structural transformation in metal-organic frameworks for reversible binding of oxygen. Angew. Chem. 2019, 131, 5748–5752. [Google Scholar] [CrossRef]
- Liu, J.-X.; Lukose, B.; Shekhah, O.; Arslan, H.K.; Weidler, P.; Gliemann, H.; Bräse, S.; Grosjean, S.; Godt, A.; Feng, X.; et al. A novel series of isoreticular metal organic frameworks: Realizing metastable structures by liquid phase epitaxy. Sci. Rep. 2012, 2, srep00921. [Google Scholar] [CrossRef]
- Oldenburg, M.; Turshatov, A.; Busko, D.; Jakoby, M.; Haldar, R.; Chen, K.; Emandi, G.; Senge, M.O.; Wöll, C.; Hodgkiss, J.M.; et al. Enhancing the photoluminescence of surface anchored metal–organic frameworks: Mixed linkers and efficient acceptors. Phys. Chem. Chem. Phys. 2018, 20, 11564–11576. [Google Scholar] [CrossRef]
- Haldar, R.; Jakoby, M.; Mazel, A.; Zhang, Q.; Welle, A.; Mohamed, T.; Krolla, P.; Wenzel, W.; Diring, S.; Odobel, F.; et al. Anisotropic energy transfer in crystalline chromophore assemblies. Nat. Commun. 2018, 9, 1–8. [Google Scholar] [CrossRef] [PubMed]
- Spano, F.C. The spectral signatures of frenkel polarons in H- and J-aggregates. Acc. Chem. Res. 2010, 43, 429–439. [Google Scholar] [CrossRef]
- Gierschner, J.; Lüer, L.; Milián-Medina, B.; Oelkrug, D.; Egelhaaf, H.J. Highly emissive H-aggregates or aggregation-induced emission quenching? The photophysics of all-trans para-distyrylbenzene. J. Phys. Chem. Lett. 2013, 4, 2686–2697. [Google Scholar] [CrossRef]
- Gierschner, J.; Cornil, J.; Egelhaaf, H.J. Optical bandgaps of π-conjugated organic materials at the polymer limit: Experiment and theory. Adv. Mater. 2007, 19, 173–191. [Google Scholar] [CrossRef]
- Taniguchi, M.; Lindsey, J.S. Database of absorption and fluorescence spectra of >300 common compounds for use in PhotochemCAD. Photochem. Photobiol. 2018, 94, 290–327. [Google Scholar] [CrossRef] [PubMed]
- Meech, S.R.; Phillips, D. Photophysics of some common fluorescence standards. J. Photochem. 1983, 23, 193–217. [Google Scholar] [CrossRef]
- Gustav, K. Molecular geometry and excited electronic states. J. Mol. Struct. THEOCHEM 1984, 110, 219–228. [Google Scholar] [CrossRef]
- Kasha, M.; Rawls, H.R.; El-Bayoumi, M.A. The exciton model in molecular spectroscopy. Pure Appl. Chem. 1965, 11, 371–392. [Google Scholar] [CrossRef]
- Kazmaier, P.M.; Hoffmann, R. A Theoretical study of crystallochromy. Quantum interference effects in the spectra of perylene pigments. J. Am. Chem. Soc. 1994, 116, 9684–9691. [Google Scholar] [CrossRef]
- Bredas, J.L.; Calbert, J.P.; Silva-Filho, D.; Cornil, J. Organic semiconductors: A theoretical characterization of the basic parameters governing charge transport. Proc. Natl. Acad. Sci. USA 2002, 99, 5804–5809. [Google Scholar] [CrossRef]
- Kwon, O.; Coropceanu, V.; Gruhn, N.E.; Durivage, J.C.; Laquindanum, J.G.; Katz, H.E.; Cornil, J.; Brédas, J.L. Characterization of the molecular parameters determining charge transport in anthradithiophene. J. Chem. Phys. 2004, 120, 8186–8194. [Google Scholar] [CrossRef]
- Lemaur, V.; Silva-Filho, D.; Coropceanu, V.; Lehmann, M.; Geerts, Y.; Piris, J.; Debije, M.G.; Van De Craats, A.M.; Senthilkumar, K.; Siebbeles, L.D.A.; et al. Charge transport properties in discotic liquid crystals: A quantum-chemical insight into structure−Property relationships. J. Am. Chem. Soc. 2004, 126, 3271–3279. [Google Scholar] [CrossRef] [PubMed]
- Aliaga-Gosalvez, M.J.; Demitri, N.; Dohr, M.; Roldao, J.C.; Park, S.K.; Oh, S.; Varghese, S.; Park, S.Y.; Olivier, Y.; Milián-Medina, B.; et al. Crossed 2D versus slipped 1D π-stacking in polymorphs of crystalline organic thin films: Impact on the electronic and optical response. Adv. Opt. Mater. 2019, 7, 1900749. [Google Scholar] [CrossRef]
- Perdew, J.P.; Burke, K.; Ernzerhof, M. Generalized gradient approximation made simple. Phys. Rev. Lett. 1996, 77, 3865–3868. [Google Scholar] [CrossRef] [PubMed]
- Adamo, C.; Barone, V. Toward reliable density functional methods without adjustable parameters: The PBE0 model. J. Chem. Phys. 1999, 110, 6158–6170. [Google Scholar] [CrossRef]
- Zojer, K.; Buchacher, P.; Wudl, F.; Cornil, J.; Calbert, J.P.; Brédas, J.L.; Leising, G. Excited state localization in organic molecules consisting of conjugated and nonconjugated segments. J. Chem. Phys. 2000, 113, 10002–10012. [Google Scholar] [CrossRef]
- Tretiak, S.; Saxena, A.; Martin, R.L.; Bishop, A.R. Conformational dynamics of photoexcited conjugated molecules. Phys. Rev. Lett. 2002, 89, 097402. [Google Scholar] [CrossRef] [PubMed]
- Cornil, J.; Dos Santos, D.A.; Crispin, X.; Silbey, R.; Bredas, J.L. Influence of interchain interactions on the absorption and luminescence of conjugated oligomers and polymers: A quantum-chemical characterization. J. Am. Chem. Soc. 1998, 120, 1289–1299. [Google Scholar] [CrossRef]
- Neese, F. The ORCA program system. Wiley Interdiscip. Rev. Comput. Mol. Sci. 2011, 2, 73–78. [Google Scholar] [CrossRef]
- Weigend, F.; Ahlrichs, R. Balanced basis sets of split valence, triple zeta valence and quadruple zeta valence quality for H to Rn: Design and assessment of accuracy. Phys. Chem. Chem. Phys. 2005, 7, 3297–3305. [Google Scholar] [CrossRef]
- Grimme, S.; Antony, J.; Ehrlich, S.; Krieg, H. A consistent and accurate ab initio parametrization of density functional dispersion correction (DFT-D) for the 94 elements H-Pu. J. Chem. Phys. 2010, 132, 154104. [Google Scholar] [CrossRef] [PubMed]
- Hirata, S.; Head-Gordon, M. Time-dependent density functional theory within the Tamm–Dancoff approximation. Chem. Phys. Lett. 1999, 314, 291–299. [Google Scholar] [CrossRef]
- Marenich, A.V.; Cramer, C.J.; Truhlar, D.G. Universal solvation model based on solute electron density and on a continuum model of the solvent defined by the bulk dielectric constant and atomic surface tensions. J. Phys. Chem. B 2009, 113, 6378–6396. [Google Scholar] [CrossRef] [PubMed]
- Blum, V.; Gehrke, R.; Hanke, F.; Havu, P.; Havu, V.; Ren, X.; Reuter, K.; Scheffler, M. Ab initio molecular simulations with numeric atom-centered orbitals. Comput. Phys. Commun. 2009, 180, 2175–2196. [Google Scholar] [CrossRef]
- Van Lenthe, E.; Van Leeuwen, R.; Baerends, E.J.; Snijders, J.G. Relativistic regular two-component Hamiltonians. Int. J. Quantum Chem. 1996, 57, 281–293. [Google Scholar] [CrossRef]
- Tkatchenko, A.; Scheffler, M. Accurate molecular van der waals interactions from ground-state electron density and free-atom reference data. Phys. Rev. Lett. 2009, 102, 6–9. [Google Scholar] [CrossRef]
Sample available: Samples of Zn-ADB are available from the authors. |

| Energy/eV (Oscillator Strength) | ||
|---|---|---|
| Absorption | Experiment | Calculation |
| Anthracene (gas) | - | 3.48 (0.085) |
| DPA (gas) | - | 3.36 (0.201) |
| ADB (gas) | - | 3.33 (0.255) |
| ADB (ethanol ε = 24.3) | 3.32 | 3.35 (0.245) |
| ADB (toluene ε = 2.4) | 3.33 | 3.35 (0.245) |
| Zn-ADB SURMOF-2 | 3.27 | |
| Emission | ||
| ADB (gas) | - | 2.78 (0.531) |
| ADB (ethanol) | 2.87 | 2.73 (0.530) |
| Zn-ADB SURMOF-2 | 2.63 | |
| Energy/eV (Oscillator Strength) | |||
|---|---|---|---|
| Monomer | 3.48 (0.085) | ||
| Unit Cell Direction | |||
| J-aggregate (a and b direction) 19.81 Å | H-aggregate (a and b direction) 19.81 Å | H-aggregate (c-direction) 5.82 Å | |
| Dimer | S1: 3.48 (0.172) S2: 3.48 (0.000) | S1: 3.48 (0.000) S2: 3.48 (0.170) | S1: 3.16 (0.024) S4: 3.55 (0.115) |
| Tetramer | S1: 3.48 (0.333) S3: 3.48 (0.014) | S1: 3.48 (0.000) S4: 3.48 (0.323) | S1: 3.06 (0.029) S14: 3.60 (0.120) |
| System | State | Energy/eV (Oscillator Strength) | MO Contributions with Coefficients |
|---|---|---|---|
| anthracene | Sa | 2.75 (0.000) | 0.98 OS→UA + 0.16 OA→US |
| dimer | Sb | 3.11 (0.001) | 0.76 OA→UA + 0.65 OS→US |
| (slip 0.0 Å) | Sc | 3.53 (0.124) | 0.72 OS→US − 0.62 OA→UA |
| Sd | 3.76 (0.000) | 0.97 OA→US − 0.13 OS→UA | |
| anthracene | Sb | 3.16 (0.024) | 0.92 OA→UA + 0.36 OS→US |
| dimer | Sa | 3.22 (0.000) | 0.80 OS→UA + 0.59 OA→US |
| (slip 4.42 Å) | Sd | 3.46 (0.000) | 0.78 OA→US − 0.57 OS→UA |
| Sc | 3.55 (0.112) | 0.91 OS→US − 0.32 OA→UA |
| System | State | Energy/ev (Oscillator Strength) | Mo Contributions with Coefficients |
|---|---|---|---|
| opt(pw-ADB-pw)1 | S1 | 3.35 (0.296) | 0.96 H→L |
| cut(pw-ADB-pw)1 | S1 | 3.18 (0.453) | 0.96 H→L |
| cut(pw-ADB-pw)2 | Sb | 2.93 (0.124) | 0.92 OA→UA + 0.33 OS→US |
| Sa | 2.99 (0.006) | 0.80 OS→UA + 0.58 OA→US | |
| Sd | 3.14 (0.000) | 0.79 OA→US − 0.56 OS→UA | |
| Sc | 3.26 (0.658) | 0.90 OS→US − 0.31 OA→UA | |
| cut(pw-ADB-pw)4 | S1 | 2.86 (0.162) | 0.94 OAAA→UAAA |
| S9 | 3.22 (0.332) | 0.69 OASA→UASA + 0.40 OSAS→USAS | |
| S14 | 3.32 (0.715) | 0.71 OSSS→USSS + 0.47 OSAS→USAS |
| System | State | Energy/ev Oscillator Strength | Mo Contributions with Coefficients |
|---|---|---|---|
| S1,cut(pw-ADB-pw)1 | S1 | 2.90 (0.557) | 0.96 H→L |
| S1(pw-ADB-pw)4 | S1 | 2.49 (0.060) | 0.93 OAAA→UAAA |
© 2020 by the authors. Licensee MDPI, Basel, Switzerland. This article is an open access article distributed under the terms and conditions of the Creative Commons Attribution (CC BY) license (http://creativecommons.org/licenses/by/4.0/).
Share and Cite
Windischbacher, A.; Steiner, L.; Haldar, R.; Wöll, C.; Zojer, E.; Kelterer, A.-M. Exciton Coupling and Conformational Changes Impacting the Excited State Properties of Metal Organic Frameworks. Molecules 2020, 25, 4230. https://doi.org/10.3390/molecules25184230
Windischbacher A, Steiner L, Haldar R, Wöll C, Zojer E, Kelterer A-M. Exciton Coupling and Conformational Changes Impacting the Excited State Properties of Metal Organic Frameworks. Molecules. 2020; 25(18):4230. https://doi.org/10.3390/molecules25184230
Chicago/Turabian StyleWindischbacher, Andreas, Luca Steiner, Ritesh Haldar, Christof Wöll, Egbert Zojer, and Anne-Marie Kelterer. 2020. "Exciton Coupling and Conformational Changes Impacting the Excited State Properties of Metal Organic Frameworks" Molecules 25, no. 18: 4230. https://doi.org/10.3390/molecules25184230
APA StyleWindischbacher, A., Steiner, L., Haldar, R., Wöll, C., Zojer, E., & Kelterer, A.-M. (2020). Exciton Coupling and Conformational Changes Impacting the Excited State Properties of Metal Organic Frameworks. Molecules, 25(18), 4230. https://doi.org/10.3390/molecules25184230


