Surface Oxidation of Nano-Silicon as a Method for Cycle Life Enhancement of Li-ion Active Materials


Abstract
1. Introduction
2. Materials and Methods
3. Results and Discussion
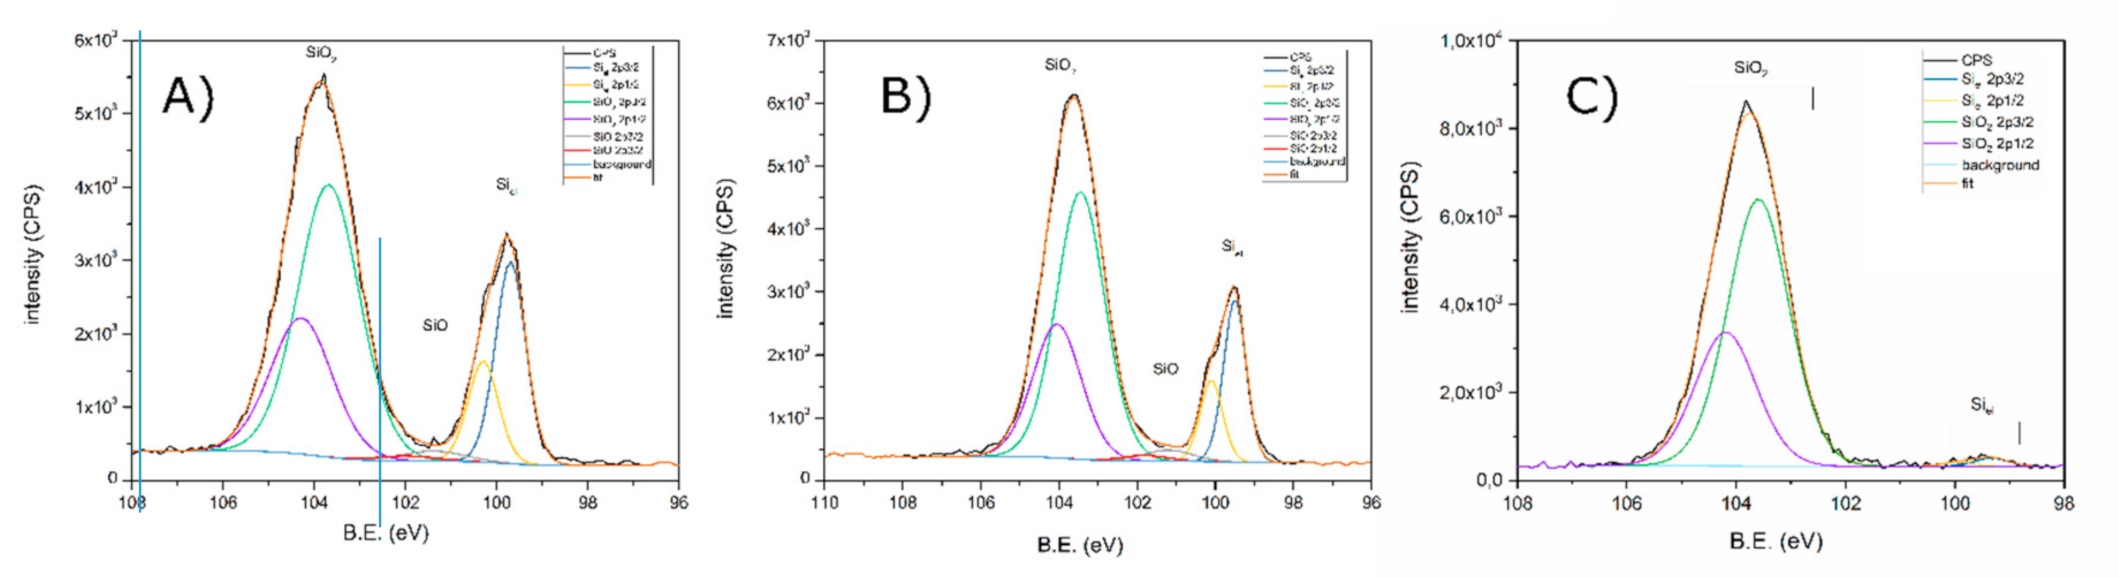
3.1. X-ray Photoelectron Spectroscopy
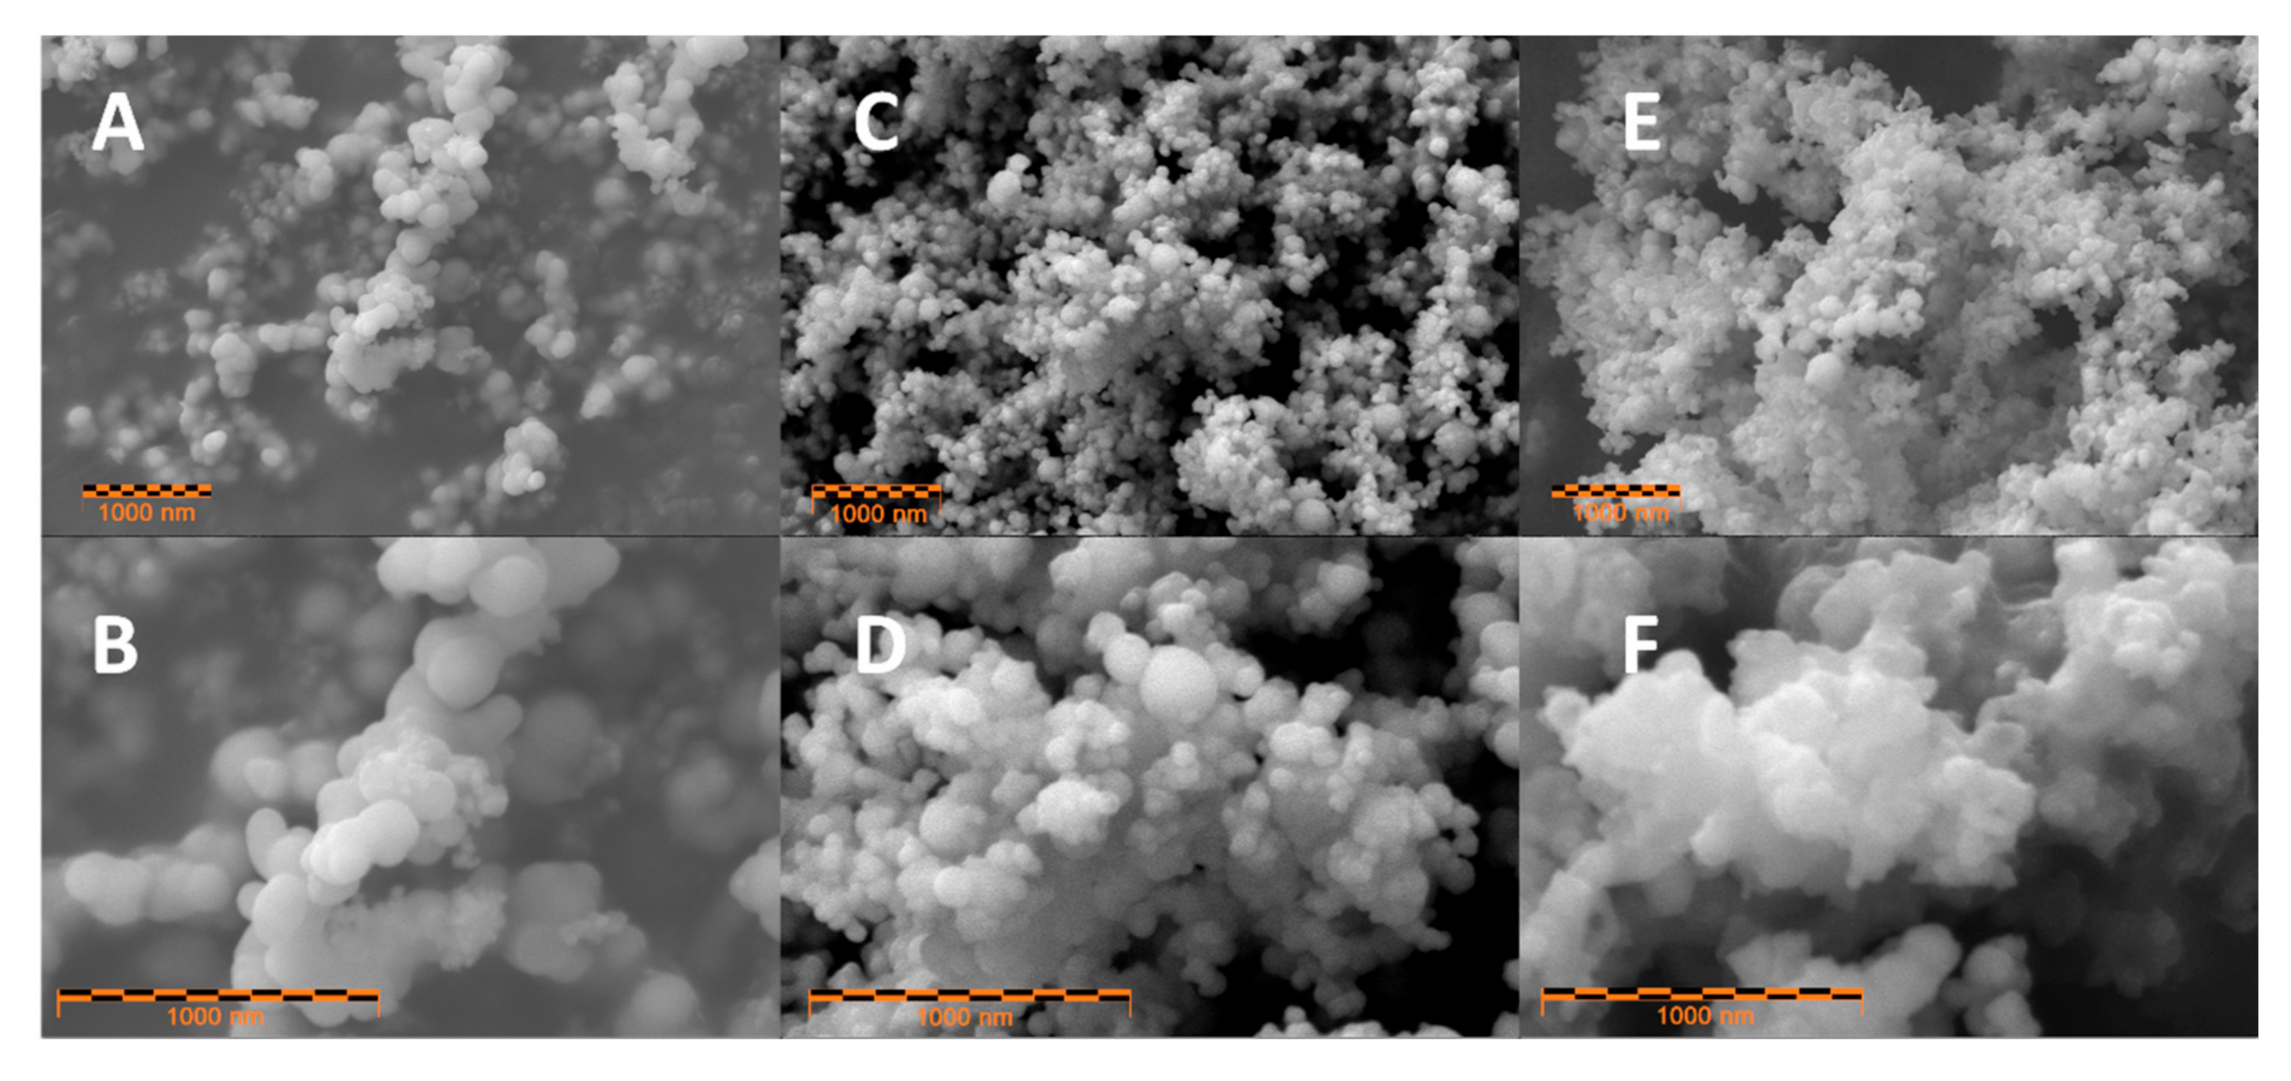
3.2. SEM Microscopy
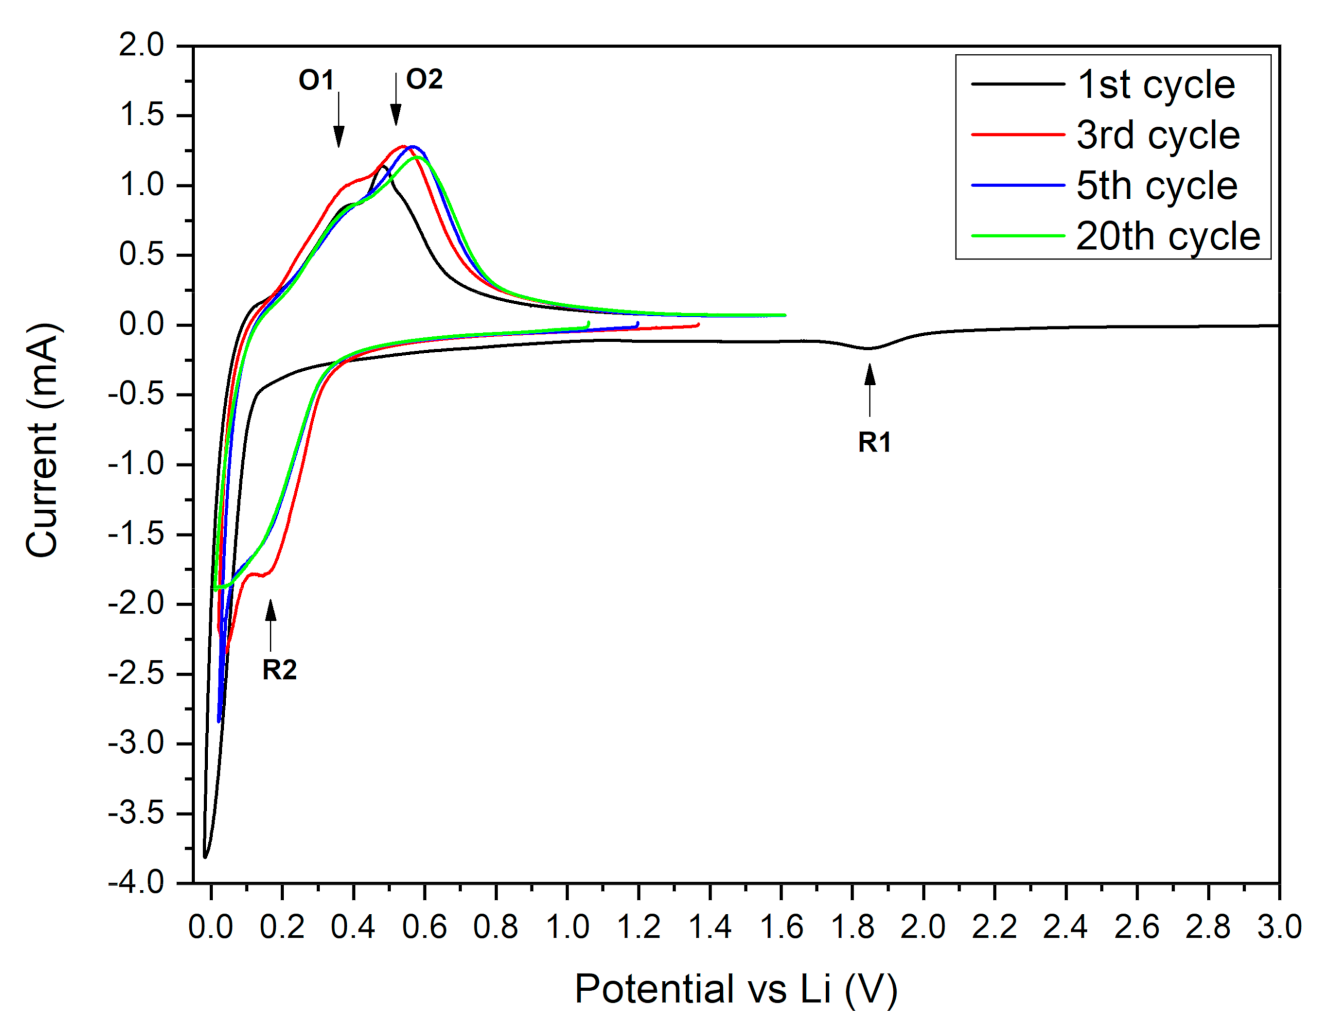
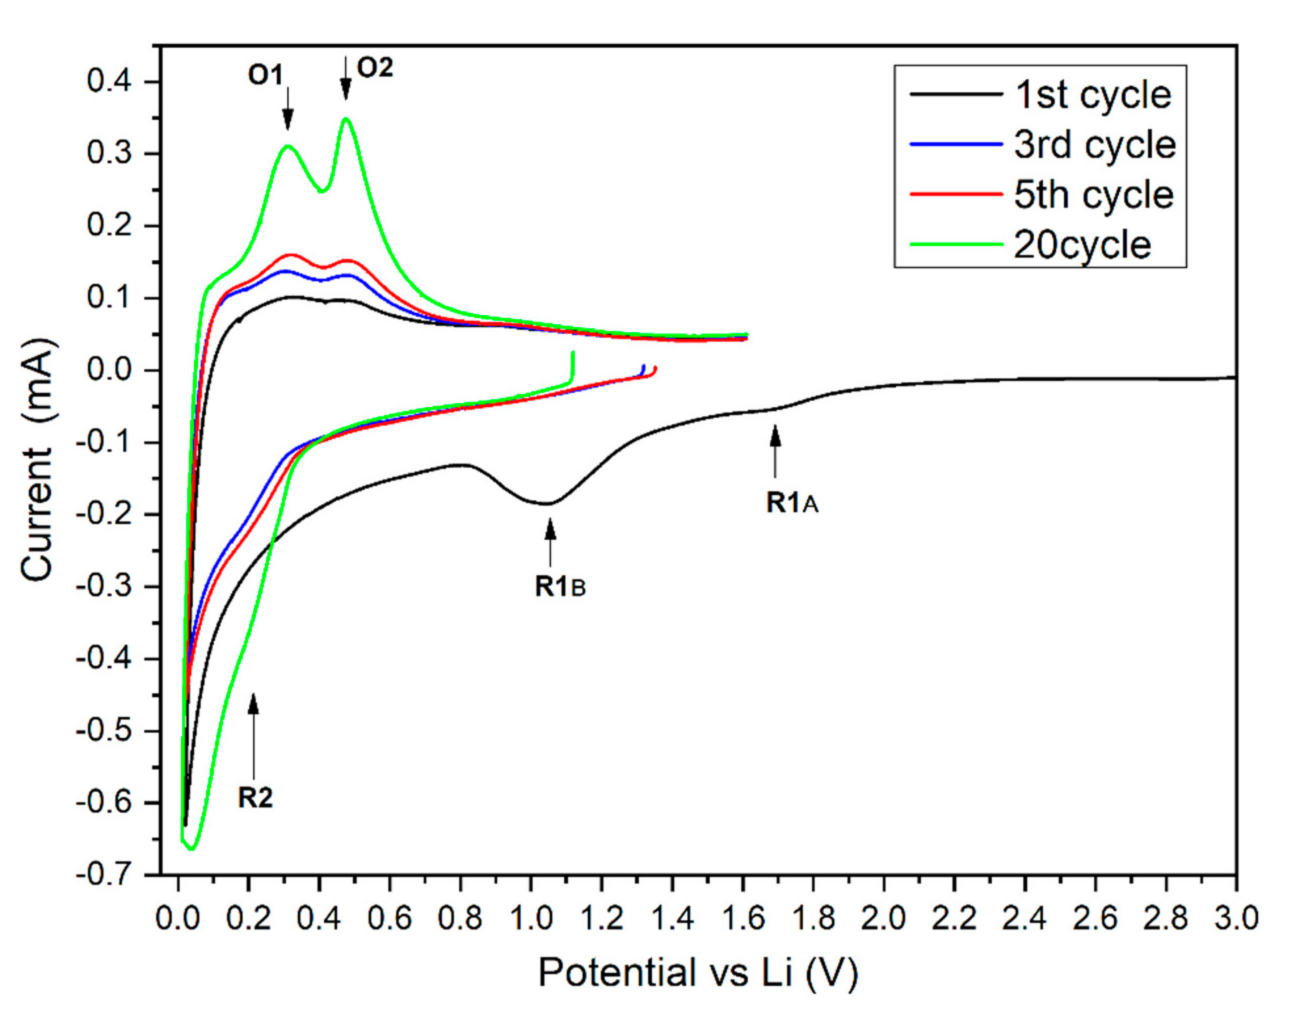
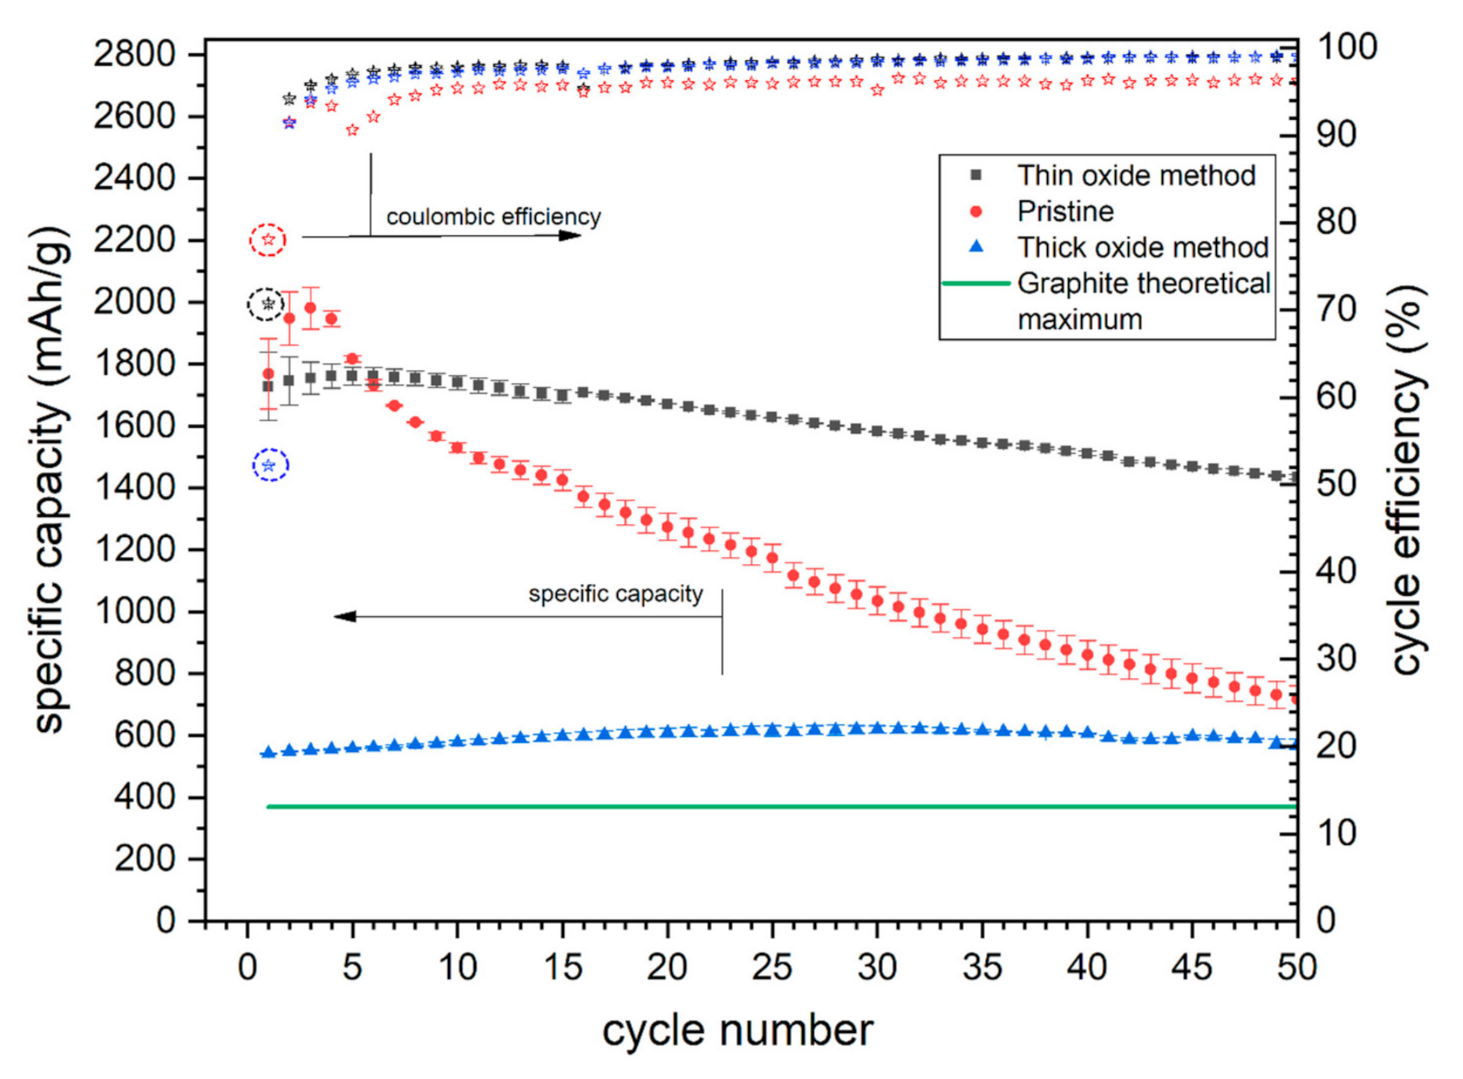
3.3. Electrochemical Results
4. Conclusions
Supplementary Materials
Author Contributions
Funding
Conflicts of Interest
References
- Nitta, N.; Wu, F.; Lee, J.T.; Yushin, G. Li-ion battery materials: Present and future. Mater. Today 2015, 18, 252–264. [Google Scholar] [CrossRef]
- Ratynski, M.; Hamankiewicz, B.; Krajewski, M.; Boczar, M.; Ziolkowska, D.; Czerwinski, A. Impact of natural and synthetic graphite milling energy on lithium-ion electrode capacity and cycle life. Carbon 2019, 145, 82–89. [Google Scholar] [CrossRef]
- Pillot, C. Lithium Ion Battery Raw Material Supply & Demand 2016–2025. In Proceedings of the Advanced Automotive Battery Conference, Nice, France, 22–24 October 2019. [Google Scholar]
- Tian, H.; Xin, F.; Wang, X.; He, W.; Han, W. High capacity group-IV elements (Si, Ge, Sn) based anodes for lithium-ion batteries. J. Mater. 2015, 1, 153–169. [Google Scholar] [CrossRef]
- Guler, M.O.; Guzeler, M.; Nalci, D.; Singil, M.; Alkan, E.; Dogan, M.; Guler, A.; Akbulut, H. Freestanding nano crystalline Tin@carbon anode electrodes for high capacity Li-ion batteries. Appl. Surf. Sci. 2018, 446, 122–130. [Google Scholar] [CrossRef]
- Jia, H.; Kloepsch, R.; He, X.; Badillo, J.P.; Gao, P.; Fromm, O.; Placke, T.; Winter, M. Reversible Storage of Lithium in Three-Dimensional Macroporous Germanium. Chem. Mater. 2014, 26, 5683–5688. [Google Scholar] [CrossRef]
- Ratyński, M.; Hamankiewicz, B.; Krajewski, M.; Boczar, M.; Czerwiński, A. The effect of compressive stresses on a silicon electrode’s cycle life in a Li-ion battery. RSC Adv. 2018, 8, 22546–22551. [Google Scholar] [CrossRef]
- Liu, Y.; Ruan, J.; Liu, F.; Fan, Y.; Wang, P. Synthesis of SiOx/C composite with dual interface as Li-ion battery anode material. J. Alloy. Compd. 2019, 802, 704–711. [Google Scholar] [CrossRef]
- Martín-Gil, M.; Rabanal, M.E.; Várez, A.; Kuhn, A.; García-Alvarado, F. Mechanical grinding of Si3N4 to be used as an electrode in lithium batteries. Mater. Lett. 2003, 57, 3063–3069. [Google Scholar] [CrossRef]
- Sun, X.; Liu, Y.; Zhang, J.; Hou, L.; Sun, J.; Yuan, C. Facile construction of ultrathin SnOx nanosheets decorated MXene (Ti3C2) nanocomposite towards Li-ion batteries as high performance anode materials. Electrochim. Acta 2019, 295, 237–245. [Google Scholar] [CrossRef]
- Ratynski, M.; Hamankiewicz, B.; Krajewski, M.; Boczar, M.; Buchberger, A.D.; Czerwiński, A. Electrochemical impedance spectroscopy characterization of silicon-based electrodes for Li-ion batteries. Electrocatalysis 2020, in press. [Google Scholar] [CrossRef]
- Chan, C.K.; Ruffo, R.; Hong, S.S.; Cui, Y. Surface chemistry and morphology of the solid electrolyte interphase on silicon nanowire lithium-ion battery anodes. J. Power Sources 2009, 189, 1132–1140. [Google Scholar] [CrossRef]
- Cui, Z.; Gao, F.; Qu, J. Interface-reaction controlled diffusion in binary solids with applications to lithiation of silicon in lithium-ion batteries. J. Mech. Phys. Solids 2013, 61, 293–310. [Google Scholar] [CrossRef]
- Poluektov, M.; Freidin, A.; Figiel, Ł. Micromechanical modelling of mechanochemical processes in heterogeneous materials. Model. Simul. Mater. Sci. Eng. 2019, 27, 084005. [Google Scholar] [CrossRef]
- Deshpande, R.; Cheng, Y.-T.; Verbrugge, M.W.; Timmons, A. Diffusion Induced Stresses and Strain Energy in a Phase-Transforming Spherical Electrode Particle. J. Electrochem. Soc. 2011, 158, 718–724. [Google Scholar] [CrossRef]
- Sethuraman, V.A.; Srinivasan, V.; Bower, A.F.; Guduru, P.R. In Situ Measurements of Stress-Potential Coupling in Lithiated Silicon. J. Electrochem. Soc. 2010, 157, 1253–1261. [Google Scholar] [CrossRef]
- Tardif, S.; Pavlenko, E.; Quazuguel, L.; Boniface, M. Operando Raman Spectroscopy and Synchrotron X-ray Diffraction of Lithiation/Delithiation in Silicon Nanoparticle Anodes. ACS Nano 2017, 11, 11306–11316. [Google Scholar] [CrossRef]
- Lee, S.W.; McDowell, M.T.; Berla, L.A.; Nix, W.D.; Cui, Y. Fracture of crystalline silicon nanopillars during electrochemical lithium insertion. Proc. Natl. Acad. Sci. USA 2012, 109, 4080–4085. [Google Scholar] [CrossRef]
- McDowell, M.T.; Lee, S.W.; Harris, J.T.; Korgel, B.A. In Situ TEM of Two-Phase Lithiation of Amorphous Silicon Nanospheres. Nano Lett. 2013, 13, 758–764. [Google Scholar] [CrossRef]
- McDowell, M.T.; Ryu, I.; Lee, S.W.; Wang, C.; Nix, W.D.; Cui, Y. Studying the Kinetics of Crystalline Silicon Nanoparticle Lithiation with In Situ Transmission Electron Microscopy. Adv. Mater. 2012, 24, 6034–6041. [Google Scholar] [CrossRef]
- Tong, Y.; Xu, Z.; Liu, C.; Zhang, G.; Wang, J.; Wu, Z.G. Magnetic sputtered amorphous Si/C multilayer thin films as anode materials for lithium ion batteries. J. Power Sources 2014, 247, 78–83. [Google Scholar] [CrossRef]
- Prakash, S.; Zhang, C.; Park, J.D.; Razmjooei, F.; Yu, J.S. Silicon core-mesoporous shell carbon spheres as high stability lithium-ion battery anode. J. Colloid Interface Sci. 2019, 534, 47–54. [Google Scholar] [CrossRef] [PubMed]
- Yi, Y.; Lee, G.H.; Kim, J.C.; Shim, H.W.; Kim, D.W. Tailored silicon hollow spheres with Micrococcus for Li ion battery electrodes. Chem. Eng. J. 2017, 327, 297–306. [Google Scholar] [CrossRef]
- Jung, S.; Jung, H. Efficient lithium storage of concave graphitic anode embedded with nanoconfined silicon. Chem. Phys. Lett. 2018, 706, 189–195. [Google Scholar] [CrossRef]
- Hansen, S.; Quiroga-González, E.; Carstensen, J.; Föll, H. Size-dependent cyclic voltammetry study of silicon microwire anodes for lithium ion batteries. Electrochim. Acta 2016, 217, 283–291. [Google Scholar] [CrossRef]
- Quiroga-González, E.; Carstensen, J.; Föll, H. Good cycling performance of high-density arrays of Si microwires as anodes for Li ion batteries. Electrochim. Acta 2013, 101, 93–98. [Google Scholar] [CrossRef]
- Chan, C.K.; Peng, H.; Liu, G.; McIlwrath, K.; Zhang, X.F.; Huggins, R.A.; Cui, Y. High-performance lithium battery anodes using silicon nanowires. Nat. Nanotechnol. 2008, 3, 31–35. [Google Scholar] [CrossRef]
- Parekh, M.H.; Parikh, V.P.; Kim, P.J.; Misra, S.; Qi, Z.; Wang, H.; Pol, V.G. Encapsulation and networking of silicon nanoparticles using amorphous carbon and graphite for high performance Li-ion batteries. Carbon 2019, 148, 36–43. [Google Scholar] [CrossRef]
- Liu, M.; Gao, H.; Hu, G.; Zhu, K.; Huang, H. Facile preparation of core-shell Si@Li4Ti5O12 nanocomposite as large-capacity lithium-ion battery anode. J. Energy Chem. 2020, 40, 89–98. [Google Scholar] [CrossRef]
- Han, X.Y.; Zhao, D.L.; Meng, W.J.; Yang, H.X.; Zhao, M.; Duan, Y.J.; Tian, X.M. Graphene caging silicon nanoparticles anchored on graphene sheets for high performance Li-ion batteries. Appl. Surf. Sci. 2019, 484, 11–20. [Google Scholar] [CrossRef]
- Ratynski, M.; Hamankiewicz, B.; Buchberger, D.A.; Boczar, M.; Krajewski, M.; Czerwinski, A.A. A new technique for in-situ determination of the active surface area changes of Li-ion battery electrodes. Batter. Supercaps 2020. [Google Scholar] [CrossRef]
- Dose, W.M.; Piernas-Muñoz, M.J.; Maroni, V.A.; Trask, S.E.; Bloom, I.; Johnson, C.S. Capacity fade in high energy silicon-graphite electrodes for lithium-ion batteries. Chem. Commun. 2018, 54, 3586–3589. [Google Scholar] [CrossRef] [PubMed]
- Ulvestad, A.; Mæhlen, J.P.; Kirkengen, M. Silicon nitride as anode material for Li-ion batteries: Understanding the SiNx conversion reaction. J. Power Sources 2018, 399, 414–421. [Google Scholar] [CrossRef]
- Yang, J.; Takeda, Y.; Imanishi, N.; Capiglia, C.; Xie, J.Y.; Yamamoto, O. SiOx-based anodes for secondary lithium batteries. Solid State Ionics 2002, 152–153, 125–129. [Google Scholar] [CrossRef]
- Nowak, A.P.; Sprynskyy, M.; Brzozowska, W.; Lisowska-Oleksiak, A. Electrochemical behavior of a composite material containing 3D-structured diatom biosilica. Algal Res. 2019, 41, 101538. [Google Scholar] [CrossRef]
- Cao, C.; Abate, I.I.; Sivonxay, E.; Shyam, B. Solid Electrolyte Interphase on Native Oxide-Terminated Silicon Anodes for Li-Ion Batteries. Joule 2019, 3, 762–781. [Google Scholar] [CrossRef]
- Baradaran, S.; Basirun, W.J.; Zalnezhad, E.; Hamdi, M.; Sarhan, A.A.D.; Alias, Y. Fabrication and deformation behaviour of multilayer Al2O3/Ti/TiO2 nanotube arrays. J. Mech. Behav. Biomed. Mater. 2013, 20, 272–282. [Google Scholar] [CrossRef]
- Moon, J.; Kemell, M.; Park, B.; Suominen, A. The correlation between the interference colour and growth procedure of anodic titanium dioxide nanotube arrays. Color. Technol. 2014, 130, 1–7. [Google Scholar] [CrossRef]
- Shallenberger, J.R.; Cole, D.A.; Novak, S.W. Characterization of silicon oxynitride thin films by X-ray photoelectron spectroscopy Characterization of silicon oxynitride thin films by x-ray photoelectron spectroscopy. J. Vacuum Sci. Technol. 2016. [Google Scholar] [CrossRef]
- Philippe, B.; Dedryvère, R.; Allouche, J.; Lindgren, F.; Gorgoi, M.; Rensmo, H.; Gonbeau, D.; Edström, K. Nanosilicon Electrodes for Lithium-Ion Batteries: Interfacial Mechanisms Studied by Hard and Soft X-ray Photoelectron Spectroscopy. Chem. Mater. 2012, 24, 1107–1115. [Google Scholar] [CrossRef]
- Veith, G.M.; Doucet, M.; Baldwin, J.K.; Sacci, R.L.; Fears, T.M.; Wang, Y.; Browning, J.F. Direct Determination of Solid-Electrolyte Interphase Thickness and Composition as a Function of State of Charge on a Silicon Anode. J. Phys. Chem. C 2015, 119, 20339–20349. [Google Scholar] [CrossRef]
- Xu, Y.; Stetson, C.; Wood, K.; Sivonxay, E.; Jiang, C.; Teeter, G.; Pylypenko, S.; Han, S.D.; Persson, K.A.; Burrell, A.; et al. Mechanical Properties and Chemical Reactivity of Li x SiO y Thin Films. ACS Appl. Mater. Interfaces 2018, 10, 38558–38564. [Google Scholar] [CrossRef] [PubMed]
- Huang, C.; Kim, A.; Chung, D.J.; Park, E.; Young, N.P.; Jurkschat, K.; Kim, H.; Grant, P.S. Multiscale Engineered Si/SiO x Nanocomposite Electrodes for Lithium-Ion Batteries Using Layer-by-Layer Spray Deposition. ACS Appl. Mater. Interfaces 2018, 10, 15624–15633. [Google Scholar] [CrossRef] [PubMed]
- Yang, H.-W.; Kim, S.-J. SiOx as a Potential Anode Material for Li-Ion Batteries: Role of Carbon Coating, Doping, and Structural Modifications. Energy Storage Devices 2018, 13. [Google Scholar] [CrossRef]
- Domi, Y.; Usui, H.; Iwanari, D.; Sakaguchi, H. Effect of Mechanical Pre-Lithiation on Electrochemical Performance of Silicon Negative Electrode for Lithium-Ion Batteries. J. Electrochem. Soc. 2017, 164, 1651–1654. [Google Scholar] [CrossRef]
- Holtstiege, F.; Bärmann, P.; Nölle, R.; Winter, M.; Placke, T. Pre-Lithiation Strategies for Rechargeable Energy Storage Technologies: Concepts, Promises and Challenges. Batteries 2018, 4, 4. [Google Scholar] [CrossRef]
- Ai, G.; Wang, Z.; Zhao, H.; Mao, W.; Fu, Y.; Yi, R.; Gao, Y.; Battaglia, V.; Wang, D.; Lopatin, S.; et al. Scalable process for application of stabilized lithium metal powder in Li-ion batteries. J. Power Sources 2016, 309, 33–41. [Google Scholar] [CrossRef]
- Zhao, J.; Sun, J.; Pei, A.; Zhou, G.; Yan, K.; Liu, Y.; Lin, D.; Cui, Y. A general prelithiation approach for group IV elements and corresponding oxides. Energy Storage Mater. 2018, 10, 275–281. [Google Scholar] [CrossRef]


| Pristine Powder | Si-1 (Modified) | Si-2 (Modified) | |
|---|---|---|---|
| Elemental Si (at.%) | 26.1 | 21.4 | 2.1 |
| SiO (at.%) | 2.6 | 3.2 | |
| SiO2 (at.%) | 71.3 | 75.5 | 97.9 |
| F (all forms) (at.%) | 2.1 | ||
| S (SO4) (at.%) | 10.0 | 11.5 | 5.5 |
| N (all forms) (at.%) | 2.7 | 1.3 |
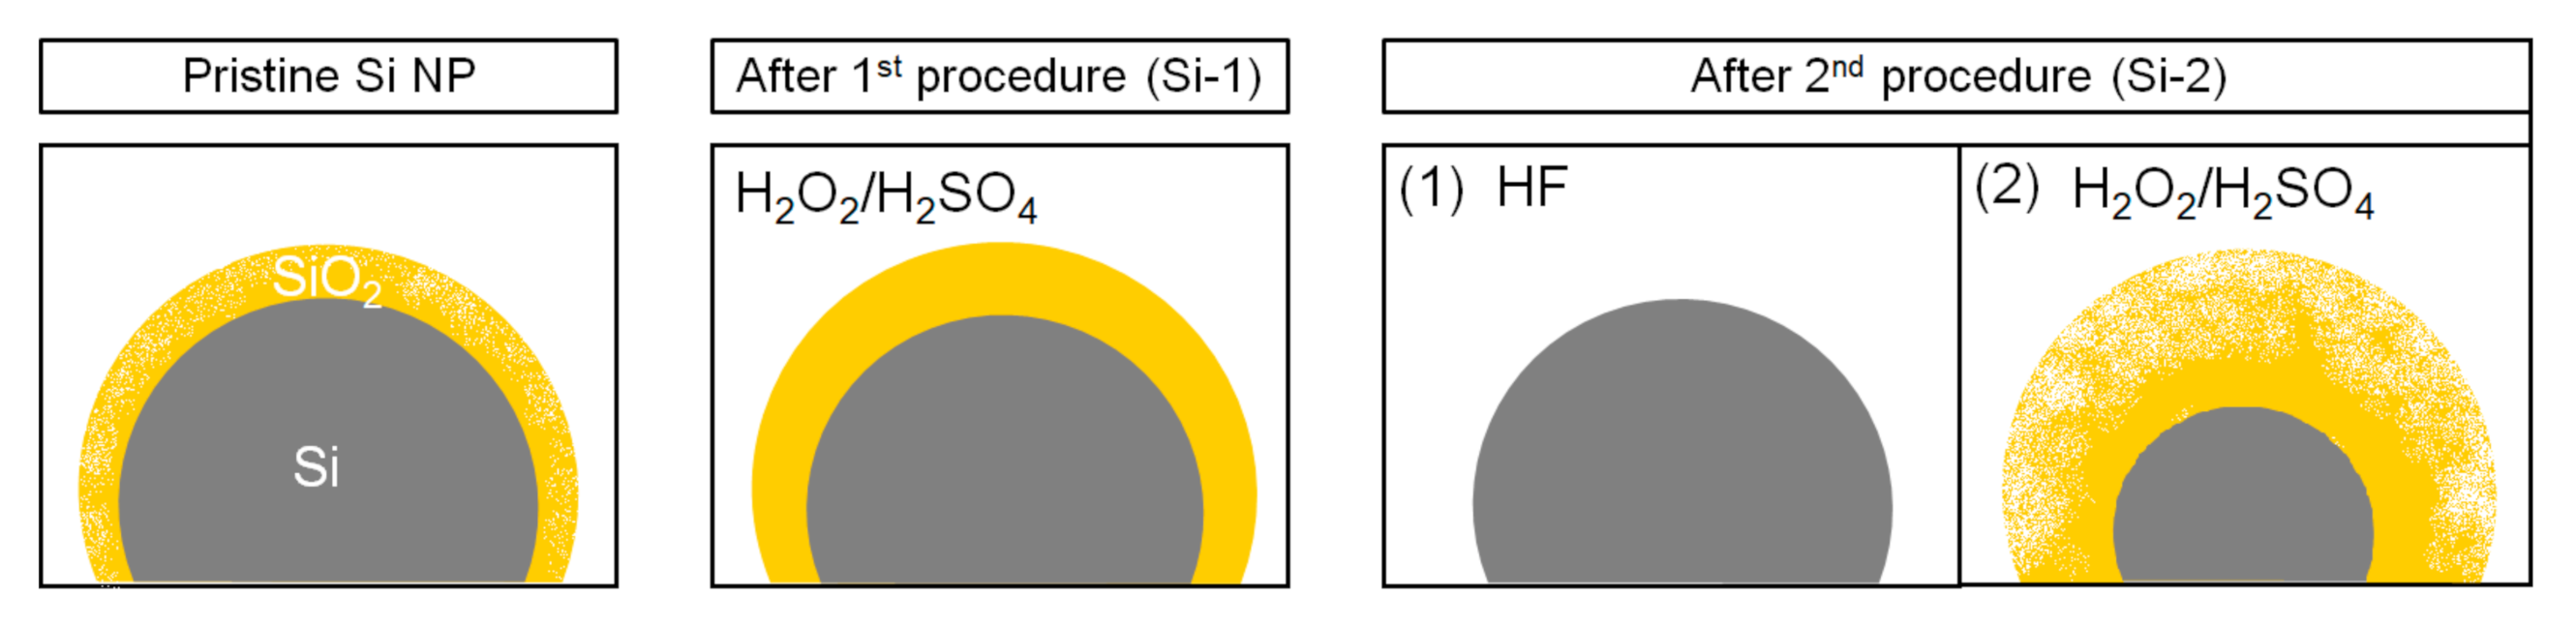
| Sample | Si (at.%) | O (at.%) | O/Si Ratio | Estimated Oxide Thickness (nm) |
|---|---|---|---|---|
| Pristine NPs | 72.0 | 28.0 | 0.39 | 6.6 |
| Si-01 | 67.7 | 32.3 | 0.48 | 8.2 |
| Si-02 | 47.5 | 52.5 | 1.10 | 17.8 |
© 2020 by the authors. Licensee MDPI, Basel, Switzerland. This article is an open access article distributed under the terms and conditions of the Creative Commons Attribution (CC BY) license (http://creativecommons.org/licenses/by/4.0/).
Share and Cite
Ratynski, M.; Hamankiewicz, B.; Buchberger, D.A.; Czerwinski, A. Surface Oxidation of Nano-Silicon as a Method for Cycle Life Enhancement of Li-ion Active Materials. Molecules 2020, 25, 4093. https://doi.org/10.3390/molecules25184093
Ratynski M, Hamankiewicz B, Buchberger DA, Czerwinski A. Surface Oxidation of Nano-Silicon as a Method for Cycle Life Enhancement of Li-ion Active Materials. Molecules. 2020; 25(18):4093. https://doi.org/10.3390/molecules25184093
Chicago/Turabian StyleRatynski, Maciej, Bartosz Hamankiewicz, Dominika A. Buchberger, and Andrzej Czerwinski. 2020. "Surface Oxidation of Nano-Silicon as a Method for Cycle Life Enhancement of Li-ion Active Materials" Molecules 25, no. 18: 4093. https://doi.org/10.3390/molecules25184093
APA StyleRatynski, M., Hamankiewicz, B., Buchberger, D. A., & Czerwinski, A. (2020). Surface Oxidation of Nano-Silicon as a Method for Cycle Life Enhancement of Li-ion Active Materials. Molecules, 25(18), 4093. https://doi.org/10.3390/molecules25184093