
Feasibility of Casein to Record Stable Isotopic Variation of Cow Milk in New Zealand


Abstract
1. Introduction
2. Materials and Methods
2.1. Materials
2.2. Preparation of Casein Samples
2.3. Ethical Approval
2.4. Bulk Analysis of δ2H, δ18O, δ13C and δ15N in Casein
3. Results and Discussion
4. Conclusions
Supplementary Materials
Author Contributions
Funding
Conflicts of Interest
References
- Koncept Analytics. Global Milk & Dairy Products Market. Report, 2014th ed.; Koncept Analytics: Ghaziabad, India, 2014; p. 87. [Google Scholar]
- Handford, C.E.; Campbell, K.; Elliott, C.T. Impacts of milk fraud on food safety and nutrition with special emphasis on developing countries: Health impacts of milk fraud. Compr. Rev. Food Sci. Food Saf. 2016, 15, 130–142. [Google Scholar] [CrossRef]
- Garbaras, A.; Skipitytė, R.; Šapolaitė, J.; Ežerinskis, Ž.; Remeikis, V. Seasonal variation in stable isotope ratios of cow milk in Vilnius region, Lithuania. Animals 2019, 9, 69. [Google Scholar] [CrossRef]
- Giaccio, M.; Del Signore, A.; Di Giacomo, F.; Bogoni, P.; Versini, G. Characterisation of cow and sheep cheeses in a regional scale by stable isotope ratios of casein (13C/12C, 15N/14N) and glycerol (18O/16O). J. Dairy Sci. 2003, 42, 193–204. [Google Scholar]
- Renou, J.-P.; Bielicki, G.; Deponge, C.; Gachon, P.; Micol, D.; Ritz, P. Characterization of animal products according to geographic origin and feeding diet using nuclear magnetic resonance and isotope ratio mass spectrometry. Part II: Beef meat. Food Chem. 2004, 86, 251–256. [Google Scholar] [CrossRef]
- Manca, G.; Camin, F.; Coloru, G.C.; Del Caro, A.; Depentori, D.; Franco, M.A.; Versini, G. Characterization of the geographical origin of pecorino sardo cheese by casein stable isotope (13 C/ 12 C and 15 N/ 14 N) ratios and free amino acid ratios. J. Agric. Food Chem. 2001, 49, 1404–1409. [Google Scholar] [CrossRef]
- Crittenden, R.G.; Andrew, A.S.; LeFournour, M.; Young, M.D.; Middleton, H.; Stockmann, R. Determining the geographic origin of milk in Australasia using multi-element stable isotope ratio analysis. Int. Dairy J. 2007, 17, 421–428. [Google Scholar] [CrossRef]
- Ehtesham, E.; Hayman, A.R.; McComb, K.A.; Van Hale, R.; Frew, R.D. Correlation of geographical location with stable isotope values of hydrogen and carbon of fatty acids from New Zealand milk and bulk milk powder. J. Agric. Food Chem. 2013, 61, 8914–8923. [Google Scholar] [CrossRef]
- Kelly, S.D. Development of analytical methods to determine the geographical origin of butter and cheese. Lipid Technol. 2001, 13, 140–143. [Google Scholar]
- Pillonel, L.; Badertscher, R.; Casey, M.; Meyer, J.; Rossmann, A.; Schlichtherle-Cerny, H.; Tabacchi, R.; Bosset, J.O. Geographic origin of European Emmental cheese: Characterisation and descriptive statistics. Int. Dairy J. 2005, 15, 547–556. [Google Scholar] [CrossRef][Green Version]
- Pillonel, L.; Badertscher, R.; Froidevaux, P.; Haberhauer, G.; Hölzl, S.; Horn, P.; Jakob, A.; Pfammatter, E.; Piantini, U.; Rossmann, A.; et al. Stable isotope ratios, major, trace and radioactive elements in emmental cheeses of different origins. Lwt Food Sci. Technol. 2003, 36, 615–623. [Google Scholar] [CrossRef]
- Stable Isotope Techniques in the Study of Biological Processes and Functioning of Ecosystems. Current Plant Science and Biotechnology in Agriculture; Unkovich, M., Pate, J., McNeill, A., Gibbs, D.J., Eds.; Springer: Dordrecht, The Netherlands, 2001; Volume 40. [Google Scholar]
- Chesson, L.A.; Valenzuela, L.O.; O’Grady, S.P.; Cerling, T.E.; Ehleringer, J.R. Hydrogen and oxygen stable isotope ratios of milk in the United States. J. Agric. Food Chem. 2010, 58, 2358–2363. [Google Scholar] [CrossRef] [PubMed]
- Rossmann, A. Determination of stable isotope ratios in food analysis. Food Rev. Int. 2001, 17, 347–381. [Google Scholar] [CrossRef]
- Rossmann, A.; Haberhauer, G.; Hölzl, S.; Horn, P.; Pichlmayer, F.; Voerkelius, S. The potential of multi-element stable isotope analysis for regional origin assignment of butter. Eur. Food Res. Technol. 2000, 211, 32–40. [Google Scholar] [CrossRef]
- Dong, H.; Xiao, K.; Luo, D. Stability of carbon and nitrogen isotopic compositions of the protein extracted from milk and their potential as “fingerprints” of geographical origin. Rsc Adv. 2017, 7, 18946–18952. [Google Scholar] [CrossRef]
- Camin, F.; Wietzerbin, K.; Cortes, A.B.; Haberhauer, G.; Lees, M.; Versini, G. Application of multielement stable isotope ratio analysis to the characterization of french, italian, and spanish cheeses. J. Agric. Food Chem. 2004, 52, 6592–6601. [Google Scholar] [CrossRef]
- Pate, F.D.; Noble, A.H. Geographic distribution of C3 and C4 grasses recorded from stable carbon isotope values of bone collagen of South Australian herbivores. Aust. J. Bot. 2000, 48, 203. [Google Scholar] [CrossRef]
- Knobbe, N.; Vogl, J.; Pritzkow, W.; Panne, U.; Fry, H.; Lochotzke, H.M.; Preiss-Weigert, A. C and N stable isotope variation in urine and milk of cattle depending on the diet. Anal. Bioanal. Chem. 2006, 386, 104–108. [Google Scholar] [CrossRef]
- Metges, C.; Kempe, K.; Schmidt, H.-L. Dependence of the carbon-isotope contents of breath carbon dioxide, milk, serum and rumen fermentation products on the δ 13 C value of food in dairy cows. Br. J. Nutr. 1990, 63, 187–196. [Google Scholar] [CrossRef]
- Camin, F.; Perini, M.; Colombari, G.; Bontempo, L.; Versini, G. Influence of dietary composition on the carbon, nitrogen, oxygen and hydrogen stable isotope ratios of milk. Rapid Commun. Mass Spectrom. 2008, 22, 1690–1696. [Google Scholar] [CrossRef]
- Bateman, A.S.; Kelly, S.D. Fertilizer nitrogen isotope signatures. Isot. Environ. Health Stud. 2007, 43, 237–247. [Google Scholar] [CrossRef]
- Camin, F.; Bontempo, L.; Perini, M.; Piasentier, E. Stable Isotope Ratio Analysis for Assessing the Authenticity of Food of Animal Origin: Authenticity of animal origin food. Compr. Rev. Food Sci. Food Saf. 2016, 15, 868–877. [Google Scholar] [CrossRef]
- Ariyama, K.; Shinozaki, M.; Kawasaki, A. Determination of the geographic origin of rice by chemometrics with Strontium and lead isotope ratios and multi-element concentrations. J. Agric. Food Chem. 2012, 60, 1628–1634. [Google Scholar] [CrossRef] [PubMed]
- Fortunato, G.; Mumic, K.; Wunderli, S.; Pillonel, L.; Bosset, J.O.; Gremaud, G. Application of strontium isotope abundance ratios measured by MC-ICP-MS for food authentication. J. Anal. At. Spectrom. 2004, 19, 227. [Google Scholar] [CrossRef]
- Walstra, P.; Walstra, P.; Wouters, J.T.M.; Geurts, T.J. Dairy Science and Technology; CRC Press: Boca Raton, FL, USA, 2005. [Google Scholar]
- Wattiaux, M.A. Protein Metabolism In Dairy Cows. In Dairy Essentials: Nutrition and Feeding, Reproduction and Genetic Selection, Lactation and Milking, Raising Dairy Heifers; University of Wisconsin: Wisconsin, WI, USA, 1999. [Google Scholar]
- Eigel, W.N.; Butler, J.E.; Ernstrom, C.A.; Farrell, H.M.; Harwalkar, V.R.; Jenness, R.; Whitney, R. McL. Nomenclature of proteins of cow’s milk: Fifth revision. J. Dairy Sci. 1984, 67, 1599–1631. [Google Scholar] [CrossRef]
- Ehtesham, E.; Hayman, A.; Van Hale, R.; Frew, R. Influence of feed and water on the stable isotopic composition of dairy milk. Int. Dairy J. 2015, 47, 37–45. [Google Scholar] [CrossRef]
- Huang, J.; Norgbey, E.; Nti Nkrumah, P.; Appiah-Sefah, G.; Michel, R. Elucidating the origin of milk products on the Chinese market using hydrogen and oxygen stable isotope technique. Integr. Food. Nutr. Metab. 2017, 4. [Google Scholar] [CrossRef]
- Dairy Companies Association of New Zealand About the NZ dairy Industry. Available online: https://www.dcanz.com/about-the-nz-dairy-industry/ (accessed on 11 January 2020).
- Morris, S.T. Sheep and beef cattle production systems. Ecosyst. Serv. N. Z. 2013, 79–84. [Google Scholar]
- Campbell, B.D.; Mitchell, N.D.; Field, T.R.O. Climate profiles of temperate C3 and subtropical C4 species in New Zealand pastures. N. Z. J. Agric. Res. 1999, 42, 223–233. [Google Scholar] [CrossRef]
- Crush, J.R.; Rowarth, J.S. The role of C4 grasses in New Zealand pastoral systems. N. Z. J. Agric. Res. 2007, 50, 125–137. [Google Scholar] [CrossRef]
- Bligh, E.G.; Dyer, W.J. A Rapid Method of Total Lipid Extraction and Purification. Can. J. Biochem. Physiol. 1959, 37, 911–917. [Google Scholar] [CrossRef]
- Qi, H.; Coplen, T.B. Investigation of preparation techniques for δ2H analysis of keratin materials and a proposed analytical protocol: δ2H analysis of keratin materials. Rapid Commun. Mass Spectrom. 2011, 25, 2209–2222. [Google Scholar] [CrossRef] [PubMed]
- Carter, J.F.; Tinggi, U.; Yang, X.; Fry, B. Stable isotope and trace metal compositions of Australian prawns as a guide to authenticity and wholesomeness. Food Chem. 2015, 170, 241–248. [Google Scholar] [CrossRef] [PubMed]
- Liu, H.; Zhao, Q.; Guo, X.; Tang, C.; Yu, X.; Zhan, T.; Qin, Y.; Zhang, J. Application of isotopic and elemental fingerprints in identifying the geographical origin of goat milk in China. Food Chem. 2019, 277, 448–454. [Google Scholar] [CrossRef]
- Mützel (Rauch), E.; Lehn, C.; Peschel, O.; Hölzl, S.; Roßmann, A. Assignment of unknown persons to their geographical origin by determination of stable isotopes in hair samples. Int. J. Leg. Med. 2009, 123, 35–40. [Google Scholar] [CrossRef] [PubMed]
- Shao, B.; Hu, Z.; Liu, D. Using improved principal component analysis to explore construction accident situations from the multi-dimensional perspective: A chinese study. Int. J. Environ. Res. 2019, 16, 3476. [Google Scholar] [CrossRef]
- Laursen, K.H.; Bontempo, L.; Camin, F.; Roßmann, A. Advances in isotopic analysis for food authenticity testing. In Advances in Food Authenticity Testing; Gerard, D., Ed.; Elsevier: Amsterdam, The Netherlands, 2016; pp. 227–252. [Google Scholar]
- Molkentin, J.; Giesemann, A. Differentiation of organically and conventionally produced milk by stable isotope and fatty acid analysis. Anal. Bioanal. Chem. 2007, 388, 297–305. [Google Scholar] [CrossRef]
- Luo, D.; Dong, H.; Luo, H.; Xian, Y.; Wan, J.; Guo, X.; Wu, Y. The application of stable isotope ratio analysis to determine the geographical origin of wheat. Food Chem. 2015, 174, 197–201. [Google Scholar] [CrossRef]
- Camin, F.; Larcher, R.; Perini, M.; Bontempo, L.; Bertoldi, D.; Gagliano, G.; Nicolini, G.; Versini, G. Characterisation of authentic Italian extra-virgin olive oils by stable isotope ratios of C, O and H and mineral composition. Food Chem. 2010, 118, 901–909. [Google Scholar] [CrossRef]
- West, J.B.; Bowen, G.J.; Dawson, T.E.; Tu, K.P. Isoscapes: Understanding Movement, Pattern, and Process on Earth through Isotope Mapping; West, J.B., Ed.; Springer: Dordrecht, The Netherlands; New York, NY, USA, 2010. [Google Scholar]
- Ascough, P.; Mainland, I.; Newton, A. From isoscapes to farmscapes: Introduction to the Special Issue. Environ. Archaeol. 2018, 23, 299–302. [Google Scholar] [CrossRef]
- Li, Y.; Li, X.; Song, Z.; Ding, C. Conservation guidelines for the endangered Brown-eared Pheasant based on the geographic information system and the MaxEnt model. Peerj Prepr. 2016, 4, e2018v1. [Google Scholar]
- Hodgson, P. Climate Change Impacts on New Zealand. Available online: https://www.mfe.govt.nz/sites/default/files/impacts-report-jun01.pdf (accessed on 11 August 2020).
- Mullan, B.; Tait, A.; Thompson, C. ’Climate’, Te Ara - the Encyclopedia of New Zealand. Available online: http://www.teara.govt.nz/en/climate (accessed on 11 August 2020).
- Kornexl, B.E.; Werner, T.; Roßmann, A.; Schmidt, H.-L. Measurement of stable isotope abundances in milk and milk ingredients—A possible tool for origin assignment and quality control. Z. Lebensm. Forsch. A 1997, 205, 19–24. [Google Scholar] [CrossRef]
- Bontempo, L.; Lombardi, G.; Paoletti, R.; Ziller, L.; Camin, F. H, C, N and O stable isotope characteristics of alpine forage, milk and cheese. Int. Dairy J. 2012, 23, 99–104. [Google Scholar] [CrossRef]
- Tieszen, L.L. Natural variations in the carbon isotope values of plants: Implications for archaeology, ecology, and paleoecology. J. Archaeol. Sci. 1991, 18, 227–248. [Google Scholar] [CrossRef]
- Zhao, W.; Liang, B.; Yang, X.; Gale, W.; Zhou, J. Effect of long-term fertilization on 15N uptake and retention in soil. J. Plant. Nutr. 2016, 39, 1431–1440. [Google Scholar] [CrossRef]
- Heaton, T.H.E. The 15N/14N ratios of plants in South Africa and Namibia: Relationship to climate and coastal/saline environments. Oecologia 1987, 74, 236–246. [Google Scholar] [CrossRef]
- McCutchan, J.H.; Lewis, W.M.; Kendall, C.; McGrath, C.C. Variation in trophic shift for stable isotope ratios of carbon, nitrogen, and sulfur. Oikos 2003, 102, 378–390. [Google Scholar] [CrossRef]
- DeNiro, M.J.; Epstein, S. Influence of diet on the distribution of nitrogen isotopes in animals. Geochim. Cosmochim. Acta 1981, 45, 341–351. [Google Scholar] [CrossRef]
- Gannes, L.Z.; del Rio, C.M.; Koch, P. Natural abundance variations in stable isotopes and their potential uses in animal physiological ecology. Comp. Biochem. Physiol. Part A Mol. Integr. Physiol. 1998, 119, 725–737. [Google Scholar] [CrossRef]
- Cantalapiedra-Hijar, G.; Fouillet, H.; Huneau, J.F.; Fanchone, A.; Doreau, M.; Nozière, P.; Ortigues-Marty, I. Relationship between efficiency of nitrogen utilization and isotopic nitrogen fractionation in dairy cows: Contribution of digestion v. metabolism? Animal 2016, 10, 221–229. [Google Scholar] [CrossRef]
- Van der Veer, G.; Voerkelius, S.; Lorentz, G.; Heiss, G.; Hoogewerff, J.A. Spatial interpolation of the deuterium and oxygen-18 composition of global precipitation using temperature as ancillary variable. J. Geochem. Explor. 2009, 101, 175–184. [Google Scholar] [CrossRef]
- Abeni, F.; Petrera, F.; Capelletti, M.; Dal Prà, A.; Bontempo, L.; Tonon, A.; Camin, F. Hydrogen and oxygen stable isotope fractionation in body fluid compartments of dairy cattle according to season, farm, breed, and reproductive stage. PLoS ONE 2015, 10, e0127391. [Google Scholar] [CrossRef] [PubMed]
- Ehtesham, E.; Baisden, W.T.; Keller, E.D.; Hayman, A.R.; Van Hale, R.; Frew, R.D. Correlation between precipitation and geographical location of the δ2H values of the fatty acids in milk and bulk milk powder. Geochim. Cosmochim. Acta 2013, 111, 105–116. [Google Scholar] [CrossRef]


| Region | Latitude | Longitude | δ2H, ‰ | δ18O, ‰ | δ15N, ‰ | δ13C, ‰ |
|---|---|---|---|---|---|---|
| South | −45.9169 | 170.23 | −103.90 | 21.03 | 6.32 | −27.46 |
| South | −44.0974 | 171.16 | −94.78 | 20.75 | 4.95 | −28.38 |
| South | −43.4520 | 171.94 | −104.77 | 21.22 | 3.86 | −27.20 |
| South | −42.7667 | 172.89 | −110.55 | 20.13 | 5.76 | −26.89 |
| South | −46.3900 | 168.41 | −95.34 | 22.24 | 4.20 | −27.64 |
| South | −45.5983 | 170.44 | −94.28 | 20.55 | 4.47 | −27.50 |
| South | −43.6232 | 171.36 | −103.45 | 21.21 | 4.70 | −27.44 |
| South | −43.9495 | 171.55 | −97.48 | 21.53 | 5.08 | −27.49 |
| North | −37.8833 | 176.3 | −114.49 | 20.77 | 7.59 | −22.46 |
| North | −38.4831 | 176.35 | −114.79 | 20.00 | 5.00 | −26.83 |
| North | −37.9630 | 175.46 | −117.70 | 19.55 | 6.29 | −16.95 |
| North | −35.3226 | 173.79 | −102.87 | 20.68 | 7.20 | −23.58 |
| North | −38.4359 | 175.89 | −93.34 | 21.53 | 5.87 | −25.11 |
| North | −40.3549 | 175.64 | −95.10 | 20.70 | 6.35 | −24.99 |
| North | −37.6694 | 175.28 | −106.23 | 21.36 | 6.13 | −25.04 |
| North | −38.2012 | 176.34 | −100.08 | 20.81 | 6.89 | −23.10 |
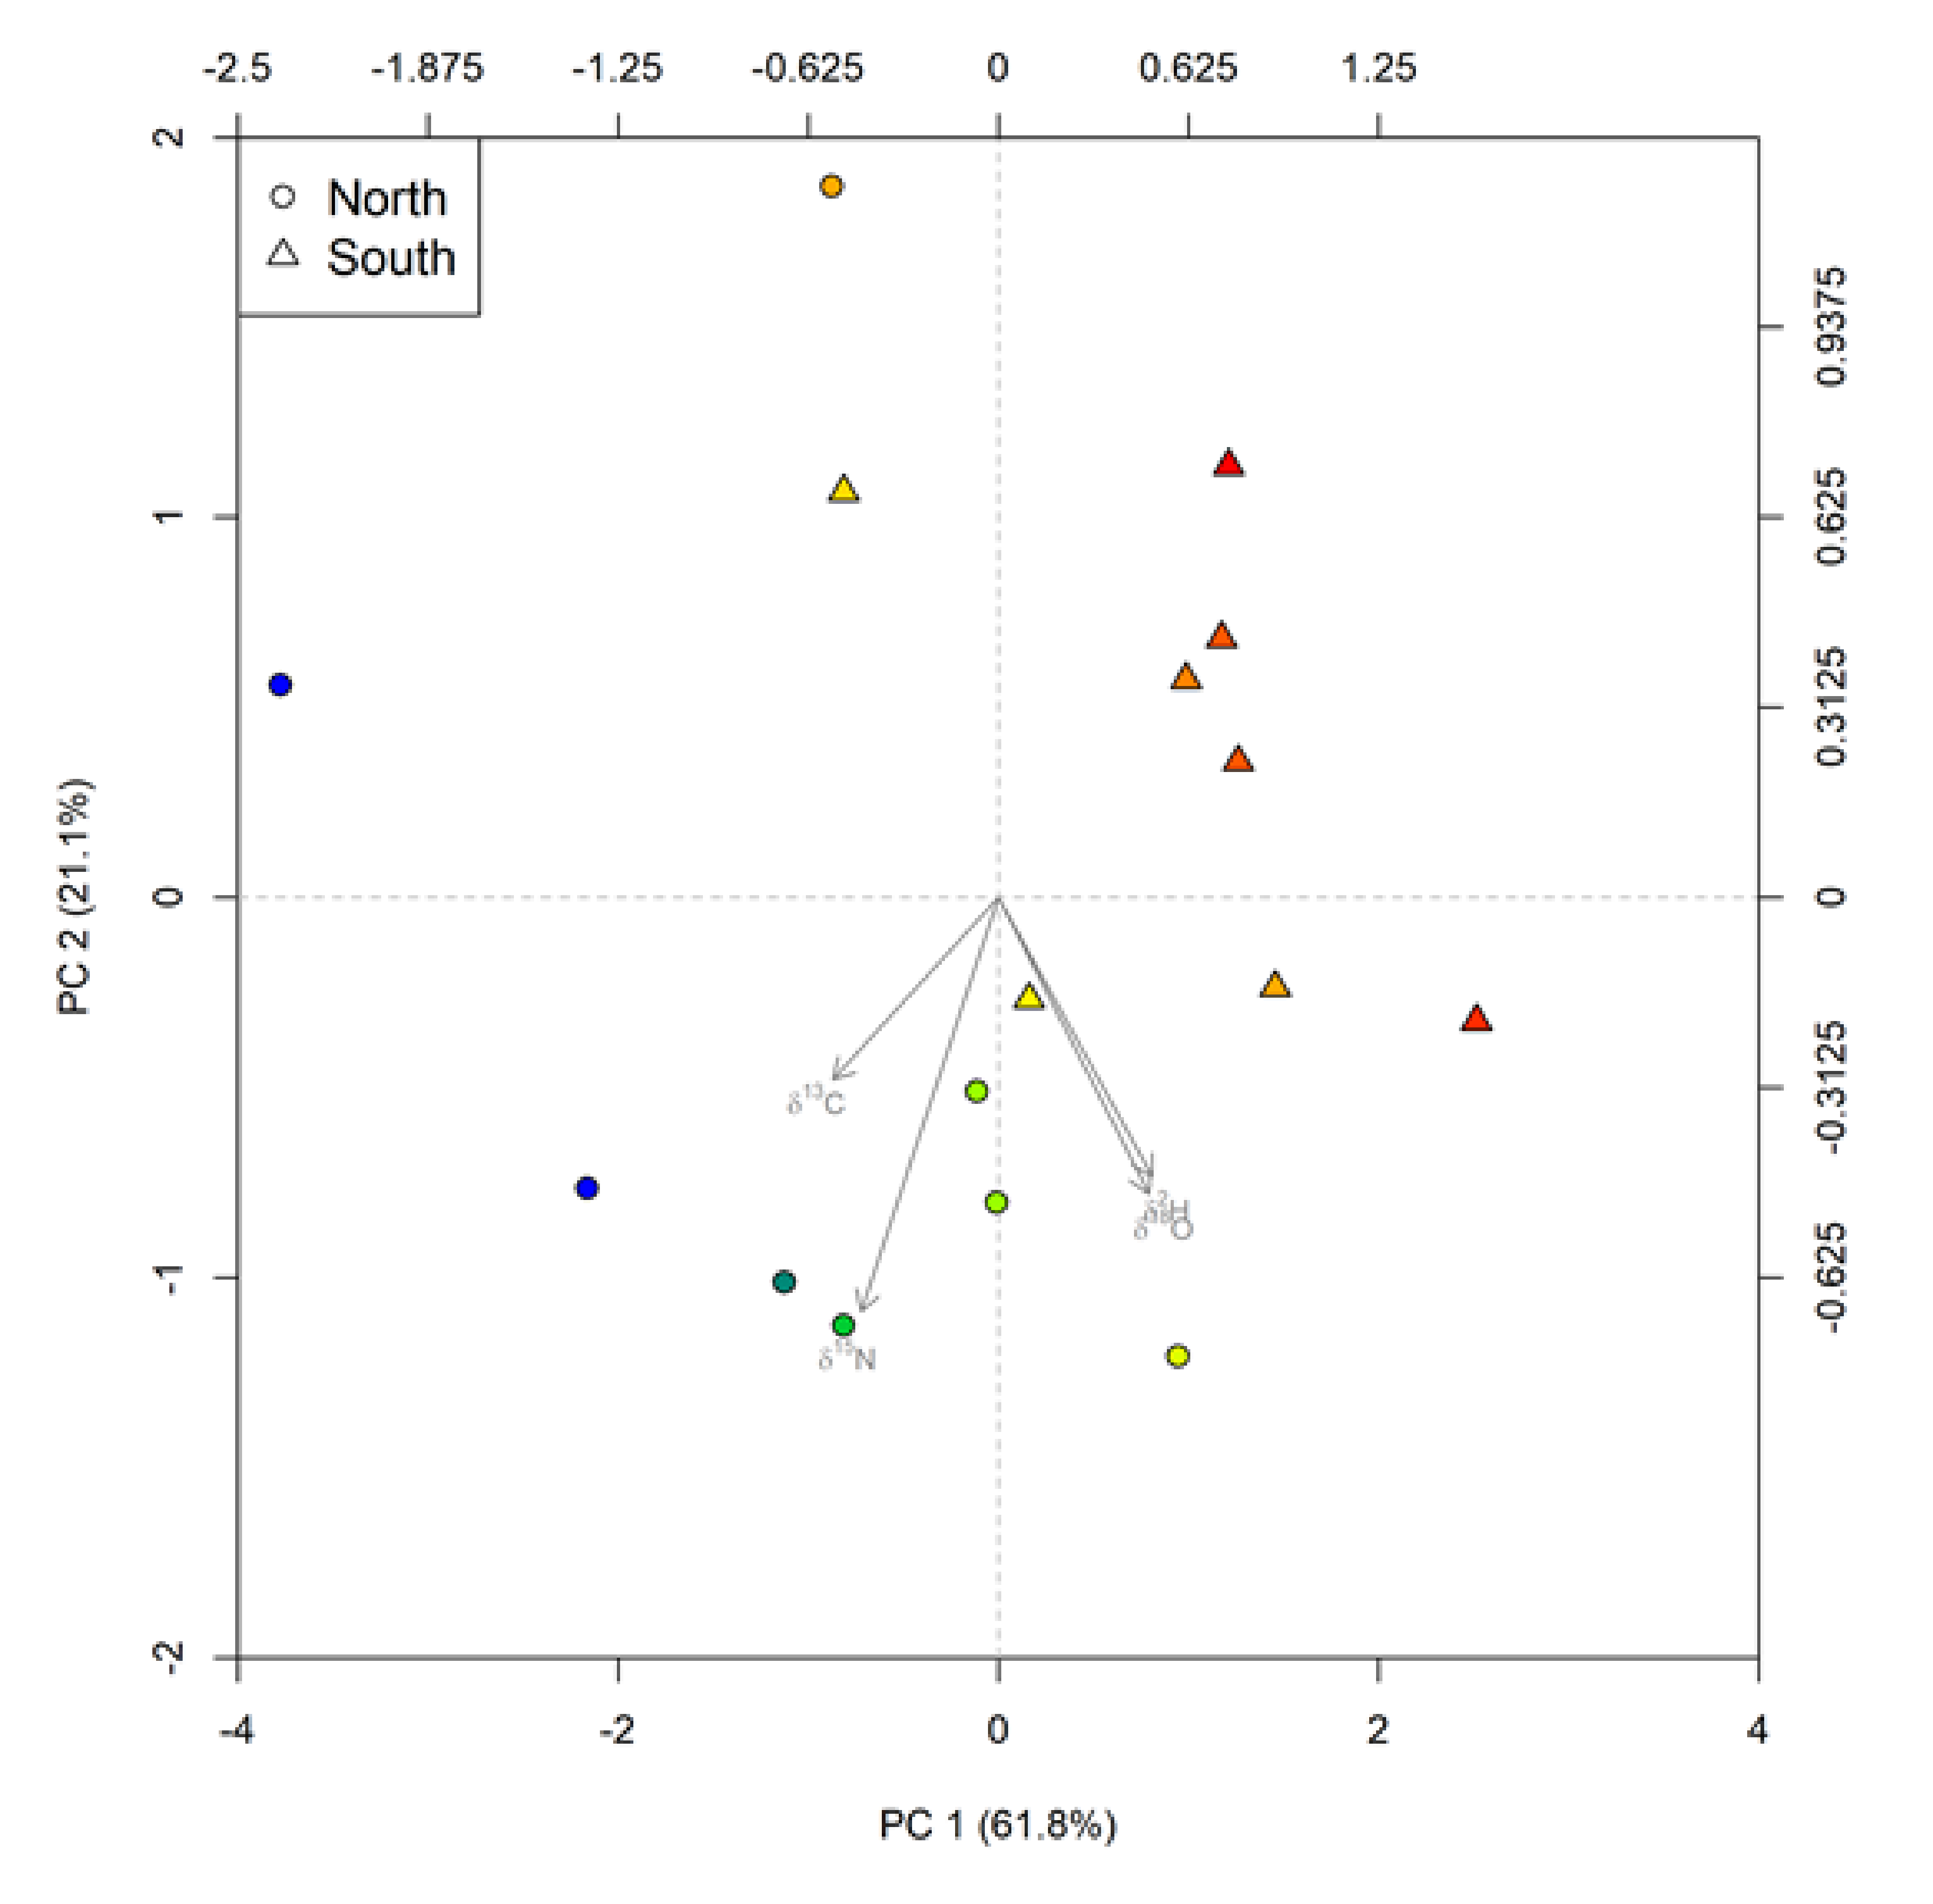
| Variable | Principal Component 1 | Principal Component 2 |
|---|---|---|
| δ2H | −0.503 | −0.459 |
| δ18O | −0.495 | −0.486 |
| δ15N | +0.453 | −0.681 |
| δ13C | +0.545 | −0.299 |
© 2020 by the authors. Licensee MDPI, Basel, Switzerland. This article is an open access article distributed under the terms and conditions of the Creative Commons Attribution (CC BY) license (http://creativecommons.org/licenses/by/4.0/).
Share and Cite
Wijenayake, K.; Frew, R.; McComb, K.; Van Hale, R.; Clarke, D. Feasibility of Casein to Record Stable Isotopic Variation of Cow Milk in New Zealand. Molecules 2020, 25, 3658. https://doi.org/10.3390/molecules25163658
Wijenayake K, Frew R, McComb K, Van Hale R, Clarke D. Feasibility of Casein to Record Stable Isotopic Variation of Cow Milk in New Zealand. Molecules. 2020; 25(16):3658. https://doi.org/10.3390/molecules25163658
Chicago/Turabian StyleWijenayake, Kavindra, Russell Frew, Kiri McComb, Robert Van Hale, and Dianne Clarke. 2020. "Feasibility of Casein to Record Stable Isotopic Variation of Cow Milk in New Zealand" Molecules 25, no. 16: 3658. https://doi.org/10.3390/molecules25163658
APA StyleWijenayake, K., Frew, R., McComb, K., Van Hale, R., & Clarke, D. (2020). Feasibility of Casein to Record Stable Isotopic Variation of Cow Milk in New Zealand. Molecules, 25(16), 3658. https://doi.org/10.3390/molecules25163658