
Authentication of Greek PDO Kalamata Table Olives: A Novel Non-Target High Resolution Mass Spectrometric Approach


Abstract
1. Introduction
2. Materials and Methods
2.1. Chemicals and Standards
2.2. Table Olive Samples
2.3. Sample Extraction
2.4. UHPLC-ESI-QTOF-MS/MS Analysis
2.5. Method Performance Evaluation
2.6. Non-Target Screening Methodology
2.6.1. Data Processing
2.6.2. Chemometrics
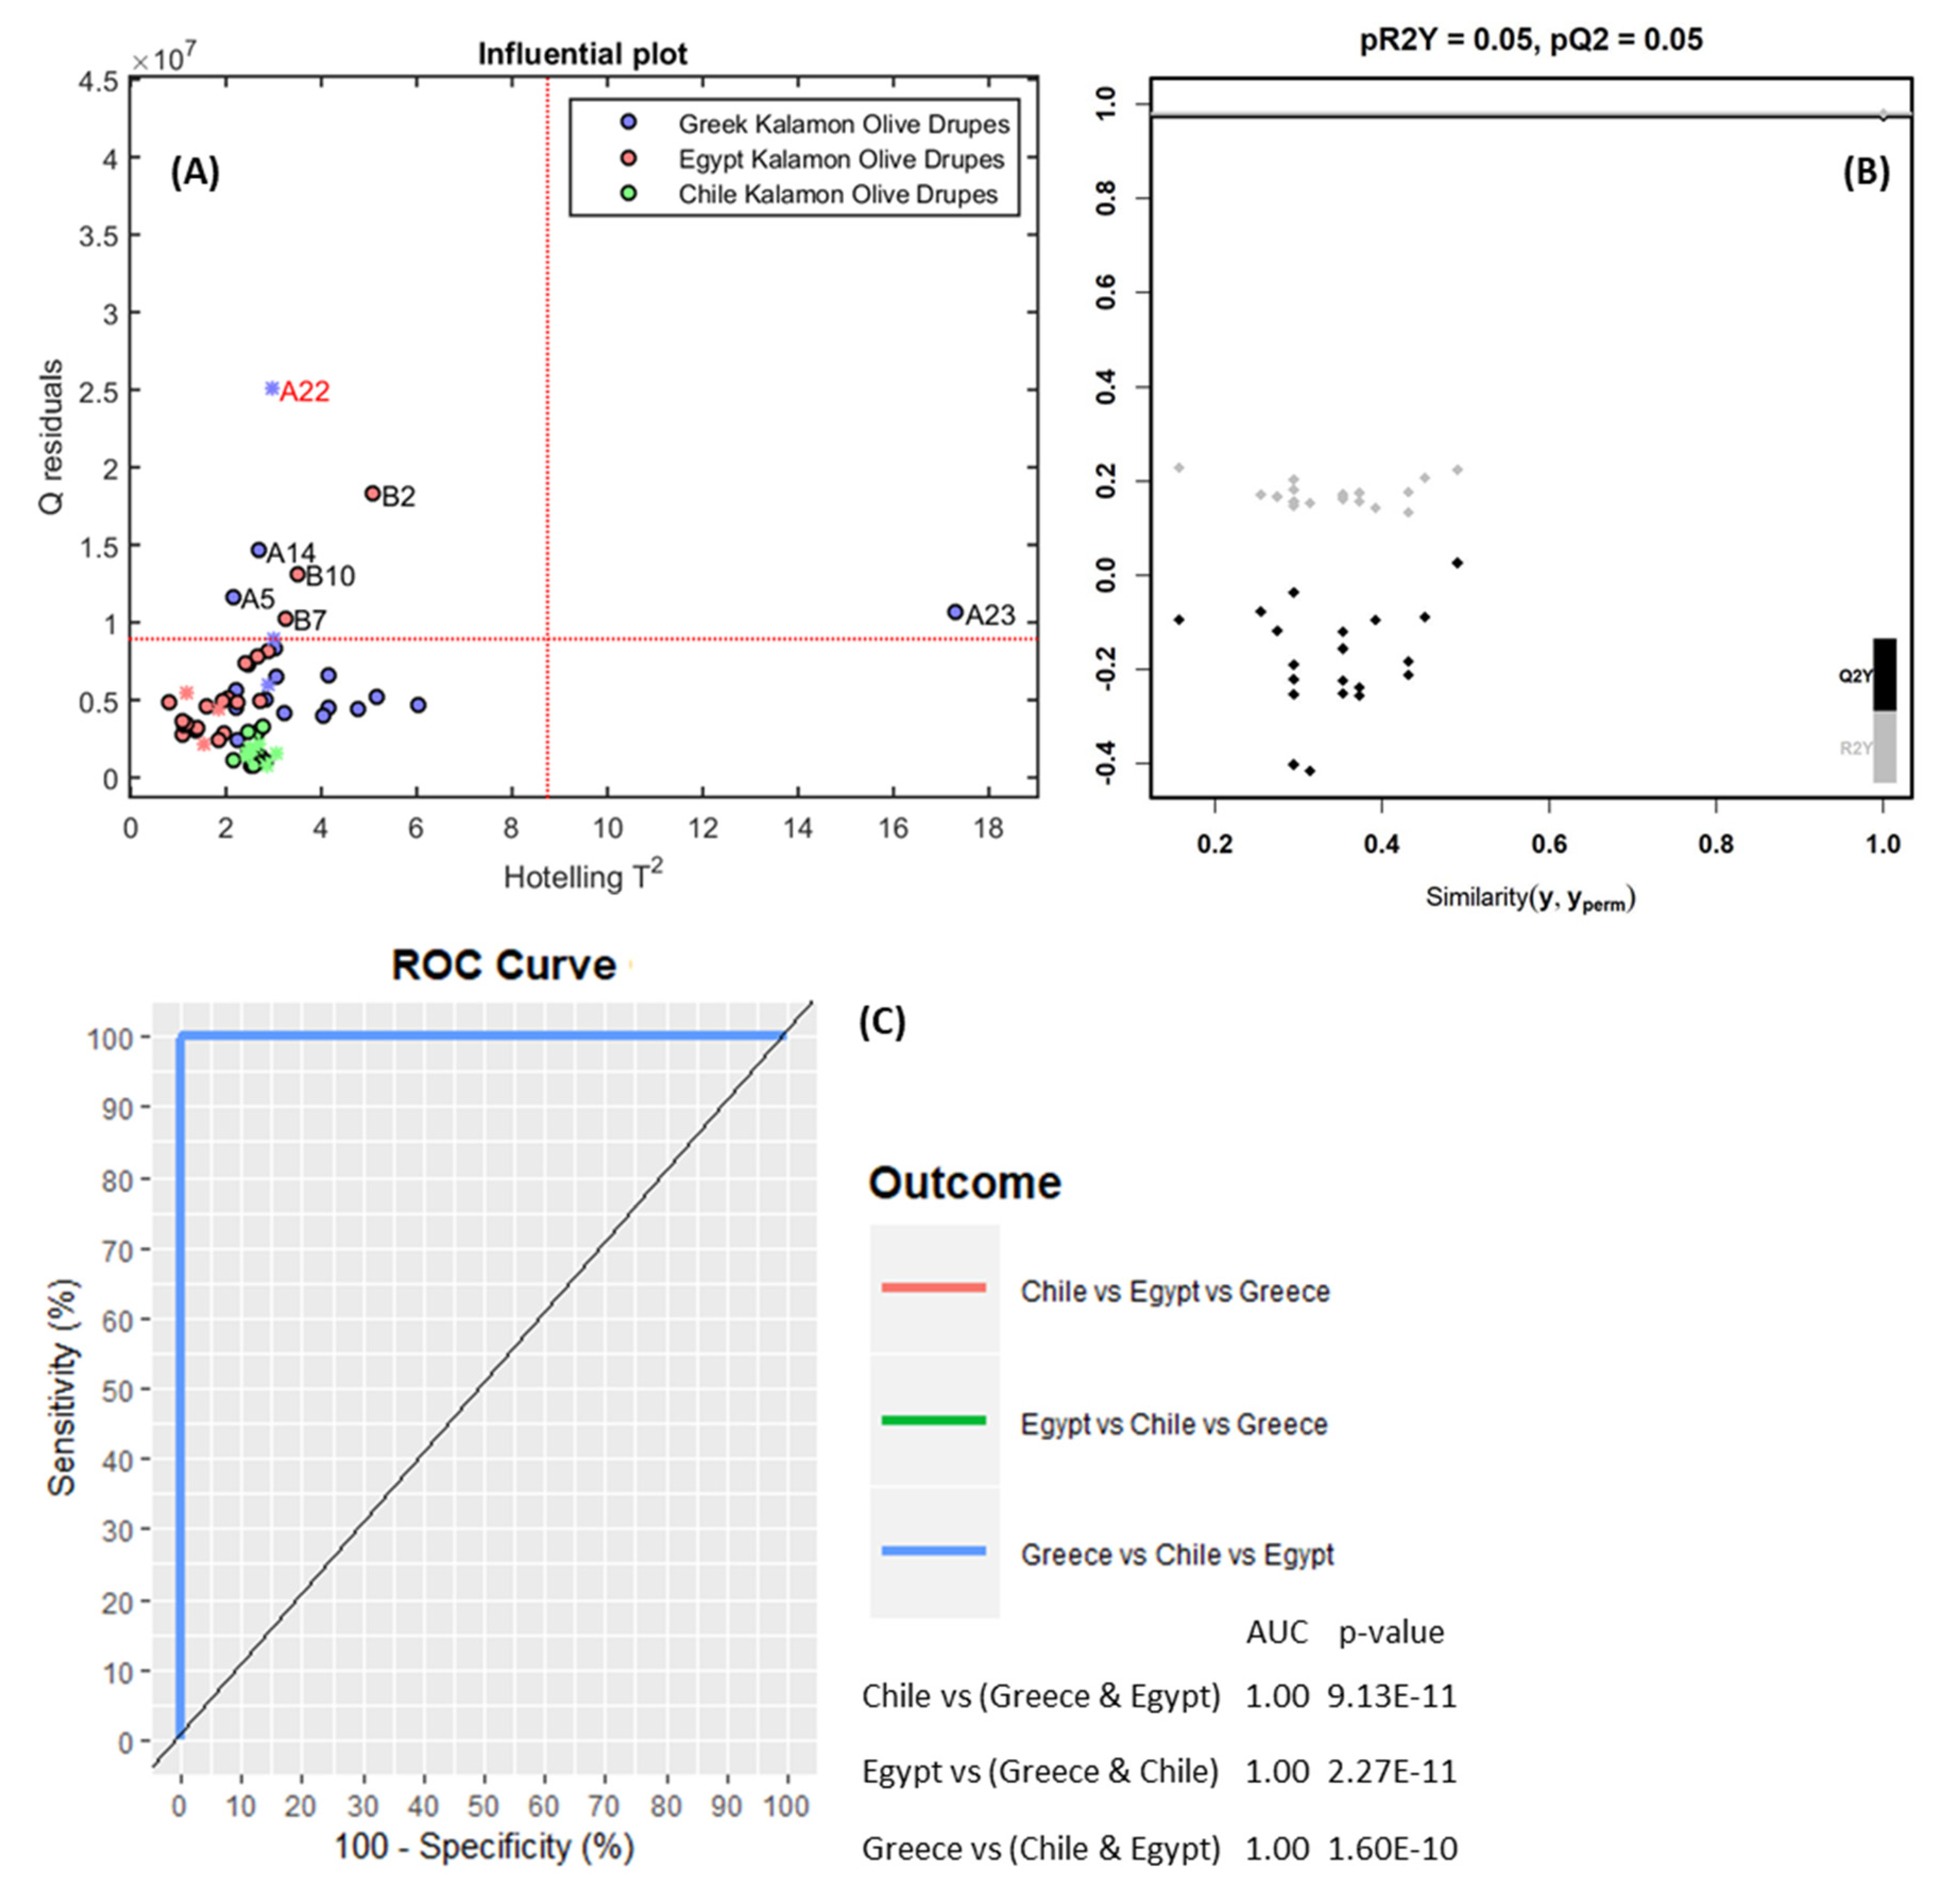
2.6.3. Model Validation and Classification Performance
2.6.4. Marker Identification
3. Results and Discussion
3.1. Method Performance Results
3.2. Non-Target Screening Results
3.2.1. Data Processing
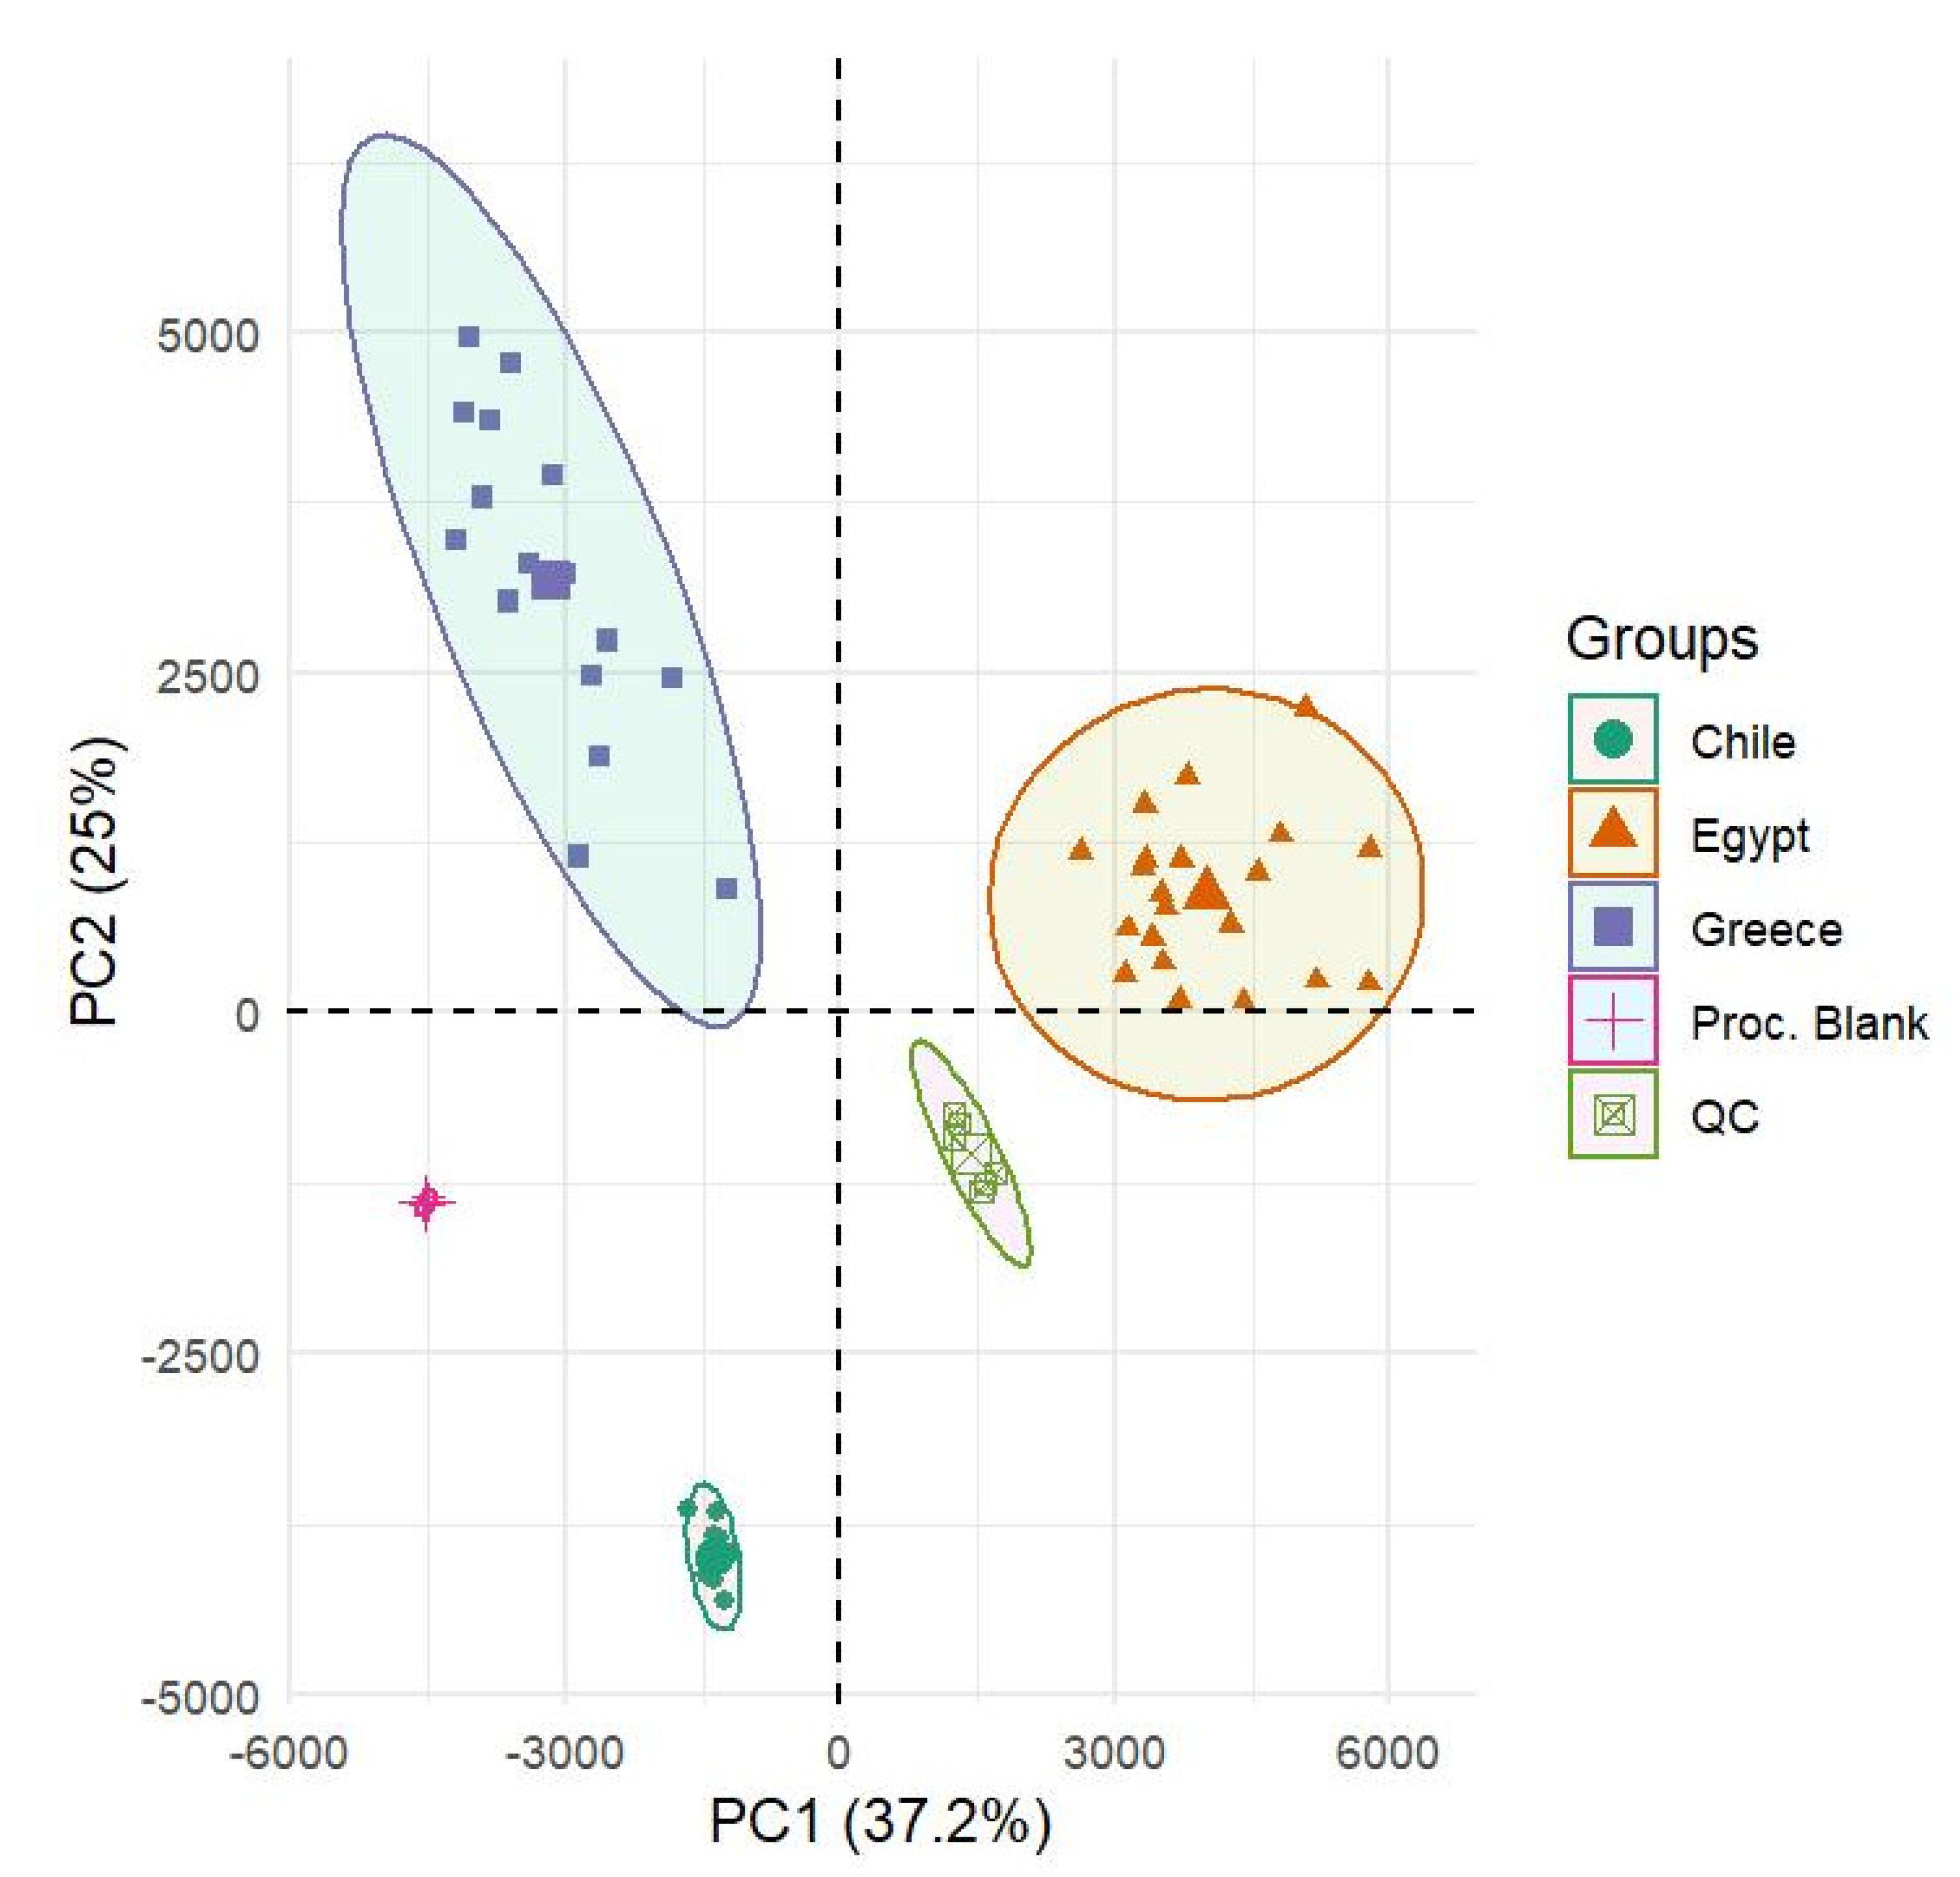
3.2.2. Chemometrics
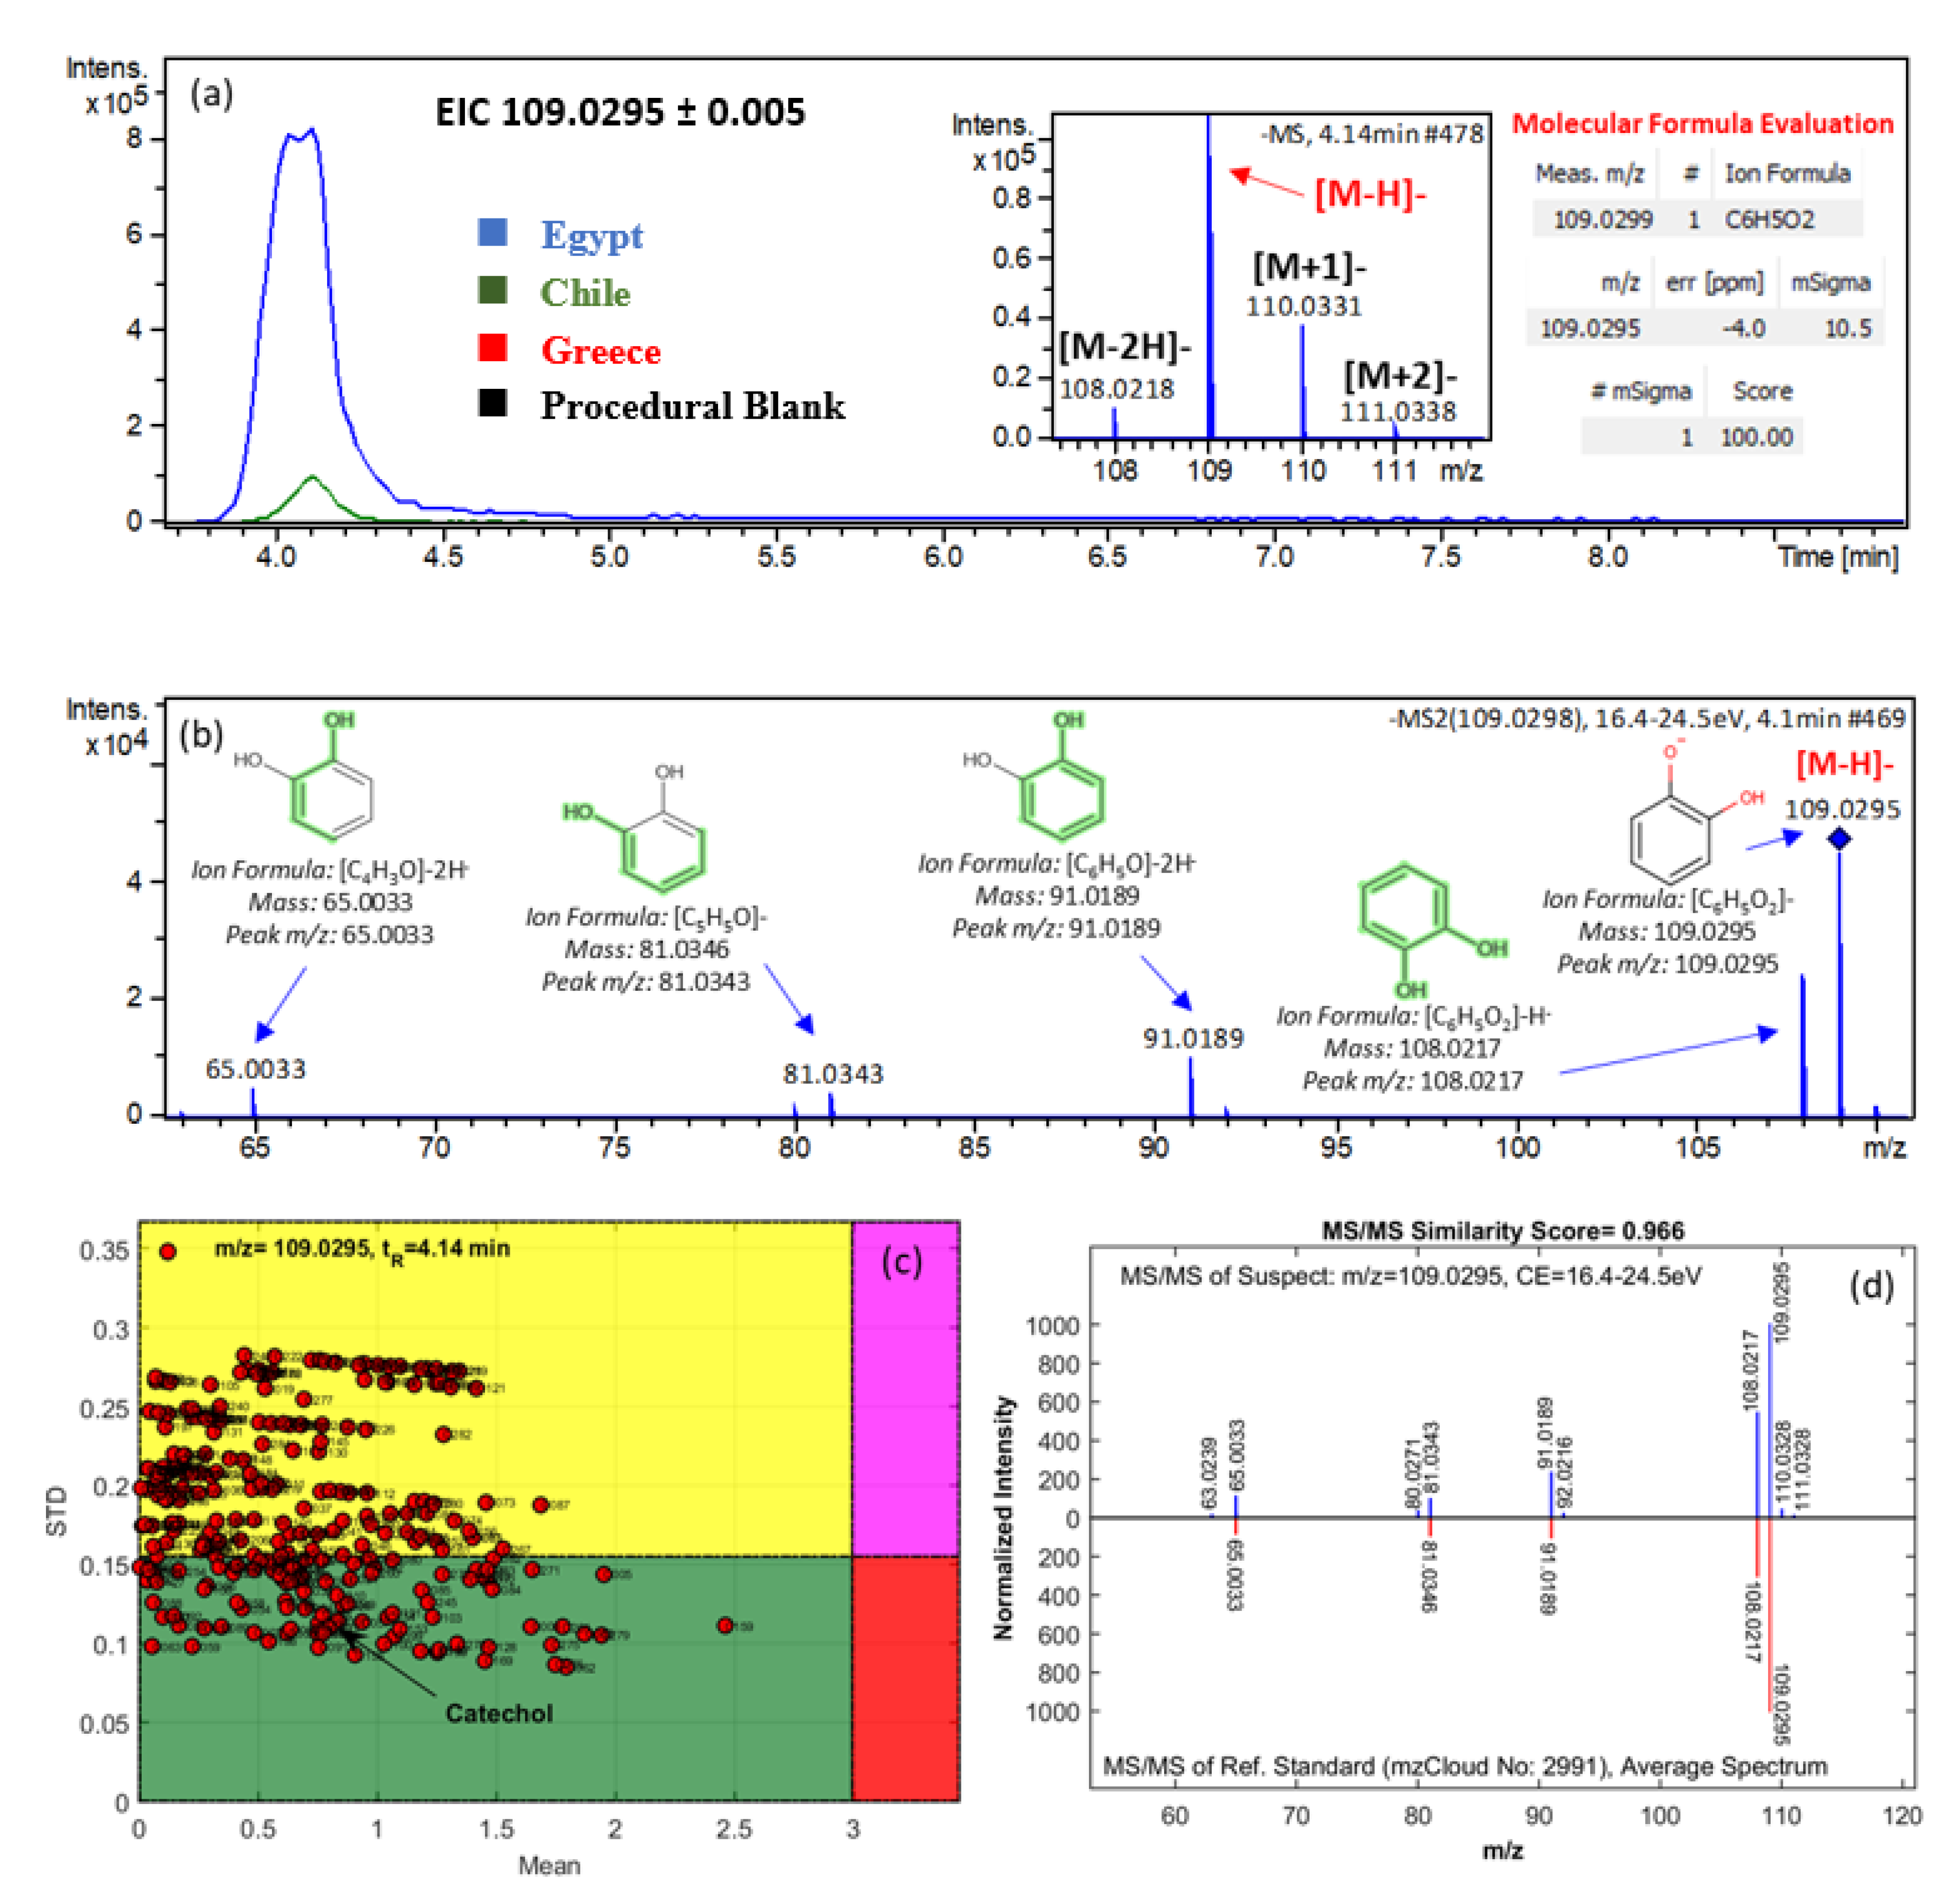
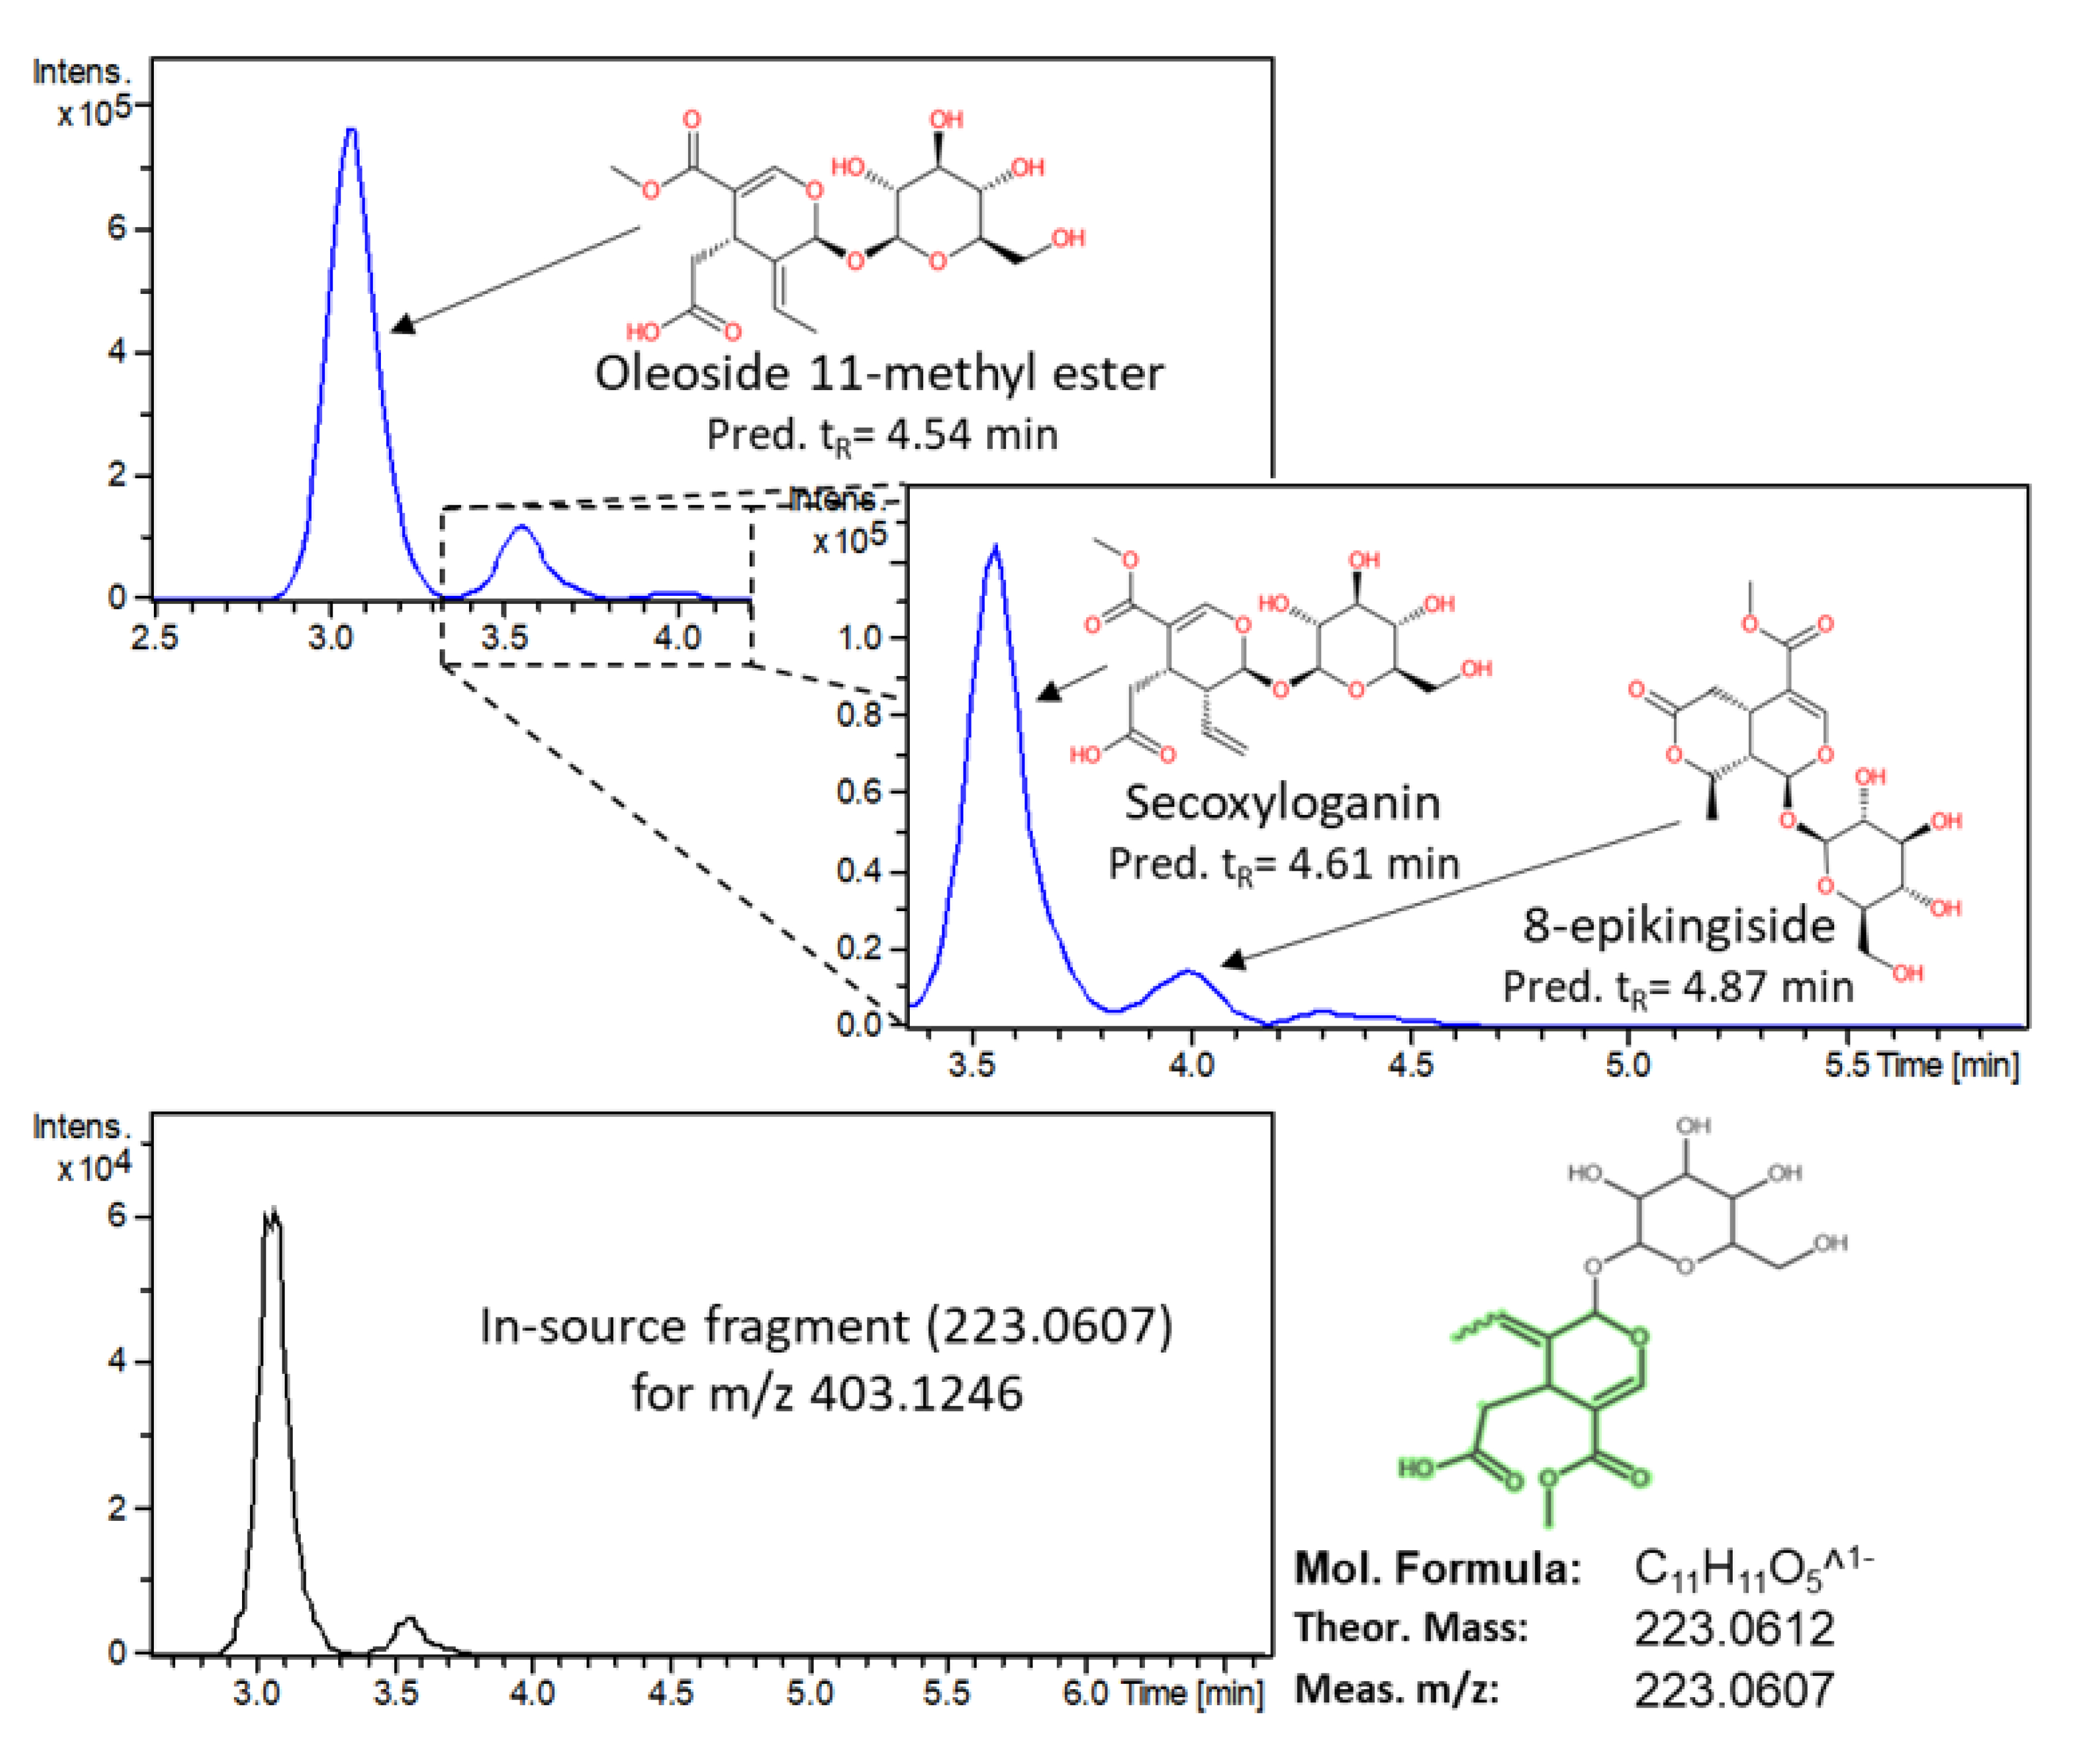
3.2.3. Marker Identification
4. Conclusions
Supplementary Materials
Author Contributions
Funding
Acknowledgments
Conflicts of Interest
References
- Bakhouche, A.; Lozano-Sánchez, J.; Beltrán-Debón, R.; Joven, J.; Segura-Carretero, A.; Fernández-Gutiérrez, A. Phenolic characterization and geographical classification of commercial Arbequina extra-virgin olive oils produced in southern Catalonia. Food Res. Int. 2013, 50, 401–408. [Google Scholar] [CrossRef]
- Cuadros-Rodríguez, L.; Ruiz-Samblás, C.; Valverde-Som, L.; Pérez-Castaño, E.; González-Casado, A. Chromatographic fingerprinting: An innovative approach for food ‘identitation’ and food authentication – A tutorial. Anal. Chim. Acta 2016, 909, 9–23. [Google Scholar] [CrossRef] [PubMed]
- Kosma, I.; Badeka, A.; Vatavali, K.; Kontakos, S.; Kontominas, M. Differentiation of Greek extra virgin olive oils according to cultivar based on volatile compound analysis and fatty acid composition. Eur. J. Lipid Sci. Tech. 2016, 118, 849–861. [Google Scholar] [CrossRef]
- Ghanbari, R.; Anwar, F.; Alkharfy, K.M.; Gilani, A.-H.; Saari, N. Valuable nutrients and functional bioactives in different parts of olive (Olea europaea L.)—A review. Int. J. Mol. Sci. 2012, 13, 1291–1340. [Google Scholar] [CrossRef] [PubMed]
- Kalogiouri, N.P.; Alygizakis, N.A.; Aalizadeh, R.; Thomaidis, N.S. Olive oil authenticity studies by target and nontarget LC-QTOF-MS combined with advanced chemometric techniques. Anal. Bioanal. Chem. 2016, 408, 7955–7970. [Google Scholar] [CrossRef]
- Obied, H.K.; Karuso, P.; Prenzler, P.D.; Robards, K. Novel secoiridoids with antioxidant activity from Australian olive mill waste. J. Agric. Food. Chem. 2007, 55, 2848–2853. [Google Scholar] [CrossRef]
- SilianI, S.; Mattei, A.; Benevieri innocenti, L.; Zanoni, B. Bitter taste and phenolic compounds in extra virgin olive oil: An empirical relationship. J. Food Qual. 2006, 29, 431–441. [Google Scholar] [CrossRef]
- United Nations. International agreement on olive oil and table olives. Off. J. Eur. Comm. 2015, 293, 4–24. [Google Scholar]
- Brenes, M.; Ramírez, E.; García, P.; Medina, E.; De Castro, A.; Romero, C. New developments in table olive debittering. Acta Hortic. 2018, 1199, 483–487. [Google Scholar] [CrossRef]
- Albuquerque, T.G.; Costa, H.S.; Oliveira, M.B.P.P. An overview of portuguese olive oils and table olives with protected designation of origin. Eur. J. Lipid Sci. Tech. 2019, 121, 1800129. [Google Scholar] [CrossRef]
- European Commission. COMMISSION REGULATION (EC) No 1151/2012 on quality schemes for agricultural products and foodstuffs. Off. J. Eur Comm. 2012, 343, 1–29. [Google Scholar]
- Cifuentes, A. Food analysis and foodomics. J. Chromatogr. A 2009, 1216, 7109. [Google Scholar] [CrossRef] [PubMed]
- Cifuentes, A. Food analysis: Present, future, and foodomics. Anal. Chem. 2012, 2012, 1–16. [Google Scholar] [CrossRef]
- European Commission. COMMISSION REGULATION (EC) No 1107/96 on the registration of geographical indications and designations of origin. Off. J. Eur Comm. 1996, 148, 1–10. [Google Scholar]
- Consonni, R.; Cagliani, L.R. NMR Studies on Italian PDO Olive Oils and their Potential in Olive-Tree-Derived Products Characterization. Eur. J. Lipid Sci. Tech. 2019, 121, 1800174. [Google Scholar] [CrossRef]
- Ben Othman, N.; Roblain, D.; Thonart, P.; Hamdi, M. Tunisian table olive phenolic compounds and their antioxidant capacity. J. Food Sci. 2008, 73, C235–C240. [Google Scholar] [CrossRef]
- Dağdelen, A.; Tümen, G.; Özcan, M.M.; Dündar, E. Phenolics profiles of olive fruits (Olea europaea L.) and oils from Ayvalık, Domat and Gemlik varieties at different ripening stages. Food Chem. 2013, 136, 41–45. [Google Scholar]
- Sánchez, A.H.; López-López, A.; Cortés-Delgado, A.; de Castro, A.; Montaño, A. Aroma profile and volatile composition of black ripe olives (Manzanilla and Hojiblanca cultivars). Food Res. Int. 2020, 127, 108733. [Google Scholar] [CrossRef]
- Concepción, R.; García, P.; Medina, E.; Brenes, M. The PDO and PGI Table Olives of Spain. Eur. J. Lipid Sci. Tech. 2019, 121, 1–17. [Google Scholar]
- Kalogiouri, N.P.; Samanidou, V.F. Advances in the Optimization of Chromatographic Conditions for the Separation of Antioxidants in Functional Foods. Rev. Sep. Sci. 2019, 1, 17–33. [Google Scholar] [CrossRef]
- Pasqualone, A.; Montemurro, C.; Di Rienzo, V.; Summo, C.; Paradiso, V.M.; Caponio, F. Evolution and perspectives of cultivar identification and traceability from tree to oil and table olives by means of DNA markers. J. Sci. Food. Agric. 2016, 96, 3642–3657. [Google Scholar] [CrossRef] [PubMed]
- Selli, S.; Kelebek, H.; Kesen, S.; Sonmezdag, A.S. GC-MS olfactometric and LC-DAD-ESI-MS/MS characterization of key odorants and phenolic compounds in black dry-salted olives. J. Sci. Food. Agric. 2018, 98, 4104–4111. [Google Scholar] [CrossRef] [PubMed]
- Mitsopoulos, G.; Papageorgiou, V.; Komaitis, M.; Hagidimitriou, M. Phenolic Profile of Leaves and Drupes in Major Greek Olive Varieties. Not. Bot. Horti. Agrobot. Cluj. Napoca 2016, 44, 162–166. [Google Scholar] [CrossRef][Green Version]
- Boskou, G.; Salta, F.N.; Chrysostomou, S.; Mylona, A.; Chiou, A.; Andrikopoulos, N.K. Antioxidant capacity and phenolic profile of table olives from the Greek market. Food Chem. 2006, 94, 558–564. [Google Scholar] [CrossRef]
- Tsantili, E. Quality attributes and their relations in fresh black ripe ‘Kalamon’ olives (Olea europaea L.) for table use – phenolic compounds and total antioxidant capacity. Int. J. Food Sci. Technol. 2014, 49, 657–665. [Google Scholar] [CrossRef]
- Alexandraki, V.; Georgalaki, M.; Papadimitriou, K.; Anastasiou, R.; Zoumpopoulou, G.; Chatzipavlidis, I.; Papadelli, M.; Vallis, N.; Moschochoritis, K.; Tsakalidou, E. Determination of triterpenic acids in natural and alkaline-treated Greek table olives throughout the fermentation process. LWT Food Sci. Technol. 2014, 58, 609–613. [Google Scholar] [CrossRef]
- García-Cañas, V.; Simo, C.; Herrero, M.; Ibańẽz, E.; Cifuentes, A. Present and Future Challenges in Food Analysis: Foodomics. Anal. Chem. 2012, 84, 10150–10159. [Google Scholar] [CrossRef]
- Ibanez, C.; Simo, C.; Garcia-Canas, V.; Acunha, T.; Cifuentes, A. The role of direct high-resolution mass spectrometry in foodomics. Anal. Bioanal. Chem. 2015, 407, 6275–6287. [Google Scholar] [CrossRef]
- Vallverdú-Queralt, A.; Lamuela-Raventós, R.M. Foodomics: A new tool to differentiate between organic and conventional foods. Electrophoresis 2016, 37, 1784–1794. [Google Scholar] [CrossRef]
- Kalogiouri, N.P.; Aalizadeh, R.; Thomaidis, N. Application of an advanced and wide scope non-target screening workflow with LC-ESI-QTOF-MS and chemometrics for the classification of the Greek olive oil varieties. Food Chem. 2018, 256, 53–61. [Google Scholar] [CrossRef]
- Kalogiouri, N.P.; Aalizadeh, R.; Thomaidis, N.S. Investigating the organic and conventional production type of olive oil with target and suspect screening by LC-QTOF-MS, a novel semi-quantification method using chemical similarity and advanced chemometrics. Anal. Bioanal. Chem. 2017, 409, 5413–5426. [Google Scholar] [CrossRef] [PubMed]
- Chambers, M.C.; Maclean, B.; Burke, R.; Amodei, D.; Ruderman, D.L.; Neumann, S.; Gatto, L.; Fischer, B.; Pratt, B.; Egertson, J.; et al. A cross-platform toolkit for mass spectrometry and proteomics. Nat. Biotechnol. 2012, 30, 918–920. [Google Scholar] [CrossRef] [PubMed]
- Tautenhahn, R.; Böttcher, C.; Neumann, S. Highly sensitive feature detection for high resolution LC/MS. BMC Bioinform. 2008, 9, 504–520. [Google Scholar] [CrossRef] [PubMed]
- Beikos, P.; Aalizadeh, R.; Thomaidis, N.S. Minimizing Analytical Procedural Mass Spectral Features as False Positive Peaks in Untargeted Liquid Chromatography—High Resolution Mass Spectrometry Data Processing. In Proceedings of the 11th Aegean Analytical Chemistry Days (AACD2018), Chania, Crete, Greece, 25–29 September 2018. [Google Scholar]
- Van den Berg, R.A.; Hoefsloot, H.C.; Westerhuis, J.A.; Smilde, A.K.; van der Werf, M.J. Centering, scaling, and transformations: Improving the biological information content of metabolomics data. BMC Genomics 2006, 7, 142–157. [Google Scholar] [CrossRef]
- Castillo, S.; Gopalacharyulu, P.; Yetukuri, L.; Orešič, M. Algorithms and tools for the preprocessing of LC–MS metabolomics data. Chemom. Intell. Lab. Syst. 2011, 108, 23–32. [Google Scholar] [CrossRef]
- Arneberg, R.; Rajalahti, T.; Flikka, K.; Berven, F.S.; Kroksveen, A.C.; Berle, M.; Myhr, K.-M.; Vedeler, C.A.; Ulvik, R.J.; Kvalheim, O.M. Pretreatment of Mass Spectral Profiles: Application to Proteomic Data. Anal. Chem. 2007, 79, 7014–7026. [Google Scholar] [CrossRef]
- Caesar, L.K.; Kellogg, J.J.; Kvalheim, O.M.; Cech, N.B. Opportunities and Limitations for Untargeted Mass Spectrometry Metabolomics to Identify Biologically Active Constituents in Complex Natural Product Mixtures. J. Nat. Prod. 2019, 82, 469–484. [Google Scholar] [CrossRef]
- Kennard, R.W.; Stone, L.A. Computer Aided Design of Experiments. Technometrics 1969, 11, 137–148. [Google Scholar] [CrossRef]
- Keun, H.C.; Ebbels, T.M.D.; Antti, H.; Bollard, M.E.; Beckonert, O.; Holmes, E.; Lindon, J.C.; Nicholson, J.K. Improved analysis of multivariate data by variable stability scaling: Application to NMR-based metabolic profiling. Anal. Chim. Acta 2003, 490, 265–276. [Google Scholar] [CrossRef]
- Välikangas, T.; Suomi, T.; Elo, L.L. A systematic evaluation of normalization methods in quantitative label-free proteomics. Brief. Bioinformatics 2018, 19, 1–11. [Google Scholar] [CrossRef]
- Veselkov, K.A.; Vingara, L.K.; Masson, P.; Robinette, S.L.; Want, E.; Li, J.V.; Barton, R.H.; Boursier-Neyret, C.; Walther, B.; Ebbels, T.M.; et al. Optimized Preprocessing of Ultra-Performance Liquid Chromatography/Mass Spectrometry Urinary Metabolic Profiles for Improved Information Recovery. Anal. Chem. 2011, 83, 5864–5872. [Google Scholar] [CrossRef]
- Dieterle, F.; Ross, A.; Schlotterbeck, G.; Senn, H. Probabilistic Quotient Normalization as Robust Method to Account for Dilution of Complex Biological Mixtures. Application in 1H NMR Metabonomics. Anal. Chem. 2006, 78, 4281–4290. [Google Scholar] [CrossRef]
- Barker, M.; Rayens, W. Partial least squares for discrimination. J. Chemom. 2003, 17, 166–173. [Google Scholar] [CrossRef]
- Ballabio, D.; Consonni, V. Classification tools in chemistry. Part 1: Linear models. PLS-DA. Anal. Methods 2013, 5, 3790–3798. [Google Scholar] [CrossRef]
- Chong, I.-G.; Jun, C.-H. Performance of some variable selection methods when multicollinearity is present. Chemometr. Intell. Lab. Syst. 2005, 78, 103–112. [Google Scholar] [CrossRef]
- Mehmood, T.; Liland, K.H.; Snipen, L.; Sæbø, S. A review of variable selection methods in Partial Least Squares Regression. Chemometr. Intell. Lab. Syst. 2012, 118, 62–69. [Google Scholar] [CrossRef]
- Thévenot, E.A.; Roux, A.; Xu, Y.; Ezan, E.; Junot, C. Analysis of the Human Adult Urinary Metabolome Variations with Age, Body Mass Index, and Gender by Implementing a Comprehensive Workflow for Univariate and OPLS Statistical Analyses. J. Proteome Res. 2015, 14, 3322–3335. [Google Scholar] [CrossRef]
- Szymańska, E.; Saccenti, E.; Smilde, A.K.; Westerhuis, J.A. Double-check: Validation of diagnostic statistics for PLS-DA models in metabolomics studies. Metabolomics 2012, 8, 3–16. [Google Scholar] [CrossRef]
- Schymanski, E.L.; Jeon, J.; Gulde, R.; Fenner, K.; Ruff, M.; Singer, H.P.; Hollender, J. Identifying small molecules via high resolution mass spectrometry: Communicating confidence. Environ. Sci. Technol. 2014, 48, 2097–2098. [Google Scholar] [CrossRef]
- Loos, M.; Gerber, C.; Corona, F.; Hollender, J.; Singer, H. Accelerated Isotope Fine Structure Calculation Using Pruned Transition Trees. Anal. Chem. 2015, 87, 5738–5744. [Google Scholar] [CrossRef]
- Ruttkies, C.; Schymanski, E.L.; Wolf, S.; Hollender, J.; Neumann, S. MetFrag relaunched: Incorporating strategies beyond in silico fragmentation. J. Cheminformatics 2016, 8, 3–19. [Google Scholar] [CrossRef]
- Djoumbou-Feunang, Y.; Pon, A.; Karu, N.; Zheng, J.; Li, C.; Arndt, D.; Gautam, M.; Allen, F.; Wishart, D.S. CFM-ID 3.0: Significantly Improved ESI-MS/MS Prediction and Compound Identification. Metabolites 2019, 9, 72. [Google Scholar] [CrossRef]
- Aalizadeh, R.; Thomaidis, N.S. Autosuspect: An. R Package to Perform. Automatic Screening Based on Regulatory Databases. In Proceedings of the 11th Aegean Analytical Chemistry Days (AACD2018), Chania, Crete, Greece, 25–29 September 2018. [Google Scholar]
- Aalizadeh, R.; Nika, M.-C.; Thomaidis, N.S. Development and application of retention time prediction models in the suspect and non-target screening of emerging contaminants. J. Hazard. Mater. 2019, 363, 277–285. [Google Scholar] [CrossRef]
- Kanakis, P.; Termentzi, A.; Michel, T.; Gikas, E.; Halabalaki, M.; Skaltsounis, A.-L. From Olive Drupes to Olive Oil. An HPLC-Orbitrap-based Qualitative and Quantitative Exploration of Olive Key Metabolites. Planta Med. 2013, 79, 1576–1587. [Google Scholar] [CrossRef]
Sample Availability: Not available. |


| Compound | LOD (mg kg−1) | LOQ (mg kg−1) | Intra-day Precision RSDr% (n = 3) | Inter-day Precision RSDR% (n = 3 × 2) | Equation y = (a ± Sa) + (b ± Sb)x Linear Range: 0.02–10 mg kg−1 | r2 | RE% | ME% |
|---|---|---|---|---|---|---|---|---|
| Gallic acid | 0.035 | 0.098 | 4.5 | 5.2 | y = (0.04 ± 0.03) + (0.11 ± 0.09)x | 0.991 | 93.4 | −10.2 |
| p-Coumaric acid | 0.041 | 0.096 | 5.4 | 6.2 | y = (0.03 ± 0.02) + (0.04 ± 0.01)x | 0.991 | 87.1 | −11.8 |
| Ferulic acid | 0.039 | 0.089 | 5.7 | 6.4 | y = (0.05 ± 0.04) + (0.037 ± 0.006)x | 0.994 | 83.2 | −15.9 |
| Syringic acid | 0.032 | 0.092 | 6.4 | 6.8 | y = (0.007 ± 0.002) + (0.07 ± 0.01)x | 0.992 | 92.4 | −17.4 |
| Homovanillic acid | 0.034 | 0.085 | 4.2 | 6.1 | y = (0.005 ± 0.002) + (0.02 ± 0.01)x | 0.995 | 90.4 | −12.9 |
| Tyrosol | 0.035 | 0.094 | 4.8 | 5.9 | y = (−0.006 ± 0.003) + (0.031 ± 0.005)x | 0.997 | 92.4 | −9.75 |
| Hydroxytyrosol | 0.038 | 0.079 | 3.9 | 5.1 | y = (−0.027 ± 0.004) + (0.09 ± 0.06)x | 0.994 | 91.5 | −11.1 |
| Pinoresinol | 0.021 | 0.078 | 4.1 | 4.4 | y = (−0.009 ± 0.004) + (0.03 ± 0.01)x | 0.993 | 95.1 | −8.09 |
| Apigenin | 0.019 | 0.056 | 4.8 | 5.1 | y = (0.10 ± 0.07) + (0.25 ± 0.37)x | 0.992 | 89.7 | −18.8 |
| Oleuropein | 0.027 | 0.074 | 3.6 | 4.9 | y = (−0.019 ± 0.002) + (0.13 ± 0.02)x | 0.994 | 90.1 | −13.7 |
| Vanillin | 0.034 | 0.076 | 4.7 | 6.1 | y = (−0.02 ± 0.01) + (0.19 ± 0.07)x | 0.996 | 86.7 | −16.5 |
| Caffeic acid | 0.029 | 0.088 | 5.6 | 6.3 | y = (−0.03 ± 0.01) + (0.171 ± 0.004)x | 0.993 | 82.5 | −15.2 |
| Epicatechin | 0.036 | 0.082 | 4.8 | 5.5 | y = (−0.02 ± 0.01) + (0.046 ± 0.007)x | 0.992 | 81.4 | −19.4 |
| Luteolin | 0.023 | 0.069 | 3.9 | 4.4 | y = (−0.015 ± 0.001)x + (0.03 ± 0.02)x | 0.991 | 94.0 | −9.41 |
| Compound Name | Class | Theoretical m/z [M − H]− | Molecular Formula | Experimental tR (Predicted tR) min | Characteristic Marker of | Pairwise VIP Values (from PLS-DA) | MS/MS Fragments (the 3–5 Most Abundant Fragments) in RPLC-(-ESI)-QTOF-MS | Level of Identification Confidence | ||
|---|---|---|---|---|---|---|---|---|---|---|
| Greece vs. Egypt | Greece vs. Chile | Egypt vs. Chile | ||||||||
| Catechol | Phenols | 109.0295 | C6H6O2 | 4.14 (5.09) | Egypt | 9.916 | 1.394 | 10.202 | 65.0033, 81.0346, 91.0189, 108.0217, 109.0295 | 2a |
| Hydroxytyrosol | Phenols | 153.0557 | C8H10O3 | 3.53 | Egypt | 13.751 | 13.459 | 1.729 | 81.0347, 95.0504, 108.0217, 123.0453, 137.0242 | 1 |
| Methyl-catechol (in-source fragment of Hydroxytyrosol) | Phenols | 123.0452 | C7H8O2 | 3.53 | Egypt | 13.357 | 9.357 | 6.027 | 67.0191, 95.0503, 123.0451 | 4 |
| Tyrosol | Phenols | 137.0608 | C8H10O2 | 4.14 | Egypt | 1.47 | 2.441 | 2.347 | 106.0417, 119.0502, 137.0608 | 1 |
| L-(−)-Malic acid | Carboxylic Acids | 133.0142 | C4H6O5 | 1.15 | Greece | 5.397 | 5.927 | 0.197 | 59.0139, 71.0139, 72.9931, 89.0243, 115.0034 | 1 |
| Quinic acid | Alcohols & polyols | 191.0561 | C7H12O6 | 1.60 (1.41) | Greece | 1.557 | 4.431 | 3.047 | 85.0292, 87.0086, 93.0343, 127.0394, 191.0550 | 2a |
| Apigenin | Flavonoids | 269.0455 | C15H10O5 | 8.23 | Chile | 0.098 | 2.504 | 2.724 | 65.0031, 117.0342, 149.0238, 151.0027, 225.0542 | 1 |
| Kaempferol | Flavonoids | 285.0405 | C15H10O6 | 8.20 | Chile | 2.171 | 6.419 | 5.642 | 65.0032, 133.0290, 151.0031, 175.0395, 199.0393 | 1 |
| Luteolin | Flavonoids | 285.0405 | C15H10O6 | 7.51 | Chile | 2.41 | 7.174 | 6.202 | 65.0032, 133.0290, 151.0031, 175.0395, 199.0393 | 1 |
| alpha-Linolenic acid | Fatty acids | 277.2173 | C18H30O2 | 12.73 | Egypt | 0.368 | 2.018 | 1.88 | 277.2168, 278.2204 | 1 |
| Linoleic acid | Fatty acids | 279.2330 | C18H32O2 | 13.23 | Egypt | 0.906 | 8.987 | 10.416 | 59.0140, 261.2219, 279.2330 | 1 |
| Oleic acid | Fatty acids | 281.2486 | C18H34O2 | 13.77 | Greece | 2.618 | 10.129 | 8.183 | 281.2489, 282.2519, 283.2552 | 1 |
| 13-Keto-octadeca-9Z,11E-dienoic acid (metabolites of α-linolenic acid) | Fatty acids | 293.2122 | C18H30O3 | 10.99 (10.29) | Greece | 4.979 | 7.08 | 2.232 | 57.0347,113.0965, 179.1068, 195.1382, 293.2111 | 2a |
| 9R-hydroxy-10E,12Z-octadecadienoic acid | Fatty acids | 295.2279 | C18H32O3 | 11.10 (12.00) | Greece | 4.867 | 5.765 | 0.597 | 171.1020, 195.1382, 277.2161, 293.2116, 295.2266 | 2a |
| trans-EKODE-(E)-Ib | Fatty acids | 309.2071 | C18H30O4 | 9.35 (10.07) | Greece | 2.791 | 4.512 | 1.979 | 137.0963, 139.1121, 155.1069, 167.1070, 171.1017 | 2a |
| (±)9-HpODE | Fatty acids | 311.2228 | C18H32O4 | 9.84 (11.83) | Greece | 5.856 | 8.096 | 2.281 | 127.1112, 139.1121, 171.1018, 185.1176, 293.2117 | 2a |
| Oleoside methyl ester | Secoiridoids | 403.1246 | C17H24O11 | 3.08 (4.54) | Egypt | 8.062 | 1.273 | 10.848 | 59.0140, 71.0140, 101.0242, 165.0554, 223.0607 | 3 |
| 8-epikingiside | Secoiridoids | 403.1246 | C17H24O11 | 4.03 (4.87) | Egypt | 1.485 | 0.435 | 2.234 | No fragmentation was observed in DDA mode due to very low abundance | 3 |
| Secoxyloganin | Secoiridoids | 403.1246 | C17H24O11 | 3.56 (4.61) | Egypt | 7.514 | 1.025 | 9.474 | 59.0140, 71.0135, 101.0251, 121.0289, 165.0554 | 3 |
| p-coumaroyl-6-secologanoside (Comselogoside) | Secoiridoids | 535.1457 | C25H28O13 | 4.61 (4.48) | Greece | 4.045 | 5.239 | 1.198 | 69.0343, 145.0292, 163.0393, 205.0497, 265.0715 | 2a |
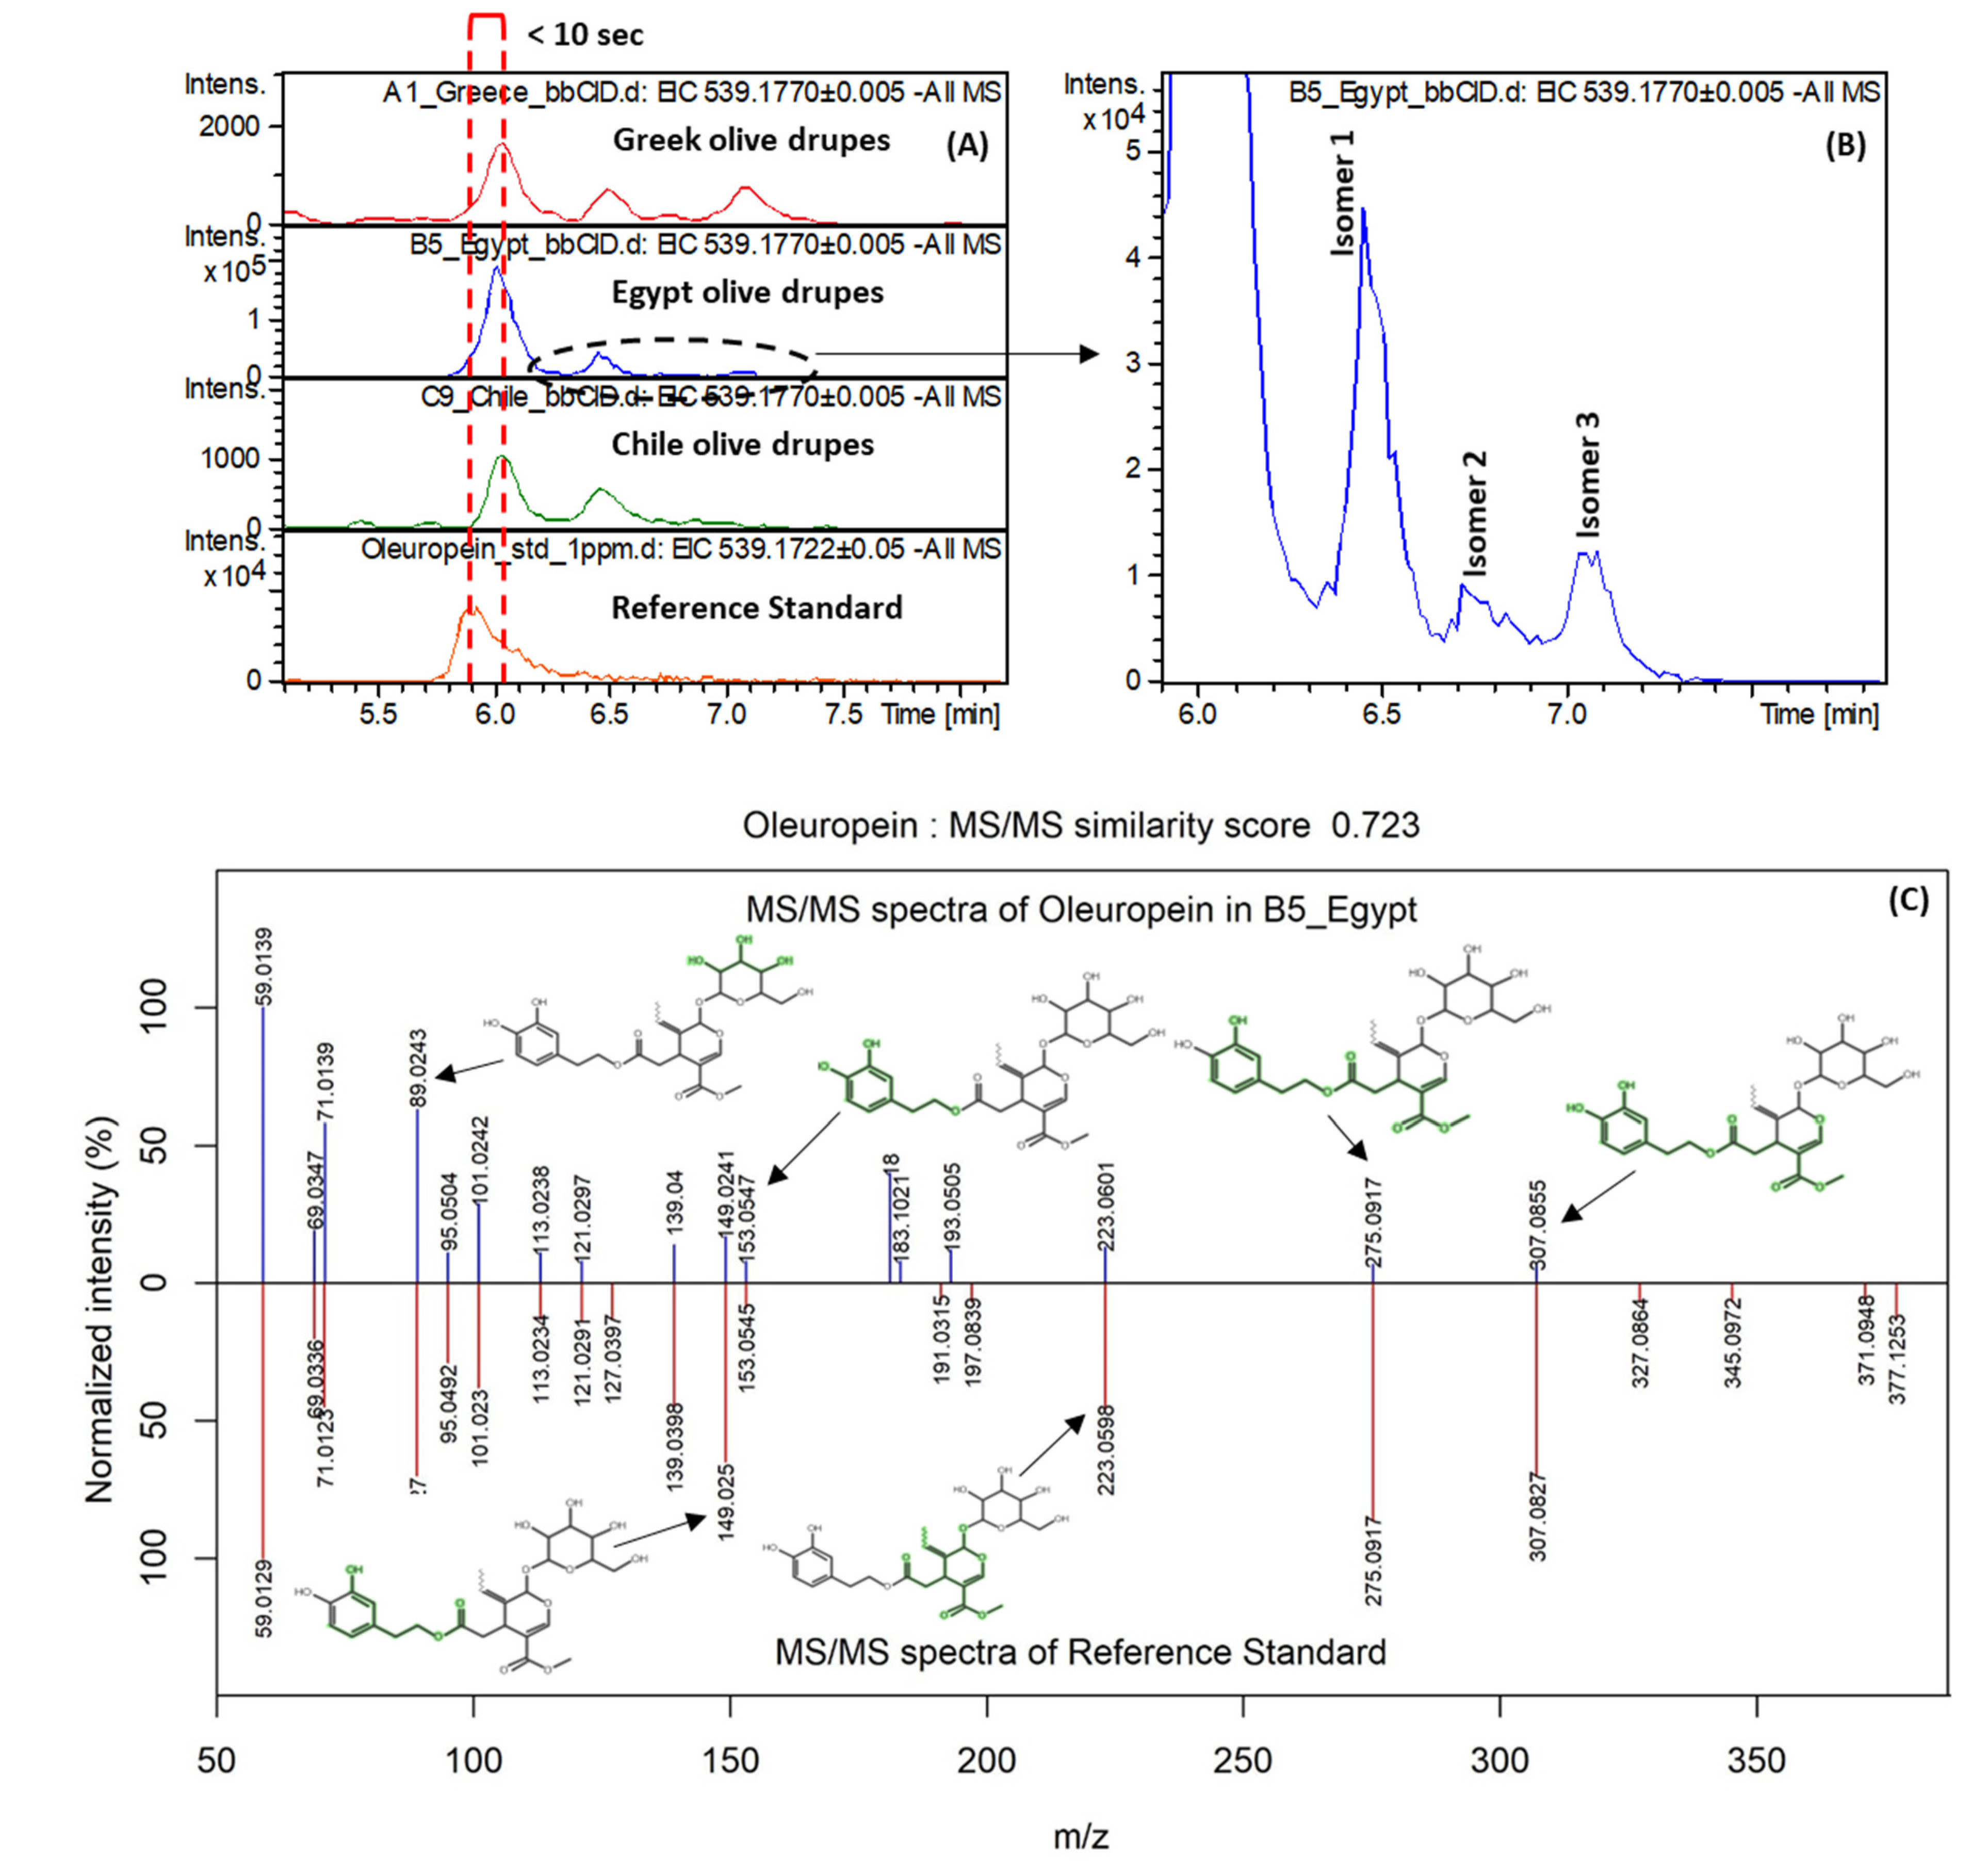
| Oleuropein | Secoiridoids | 539.1770 | C25H32O13 | 6.02 | Egypt | 2.354 | 0.25 | 3.049 | 59.0139, 101.0242, 181.0869, 275.0917, 307.0855 | 1 |
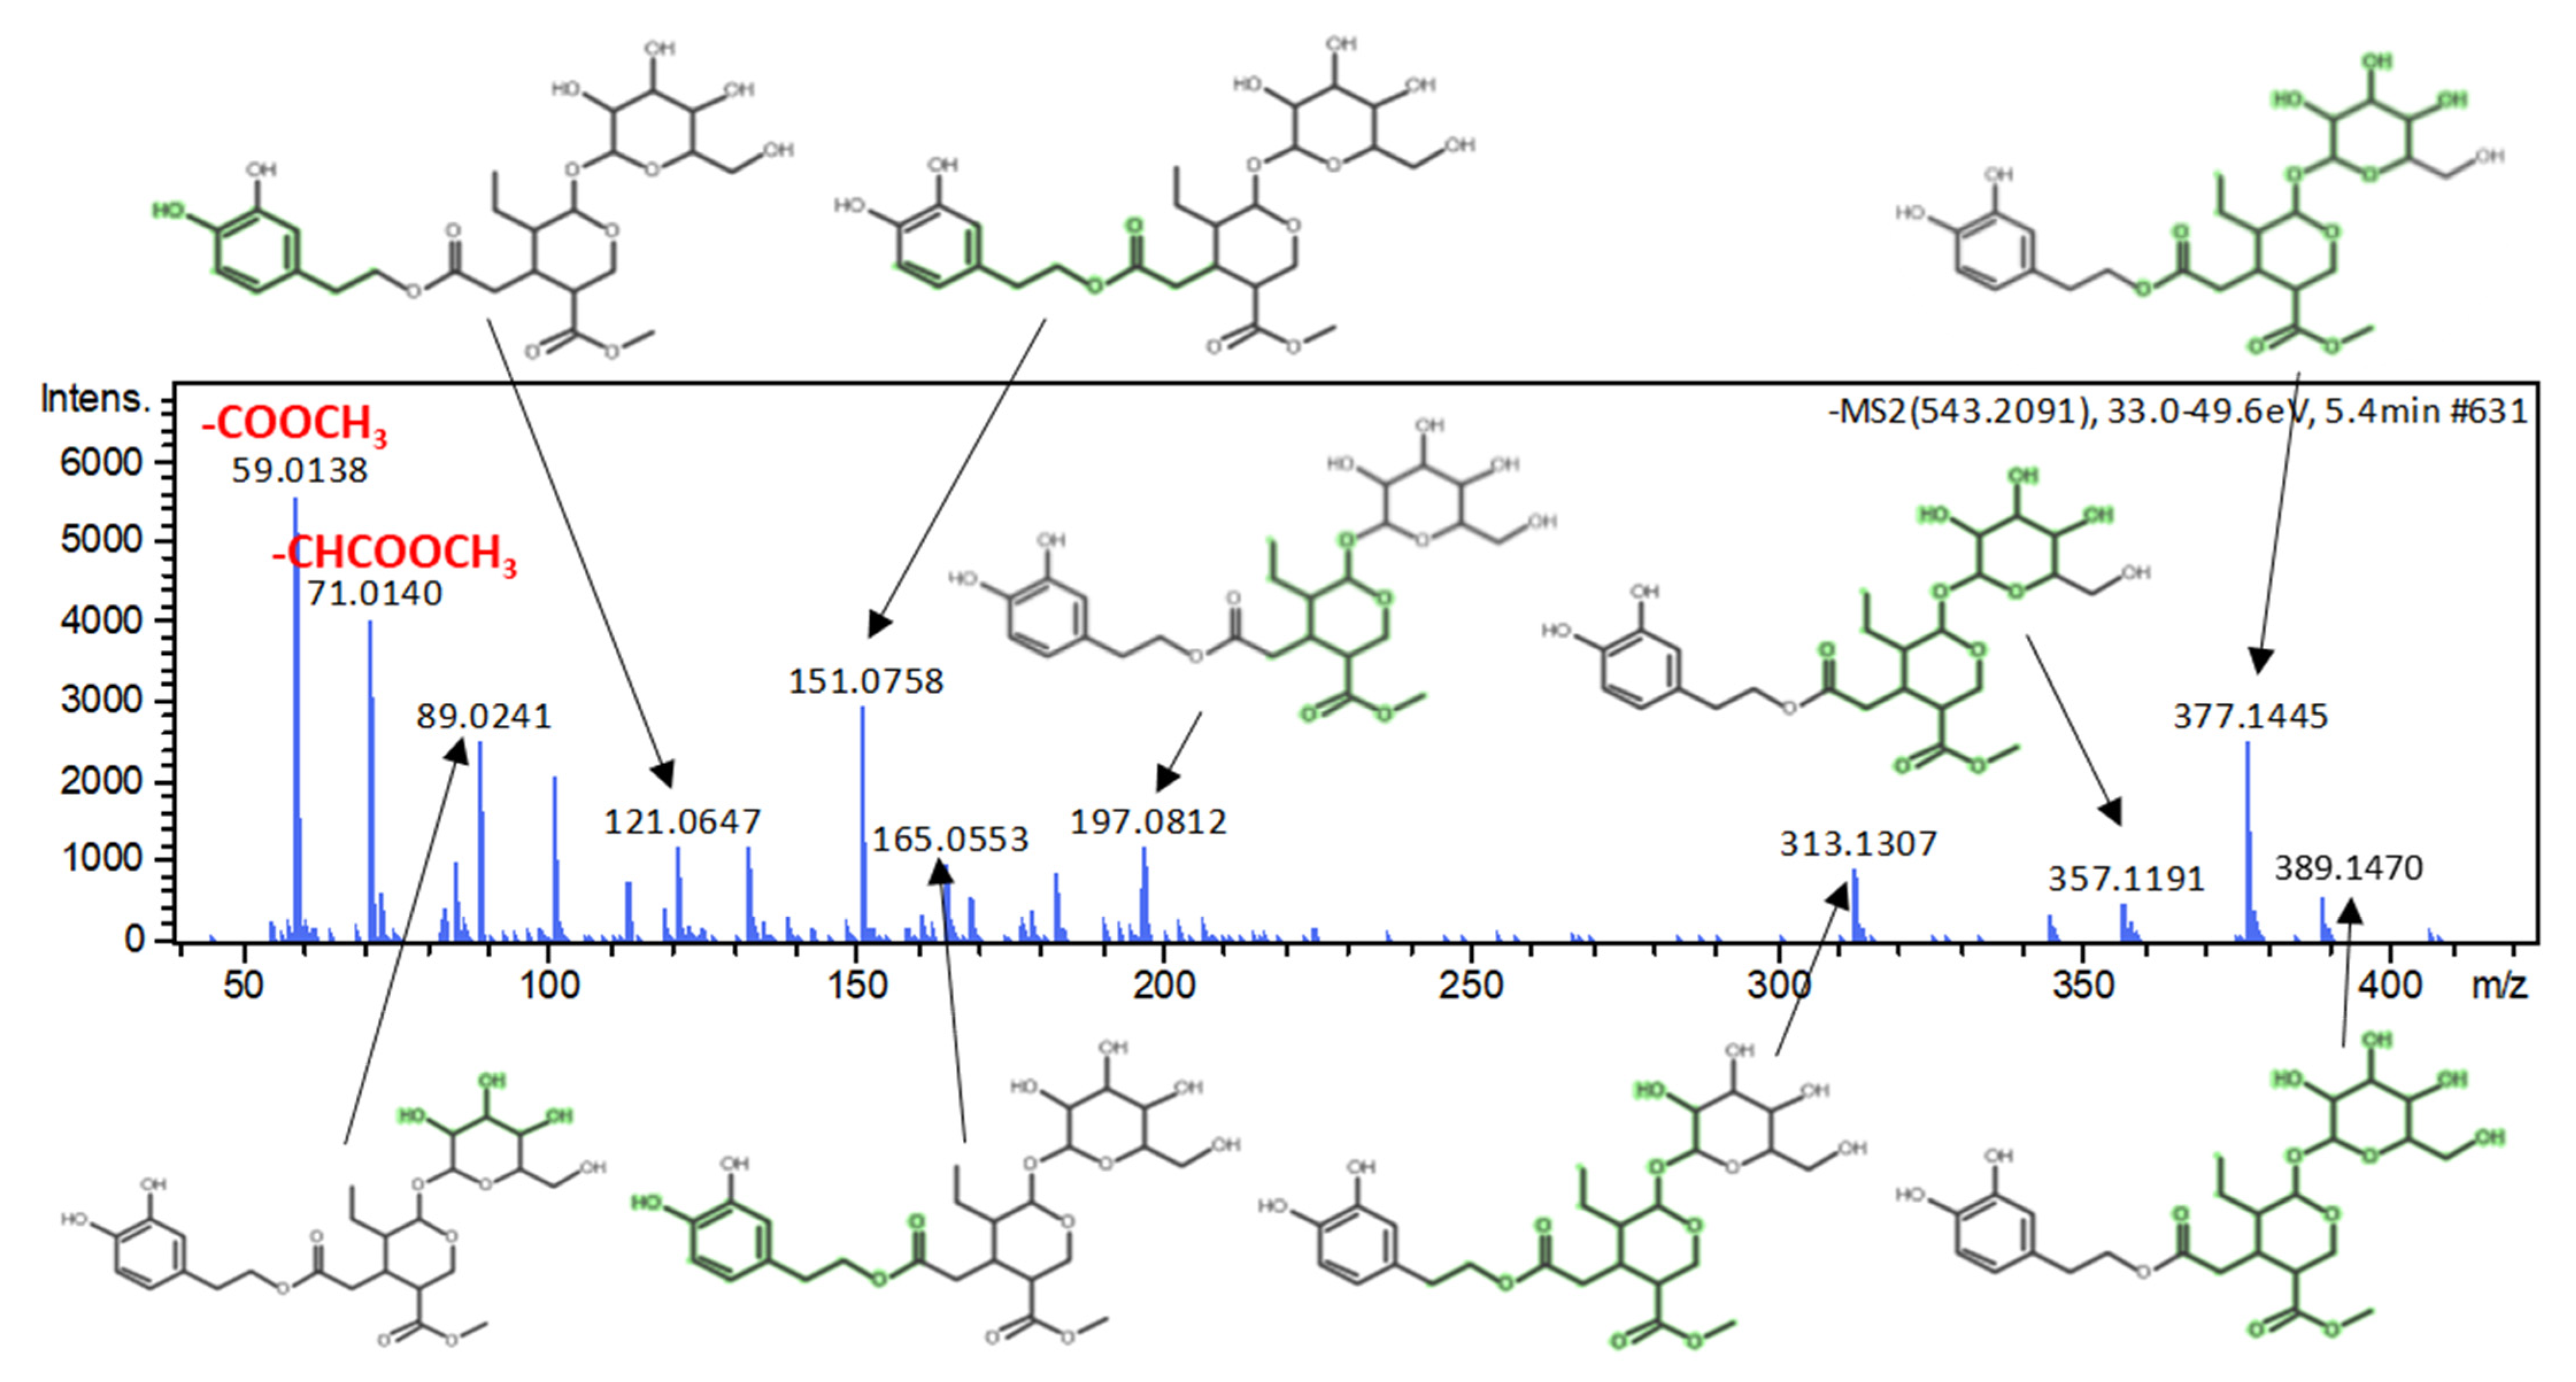
| Dihydrooleuropein | Secoiridoids | 543.2083 | C25H36O13 | 5.41 (9.25 a) | Egypt | 2.957 | 0.072 | 3.72 | 59.0138, 71.0139, 151.0758, 313.1307, 377.1445 | 3 |
| Verbascoside | Phenylpropanoids | 623.1981 | C29H36O15 | 4.97 (8.48 a) | Egypt | 9.278 | 0.552 | 11.386 | 113.0247, 161.0245, 315.1090, 461.1670, 623.1983 | 2a |
| Isoacteoside | Phenylpropanoids | 623.1981 | C29H36O15 | 5.48 (8.28 a) | Egypt | 8.979 | 0.542 | 10.984 | 135.0452, 161.0245, 315.1102, 461.1672, 623.1984 | 2b |
| β-Hydroxyverbascoside [Campneoside II] | Phenylpropanoids | 639.1931 | C29H36O16 | 4.41 (7.79 a) | Egypt | 8.015 | 1.738 | 11.251 | 151.0397, 161.0244, 179.0347, 459.1504, 621.1809 | 3 |
| Unknown or in-source fragment of Campneoside II | Phenols | 179.0350 | C9H8O4 | 4.16 | Egypt | 2.637 | 0.151 | 3.372 | 123.0442, 137.0238, 151.0395, 179.0352 | 4 |
© 2020 by the authors. Licensee MDPI, Basel, Switzerland. This article is an open access article distributed under the terms and conditions of the Creative Commons Attribution (CC BY) license (http://creativecommons.org/licenses/by/4.0/).
Share and Cite
Kalogiouri, N.P.; Aalizadeh, R.; Dasenaki, M.E.; Thomaidis, N.S. Authentication of Greek PDO Kalamata Table Olives: A Novel Non-Target High Resolution Mass Spectrometric Approach. Molecules 2020, 25, 2919. https://doi.org/10.3390/molecules25122919
Kalogiouri NP, Aalizadeh R, Dasenaki ME, Thomaidis NS. Authentication of Greek PDO Kalamata Table Olives: A Novel Non-Target High Resolution Mass Spectrometric Approach. Molecules. 2020; 25(12):2919. https://doi.org/10.3390/molecules25122919
Chicago/Turabian StyleKalogiouri, Natasa P., Reza Aalizadeh, Marilena E. Dasenaki, and Nikolaos S. Thomaidis. 2020. "Authentication of Greek PDO Kalamata Table Olives: A Novel Non-Target High Resolution Mass Spectrometric Approach" Molecules 25, no. 12: 2919. https://doi.org/10.3390/molecules25122919
APA StyleKalogiouri, N. P., Aalizadeh, R., Dasenaki, M. E., & Thomaidis, N. S. (2020). Authentication of Greek PDO Kalamata Table Olives: A Novel Non-Target High Resolution Mass Spectrometric Approach. Molecules, 25(12), 2919. https://doi.org/10.3390/molecules25122919