Article

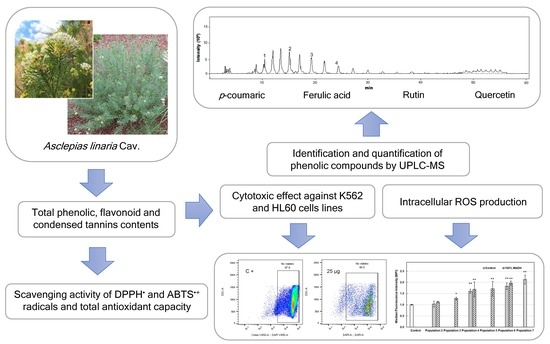
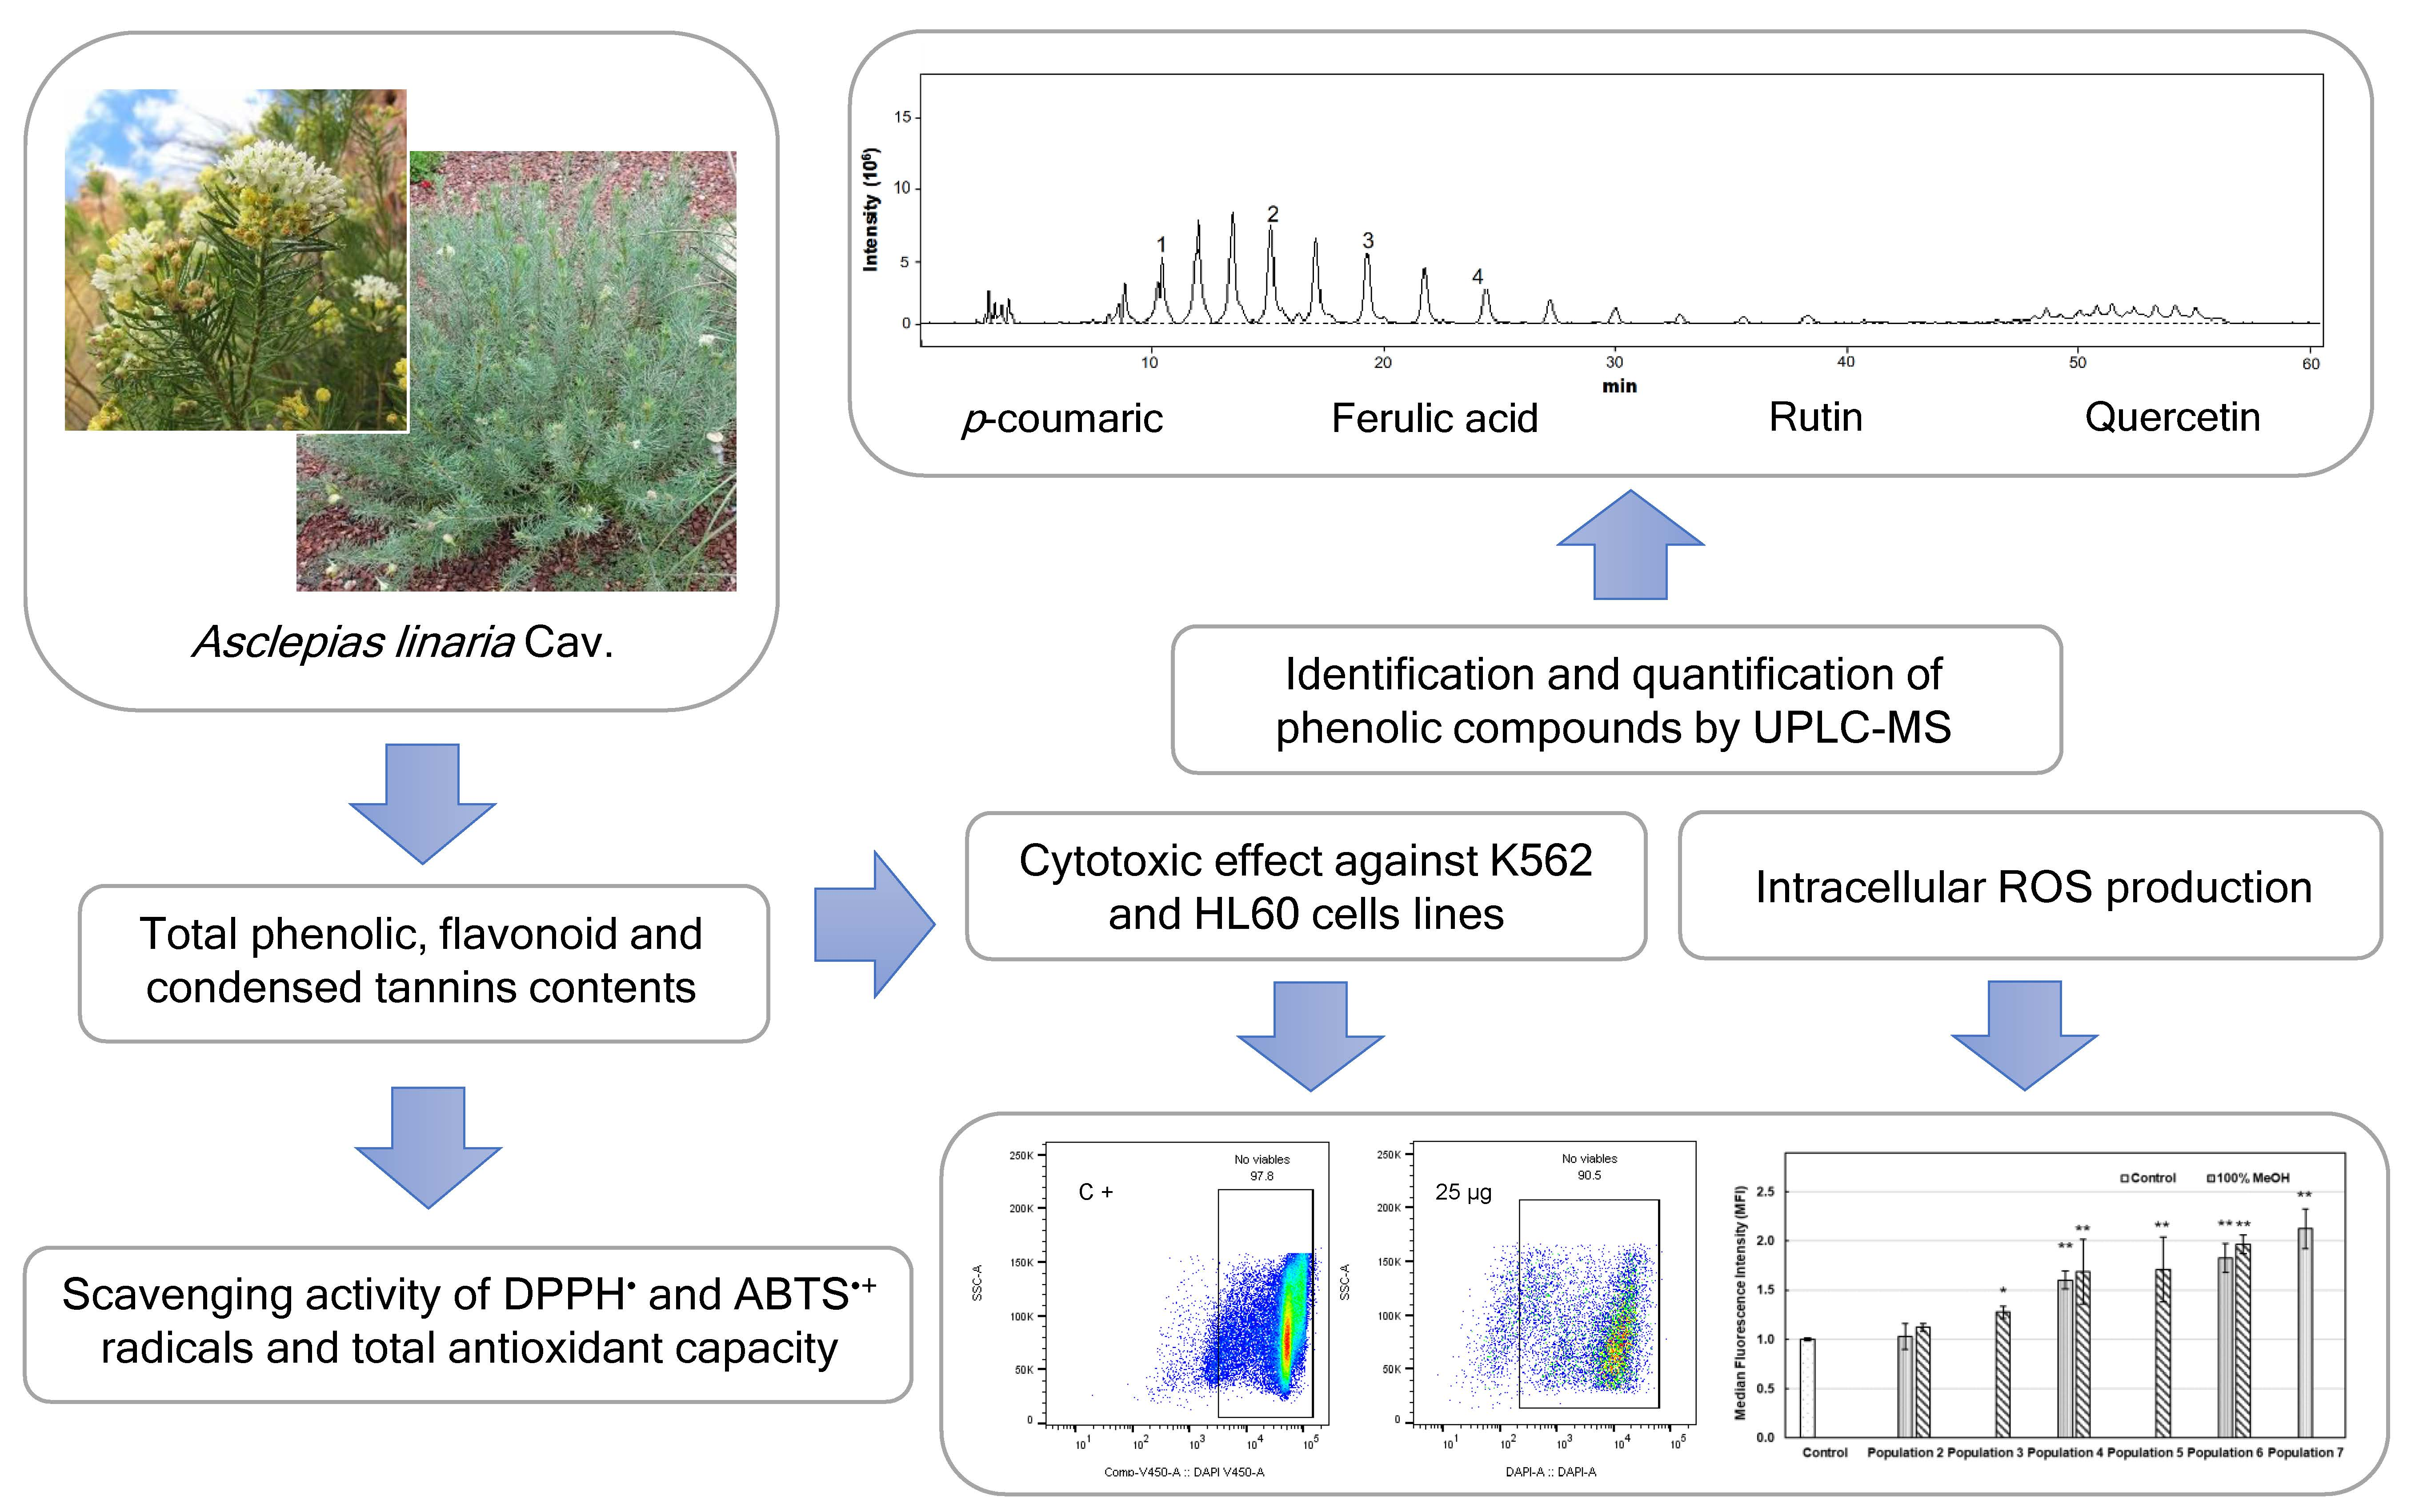
Phenolic Profile, Antioxidant and Anti-Proliferative Activities of Methanolic Extracts from Asclepias linaria Cav. Leaves

by
José Alejandro Sánchez-Gutiérrez
1,
Dafné Moreno-Lorenzana
2,
Dioselina Álvarez-Bernal
1,
Jacobo Rodríguez-Campos
3 and
José Roberto Medina-Medrano
4,*
1
Instituto Politécnico Nacional, Centro Interdisciplinario de Investigación para el Desarrollo Integral Regional Unidad Michoacán, Jiquilpan 59510, Michoacán, Mexico
2
CONACYT-Instituto Nacional de Pediatría, Coyoacán 04530, Ciudad de México, Mexico
3
Unidad de Servicios Analíticos y Metrológicos, Centro de Investigación y Asistencia en Tecnología y Diseño del Estado de Jalisco A.C. (CIATEJ), Guadalajara 44270, Jalisco, Mexico
4
CONACYT - Instituto Politécnico Nacional, Centro Interdisciplinario de Investigación para el Desarrollo Integral Regional Unidad Michoacán, Jiquilpan 59510, Michoacán, Mexico
*
Author to whom correspondence should be addressed.
Molecules 2020, 25(1), 54; https://doi.org/10.3390/molecules25010054
Submission received: 20 November 2019 / Revised: 17 December 2019 / Accepted: 18 December 2019 / Published: 23 December 2019
(This article belongs to the Special Issue Chromatographic Science of Natural Products)

Abstract

:
Asclepias linaria Cav. (Apocynaceae) is a shrubby plant endemic of Mexico which has been used in traditional medicine. However, the bioactive potential of this plant remains unexplored. In this study, the phenolic composition, antioxidant, and cytotoxic activities of A. linaria leaves were determined. In order to estimate the phenolic composition of the leaves, the total phenolic, flavonoid, and condensed tannins contents were determined. Furthermore, the antioxidant activity was measured by the scavenging activity of the 2,2-diphenyl-1-picrylhydrazyl (DPPH) and 2,2′-azino-bis[3-ethylbenzothiazoline-6-sulphonic acid] (ABTS•+) radicals and the total antioxidant capacity. The phenolic compounds identified in the A. linaria leaves by ultra-performance liquid chromatography coupled to mass spectrometry (UPLC-MS) include phenolic acids, such as p-coumaric and ferulic acid, as well as flavonoids, such as rutin and quercetin. The leaves’ extracts of A. linaria showed a high scavenging activity of DPPH and ABTS•+ radicals (IC50 0.12 ± 0.001 and 0.51 ± 0.003 µg/mL, respectively), high total antioxidant capacity values (99.77 ± 4.32 mg of ascorbic acid equivalents/g of dry tissue), and had a cytotoxic effect against K562 and HL60 hematologic neoplasia cells lines, but no toxicity towards the normal mononuclear cell line was observed. These results highlight the potential of A. linaria and could be considered as a possible alternative source of anticancer compounds.

Graphical Abstract

1. Introduction

The Apocynaceae family have approximately 5000 species and 395 genera classified in five subfamilies [1,2]. The Asclepiadoideae subfamily is one of the five subfamilies included in the Apocynaceae family [3,4]. Within this subfamily is the American genus Asclepias (milkweeds) with about 150 species, distributed in North and South America [5]. The genus in the Americas is found in a wide range of habitats, from deserts to swamps, plains to shaded forests, and may represent a rapid ecological expansion [6]. Most of the species that constitute this genus are provided with highly-specialized lactiferous cells which synthesize a milky latex when they are injured [7]. Previous chemical investigations of Asclepias species have shown that different types of steroidal compounds, such as cardenolides, pregnanes, and androstanes, usually as glycosides, are the main metabolites of these plants [8,9,10,11]. However, flavonoid glycosides [12], megastigmane glycosides [13], triterpenes [8,14], conduritols, and conduritol glycosides [15] have been also isolated from these plants.
Although Asclepias species are considered toxic, some of them are used in folk medicine as anthelmintic, analgesic, cardiotonic, and for the treatment of dermatological problems [16], cancer [8], pleuris, bronchitis [11], and asthma [14]. Such is the case of Asclepias curassavica, Asclepias albicans, Asclepias subulata, Asclepias quinquedentata, and Asclepias linaria. The species A. linaria Cav. is a plant endemic to Mexico which has been used in traditional medicine [16]. However, as far as we know, the bioactive potential of this plant remains unexplored. Therefore, the aim of the present work was to investigate the phenolic content and composition, antioxidant, and cytotoxic activity of A. linaria leaves from different populations.

2. Results and Discussion

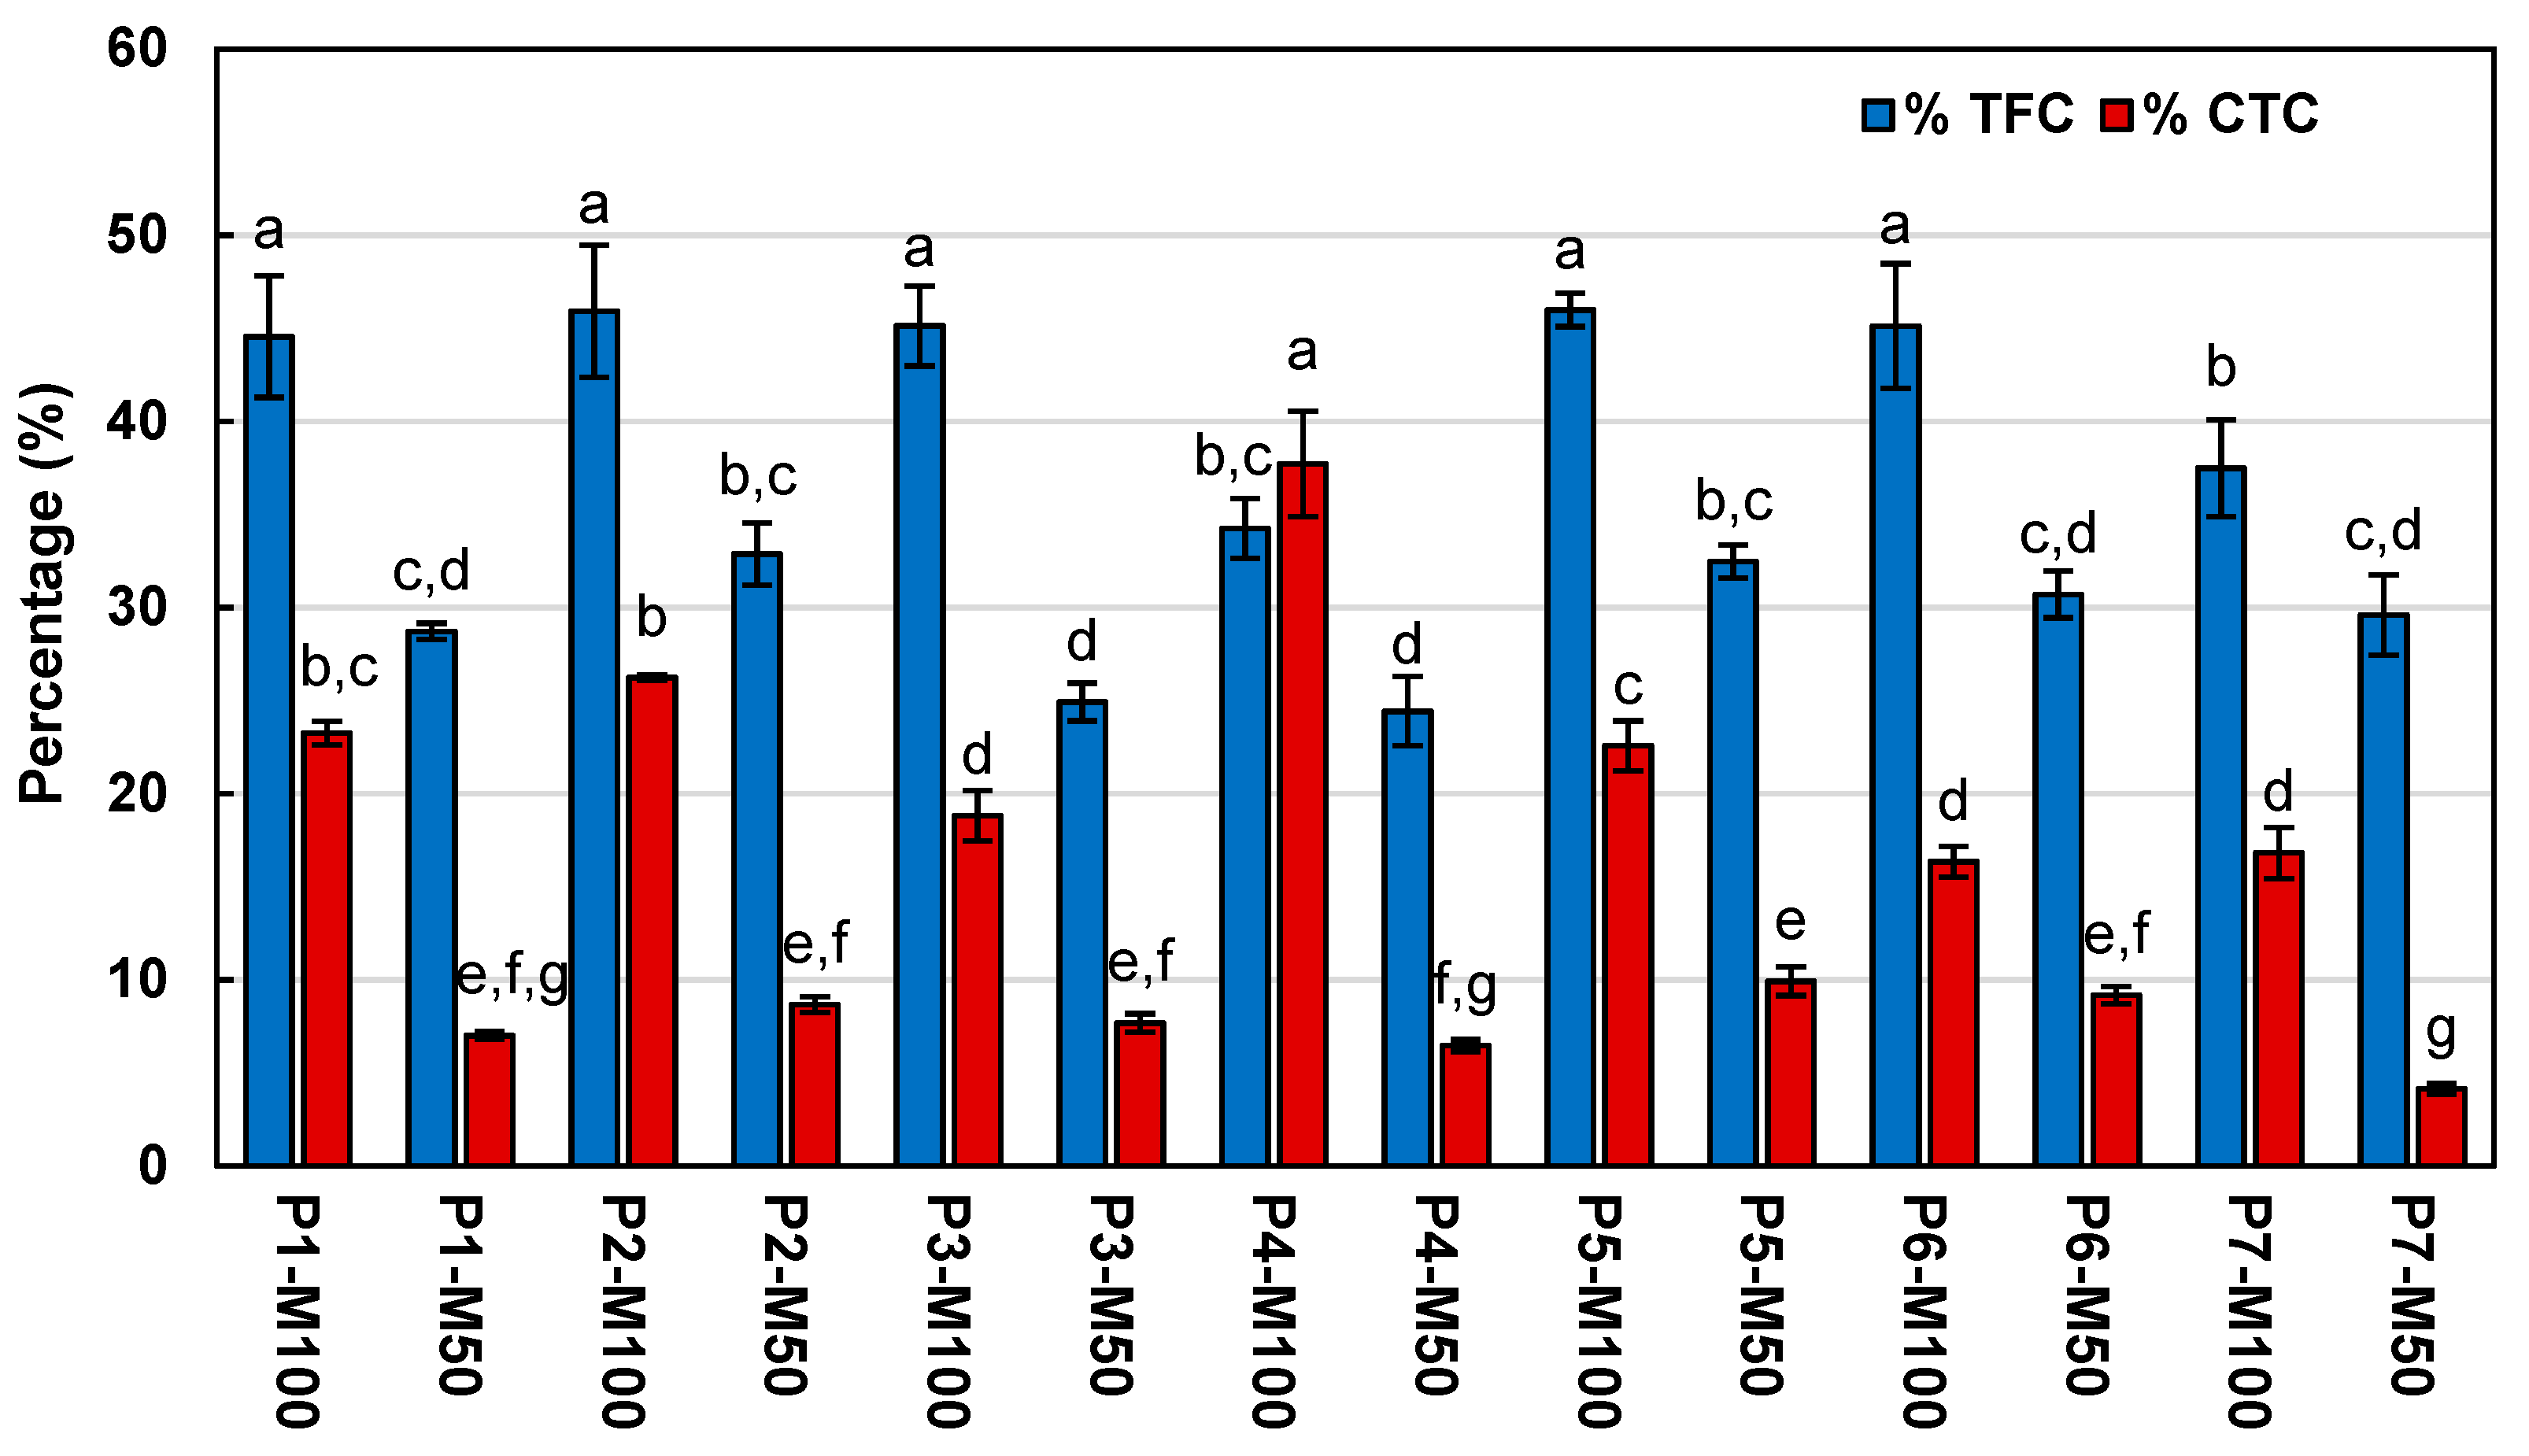
2.1. Total Phenolic, Flavonoid, and Tannin Contents

In order to estimate the phenolic composition of the methanolic extracts of A. linaria leaves, the total phenolic, flavonoid, and condensed tannins contents were determined. The total phenolic contents in leaf extracts from wild populations of A. linaria were shown in a range from 7.17 ± 0.46 to 10.50 ± 0.27 milligrams of gallic acid equivalents per gram of dry tissue (mg GAE/g DT). Populations 3, 4, and 7, extracted with 50% methanol (P3-M50, P4-M50, and P7-M50), showed the highest phenolic contents, while Population 1 extracted with 50% methanol (P1-M50) obtained the lowest content, differences that were statistically significant (Table 1). A tendency can be observed in the extracts from A. linaria analyzed in the present work, since the highest total phenolic contents were observed when 50% methanol was used, which indicates that the solvent combination methanol-water was more effective in the extraction of phenolic compounds than the individual use of the methanol solvent. The mean total phenolic content value of the extracts of A. linaria leaves analyzed in this study was 9.17 mg GAE/g DT. Previous studies reported a concentration of 9.95 mg GAE/g DT in ethanolic extracts of A. linaria leaves [17], and concentrations of 2.87 ± 0.1 and 11.79 ± 0.18 mg GAE/g DT, for aqueous and ethanolic (80% ethanol) extracts, respectively, from aerial parts of Asclepias syriaca [18], both similar to the values obtained by the methanolic extracts analyzed in this work.
Regarding the total flavonoids content in the methanolic extracts of A. linaria leaves, significant difference between samples was shown, since the highest content was observed in Population 5 extracted with 100% methanol (P5-M100), with 4.17 ± 0.31 mg of catechin equivalents (CE)/g DT, while the lowest content was observed in Population 4 extracted with 50% methanol (P4-M50), with 2.56 ± 0.26 mg CE/g DT. The above values represent 45.9 and 24.4%, respectively, of the total phenolic content (Figure 1).
As seen in Table 1, the total condensed tannins content was shown in a range from 0.43 ± 0.03 to 3.16 ± 0.16 mg CE/g DT. Population 4 extracted with methanol (P4-M100), showed the highest condensed tannins contents, while Population 7 extracted with 50% methanol (P7-M50) obtained the lowest content, differences that were statistically significant according to the analysis. As with the total flavonoid content, a clear tendency was observed, since a significantly highest tannins content was shown by the samples extracted with 100% methanol, followed by samples extracted with 50% methanol.
According to the analysis, a no clear correlation was observed between the different determinations of phenolic content, since the extracts that shown the highest total phenolic contents did not obtain the highest total flavonoid and condensed tannin contents. However, the highest percentages of flavonoids and condensed tannins were obtained in the samples extracted with 100% methanol (Figure 1), behavior that could be related to the effect of the solvent on the extraction of phenolic compounds, since, as mentioned above, the samples extracted with 100% methanol showed the highest contents of total flavonoids and condensed tannins.

2.2. Phenolic Compound Analysis by Ultra-Performance Liquid Chromatography Coupled to Mass Spectrometry (UPLC-MS)

The results of the phenolic profiles of the methanolic extracts from A. linaria leaves obtained by UPLC-MS revealed the presence of four phenolic compounds: two phenolic acids derived from cinnamic acid (p-coumaric acid and ferulic acid) and two flavonoids (rutin and quercetin). The data obtained did not indicate the presence of apigenin, naringin, catechin, vanillin, chlorogenic, cinnamic, gallic, and caffeic acid (Table 2). UPLC-MS chromatographic data showed variations on the phenolic composition and concentrations between the A. linaria populations analyzed in the present work. In addition to this, it was observed that the concentration and phenolic composition of the extracts were notoriously affected by the extraction solvent used, since the extracts with 100% methanol showed, in most cases (with exception of quercetin), higher individual concentration of the phenolic compounds was detected. The concentrations of the phenolic compounds identified in the 100% and 50% methanolic extracts from A. linaria leaves are summarized in Table 2.
As seen in Table 2, p-coumaric acid was identified in two of the seven populations extracted with 100% methanol (P4-M100 and P5-M100), and it was not identified in any of the evaluated populations. This behavior (presence or absence of p-coumaric acid) may be due to the solubility and polar nature of this compound, showing greater affinity to the solvent 100% methanol. Other authors reported the presence of vanillic, syringic and p-coumaric acid, in aqueous extracts of aerial parts from A. syriaca [18], while resorcylic, protocatechuic, p-hydroxybenzoic, syringic, caffeic, coumaric, ferulic and chlorogenic acid and the flavonoid vanillin, in ethanolic extracts of leaves and flowers of the same species [19]. The flavonoid rutin, compound present in all the analyzed extracts, showed to be the majority compound, since it obtained percentages of up to 90% and 100% (P6-M100 and P6-M50, respectively) with respect to the total phenolic composition. Overall, extracts from Population 7 (P7-M100 and P7-M50) showed a quantitative phenolic composition superior to the rest, which was statistically significant according to the analysis (p < 0.05). The correlation analysis indicated a significant positive correlation between rutin and ferulic acid contents (R = 0.881, p < 0.01) and between p-coumaric acid and the total condensed tannins content (R = 0.743, p < 0.01) of the extracts.
The presence of phenolic compounds has not been previously reported for the A. linaria species analyzed in this work. Identification of this phenolic compounds in A. linaria extracts should be helpful for further separation and bioactivity study.

2.3. Antioxidant Activity

Phenolic compounds have shown to possess antioxidant properties. In this work, A. linaria leaves extracts showed scavenging activity of ABTS•+ and DPPH radicals as well as relevant antioxidant capacity.
As seen in Table 1, a significant difference between samples was observed. The extracts from Populations 1 and 3 extracted with 50% methanol (P1-M50 and P3-M50) exhibited the lowest IC50 values and thus significantly highest scavenging activity of ABTS•+ radical. Regarding the scavenging activity of DPPH radical, in the same way as with ABTS•+ radical, the extract from Population 1 extracted with 50% methanol (P1-M50) shown the lowest values IC50 (Table 1). Interestingly, P1-M50 extract showed a high phenolic content but a low concentration of flavonoids and condensed tannins (Table 1). Despite the above, their main constituents were quercetin and rutin flavonoids (Table 2), which have a high free radical scavenging activity reported, behaving as the strongest O2 radical scavengers [20,21].
The significantly higher scavenging activity of ABTS•+ and DPPH radicals were shown by samples of A. linaria extracted with 50% methanol, and the samples that showed the lowest scavenging activity of ABTS•+ and DPPH radicals were the samples extracted with 100% methanol, behavior that could be related to the effect of the solvent on the extraction of phenolic compounds, since as mentioned above, the samples extracted with the hydromethanolic combination showed the highest contents of total phenolic compounds. Additionally, a strong correlation was observed between the total phenolic content with the IC50 values of ABTS•+ radical (R = −0.723, p < 0.01) indicating that increasing quantity of total phenolics leads to a quantitative decrease of the IC50 values of the extracts and thus significantly higher scavenging activity of ABTS•+ radical. Otherwise, unclear correlations were shown between the phenolic contents of the A. linaria extracts or their phenolic compounds detected by UPLC-MS with the scavenging activity of DPPH radical. Regarding the scavenging activity of ABTS•+ and DPPH radicals of the standard rutin used as a positive control, IC50 values of 0.062 ± 0.001 and 0.28 ± 0.001 mg/mL, respectively, were observed.
The analysis of the total antioxidant capacity of the methanolic extracts from leaves of seven populations of A. linaria showed values in a range of 17.96 ± 1.47 to 99.77 ± 4.32 mg of ascorbic acid equivalents (AAE)/g DT (Table 1). The extract from Population 1 extracted with 50% methanol (P1-M50) shown the lowest antioxidant capacity, while the extracts of A. linaria from Populations 6 and 7, extracted with 100% methanol (P6-M100 and P7-M100) exhibited the highest antioxidant capacity, with 99.77 ± 4.32 and 95.49 ± 4.32 mg AAE/g DT, respectively. A marked effect of the extraction solvent on the total antioxidant activity was observed, since as with the total flavonoid and tannins contents, a significantly highest antioxidant capacity was shown by the samples extracted with 100% methanol. The correlation analysis did not show a clear correlation between the phenolic, flavonoid, and condensed tannins contents with the total antioxidant capacity, however, the antioxidant capacity will not always depend on the concentration of phenolic compounds, but rather on the type of antioxidant compound, the amount of hydroxyl groups and their position within the antioxidant molecule they constitute [20]. In that sense, both extracts (P6-M100 and P7-M100) revealed high individual concentrations of ferulic acid, rutin and quercetin, and, specifically, the highest concentrations of ferulic acid and rutin (P7-M100), this based on the phenolic profiles obtained by UPLC-MS, which are shown in Table 2. In accordance with the above, moderate correlations were shown between individual concentrations of ferulic acid and rutin with total antioxidant capacity (R = 0.680, p < 0.01 and R = 0.723, p < 0.01, respectively). The above can help to deduce the remarkable antioxidant capacity that the extracts with the highest concentration of these two flavonoids showed. In addition, some authors establish that the antioxidant capacity of ferulic acid may become similar to that of ascorbic acid (vitamin C) [22], so this could also influence the increase in the antioxidant capacity of the extracts of A. linaria from these populations.
Considering our results, we can hypothesize that the presence of flavonoids in A. linaria may be responsible for their radical scavenging activity and antioxidant capacity.

2.4. Cytotoxic Activity

The cytotoxic effect of the foliar methanolic extracts of A. linaria against three cell lines was determined, of which two were hematologic neoplasia cells lines (K562 and HL60) and, as non-cancer, normal mononuclear cells (NMC). Furthermore, a positive control treated with 2.5 μM imatinib was used. In K562 cells treated with imatinib a 99.60 ± 0.06% inhibition on cell viability was observed. The values of median inhibitory concentration (IC50) of the extracts of A. linaria obtained are summarized in Table 3.
As observed in Table 3, based on the IC50 values, the extracts that had the greatest effect against K562 and HL60 hematologic neoplasia cell lines, correspond to P2-M50 and P7-M100. As mentioned earlier, although the P7-M100 extract showed moderate concentrations of total phenols, flavonoids and condensed tannins (Table 1), it also showed the highest individual concentrations of ferulic acid and rutin, as well as moderate concentrations of quercetin (Table 2). As reported in the literature, these phenolic compounds could have a direct relationship with the anti-proliferative and cytotoxic effect observed against K562 and HL60 cells through various mechanisms, which are: inhibition of the enzyme ribonucleotide reductase (responsible for reducing deoxyribonucleotides to ribonucleotides); BCR/ABL tyrosine kinase protein inhibition, NF-κB and COX-2; induction of cell apoptosis by activation of caspases 9 and 3; increase in Bax protein (pro-apoptotic protein); arrest of tumor growth or even induction of apoptosis by intracellular increase of reactive oxygen species (ROS) [23,24,25]. These effects will depend on the dose and concentration of phenolic compounds present in the extracts. In accordance with the above, moderate correlations were shown between individual concentration of ferulic acid with IC50 values of the extracts against HL60 cell line (R = −0.611, p < 0.01).
Regarding the effect of quercetin and rutin flavonoids, these compounds are considered as one of the most active against cancer, even using low concentrations, since the characteristic mechanisms of these compounds are: condensation of nuclear chromatin; fragmentation of genetic material (DNA); arrest of the cell cycle; enzyme tyrosine kinase inhibition and induction of apoptosis in cells on G1 and S phase of the cell cycle [10,26,27]. Similarly, other authors mention that the combination of two or more of these mechanisms may be responsible for the chemotherapeutic or preventive nature of polyphenolic compounds [28]. These mechanisms have been reported in different cell lines, including K562. The observed cytotoxic effects could be related to the presence of ferulic acid, rutin, and quercetin in the A. linaria leaves extracts.
Table 3 also shows the results of growth inhibition of NMC as well as the SI obtained. The extracts that showed the least effect (which is what is desired in this case) were P3-M50 and P7-M50, with an IC50 values of 187.30 ± 43.58 and 244.9 ± 96.16 µg/mL, respectively. To the author’s best knowledge, there are no previous reports on the cytotoxic effects of A. linaria extracts.

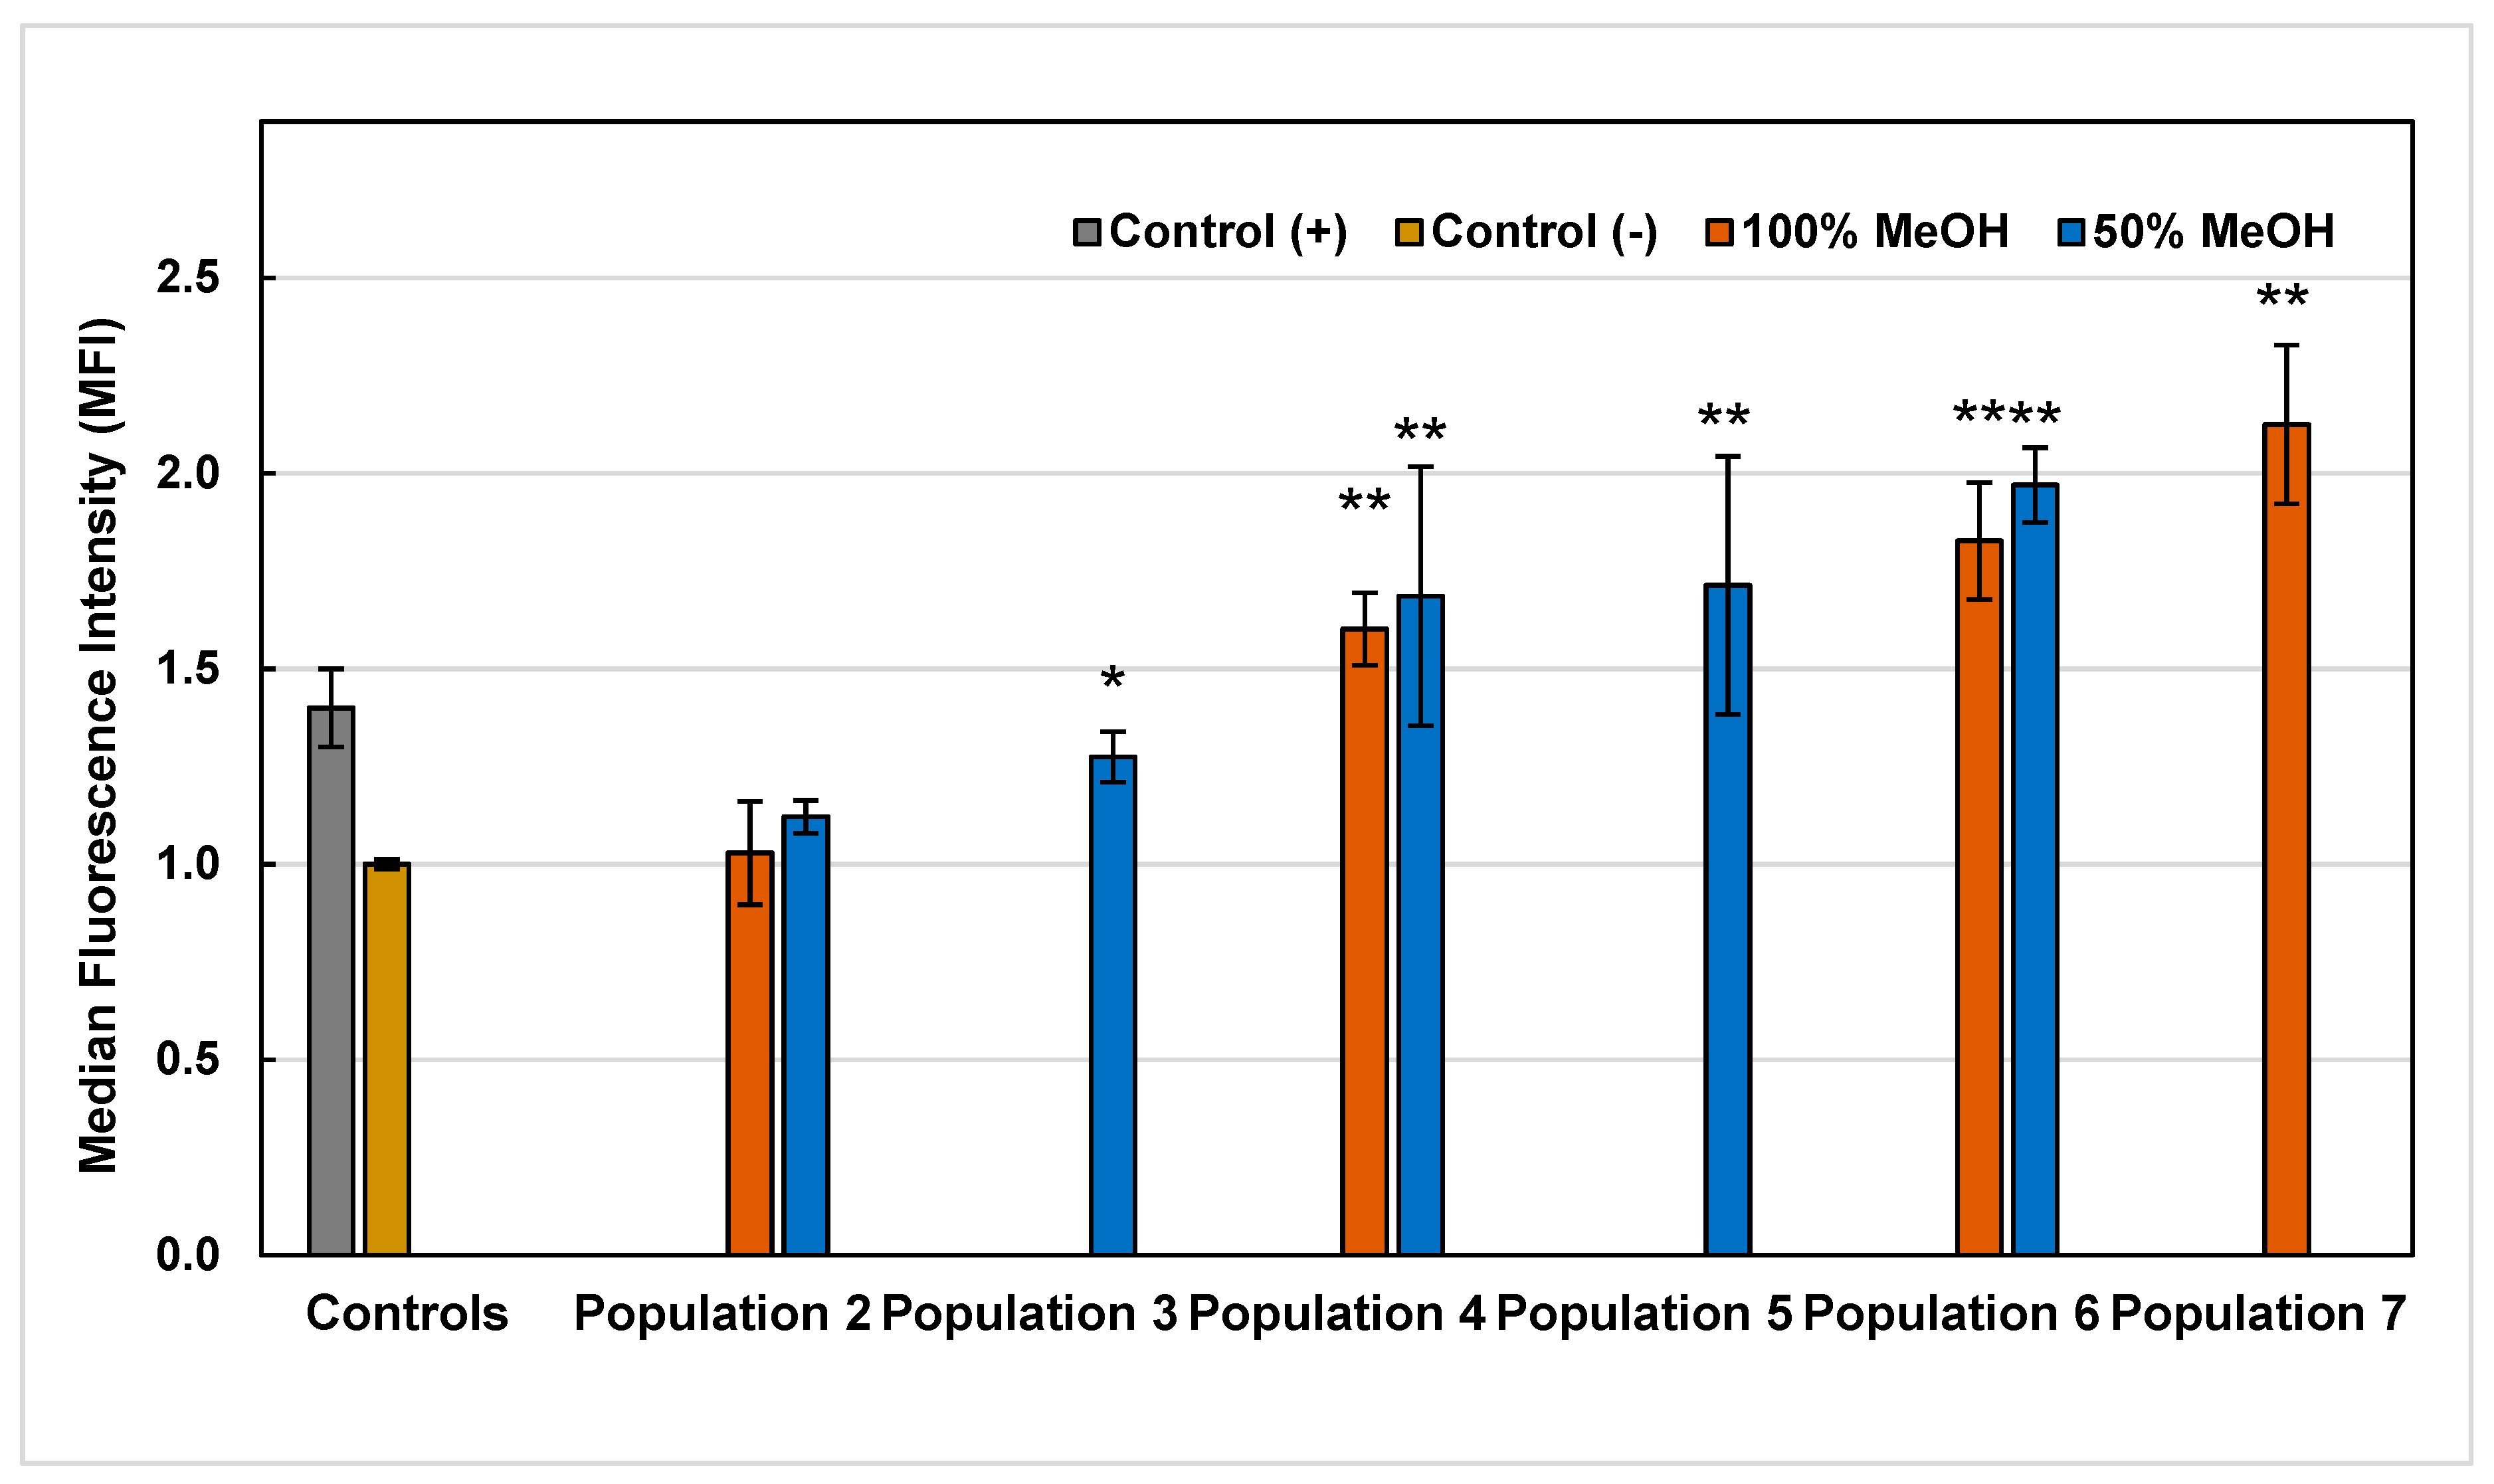
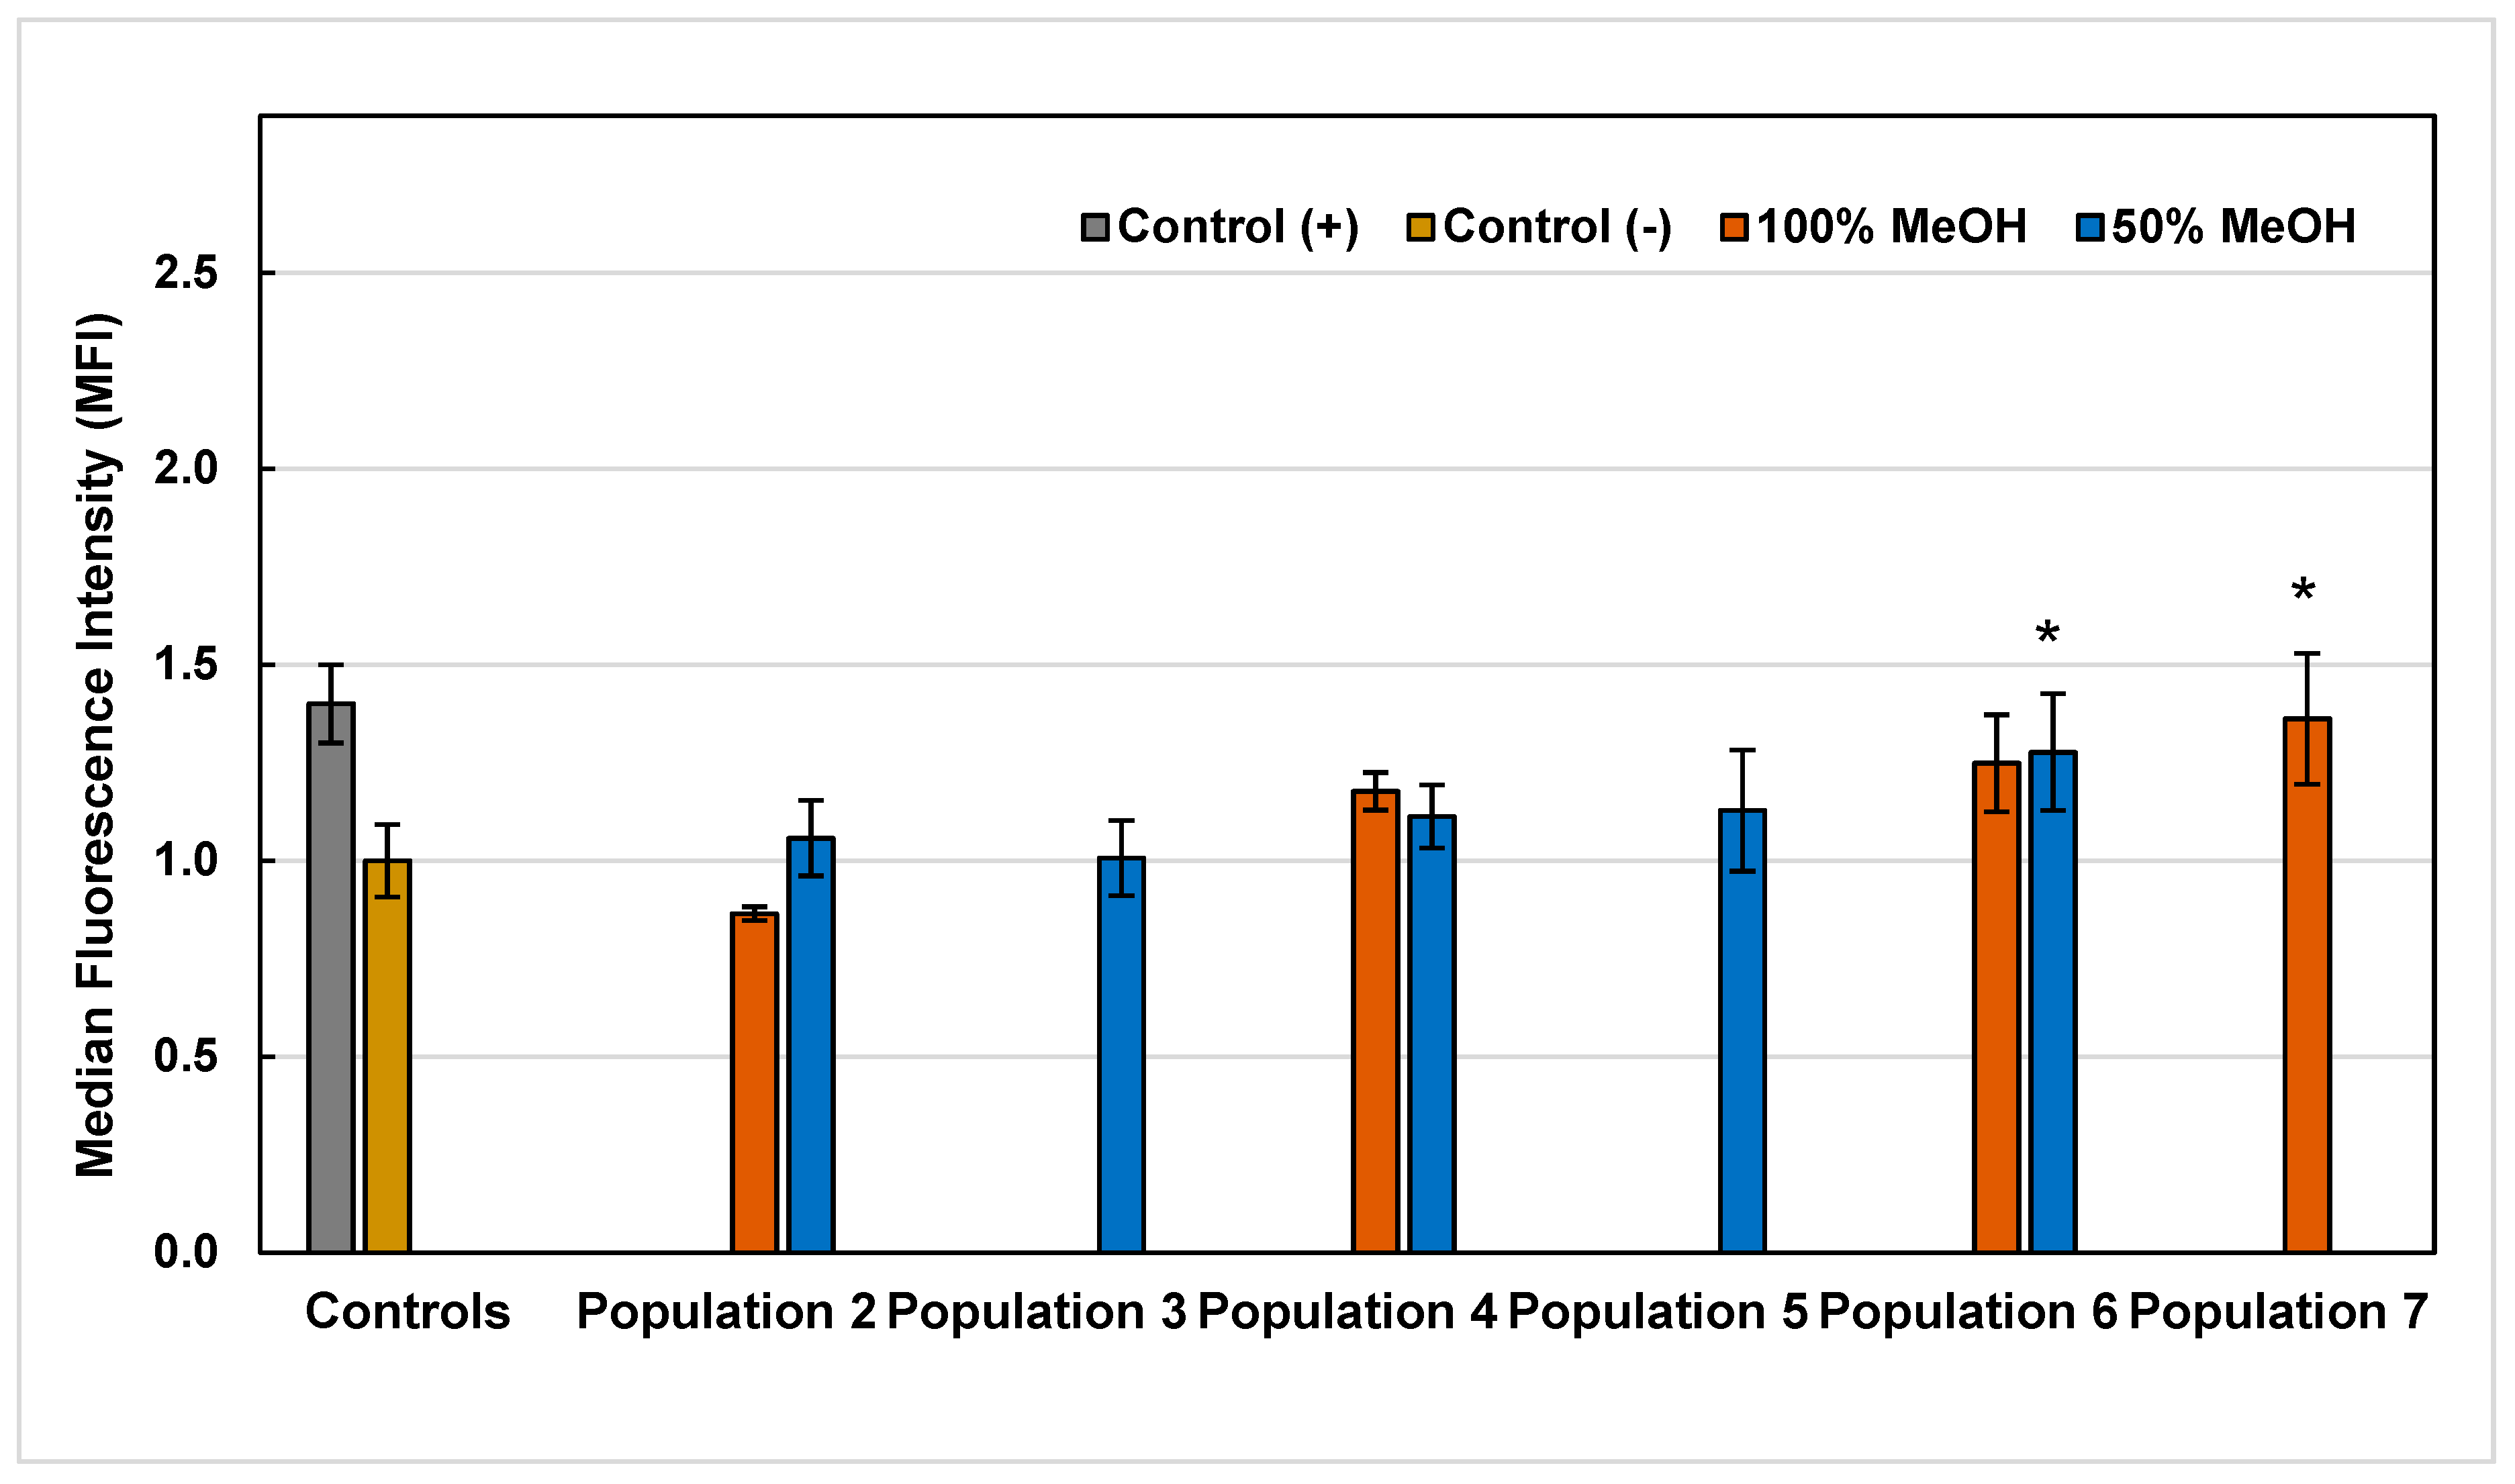
2.5. Reactive Oxygen Species (ROS)

With the intention of elucidating and proposing a possible mechanism of action through which the methanolic extracts from A. linaria leaves induced cytotoxicity and affected proliferation in cancer cells, it was decided to evaluate the effect on intracellular production of ROS, caused by the exposure of HL60 cells to extracts at two different times: 1 and 3 h. According to the discrimination made, nine of the 14 extracts were selected for the ROS assay. The results of the intracellular production of ROS obtained are presented in Figure 2 and Figure 3.
As can be seen in Figure 2, after 1 h of the exposure of HL60 cells to the extracts, seven of the nine extracts evaluated had a significant pro-oxidant effect, since extracts from Population 3 to 7 increased the value of initial median fluorescence intensity (MFI) of control cells, generated by the baseline ROS that characterize HL60 cells (in a range from 0.03 to 1.13 MFI). Otherwise, it was observed with P2-M50 and P2-M100 extracts, since their ROS production was not statistically different from the control, therefore, they showed no pro-oxidant effect. On the other hand, 3 h after exposure, it was observed that only two of the nine extracts evaluated maintained the pro-oxidant effect (P6-M50 and P7-M100), the others were not statistically different from the control (Figure 3). The P6-M50 and P7-M100 extracts that maintained the pro-oxidant effect showed high concentrations of phenolic, flavonoid and tannin compounds in general (Table 1), and, specifically, for P7-M100 extract, the highest concentrations of rutin and quercetin (Table 2). Otherwise, it was observed in the P6-M50 extract, which did not report considerable concentrations of any of the 12 standards analyzed by UPLC-MS. Accordingly, the phenolic composition of this extract could be completely different from the other extracts analyzed in this study.
The observed results can be considered contradictory, since the main mechanism attributed to phenolic compounds is to function as antioxidant molecules, however, there are several investigations that indicate that phenolic compounds, specifically flavonoids such as rutin and quercetin, have the ability to behave as pro-oxidants, this depending on the concentration, structure, functional groups, and their location within the molecule, and most importantly, the conditions under which these compounds carry out the oxidation-reduction reaction [29,30,31,32,33,34]. The pro-oxidant capacity of these compounds will also depend on the presence of pyrogallol or catechol groups in these compounds, since they induce the production of highly cytotoxic hydrogen peroxide radicals (H2O2) [31,32]. In addition, this effect has been observed more frequently when the doses or concentrations of flavonoids are high, as in this case. Based on the above, it can be inferred that the extracts of A. linaria that showed higher concentrations of flavonoids, increase the possibility of behaving as pro-oxidants, this under the physiological conditions established by cancer cells.
The effect generated by the extracts of A. linaria analyzed in this study was considered partly beneficial, because the extracts showed cytotoxic effect and could be considered as a possible alternative for new research and source of anticancer compounds.

3. Materials and Methods

3.1. Reagents and Standards

The Folin–Ciocalteu reagent, 2,2-diphenyl-1-picrylhydrazyl (DPPH), 2,2′-azino-bis[3-ethylbenzothiazoline-6-sulphonic acid] (ABTS•+), potassium persulfate, ammonium molybdate, ascorbic acid, sodium carbonate, aluminum chloride, formic acid, methanol, and water (HPLC grade) were purchased from Sigma-Aldrich (St. Louis, MO, USA). Nylon membranes (0.22 µm, Millipore, Milford, MA, USA) were used for ultra-performance liquid chromatography coupled to mass spectrometry (UPLC–MS) analysis. Roswell Park Memorial Institute culture medium (RPMI-1640), fetal bovine serum (FBS), streptomycin/penicillin, fluorescence-activated cell sorting (FACS) Flow cytometry solution, 4′,6′-diamino-2-phenylindole (DAPI), 2′,7′-dichlorodihydrofluorescein diacetate (DCFDA), amphotericin B, and dimethylsulfoxide (DMSO) were purchased from Gibco (Grand Island, NY, USA). Ficoll-paque Plus was purchased from GE Healthcare Bio-Sciences (Uppsala, Sweden). Endothelial basal medium-2 (EBM-2) was purchased from Cambrex (Walkersville, MD, USA). Parthenolide was purchased from Abcam (Cambridge, MA, USA). Turk solution and trypan blue were purchased from Hycel (Estado de México, México). Imatinib was purchased from SelleckChem (Houston, TX, USA).
Caffeic acid, chlorogenic acid, cinnamic acid, ferulic acid, gallic acid, p-coumaric acid, apigenin, catechin, naringin, rutin, quercetin, and vanillin (>99%) (Sigma-Aldrich, St Louis, MO, USA). Standards were prepared as stock solutions in methanol. Working solutions of standards were obtained by diluting the stock solution in methanol to obtain concentrations ranging from 0.25–5 µg/mL. Working solutions of standards were stored in dark conditions at −18 °C.

3.2. Plant Material and Sample Preparation

A. linaria specimens were collected during the months of September and October 2017 at Fray Dominguez, Pajuacarán, Mexican state of Michoacán (20°5´58.999” N, 102°33´12.999” W, and 1827 m altitude). The specimens were authenticated by Dr. Monserrat Vázquez Sánchez, from Colegio de Postgraduados, Campus Montecillo, México. Voucher herbarium specimens were deposited at the herbarium of CIIDIR-IPN Unidad Michoacán, with herbarium number MVS29. Seven populations were collected. Leaves were separated from the plants and dried in an oven at 50 °C for 48 h. Then, the leaves were ground in a mortar until a fine powder was obtained. Subsequently, a sieve (number 60) was used in order to homogenize the particle size to 250 µm. Samples were stored at room temperature in dark conditions until they were used.
The extraction of phenolic compounds was carried out using 1 g of dry milled tissue which was macerated in 20 mL of solvent (50% methanol, or 100% methanol, v/v) by agitation at 100 rpm using a shaking table in the dark at room temperature for 24 h. Subsequently, the extracts were centrifuged at 2722× g for 10 min at room temperature. The supernatant was recovered and filtered through Whatman No. 1 filter paper (pore size 11 µm) (Whatman International Ltd., Maidstone, UK) to form the crude extract. Aliquots of the extract were taken for the phenolic content and antioxidant determinations.

3.3. Determination of Total Phenolic, Flavonoid, and Tannin Contents

3.3.1. Determination of Total Phenolic Content

The determination of total phenolic contents of the samples was carried out using the Folin–Ciocalteu reagent method with modifications [35]. Two hundred and fifty µL of methanolic extract were mixed with 2.5 mL of distilled water, followed by 125 µL of 1N Folin–Ciocalteu reagent, and stirred for 5 min. Finally, 375 µL of 20% (w/v) Na2CO3 solution was added and kept up in dark conditions for 2 h at room temperature. Absorbance was read at 760 nm using a PowerWave HT Microplate Spectrophotometer (BioTek Instruments, Inc., Winooski, VT, USA). Total phenolic contents were estimated using a gallic acid standard curve (A760 = 0.0027 [gallic acid] + 0.0211, R2 = 0.9889), obtained using seven known concentrations (0.04–0.46 mg/mL) of the compound. Total phenolic content was expressed as milligrams of gallic acid equivalents per gram of dry tissue (mg GAE/g DT).

3.3.2. Determination of Total Flavonoid Content

Total flavonoid content of each sample was determined by AlCl3 method previously reported, with slight modifications [36]. One mL of methanolic extract was added with 1 mL of 2% (w/v) solution of AlCl3·6H2O. Absorbance was measured after 10 min at 430 nm using a PowerWave HT Microplate Spectrophotometer (BioTek Instruments, Inc., Winooski, VT, USA). Total flavonoid contents were calculated using a catechin standard curve (A430 = 0.0326 [catechin] − 0.0011, R2 = 0.9900) obtained using seven concentrations of catechin (0.05–0.5 mg/mL). Flavonoid contents were expressed as milligrams of catechin equivalents per gram dry tissue (mg CE/g DT).

3.3.3. Determination of Condensed Tannins

The vanillin-H2SO4 methodology was used to determine procyanidins contents in the extracts [37]. A total of 250 µL of each sample were reacted with 250 µL of 1% vanillin (w/v, dissolved in methanol) followed by 250 µL of the 25% sulfuric acid solution (v/v, dissolved in methanol) and incubated at a temperature of 30 °C for 15 min. Absorbance was read at 500 nm using a PowerWave HT Microplate Spectrophotometer (BioTek Instruments, Inc., Winooski, VT, USA). To estimate the concentration of tannins, a calibration curve with catechin (A500 = 1.5821 [catechin] + 0.0094, R2 = 0.9960) was performed at different concentrations (0.01–0.25 mg/mL). Condensed tannins contents were expressed as milligrams of catechin equivalents per gram dry tissue (mg CE/g DT).

3.4. Phenolic Compounds Analysis by Ultra-Performance Liquid Chromatography Coupled to Mass Spectrometry (UPLC-MS)

3.4.1. Sample Preparation for Phenolic Compounds Determination by UPLC-MS

The extracts (2.5 mL) were transferred to a 10 mL glass vial and taken to full dryness under a gentle stream of nitrogen at 50 °C using a TurboVap Classic LV (Biotage, Charlotte, NC, USA) at constant pressure (12 psi for 1h and 16 min). Each extract was resuspended individually in 2 mL of distilled water and frozen at −20 °C for 48 h. Subsequently, the extracts were lyophilized using a Labconco freeze dryer, model 77530 (Labconco, Kansas City, MO, USA) at −56 °C for 72 h and under high vacuum conditions (0.014 mBar). Once dried, the extracts were stored under refrigeration at 4 °C protected from light.

3.4.2. Identification and Quantification of Phenolic Compounds by UPLC-MS

An Acquity I-class UPLC system (Waters, Milford, MA, USA) was used for the analysis, and consisted of a quaternary pump (QSM), a flow-through-needle (FTN) cooled autosampler, a column oven, and a sample organizer, equipped with a Waters BEH C18 column (100 mm × 2.1 mm, 1.7 µm) (Waters, Dublin, Ireland), and was coupled to a Xevo TQ-S micro Tandem Mass Spectrometer (Waters, Milford, MA, USA). Dry extracts were resuspended individually in absolute methanol and 20 μL of extract were injected into the system. The column temperature was maintained at 30 °C. The mobile phases were 0.3% formic acid (A) and methanol (B), with a flow rate of 0.3 mL/min. The elution gradient was as follows: 90% A as initial condition, 30% A at 11 min, and 90% A at 15 min. The conditions of the micro TQ-S were as follows: 3 kV capillary voltage, the ionization source was in electrospray mode (ESI- and ESI+), the desolvation temperature was 500 °C, the desolvation gas (nitrogen) flow was set at 1000 L/h and the source temperature was 150 °C. Measurements were performed in multiple reaction monitoring (MRM) mode. The selection of MRM transitions and optimization of product ions was performed by infusion of individual standard solutions of all the analytes. Fractional MRM was conducted to ensure the number of acquisitions at least 20, making the dwell time reach a maximum for each MRM transition. Table 4 summarizes the conditions for all MRM transitions, including the retention time (tR). The standards used were: caffeic acid, chlorogenic acid, cinnamic acid, ferulic acid, gallic acid, p-coumaric acid, apigenin, catechin, naringin, rutin, quercetin, and vanillin. Quantification of the phenolic compounds was carried out using a calibration curve in the range of 0.25–5 µg/mL. The concentration was expressed as micrograms per milliliter (µg/mL) of extract. The sum of all individual phenolic compounds identified was expressed as total phenolic compounds.

3.5. Antioxidant Activity

3.5.1. DPPH Free Radical Scavenging Assay

The determination of free radical scavenging activity was performed using the DPPH method previusly described with modifications [38]. For this method, a 24 µM ethanol solution of DPPH was prepared. To determine the scavenging activity, 90 µL of DPPH reagent were mixed with 10 µL of extract (concentration gradually increased, 0.025–0.250 mg/mL) and they were incubated at room temperature for 10 min. After incubation, the absorbance was measured at 523 nm using a PowerWave HT Microplate Spectrophotometer (BioTek Instruments, Inc., Winooski, VT, USA).
The scavenging effect of DPPH was measured using the formula:
DPPH   scavenging   effect   ( % )   =   [ ( A control     A sample   )   /   A control ]   ×   100
where Acontrol is the absorbance of the control (DPPH solution), and Asample is the absorbance of the test sample (DPPH solution plus 10 µL of extract). The scavenging effect was expressed as the median inhibitory concentration (IC50) in milligrams per milliliter (mg/mL). The IC50 represents the extract concentration needed to reduce by 50% the initial DPPH absorbance. IC50 was determined using linear regression. Rutin (0.05–0.5 mg/mL dissolved in methanol) was used as a positive control.

3.5.2. ABTS•+ Radical Scavenging Assay

Antioxidant activity of methanolic extracts were evaluated using ABTS•+ radical scavenging assay, following methodology previously described [39]. Briefly, ABTS•+ was dissolved in distilled water to 7 mM concentration. ABTS•+ radical cations were produced by reacting 1 mL of ABTS•+ stock solution with 17.6 µL of 140 mM potassium persulfate and allowing the mixture to stand in the dark at room temperature for 12 h before use. The ABTS•+ solution was diluted with deionized water to obtain an absorbance of 0.70 (±0.01) at 734 nm. After addition of 50 µL of diluted ABTS•+ radical solution to 50 µL of the sample (A. linaria leaves extracts), the absorbance was registered at 734 nm after 6 min using a PowerWave HT Microplate Spectrophotometer (BioTek Instruments, Inc., Winooski, VT, USA). The assay was performed with nine extract concentrations (0.125–1.250 mg/mL, dissolved in methanol). The scavenging effect percentage was calculated using the formula:
ABTS +   scavenging   effect   ( % )   =   [ ( A blank     A sample   )   /   A blank ]   ×   100
where Ablank represents the absorbance of the blank (ABTS•+ solution plus 50 µL of corresponding solvent), Asample is the absorbance of the test sample (ABTS•+ solution plus 50 µL of extract). The extract concentration (mg/mL) that provided a 50% inhibition of the ABTS•+ radical (IC50) was calculated from a graphic built with inhibition percentage versus extract concentration. Rutin (0.006–0.15 mg/mL dissolved in methanol) was used as a positive control.

3.5.3. Total Antioxidant Capacity

The total antioxidant capacity was evaluated using the phosphomolybdenum method [40]. In this method, the formation of a green phosphate/Mo (V) complex for the reduction of Mo (VI) to Mo (V) by an antioxidant is measured at an acidic pH. To achieve this, 100 µL of extracts were combined with 1 mL of a solution (0.6 M sulfuric acid, 28 mM sodium phosphate, and 4 mM ammonium molybdate). Samples were incubated in a thermo-block at 95 °C for 90 min. The samples were subsequently cooled to room temperature, and the absorbance of each was measured at 695 nm using a PowerWave HT Microplate Spectrophotometer (BioTek Instruments, Inc., Winooski, VT, USA) against a blank formed by all components of the reaction mixture and adding absolute methanol instead of extract. An ascorbic acid standard curve (A695 = 0.5002 [ascorbic acid] − 0.0036, R2 = 0.9845) was generated with seven concentrations of ascorbic acid (0.03–0.3 mg/mL). Total antioxidant capacity values were expressed as milligrams of ascorbic acid equivalents per gram of dry tissue (AAE/g DT).

3.6. Cell Culture, Cytotoxic Effect, and Reactive Oxygen Species (ROS) Assay

3.6.1. Cell Lines

K562 and HL60 hematologic neoplasia cells lines, purchased from American Type Culture Collection (ATCC), and normal mononuclear cells (NMC), obtained from a healthy individual were used. NMC were obtained according to the previously described methodology [41]. One hundred mL of peripheral blood was collected from a healthy donor (male and 36 years old). Blood (100 mL) was diluted 1:1 with phosphate-buffered saline (PBS) (Invitrogen, Grand Island, NY, USA) and overlaid onto an equivalent volume of Ficoll-paque Plus (1.077 ± 0.001 g/mL). Cells were centrifuged at 740 × g for 30 min at room temperature. NMC were isolated and washed twice with endothelial basal medium-2 (EBM-2) supplemented with 3% FBS, 10 ng/mL streptomycin/penicillin, and 0.25 μg/mL amphotericin B (complete EGM-2 medium). The number of viable nucleated cells was determined in a Neubauer chamber (Marienfeld, Germany) using Turk solution as a diluent and trypan blue, respectively. All cell lines were grown in RPMI-1640 culture medium added with 10% FBS and 1% antibiotic (streptomycin/penicillin) in 5% CO2 atmosphere at 37 °C [42].

3.6.2. Cell Viability and Proliferation Assay

In order to determine the cytotoxic effect of the A. linaria extracts, the cell lines (2 × 10⁵) were plated in 24 well plates and exposed in vitro with different concentrations of dry extracts (25, 50, 75, 100, 150 µg/mL) diluted in 0.1% (v/v) DMSO for 48 h at 37 °C. Subsequently, the cells were washed using 1 mL of FACS Flow cytometry solution, and centrifuged at a speed of 423× g for 6 min at 19 °C. Then, the supernatant was decanted and 200 µL of FACS cytometry solution and 200 µL of DAPI fluorescent label (2 µL/mL) were added. After that, the cells were incubated for 15 min at the same conditions previously mentioned. Finally, the viability was evaluated in a BD FACSVerse flow cytometer (BD Biosciences, San Jose, CA, USA). In all cases, a negative control (without extract) and a positive control (with 2.5 µM Imatinib) were used. The value of the median inhibitory concentration (IC50) was calculated using the FlowJo software version 10 (Becton, Dickinson and Company, Franklin Lakes, NJ, USA).

3.6.3. Selectivity Index

To measure the selective cytotoxicity of the extracts against cancerous cells and the safety of the extracts towards normal cells, the selectivity index (SI) was determined. Therefore, the extracts were tested for cytotoxicity in the NMC cell line.
The SI was calculated using the following equation:
SI   =   IC 50   NMC   cells   /   IC 50   cancer   cells

3.6.4. Reactive Oxygen Species (ROS) Assay

The reactive oxygen species (ROS) assay was performed exclusively on the HL60 cell line. A discrimination filter was applied to select the extracts that were analyzed by the ROS assay. The filter consisted of identifying those extracts that had a SI ≥ 5, a moderate to high concentration of phenolic compounds (7 to 10 mg GAE/g DT), moderate to high concentration of flavonoid compounds (2.5 to 4 mg CE/g DT), and those with an IC50 value ≤ 30 µg/mL of cytotoxic activity. Consequently, 9 extracts that showed the highest potential were analyzed.
The ROS assay consisted of applying the extract concentration (IC50 value) of each of the selected extracts after discrimination, obtained in the cell viability and proliferation test against the HL60 cell line. First, the cells were stained with 2 µL of 20 µM DCFDA reagent which oxidizes and fluoresces when it reacts with ROS and incubated for 30 min at 37 °C. Then, the cells were exposed in the absence (negative control) or presence (IC50 value) to the extracts at two different evaluation times: 1 and 3 h. Parthenolide at 7.5 µM (dissolved in DMSO) was used as a positive control. Subsequently, the production of ROS was evaluated with a BD FACSVerse flow cytometry (BD Biosciences, San Jose, CA, USA). Finally, the data obtained from the flow cytometry were analyzed with the FlowJo software version 10 (Becton, Dickinson and Company, Franklin Lakes, NJ, USA) and expressed as median fluorescence intensity (MFI).

3.7. Statistical Analysis

All determinations were performed in triplicate. Results are reported as the mean ± standard deviation of three independent replicates. Results were subjected to an analysis of variance (ANOVA). Differences between values with a p < 0.05 were considered significant for the phenolic contents and antioxidants determinations. Tukey’s test was performed for the comparison of means for the corresponding results. For the cell assays, the extracts concentrations were log-transformed (base 10) to normalize the data. Dunnett’s test was used to assess the statistical significance of differences between test and control data (p < 0.05 and p < 0.01). Relationships between all determinations were tested using Pearson’s correlation. These analyses were carried out using SPSS software version 25.0 (SPSS Inc, Chicago, IL, USA).

4. Conclusions

The phenolic composition, antioxidant and cytotoxic activities of A. linaria leaves were determined. The phenolic composition of A. linaria leaves showed that the main compounds were flavonoids and phenolic acids. The recognized antioxidant flavonoids, rutin, and quercetin were identified in A. linaria leaves. In addition, the leaves extracts of A. linaria showed a high radical scavenging activity, high total antioxidant capacity values, and had cytotoxic effect against K562 and HL60 hematologic neoplasia cells lines, but no toxicity towards the normal mononuclear cell line was observed. It can be concluded that the A. linaria species has the potential to be a source of extraction of phenolic compounds with relevant antioxidant and cytotoxic activities, with applications in multiple research fields.

Author Contributions

Conceptualization: J.R.M.-M.; methodology: J.A.S.-G.; software: J.R.-C. and D.M.-L.; validation: J.R.-C. and D.M.-L.; formal analysis: J.R.-C. and D.M.-L.; investigation: J.A.S.-G.; resources: D.Á.-B.; data curation: J.A.S.-G. and J.R.M.-M.; writing—original draft preparation: J.A.S.-G.; writing—review and editing: J.R.M.-M.; visualization: D.M.-L.; supervision: J.R.M.-M.; project administration: D.Á.-B.; funding acquisition: D.Á.-B. All authors have read and agreed to the published version of the manuscript.

Funding

This research was funded by the program “Chairs for Young Researchers” (Cátedras para Jóvenes Investigadores), grant numbers 1747 and 2038, Consejo Nacional de Ciencia y Tecnología (CONACYT), México.

Acknowledgments

J.A.S.-G. thanks the Consejo Nacional de Ciencia y Tecnología (CONACYT) for a scholarship awarded (no. 291169). J.R.M.-M. gratefully acknowledges CIIDIR-IPN Unidad Michoacán and Centro de Investigación y Asistencia en Tecnología y Diseño del Estado de Jalisco (CIATEJ), Guadalajara, México. D.M.-L. thanks Instituto Nacional de Pediatría. Special thanks to Monserrat Vázquez Sánchez for her help in collecting the samples and identifying the plant species.

Conflicts of Interest

The authors declare no conflict of interest.

References

  1. Endress, M.E.; Bruyns, P.V. A revised classification of the Apocynaceae s.l. Bot. Rev. 2000, 66, 1–56. [Google Scholar] [CrossRef] [Green Version]
  2. Endress, M. Apocynaceae: Brown and now. Telopea 2004, 10, 525–541. [Google Scholar]
  3. Kamel, E.A.R.; Sharawy, S.M.; Karakish, E.A.K. Cytotaxonomical investigations of the tribes Asclepiadeae and Ceropegieae of the subfamily Asclepiadoideae-Apocynaceae. Pakistan J. Bot. 2014, 46, 1351–1361. [Google Scholar]
  4. Juárez-Jaimes, V.; Alvarado-Cárdenas, L.O.; Villaseñor, J.L. La familia Apocynaceae sensu lato en México: Diversidad y distribución. Rev. Mex. Biodivers. 2007, 78, 459–482. [Google Scholar] [CrossRef] [Green Version]
  5. Fishbein, M.; Chuba, D.; Ellison, C.; Mason-Gamer, R.J.; Lynch, S.P. Phylogenetic Relationships of Asclepias (Apocynaceae) Inferred from Non-coding Chloroplast DNA Sequences. Syst. Bot. 2011, 36, 1008–1023. [Google Scholar] [CrossRef] [Green Version]
  6. Fishbein, M.; Straub, S.C.K.; Boutte, J.; Hansen, K.; Cronn, R.C.; Liston, A. Evolution at the tips: Asclepias phylogenomics and new perspectives on leaf surfaces. Am. J. Bot. 2018, 105, 514–524. [Google Scholar] [CrossRef] [Green Version]
  7. Ramos, M.V.; Demarco, D.; da Costa Souza, I.C.; de Freitas, C.D.T. Laticifers, Latex, and Their Role in Plant Defense. Trends Plant. Sci. 2019, 24, 553–567. [Google Scholar] [CrossRef]
  8. Roy, M.C.; Chang, F.R.; Huang, H.C.; Chiang, M.Y.N.; Wu, Y.C. Cytotoxic principles from the Formosan milkweed, Asclepias curassavica. J. Nat. Prod. 2005, 68, 1494–1499. [Google Scholar] [CrossRef]
  9. Zhang, R.R.; Tian, H.Y.; Tan, Y.F.; Chung, T.Y.; Sun, X.H.; Xia, X.; Ye, W.C.; Middleton, D.A.; Fedosova, N.; Esmann, M.; et al. Structures, chemotaxonomic significance, cytotoxic and Na+,K+-ATPase inhibitory activities of new cardenolides from Asclepias curassavica. Org. Biomol. Chem. 2014, 12, 8919–8929. [Google Scholar] [CrossRef]
  10. Wei, Y.Q.; Zhao, X.; Kariya, Y.; Fukata, H.; Teshigawara, K.; Uchida, A. Induction of Apoptosis by Quercetin: Involvement of Heat Shock Protein. Cancer Res. 1994, 54, 4952–4957. [Google Scholar]
  11. Warashina, T.; Noro, T. 8,12;8,20-diepoxy-8,14-secopregnane glycosides from the aerial parts of Asclepias tuberosa. Chem. Pharm. Bull. 2010, 58, 172–179. [Google Scholar] [CrossRef] [PubMed] [Green Version]
  12. Haribal, M.; Renwick, J.A.A. Oviposition stimulants for the monarch butterfly: Flavonol glycosides from Asclepias curassavica. Phytochemistry 1996, 41, 139–144. [Google Scholar] [CrossRef]
  13. Abe, F.; Yamauchi, T. 5,11-epoxymegastigmanes from the leaves of Asclepias fruticosa. Chem. Pharm. Bull. 2000, 48, 1908–1911. [Google Scholar] [CrossRef] [PubMed] [Green Version]
  14. Araya, J.J.; Kindscher, K.; Timmermann, B.N. Cytotoxic cardiac glycosides and other compounds from Asclepias syriaca. J. Nat. Prod. 2012, 75, 400–407. [Google Scholar] [CrossRef] [PubMed]
  15. Abe, F.; Yamauchi, T.; Honda, K.; Hayashi, N. Conduritol F glucosides and terpenoid glucosides from Cynanchum liukiuense and distribution of conduritol F glucosides in several Asclepiadaceous plants. Chem. Pharm. Bull. 2000, 48, 1090–1092. [Google Scholar] [CrossRef] [PubMed] [Green Version]
  16. Fernández-Brewer, A.; Juárez-Jaimes, V.; Cortés-Zárraga, L. Usos de las especies del género Asclepias L. (Apocynaceae, Asclepiadoideae), información del Herbario Nacional de México, MEXU. Polibotánica 2008, 155–171. [Google Scholar]
  17. Vázquez-Sánchez, M.; Medina-Medrano, J.R.; Cortez-Madrigal, H.; Angoa-Pérez, M.V.; Muñoz-Ruíz, C.V.; Villar-Luna, E. Nematicidal activity of wild plant extracts against second-stage juveniles of Nacobbus aberrans. Nematropica 2018, 48, 136–144. [Google Scholar]
  18. Ignat, I.; Radu, D.G.; Volf, I.; Pag, A.I.; Popa, V.I. Antioxidant and antibacterial activities of some natural polyphenols. Cellul. Chem. Technol. 2013, 47, 387–399. [Google Scholar]
  19. Sikorska, M.; Matławska, I.; Głowniak, K.; Zgórka, G. Qualitative and quantitative analysis of phenolic acids in Asclepias syriaca L. Acta. Pol. Pharm.—Drug Res. 2000, 57, 69–72. [Google Scholar]
  20. Zavaleta, J.; Muñoz, A.M.; Blanco, T.; Alvarado-Ortiz, C.; Loja, B. Capacidad antioxidante y principales ácidos fenólicos y flavonoides de algunos alimentos TT - Antioxidant capacity and main phenolic acids and flavonoids of some foods. Horiz. méd. 2005, 5, 29–38. [Google Scholar]
  21. Yang, J.; Guo, J.; Yuan, J. In vitro antioxidant properties of rutin. LWT - Food Sci. Technol. 2008, 41, 1060–1066. [Google Scholar] [CrossRef]
  22. Vidal, N.A.; Motidome, M.; Mancini, F.J.; Tanae, M.M.; Fallarero, L.A.; Brandão, T.L.; Lapa, A.J. Actividad antioxidante y ácidos fenólicos del alga marina Bryothamnion. Brazilian J. Pharm. Sci. 2001, 37, 373–382. [Google Scholar]
  23. Ren, W.; Qiao, Z.; Wang, H.; Zhu, L.; Zhang, L. Flavonoids: Promising anticancer agents. Med. Res. Rev. 2003, 23, 519–534. [Google Scholar] [CrossRef] [PubMed]
  24. Lin, J.P.; Yang, J.S.; Lin, J.J.; Lai, K.C.; Lu, H.F.; Ma, C.Y.; Sai-Chuen Wu, R.; Wu, K.C.; Chueh, F.S.; Gibson Wood, W.; et al. Rutin inhibits human leukemia tumor growth in a murine xenograft model in vivo. Environ. Toxicol. 2012, 27, 480–484. [Google Scholar] [CrossRef]
  25. Carocho, M.; Ferreira, I. The Role of Phenolic Compounds in the Fight against Cancer—A Review. Anticancer. Agents Med. Chem. 2013, 13, 1236–1258. [Google Scholar] [CrossRef]
  26. Conesa, C.M.; Ortega, V.V.; Yáñez-Gascón, M.J.; Baños, M.A.; Jordana, M.C.; Benavente-García, O.; Castillo, J. Treatment of metastatic melanoma B16F10 by the flavonoids tangeretin, rutin, and diosmin. J. Agric. Food Chem. 2005, 53, 6791–6797. [Google Scholar] [CrossRef]
  27. Araújo, K.C.F.; Eula, E.M.; Pazini, F.; Valadares, M.C.; De Oliveira, V. Bioconversion of quercetin and rutin and the cytotoxicity activities of the transformed products. Food Chem. Toxicol. 2013, 51, 93–96. [Google Scholar] [CrossRef]
  28. Tomás-Barberán, F.A. Los polifenoles de los alimentos y la salud. ANS. Aliment. Nutr. y salud 2003, 10, 41–53. [Google Scholar]
  29. Laughton, M.J.; Halliwell, B.; Evans, P.J.; Robin, J.; Hoult, S. Antioxidant and pro-oxidant actions of the plant phenolics quercetin, gossypol and myricetin. Effects on lipid peroxidation, hydroxyl radical generation and bleomycin-dependent damage to DNA. Biochem. Pharmacol. 1989, 38, 2859–2865. [Google Scholar] [CrossRef]
  30. Cao, G.; Sofic, E.; Prior, R.L. Antioxidant and prooxidant behavior of flavonoids: Structure-activity relationships. Free Radic. Biol. Med. 1997, 22, 749–760. [Google Scholar] [CrossRef]
  31. Miura, Y.H.; Tomita, I.; Watanabe, T.; Hirayama, T.; Fukui, S. Active oxygens generation by flavonoids. Biol. Pharm. Bull. 1998, 21, 93–96. [Google Scholar] [CrossRef] [PubMed] [Green Version]
  32. Kessler, M.; Ubeaud, G.; Jung, L. Anti- and pro-oxidant activity of rutin and quercetin derivatives. J. Pharm. Pharmacol. 2003, 55, 131–142. [Google Scholar] [CrossRef] [PubMed]
  33. Martínez-Flórez, S.; González-Gallego, J.; Culebras, J.M.; Tuñón, M.J. Los flavonoides: Propiedades y acciones antioxidantes. Nutr. Hosp. 2002, 17, 271–278. [Google Scholar] [PubMed]
  34. Escamilla, C.I.; Cuevas, E.Y.; Fonseca, J.G. Flavonoides y sus acciones antioxidantes. Rev. la Fac. Med. 2009, 52, 73–75. [Google Scholar]
  35. Nurmi, K.; Ossipov, V.; Haukioja, E.; Pihlaja, K. Variation of total phenolic content and individual low-molecular-weight phenolics in foliage of mountain birch trees (Betula pubescens ssp. tortuosa). J. Chem. Ecol. 1996, 22, 2023–2040. [Google Scholar] [CrossRef] [PubMed]
  36. Lamaison, J.L.; Carnart, A. Teneurs en principaux flavonoides des fleurs et des feuilles de Crataegus monogyna Jacq. et de Crataegus laevigata (poiret) dc. en fonction de la periode de vegetation. Plantes Med. Phyther. 1991, 25, 12–16. [Google Scholar]
  37. Seabra, I.J.; Dias, A.M.A.; Braga, M.E.M.; De Sousa, H.C. High pressure solvent extraction of maritime pine bark: Study of fractionation, solvent flow rate and solvent composition. J. Supercrit. Fluids 2012, 62, 135–148. [Google Scholar] [CrossRef]
  38. Barriada-Bernal, L.G.; Almaraz-Abarca, N.; Delgado-Alvarado, E.A.; Gallardo-Velázquez, T.; Ávila-Reyes, J.A.; Torres-Morán, M.I.; González-Elizondo, M.D.S.; Herrera-Arrieta, Y. Flavonoid composition and antioxidant capacity of the edible flowers of Agave durangensis (Agavaceae). CYTA - J. Food 2014, 12, 105–114. [Google Scholar] [CrossRef] [Green Version]
  39. Lee, K.J.; Oh, Y.C.; Cho, W.K.; Ma, J.Y. Antioxidant and anti-inflammatory activity determination of one hundred kinds of pure chemical compounds using offline and online screening HPLC assay. Evidence-based Complement. Altern. Med. 2015, 1, 1–13. [Google Scholar] [CrossRef] [Green Version]
  40. Prieto, P.; Pineda, M.; Aguilar, M. Spectrophotometric quantitation of antioxidant capacity through the formation of a phosphomolybdenum complex: Specific application to the determination of vitamin E. Anal. Biochem. 1999, 269, 337–341. [Google Scholar] [CrossRef]
  41. Alvarado-Moreno, J.A.; Hernandez-Lopez, R.; Chavez-Gonzalez, A.; Yoder, M.C.; Rangel-Corona, R.; Isordia-Salas, I.; Hernandez-Juarez, J.; Cerbulo-Vazquez, A.; Gonzalez-Jimenez, M.A.; Majluf-Cruz, A. Endothelial colony-forming cells: Biological and functional abnormalities in patients with recurrent, unprovoked venous thromboembolic disease. Thromb. Res. 2016, 137, 157–168. [Google Scholar] [CrossRef] [PubMed]
  42. Moreno-Lorenzana, D.; Avilés-Vazquez, S.; Sandoval-Esquivel, M.A.; Alvarado-Moreno, A.; Ortiz-Navarrete, V.; Torres-Martínez, H.; Ayala-Sánchez, M.; Mayani, H.; Chavez-Gonzalez, A. CDKIs p18 INK4c and p57 Kip2 are involved in quiescence of CML leukemic stem cells after treatment with TKI. Cell Cycle 2016, 15, 1276–1287. [Google Scholar] [CrossRef] [PubMed]
Sample Availability:Asclepias linaria Cav. and phenolic standards are available from the authors.
Figure 1. Average percentage of total flavonoid content (TFC) and condensed tannins content (CTC) from the total phenolic content (TPC) of methanolic extracts from Asclepias linaria leaves. Values are expressed as the mean ± standard deviation of three repetitions. Values with different letters indicate significant differences (Tukey, p < 0.05).
Molecules 25 00054 g001
Figure 2. Intracellular ROS production values generated by the exposure of HL60 cells to 50% and 100% methanolic extracts of A. linaria after 1 h. Values are expressed as the mean ± standard deviation of three repetitions. (*) Indicates significant statistical difference from the control according to Dunnett’s test (p < 0.05), (**) p < 0.01.
Molecules 25 00054 g002
Figure 3. Intracellular ROS production values generated by the exposure of HL60 cells to 50% and 100% methanolic extracts of A. linaria after 3 h. Values are expressed as the mean ± standard deviation of three repetitions. (*) Indicates significant statistical difference from the control according to Dunnett’s test (p < 0.05).
Molecules 25 00054 g003
Table 1. Total phenolic, flavonoids, and tannins contents, free radical scavenging activity, and total antioxidant capacity of methanolic extracts from leaves of wild populations of Asclepias linaria.
ExtractTPC
(mg GAE/g DT)
TFC
(mg CE/g DT)
CTC
(mg CE/g DT)
ABTS•+DPPHTAC
(mg AAE/g DT)
IC50 (mg/mL)
P1-M1007.17 ± 0.46 g3.19 ± 0.05 d,e,f1.67 ± 0.06 d0.82 ± 0.016 h0.16 ± 0.001 d63.78 ± 2.22 c
P1-M509.32 ± 0.27 b,c,d,e2.68 ± 0.11 e,f0.65 ± 0.02 h0.53 ± 0.009 a0.12 ± 0.001 a17.96 ± 1.47 g
P2-M1008.77 ± 0.09 d,e4.02 ± 0.31 a,b2.30 ± 0.03 b0.74 ± 0.008 g0.16 ± 0.001 c,d74.47 ± 6.08 b
P2-M509.76 ± 0.37 a,b,c3.21 ± 0.28 d,e,f0.85 ± 0.03 f,g,h0.67 ± 0.002 f0.15 ± 0.001 b,c60.56 ± 0.78 c,d
P3-M1008.68 ± 0.20 d,e3.92 ± 0.26 a,b,c1.63 ± 0.14 d0.85 ± 0.012 i0.16 ± 0.001 c,d75.89 ± 3.85 b
P3-M5010.49 ± 0.47 a2.62 ± 0.21 e,f0.81 ± 0.02 f,g,h0.51 ± 0.003 a0.18 ± 0.002 e,f49.29 ± 1.55 e
P4-M1008.38 ± 0.26 e,f2.87 ± 0.22 d,e,f3.16 ± 0.16 a0.68 ± 0.009 f0.19 ± 0.001 f78.74 ± 0.62 b
P4-M5010.50 ± 0.27 a2.56 ± 0.26 f0.68 ± 0.03 g,h0.59 ± 0.003 b,c0.15 ± 0.001 b,c60.82 ± 0.82 c,d
P5-M1009.07 ± 0.51 c,d,e4.17 ± 0.31 a2.05 ± 0.06 c0.60 ± 0.008 c,d0.15 ± 0.001 b,c81.24 ± 3.86 b
P5-M5010.10 ± 0.15 a,b3.28 ± 0.04 c,d,e1.00 ± 0.08 f0.58 ± 0.007 b,c0.16 ± 0.001 c,d36.08 ± 0.39 f
P6-M1007.48 ± 0.33 f,g3.38 ± 0.31 b,c,d1.22 ± 0.06 e0.75 ± 0.001 g0.18 ± 0.002 e99.77 ± 4.32 a
P6-M509.58 ± 0.22 a,b,c,d2.94 ± 0.10 d,e,f0.88 ± 0.05 f,g0.64 ± 0.008 e0.14 ± 0.001 b29.61 ± 1.25 f
P7-M1008.66 ± 0.53 d,e3.24 ± 0.17 c,d,e1.46 ± 0.06 d0.62 ± 0.004 d,e0.15 ± 0.001 b,c95.49 ± 4.32 a
P7-M5010.44 ± 0.09 a3.09 ± 0.25 d,e,f0.43 ± 0.03 i0.57 ± 0.002 b0.15 ± 0.001 b,c54.99 ± 0.60 d,e
Abbreviations: TPC, total phenolic content; TFC, Total flavonoid content; CTC, condensed tannin content; M100, extracted with 100% methanol; M50, extracted with 50% methanol; GAE, gallic acid equivalents; CE, catechin equivalents; AAE, ascorbic acid equivalents; DT, dry tissue; DPPH, 2,2-diphenyl-1-picrylhydrazyl; ABTS, 2,2-azino-bis[3-ethylbenzothiazoline-6-sulphonic acid]; IC50, median inhibitory concentration. Values are expressed as mean ± standard deviation of three repetitions. Values with different letters indicate significant differences (Tukey, p < 0.05).
Table 2. Phenolic composition of 50 and 100% methanol extracts of Asclepias linaria leaves identified by ultra-performance liquid chromatography coupled to mass spectrometry (UPLC-MS).
Extract p-coumaric acidFerulic acidRutinQuercetinTotal
P1-M100tR (min)ND6.29 ± 0.017.15 ± 0.018.90 ± 0.00
µg/mLND0.49 ± 0.02 g37.53 ± 1.10 e11.33 ± 0.23 c,d49.35 ± 0.62 f,g
P1-M50tR (min)ND6.27 ± 0.017.15 ± 0.008.87 ± 0.06
µg/mLND0.40 ± 0.00 g,h30.00 ± 0.40 f13.47 ± 0.61 a,b,c43.87 ± 0.21 g
P2-M100tR (min)ND6.29 ± 0.017.15 ± 0.018.91 ± 0.01
µg/mLND0.82 ± 0.06 e49.33 ± 0.57 d6.00 ± 0.00 h56.15 ± 0.13 d,e
P2-M50tR (min)ND6.29 ± 0.017.15 ± 0.008.91 ± 0.01
µg/mLND0.72 ± 0.06 e,f41.33 ± 1.52 e10.00 ± 1.00 d,e,f52.05 ± 0.42 e,f
P3-M100tR (min)ND6.28 ± 0.017.15 ± 0.008.90 ± 0.00
µg/mLND0.96 ± 0.00 d28.00 ± 0.00 f5.17 ± 0.58 h34.13 ± 1.34 h
P3-M50tR (min)ND6.28 ± 0.017.15 ± 0.018.91 ± 0.00
µg/mLND0.34 ± 0.02 h25.67 ± 0.70 f8.40 ± 0.69 f,g34.41 ± 0.50 h
P4-M100tR (min)5.9 ± 0.016.27 ± 0.017.14 ± 0.008.90 ± 0.01
µg/mL1.0 ± 0.00 a0.75 ± 0.00 e,f51.50 ± 0.00 d6.72 ± 0.96 g,h59.97 ± 2.83 d
P4-M50tR (min)ND6.28 ± 0.027.15 ± 0.018.91 ± 0.01
µg/mLND0.49 ± 0.00 g37.67 ± 0.76 e13.00 ± 0.50 b,c51.16 ± 0.32 e,f
P5-M100tR (min)5.89 ± 0.006.29 ± 0.037.15 ± 0.008.91 ± 0.01
µg/mL0.25 ± 0.01 b0.68 ± 0.10 f61.33 ± 4.50 c9.00 ± 1.00 e,f71.26 ± 1.34 c
P5-M50tR (min)NDND7.15 ± 0.008.90 ± 0.00
µg/mLNDND16.53 ± 1.00 g15.00 ± 0.60 a,b31.53 ± 0.76 h
P6-M100tR (min)ND6.28 ± 0.017.15 ± 0.018.90 ± 0.01
µg/mLND1.13 ± 0.01 c72.33 ± 1.52 b6.33 ± 0.5879.79 ± 0.82 b
P6-M50tR (min)NDND7.16 ± 0.01ND
µg/mLNDND0.73 ± 0.05 hND0.73 ± 0.45 i
P7-M100tR (min)ND6.31 ± 0.027.16 ± 0.018.99 ± 0.00
µg/mLND1.90 ± 0.12 a79.67 ± 2.51 a10.67 ± 0.58 d,e92.24 ± 1.37 a
P7-M50tR (min)ND6.28 ± 0.017.16 ± 0.018.91 ± 0.00
µg/mLND1.58 ± 0.04 b76.67 ± 3.51 a,b15.67 ± 1.53 a93.92 ± 0.30 a
Abbreviations: M100, extracted with 100% methanol; M50, extracted with 50% methanol; tR, retention time; ND, not determined. Values are expressed as the mean ± standard deviation of three repetitions. Values with different letters indicate significant differences (Tukey, p < 0.05)
Table 3. Anti-proliferative activity of 50 and 100% methanol extracts of Asclepias linaria leaves against hematologic neoplasia cells lines (K562 and HL60) and normal mononuclear cells (NMC).
ExtractK562
IC50 (µg/mL)
HL60
IC50 (µg/mL)
CMN
IC50 (µg/mL)
SI
K562
SI
HL60
P1-M10072.13 ± 7.59 b17.33 ± 0.43 d116.7 ± 13.57 c,d,e,f1.616.73
P1-M5028.22 ± 4.09 a16.79 ± 0.86 c,d18.7 ± 0.48 a,b0.661.11
P2-M10079.57 ± 10.98 b14.25 ± 0.85 b,c155 ± 1.94 d,e,f1.9410.88
P2-M5012.05 ± 1.60 a11.31 ± 0.15 a33.6 ± 5.07 a,b,c2.772.97
P3-M10029.40 ± 2.03 a14.28 ± 0.94 b,c66.8 ± 7.14 a,b,c,d2.274.68
P3-M50153.47 ± 28.77 c17.53 ± 1.41d187.3 ± 43.56 f1.2210.68
P4-M10018.78 ± 2.95 a15.54 ± 0.42 b,c,d100.4 ± 8.95 b,c,d,e,f5.346.46
P4-M50167.42 ± 24.03 c16.00 ± 0.89 b,c,d130.3 ± 10.74 d,e,f0.778.14
P5-M100>400 d15.50 ± 0.83 b,c,dNDNDND
P5-M5015.45 ± 0.56 a20.89 ± 1.59 e108.3 ± 15.49 c,d,e,f7.05.18
P6-M10010.07 ± 0.08 a17.45 ± 1.34 d96.8 ± 4.88 b,c,d,e9.585.55
P6-M508.96 ± 0.29 a13.52 ± 0.87 a,b184.2 ± 13.19 e,f20.4613.62
P7-M1009.52 ± 1.28 a11.27 ± 0.27 a155 ± 13.91 d,e,f16.3113.75
P7-M50133.55 ± 14.36 c11.10 ± 0.48 a244.9 ± 96.16 f1.8022.06
Abbreviations: M100, extracted with 100% methanol; M50, extracted with 50% methanol; SI, selectivity index; IC50, median inhibitory concentration; > 400, IC50 value greater than 400 µg/mL. ND, not determined. Values are expressed as mean ± standard deviation of three repetitions. Values with different letters indicate significant differences (Tukey, p < 0.05). Two independent trials were performed in duplicate.
Table 4. Mass spectrometric conditions for each compound.
CompoundtR
(min)
Ion ModeMRM
(m/z)
Cone
(V)
Collision
(eV)
Vanillin5.46+153.01 ˃ 125.03400
(+)-Catechin3.97+291.15 ˃ 123.10
291.15 ˃ 165.10
13
13
13
10
p-coumaric acid5.84-163.10 ˃ 119.002010
Gallic acid1.45-169.10 ˃ 125.001512
Caffeic acid4.61-179.10 ˃ 135.002010
Ferulic acid6.53-193.07 ˃ 133.90
193.07 ˃ 178.04
10
10
13
17
Quercetin8.86-301.02 ˃ 150.99
301.02 ˃ 178.98
20
20
10
10
Naringin9.11+273.20 ˃ 147.10
273.20 ˃ 153.05
35
35
20
20
Apigenin9.97-269.15 ˃ 117.00
269.15 ˃ 151.00
30
30
37
23
Rutin7.15-609.10 > 300.08028
Chlorogenic acid4.26-353.05 > 191.032015
Cinnamic acid9.01-146.80 > 103.001010

