Hepatotoxicity of a Cannabidiol-Rich Cannabis Extract in the Mouse Model

 ,
, 
Abstract
1. Introduction
2. Results
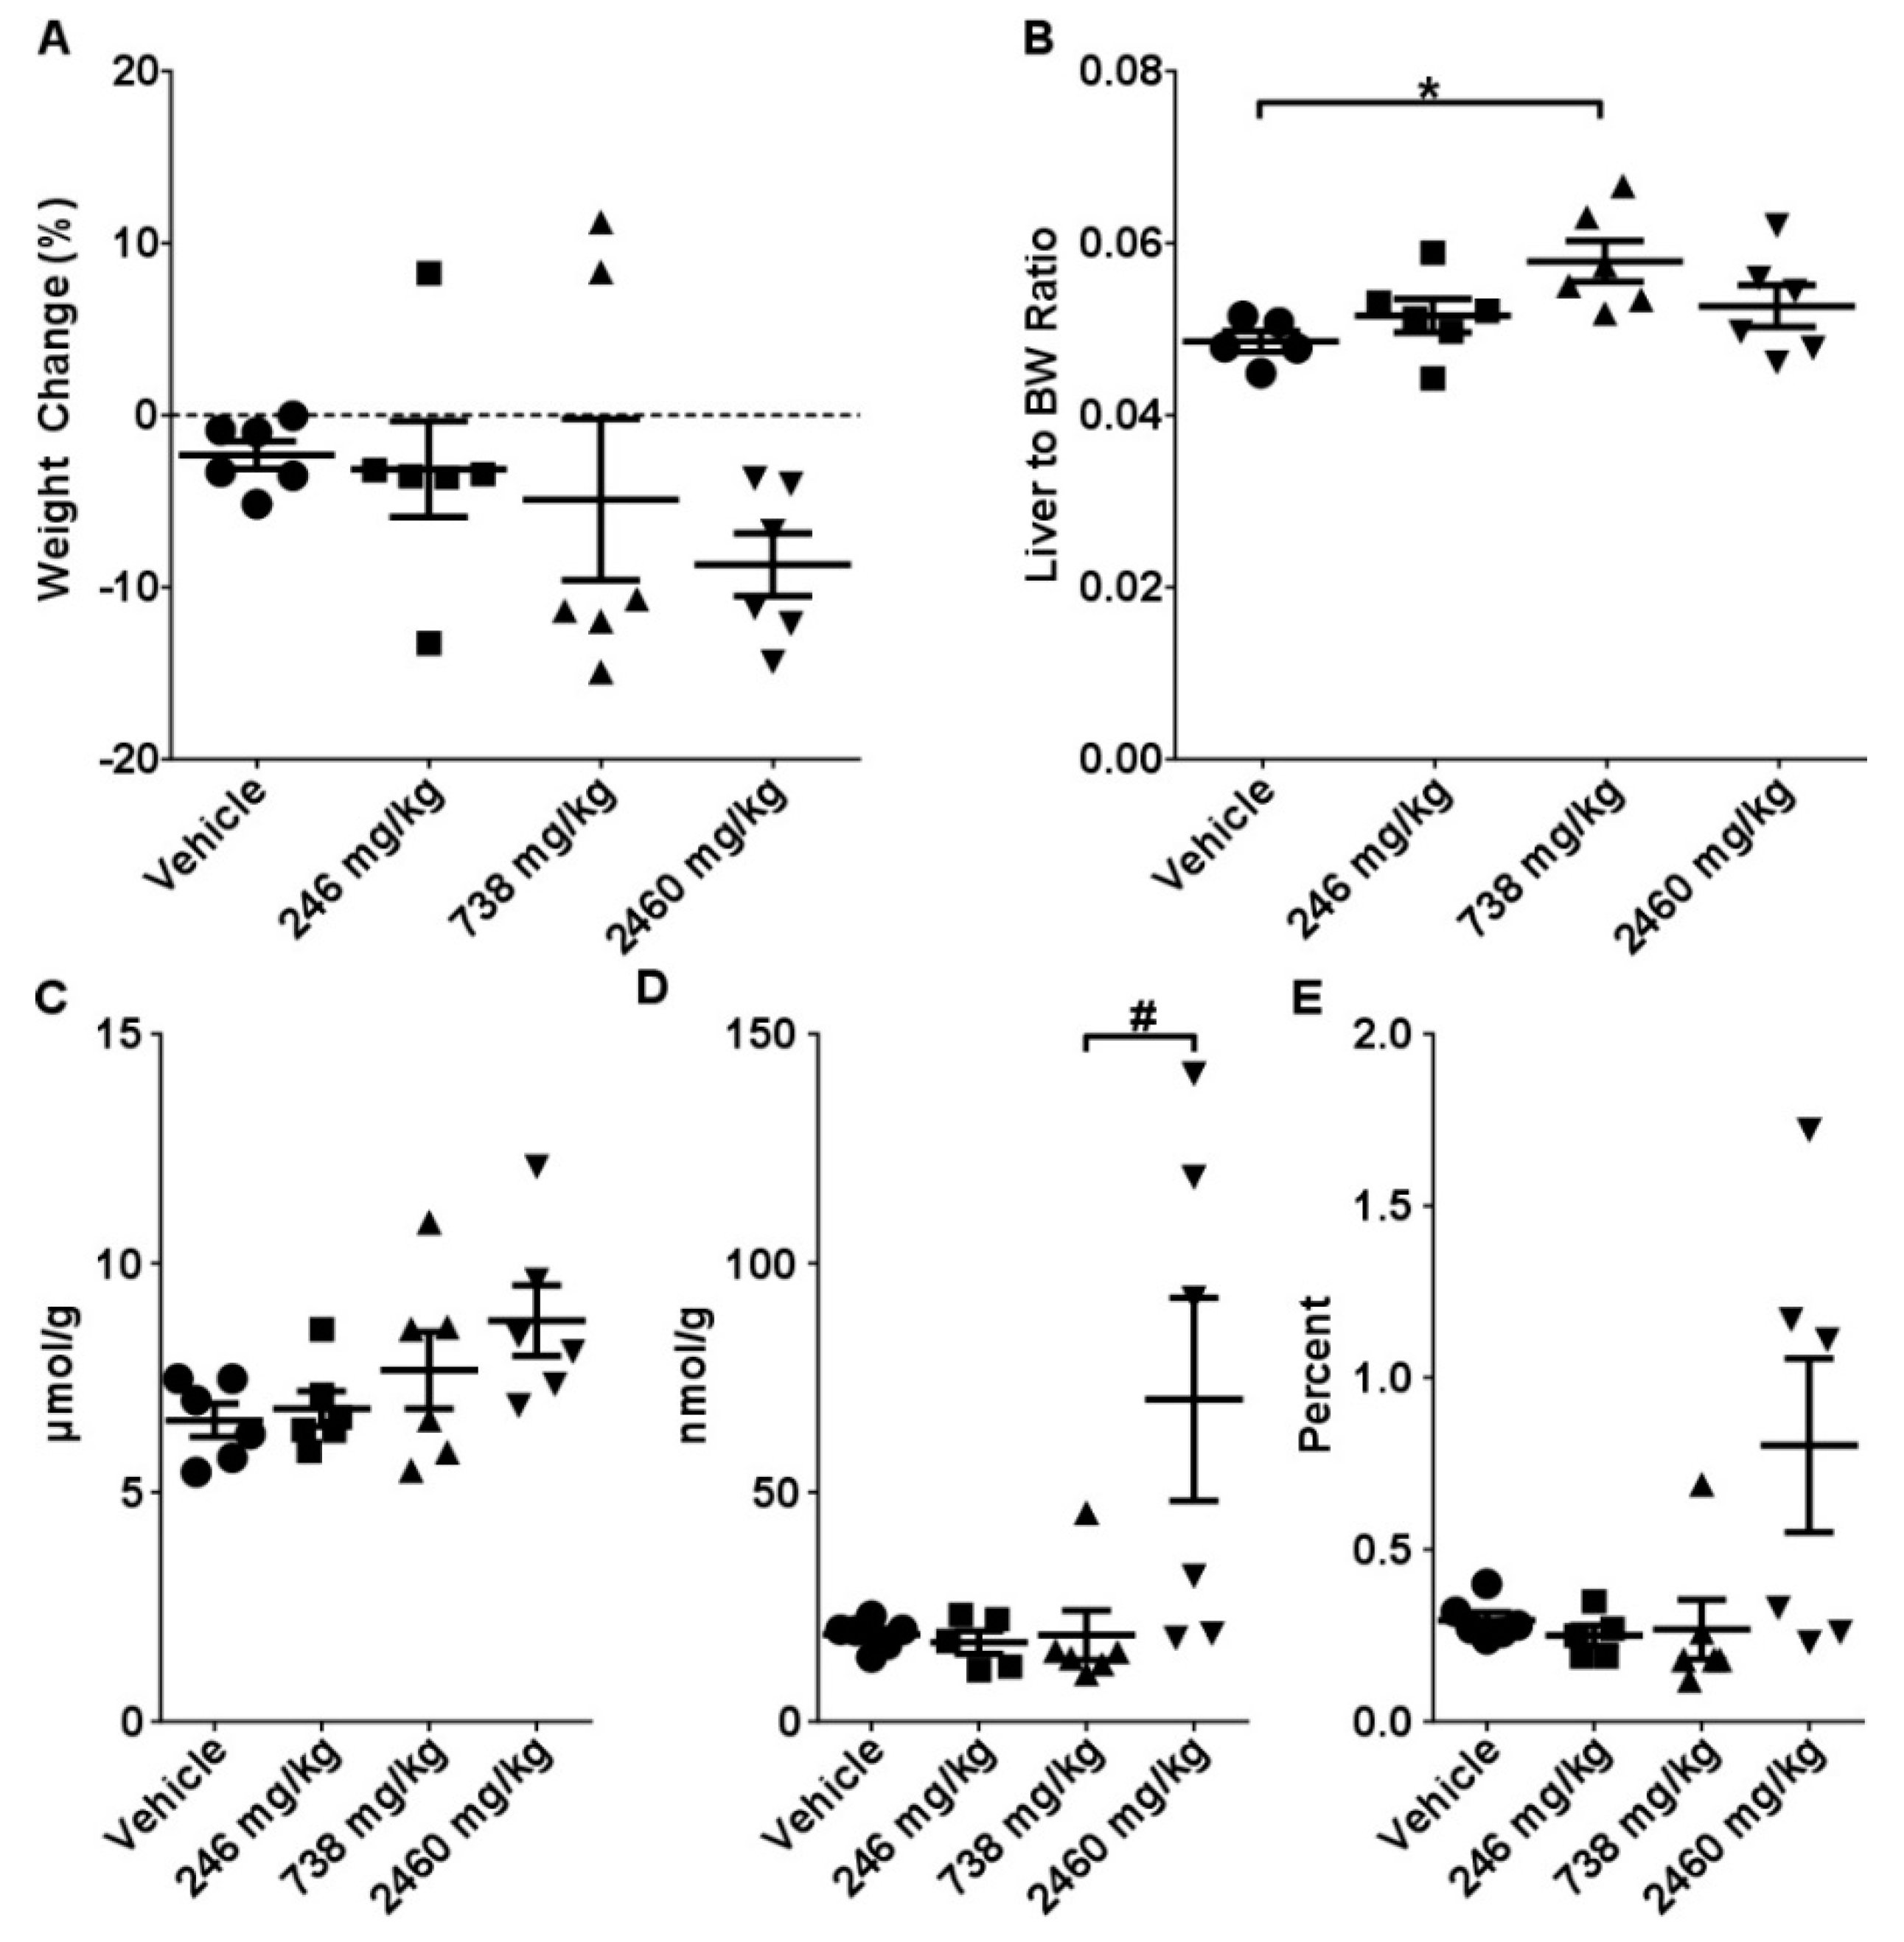
2.1. Acute Toxicity Study
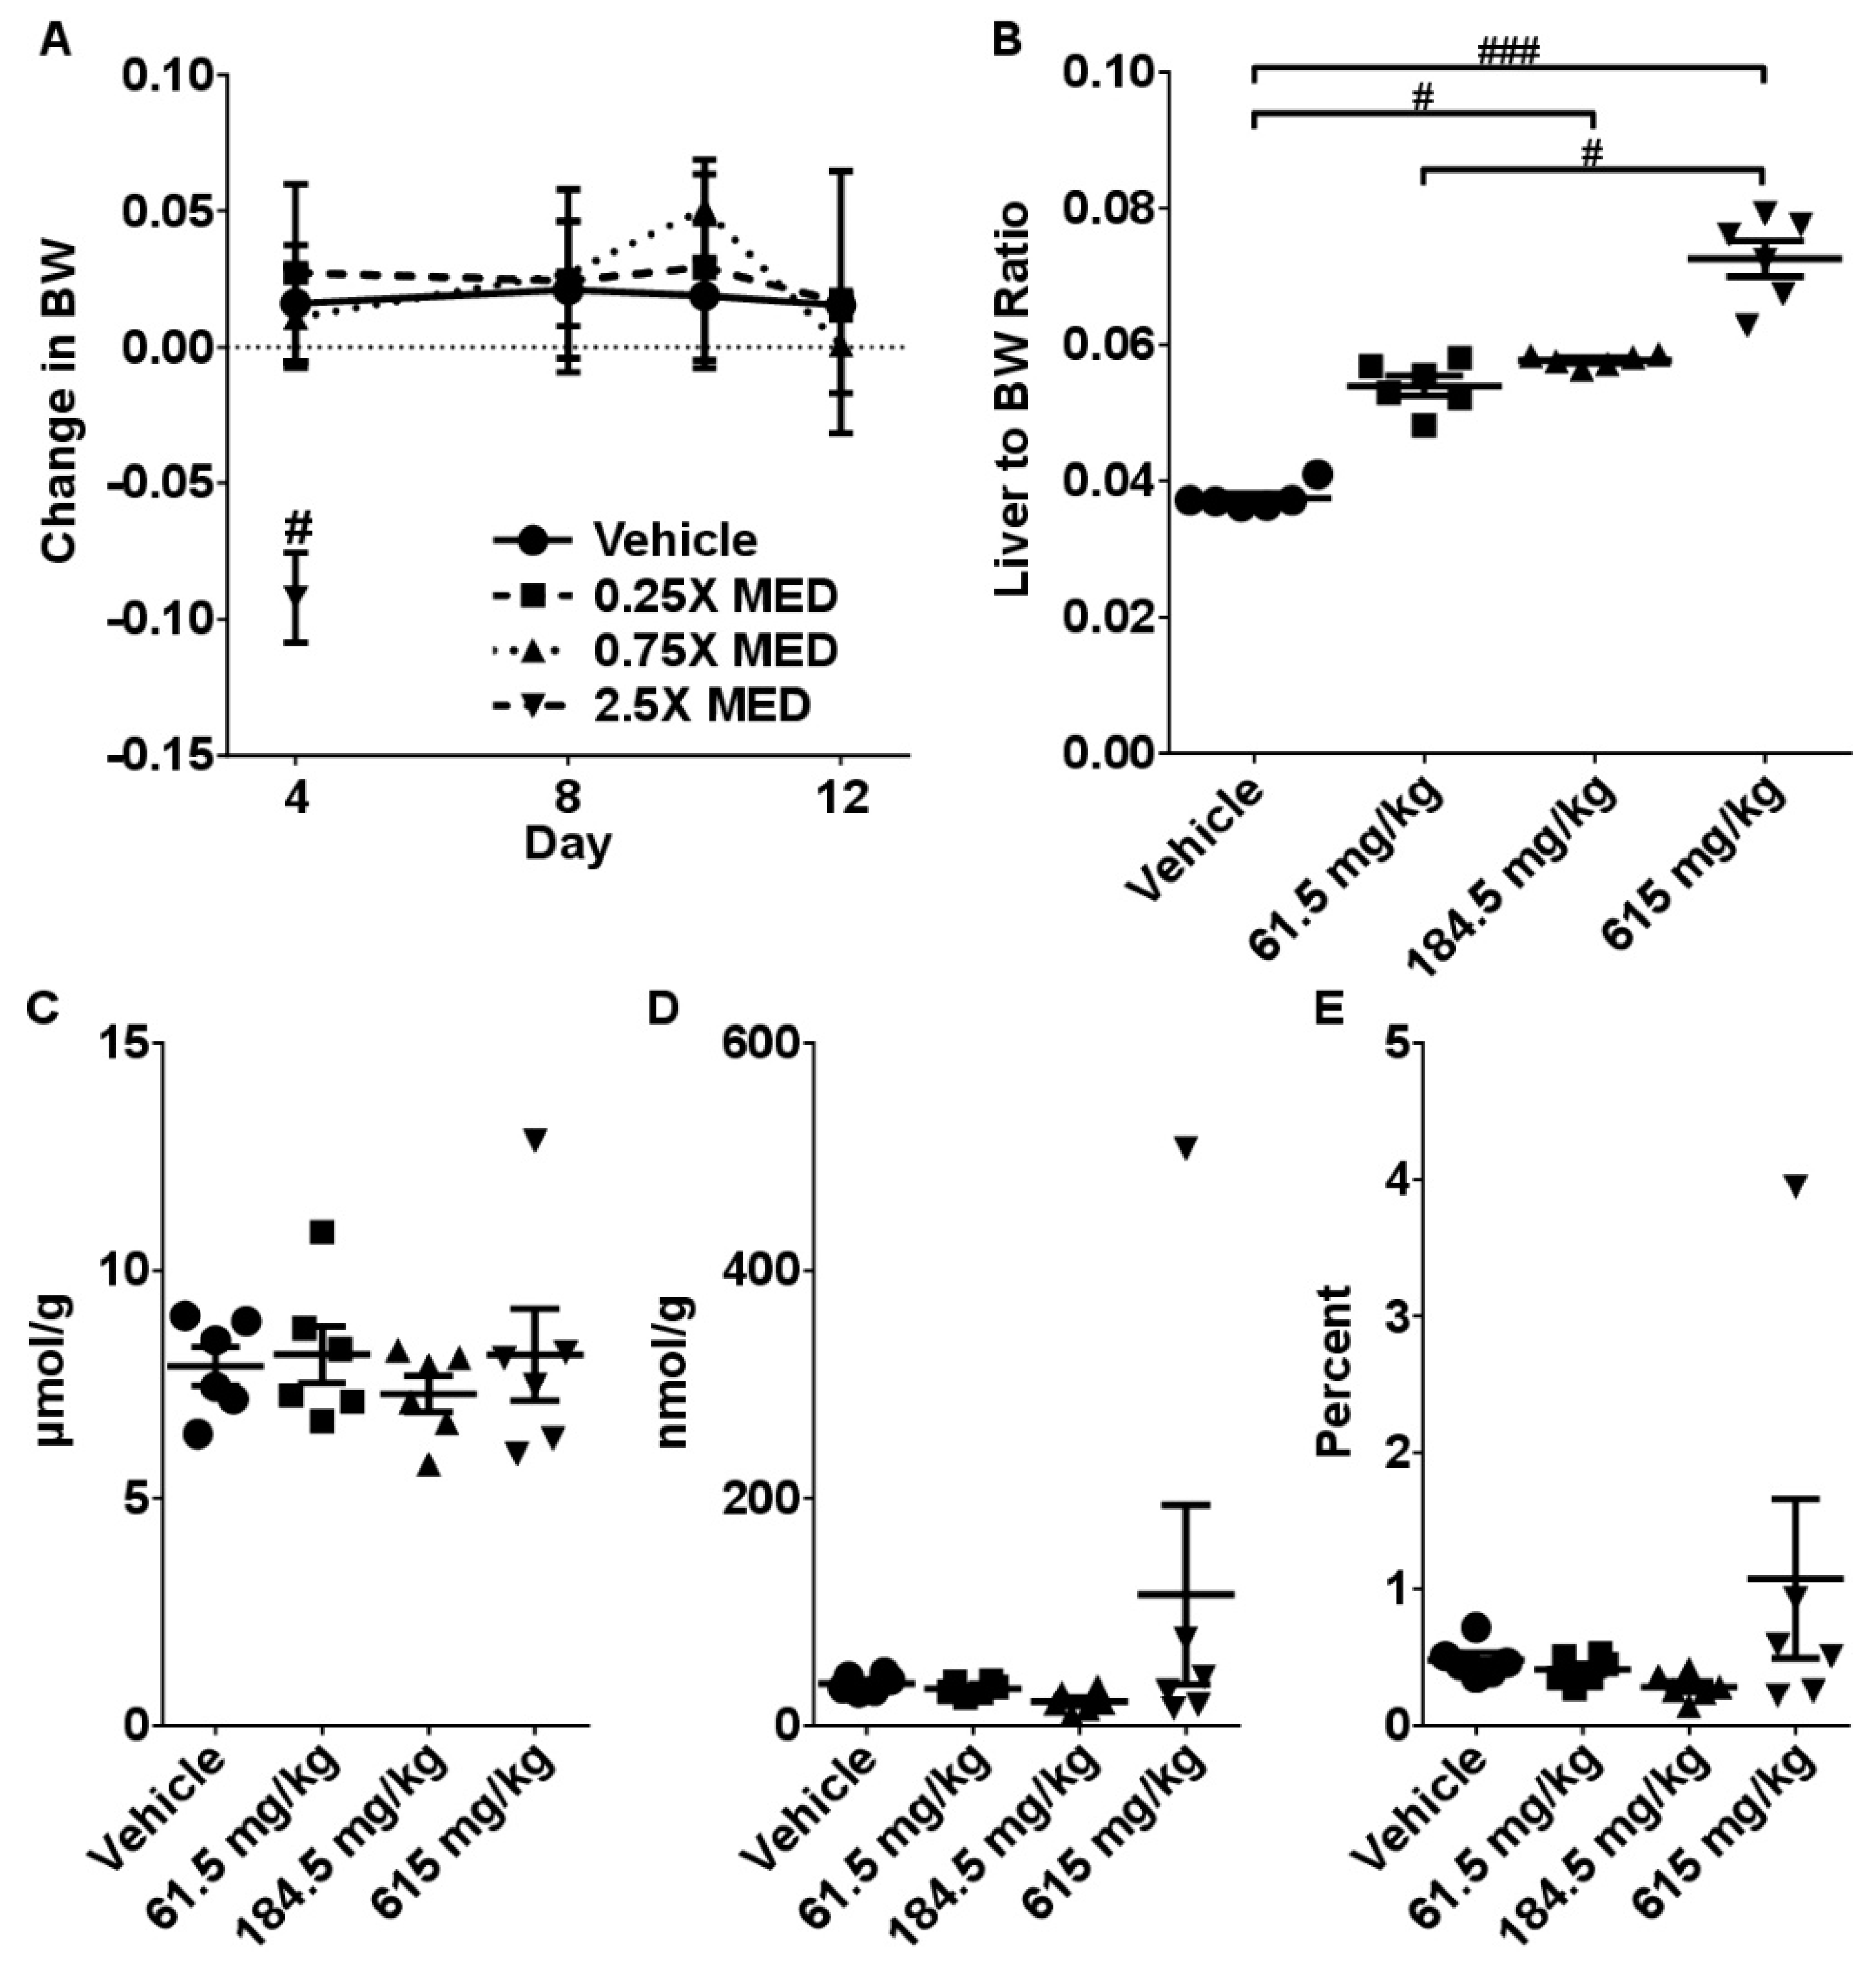
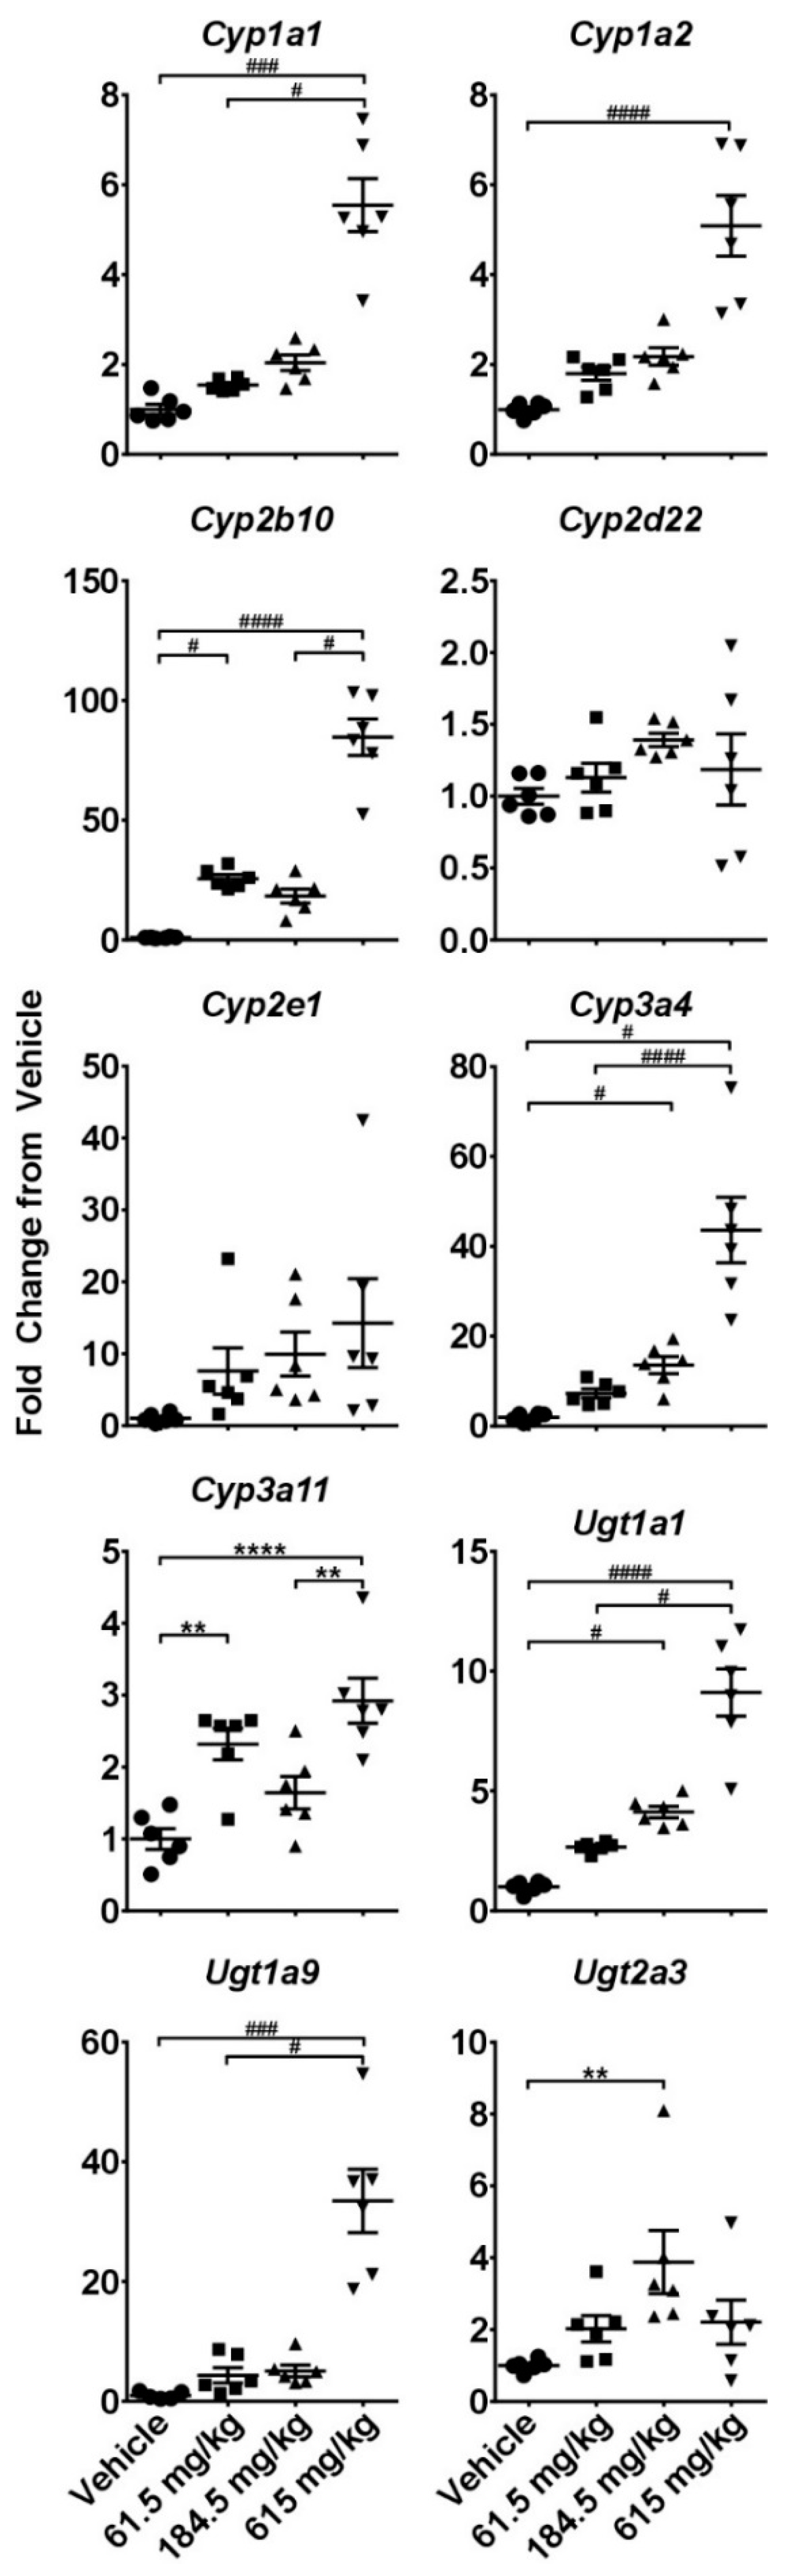
2.2. Sub-Acute Toxicity Study
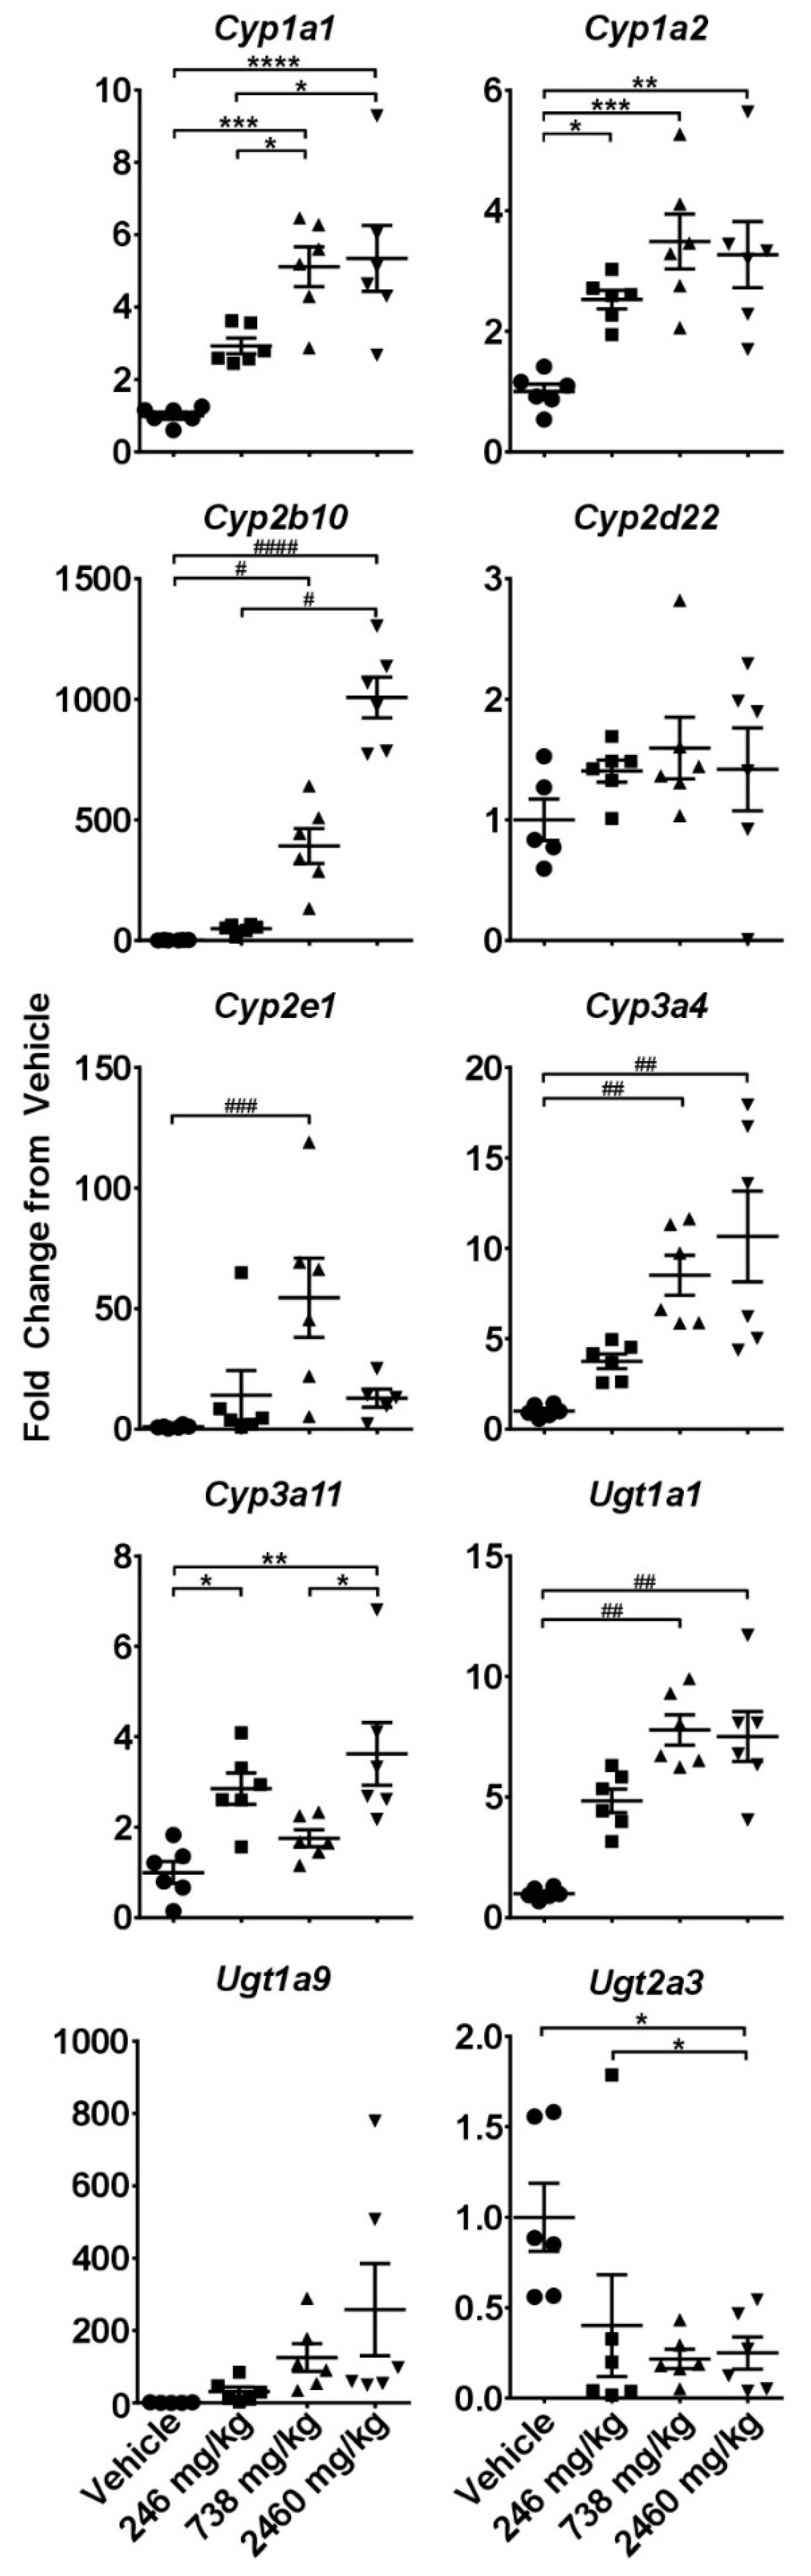
2.3. Hepatotoxicity Gene Expression Analysis
2.4. Dose-Response Analysis
3. Discussion
4. Materials and Methods
4.1. CBD Extract Characterization, Dosing Solution, and Dose Calculations
4.2. Animals
4.3. Blood Sampling and Clinical Biochemistry
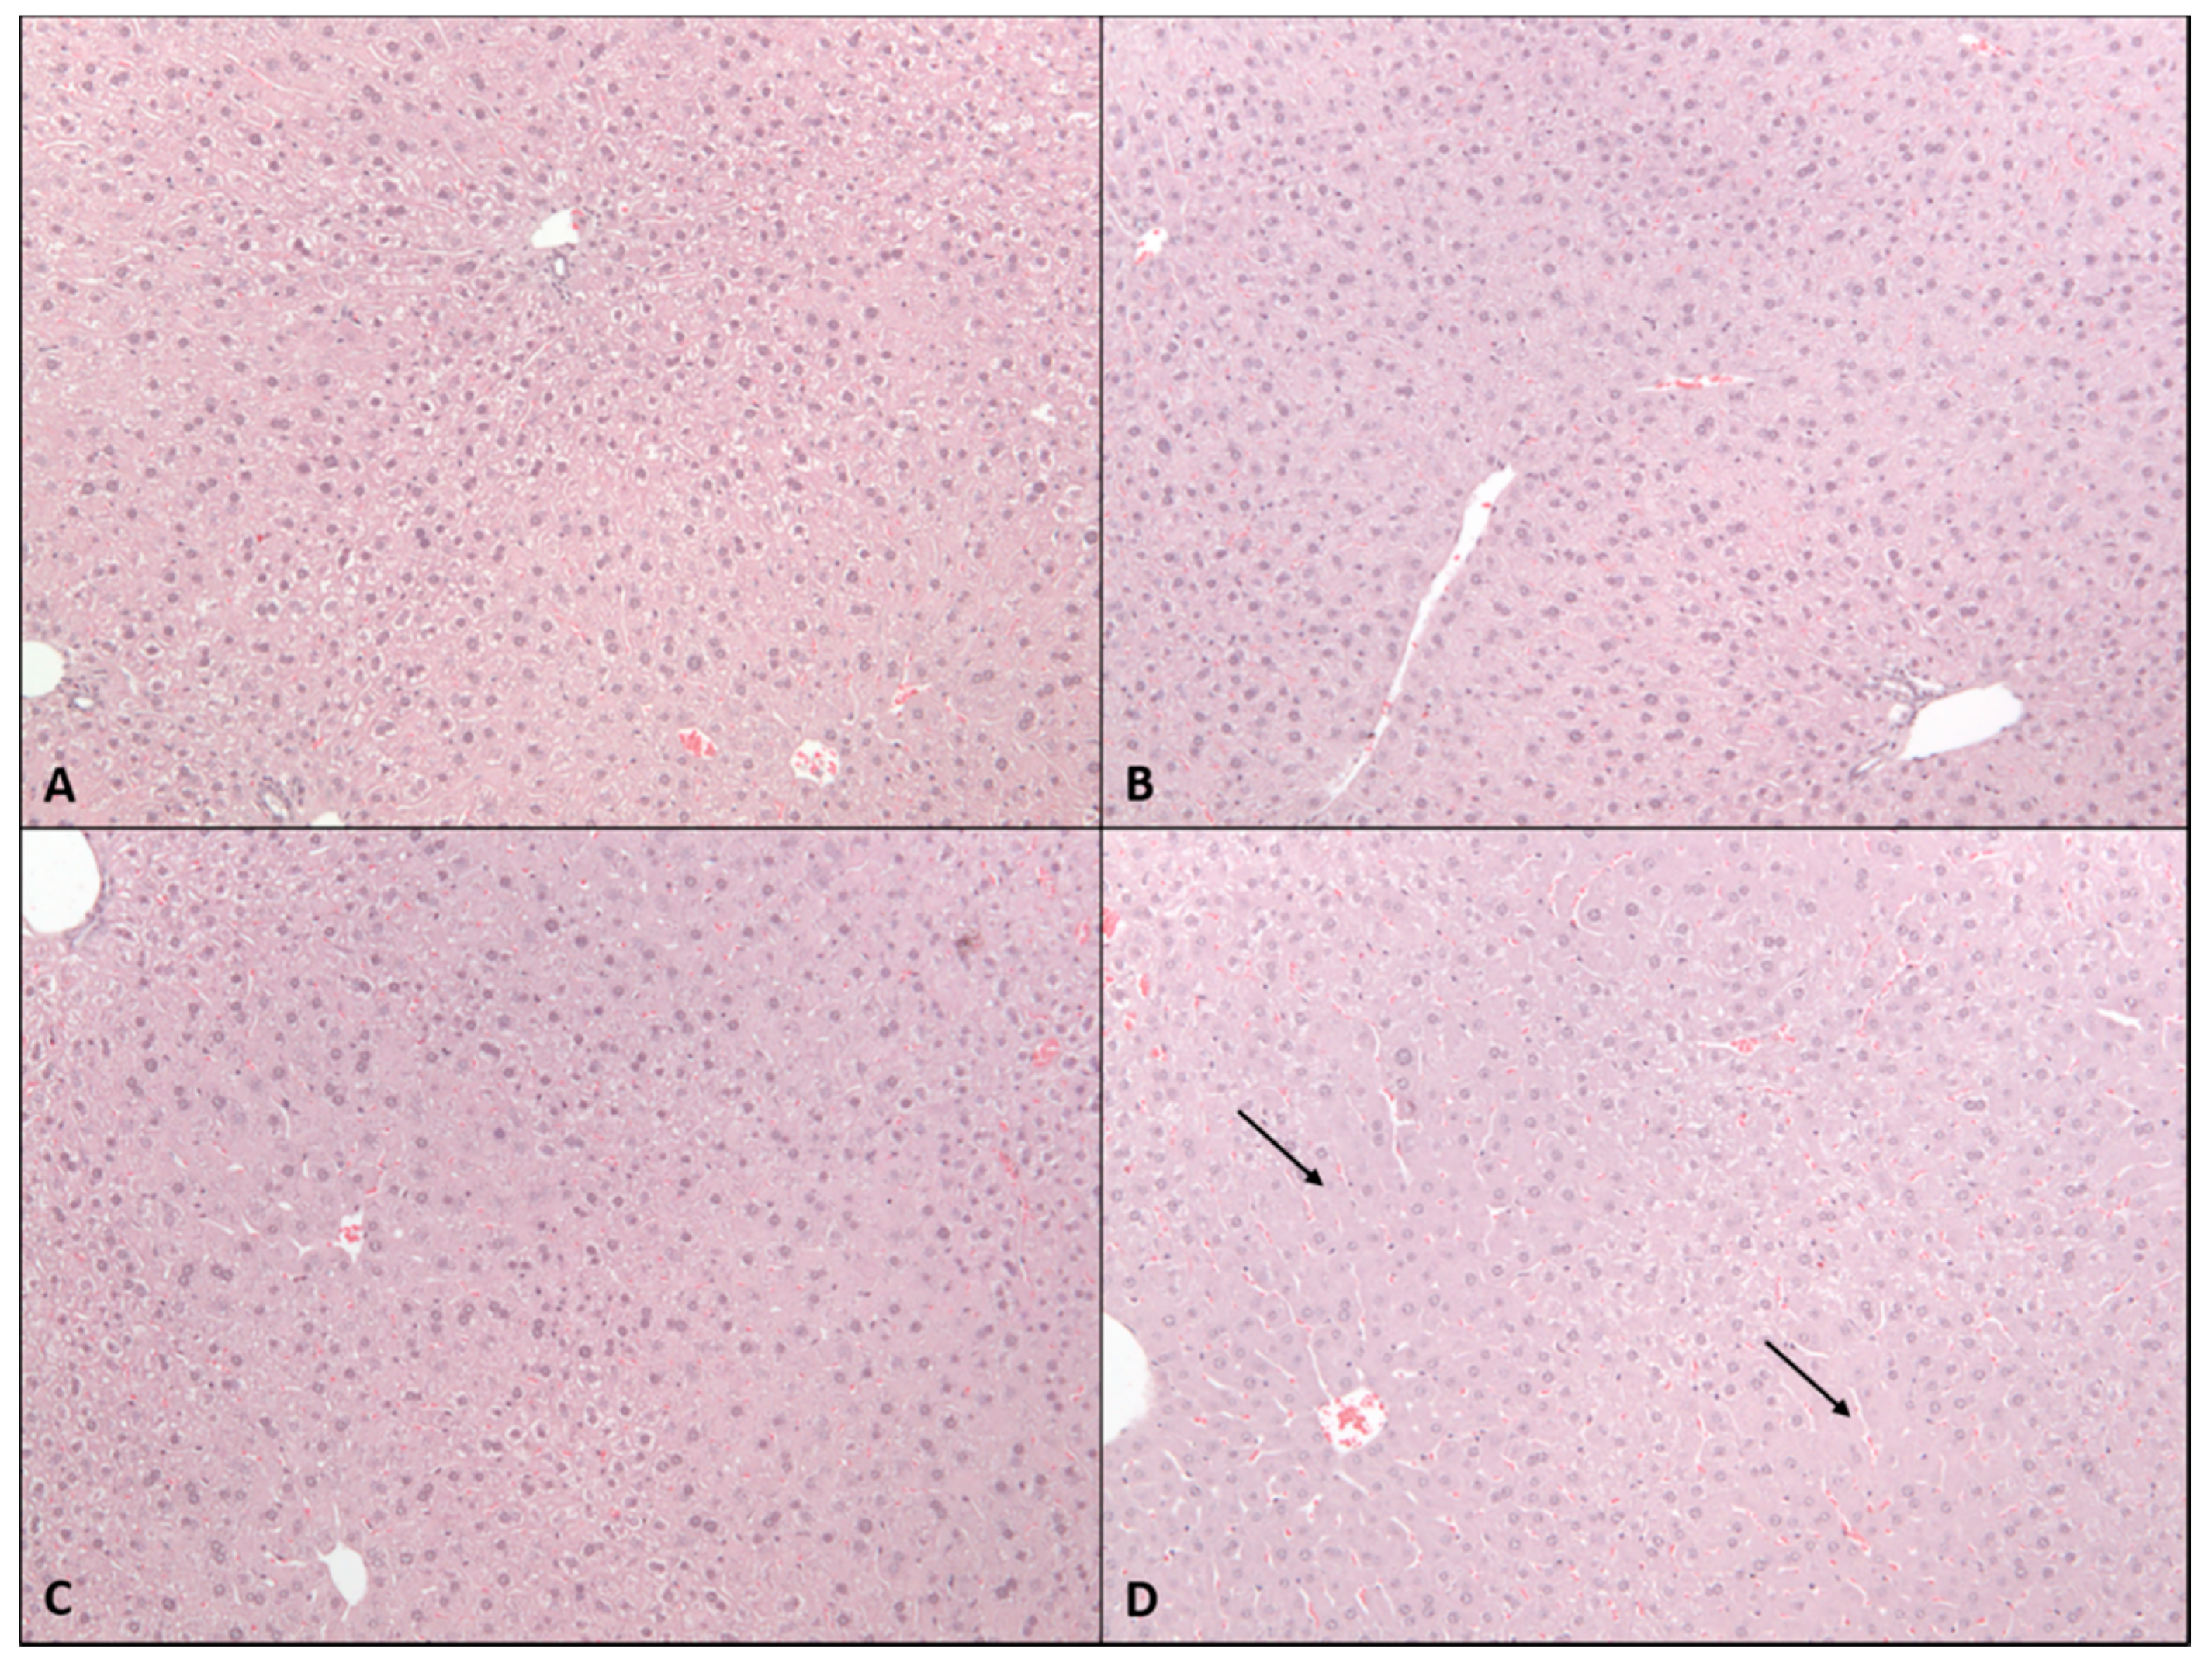
4.4. Histopathological Assessment
4.5. Glutathione Analysis
4.6. Analysis of mRNA Levels of Major Cytochromes and Transporter Genes
4.7. Hepatotoxicity Gene Expression Array
4.8. Statistical Analysis
Supplementary Materials
Author Contributions
Funding
Acknowledgments
Conflicts of Interest
References
- Devinsky, O.; Cross, J.H.; Wright, S. Trial of Cannabidiol for Drug-Resistant Seizures in the Dravet Syndrome. N. Eng. J. Med. 2017, 377, 699–700. [Google Scholar] [CrossRef]
- Thiele, E.A.; Marsh, E.D.; French, J.A.; Mazurkiewicz-Beldzinska, M.; Benbadis, S.R.; Joshi, C.; Lyons, P.D.; Taylor, A.; Roberts, C.; Sommerville, K.; et al. Cannabidiol in patients with seizures associated with Lennox-Gastaut syndrome (GWPCARE4): A randomised, double-blind, placebo-controlled phase 3 trial. Lancet 2018, 391, 1085–1096. [Google Scholar] [CrossRef]
- Crippa, J.A.; Guimaraes, F.S.; Campos, A.C.; Zuardi, A.W. Translational Investigation of the Therapeutic Potential of Cannabidiol (CBD): Toward a New Age. Front. Immunol. 2018, 9, 2009. [Google Scholar] [CrossRef] [PubMed]
- Olah, A.; Toth, B.I.; Borbiro, I.; Sugawara, K.; Szollosi, A.G.; Czifra, G.; Pal, B.; Ambrus, L.; Kloepper, J.; Camera, E.; et al. Cannabidiol exerts sebostatic and antiinflammatory effects on human sebocytes. J. Clin. Investig. 2014, 124, 3713–3724. [Google Scholar] [CrossRef] [PubMed]
- Hampson, A.J.; Grimaldi, M.; Axelrod, J.; Wink, D. Cannabidiol and (-)Delta9-tetrahydrocannabinol are neuroprotective antioxidants. Proc. Natl. Acad Sci. USA 1998, 95, 8268–8273. [Google Scholar] [CrossRef]
- Carvalho, R.K.; Santos, M.L.; Souza, M.R.; Rocha, T.L.; Guimaraes, F.S.; Anselmo-Franci, J.A.; Mazaro-Costa, R. Chronic exposure to cannabidiol induces reproductive toxicity in male Swiss mice. J. Appl. Toxicol. 2018, 38, 1215–1223. [Google Scholar] [CrossRef]
- Carvalho, R.K.; Souza, M.R.; Santos, M.L.; Guimaraes, F.S.; Pobbe, R.L.H.; Andersen, M.L.; Mazaro-Costa, R. Chronic cannabidiol exposure promotes functional impairment in sexual behavior and fertility of male mice. Reprod Toxicol. 2018, 81, 34–40. [Google Scholar] [CrossRef]
- Carty, D.R.; Thornton, C.; Gledhill, J.H.; Willett, K.L. Developmental Effects of Cannabidiol and Delta9-Tetrahydrocannabinol in Zebrafish. Toxicol. Sci. 2018, 162, 137–145. [Google Scholar] [CrossRef] [PubMed]
- Schonhofen, P.; de Medeiros, L.M.; Bristot, I.J.; Lopes, F.M.; De Bastiani, M.A.; Kapczinski, F.; Crippa, J.A.; Castro, M.A.; Parsons, R.B.; Klamt, F. Cannabidiol Exposure During Neuronal Differentiation Sensitizes Cells Against Redox-Active Neurotoxins. Mol. Neurobiol. 2015, 52, 26–37. [Google Scholar] [CrossRef]
- ElBatsh, M.M.; Assareh, N.; Marsden, C.A.; Kendall, D.A. Anxiogenic-like effects of chronic cannabidiol administration in rats. Psychopharmacology (Berl) 2012, 221, 239–247. [Google Scholar] [CrossRef]
- Mato, S.; Victoria Sanchez-Gomez, M.; Matute, C. Cannabidiol induces intracellular calcium elevation and cytotoxicity in oligodendrocytes. Glia 2010, 58, 1739–1747. [Google Scholar] [CrossRef]
- Usami, N.; Yamamoto, I.; Watanabe, K. Generation of reactive oxygen species during mouse hepatic microsomal metabolism of cannabidiol and cannabidiol hydroxy-quinone. Life Sci. 2008, 83, 717–724. [Google Scholar] [CrossRef]
- Jadoon, K.A.; Tan, G.D.; O’Sullivan, S.E. A single dose of cannabidiol reduces blood pressure in healthy volunteers in a randomized crossover study. JCI Insight 2017, 2. [Google Scholar] [CrossRef]
- Rosenkrantz, H.; Fleischman, R.W.; Grant, R.J. Toxicity of short-term administration of cannabinoids to rhesus monkeys. Toxicol. Appl. Pharmacol. 1981, 58, 118–131. [Google Scholar] [CrossRef]
- Devinsky, O.; Nabbout, R.; Miller, I.; Laux, L.; Zolnowska, M.; Wright, S.; Roberts, C. Long-term cannabidiol treatment in patients with Dravet syndrome: An open-label extension trial. Epilepsia 2018. [Google Scholar] [CrossRef]
- Russo, C.; Ferk, F.; Misik, M.; Ropek, N.; Nersesyan, A.; Mejri, D.; Holzmann, K.; Lavorgna, M.; Isidori, M.; Knasmuller, S. Low doses of widely consumed cannabinoids (cannabidiol and cannabidivarin) cause DNA damage and chromosomal aberrations in human-derived cells. Arch. Toxicol. 2018. [Google Scholar] [CrossRef] [PubMed]
- Yamaori, S.; Ebisawa, J.; Okushima, Y.; Yamamoto, I.; Watanabe, K. Potent inhibition of human cytochrome P450 3A isoforms by cannabidiol: Role of phenolic hydroxyl groups in the resorcinol moiety. Life Sci. 2011, 88, 730–736. [Google Scholar] [CrossRef]
- Jones, G.; Pertwee, R.G. A metabolic interaction in vivo between cannabidiol and 1 -tetrahydrocannabinol. Br. J. Pharmacol. 1972, 45, 375–377. [Google Scholar] [CrossRef]
- Bornheim, L.M.; Everhart, E.T.; Li, J.; Correia, M.A. Induction and genetic regulation of mouse hepatic cytochrome P450 by cannabidiol. Biochem. Pharmacol. 1994, 48, 161–171. [Google Scholar] [CrossRef]
- Narimatsu, S.; Watanabe, K.; Matsunaga, T.; Yamamoto, I.; Imaoka, S.; Funae, Y.; Yoshimura, H. Inhibition of hepatic microsomal cytochrome P450 by cannabidiol in adult male rats. Chem. Pharm. Bull. (Tokyo) 1990, 38, 1365–1368. [Google Scholar] [CrossRef] [PubMed]
- Bornheim, L.M.; Correia, M.A. Selective inactivation of mouse liver cytochrome P-450IIIA by cannabidiol. Mol. Pharmacol. 1990, 38, 319–326. [Google Scholar] [PubMed]
- Marx, T.K.; Reddeman, R.; Clewell, A.E.; Endres, J.R.; Beres, E.; Vertesi, A.; Glavits, R.; Hirka, G.; Szakonyine, I.P. An Assessment of the Genotoxicity and Subchronic Toxicity of a Supercritical Fluid Extract of the Aerial Parts of Hemp. J. Toxicol. 2018, 2018, 8143582. [Google Scholar] [CrossRef] [PubMed]
- Gamble, L.J.; Boesch, J.M.; Frye, C.W.; Schwark, W.S.; Mann, S.; Wolfe, L.; Brown, H.; Berthelsen, E.S.; Wakshlag, J.J. Pharmacokinetics, Safety, and Clinical Efficacy of Cannabidiol Treatment in Osteoarthritic Dogs. Front. Vet. Sci. 2018, 5, 165. [Google Scholar] [CrossRef] [PubMed]
- Devinsky, O.; Patel, A.D.; Cross, J.H.; Villanueva, V.; Wirrell, E.C.; Privitera, M.; Greenwood, S.M.; Roberts, C.; Checketts, D.; VanLandingham, K.E.; et al. Effect of Cannabidiol on Drop Seizures in the Lennox-Gastaut Syndrome. N. Eng. J. Med. 2018, 378, 1888–1897. [Google Scholar] [CrossRef] [PubMed]
- FDA. Federal Food, Drug, and Cosmetic Act (FD&C Act). Available online: https://www.fda.gov/regulatory-information/laws-enforced-fda/federal-food-drug-and-cosmetic-act-fdc-act (accessed on 29 April 2019).
- FDA. Warning Letters and Test Results for Cannabidiol-Related Prodcuts. Available online: https://www.fda.gov/newsevents/publichealthfocus/ucm484109.htm (accessed on 29 April 2019).
- ConsumerLab. Product Reviews: CBD & Hemp Extract Supplements, Lotions, and Balms Review. Available online: https://www.consumerlab.com/reviews/cbd-oil-hemp-review/cbd-oil/#whatclfound (accessed on 29 April 2019).
- Szaflarski, J.P.; Bebin, E.M.; Comi, A.M.; Patel, A.D.; Joshi, C.; Checketts, D.; Beal, J.C.; Laux, L.C.; De Boer, L.M.; Wong, M.H.; et al. Long-term safety and treatment effects of cannabidiol in children and adults with treatment-resistant epilepsies: Expanded access program results. Epilepsia 2018, 59, 1540–1548. [Google Scholar] [CrossRef] [PubMed]
- Skinner, C.M.; Miousse, I.R.; Ewing, L.E.; Sridharan, V.; Cao, M.; Lin, H.; Williams, D.K.; Avula, B.; Haider, S.; Chittiboyina, A.G.; et al. Impact of obesity on the toxicity of a multi-ingredient dietary supplement, OxyELITE Pro (New Formula), using the novel NZO/HILtJ obese mouse model: Physiological and mechanistic assessments. Food Chem. Toxicol. 2018, 122, 21–32. [Google Scholar] [CrossRef]
- Miousse, I.R.; Skinner, C.M.; Lin, H.; Ewing, L.E.; Kosanke, S.D.; Williams, D.K.; Avula, B.; Khan, I.A.; ElSohly, M.A.; Gurley, B.J.; et al. Safety assessment of the dietary supplement OxyELITE Pro (New Formula) in inbred and outbred mouse strains. Food Chem. Toxicol. 2017, 109, 194–209. [Google Scholar] [CrossRef]
- Gurley, B.J.; Miousse, I.R.; Nookaew, I.; Ewing, L.E.; Skinner, C.M.; Jenjaroenpun, P.; Wongsurawat, T.; Kennon-McGill, S.; Avula, B.; Bae, J.Y.; et al. Decaffeinated Green Tea Extract Does Not Elicit Hepatotoxic Effects and Modulates the Gut Microbiome in Lean B6C3F1 Mice. Nutrients 2019, 11, 776. [Google Scholar] [CrossRef]
- Gaston, T.E.; Szaflarski, J.P. Cannabis for the Treatment of Epilepsy: An Update. Curr. Neurol. Neurosci. Rep. 2018, 18, 73. [Google Scholar] [CrossRef]
- Agriculture Improvement Act of 2018. In Public Law 115–334; National Archives: Washington, DC, USA, 2018; pp. 115–334.
- Minami, K.; Saito, T.; Narahara, M.; Tomita, H.; Kato, H.; Sugiyama, H.; Katoh, M.; Nakajima, M.; Yokoi, T. Relationship between hepatic gene expression profiles and hepatotoxicity in five typical hepatotoxicant-administered rats. Toxicol. Sci. 2005, 87, 296–305. [Google Scholar] [CrossRef][Green Version]
- Jenny, M.; Santer, E.; Pirich, E.; Schennach, H.; Fuchs, D. Delta9-tetrahydrocannabinol and cannabidiol modulate mitogen-induced tryptophan degradation and neopterin formation in peripheral blood mononuclear cells in vitro. J. Neuroimmunol. 2009, 207, 75–82. [Google Scholar] [CrossRef]
- Hui, T.T.; Mizuguchi, T.; Sugiyama, N.; Avital, I.; Rozga, J.; Demetriou, A.A. Immediate early genes and p21 regulation in liver of rats with acute hepatic failure. Am. J. Surg. 2002, 183, 457–463. [Google Scholar] [CrossRef]
- Buitrago-Molina, L.E.; Marhenke, S.; Longerich, T.; Sharma, A.D.; Boukouris, A.E.; Geffers, R.; Guigas, B.; Manns, M.P.; Vogel, A. The degree of liver injury determines the role of p21 in liver regeneration and hepatocarcinogenesis in mice. Hepatology 2013, 58, 1143–1152. [Google Scholar] [CrossRef]
- Lehmann, K.; Tschuor, C.; Rickenbacher, A.; Jang, J.H.; Oberkofler, C.E.; Tschopp, O.; Schultze, S.M.; Raptis, D.A.; Weber, A.; Graf, R.; et al. Liver failure after extended hepatectomy in mice is mediated by a p21-dependent barrier to liver regeneration. Gastroenterology 2012, 143, 1609–1619.e4. [Google Scholar] [CrossRef] [PubMed]
- Dondorf, F.; Fahrner, R.; Ardelt, M.; Patsenker, E.; Stickel, F.; Dahmen, U.; Settmacher, U.; Rauchfuss, F. Induction of chronic cholestasis without liver cirrhosis - Creation of an animal model. World J. Gastroenterol. 2017, 23, 4191–4199. [Google Scholar] [CrossRef] [PubMed]
- Wojcikowski, K.; Gobe, G. Animal studies on medicinal herbs: Predictability, dose conversion and potential value. Phytother. Res. 2014, 28, 22–27. [Google Scholar] [CrossRef]
- McGill, M.R.; Jaeschke, H. A direct comparison of methods used to measure oxidized glutathione in biological samples: 2-vinylpyridine and N-ethylmaleimide. Toxicol. Mech. Methods 2015, 25, 589–595. [Google Scholar] [CrossRef] [PubMed]
Sample Availability: Tissue samples from experimental animals are available from the authors. |


| Vehicle | 246 mg/kg | 738 mg/kg | 2460 mg/kg | |
|---|---|---|---|---|
| ALT | 27.5 ± 2.7 | 31.7 ± 2.6 | 38.7 ± 4.3 * | 57.0 ± 8.0 * |
| AST | 51.0 ± 2.0 | 58.7 ± 1.8 | 80.3 ± 3.7 * | 120.8 ± 14.3 * |
| ALP | 110.8 ± 2.9 | 106.0 ± 4.5 | 90.3 ± 8.8 | 98.8 ± 4.2 |
| GGT | 4.7 ± 0.2 | 4.3 ± 0.5 | 5.5 ± 0.3 | 4.2 ± 0.8 |
| Total Bilirubin | 0.1 ± 0.0 | 0.1 ± 0.0 | 0.13 ± 0.0 | 2.1 ± 0.1 |
| Vehicle | 61.5 mg/kg | 184.5 mg/kg | 615 mg/kg | |
|---|---|---|---|---|
| ALT | 40.0 ± 3.6 | 41.3 ± 14.8 | 32.3 ± 4.3 | 115.4 ± 51.2 |
| AST | 66.7 ± 6.7 | 74.7 ± 6.7 | 68.2 ± 3.9 | 157.0 ± 48.9 |
| ALP | 112.2 ± 3.5 | 112.7 ± 4.6 | 104.0 ± 2.0 | 113.2 ± 12.2 |
| GGT | 5.2 ± 0.3 | 4.0 ± 0.4 | 4.7 ± 0.2 | 5.0 ± 0.3 |
| Total Bilirubin | 0.1 ± 0.0 | 0.1 ± 0.02 | 0.23 ± 0.02 | 1.5 ± 0.7 * |
| Up-Regulated | ||||||
| Single Dose | 2 Week Dosing | |||||
| Gene | 246 mg/kg | 738 mg/kg | 2460 mg/kg | 61.5 mg/kg | 184.5 mg/kg | 615 mg/kg |
| Krt8 | 32.6 ± 18.5 | 32.2 ± 0.4 | 46.9 ± 25.1 | 0.7 ± 0.1 | 0.8 ± 0.2 | 8.7 ± 4.2 * |
| Map3k6 | 4.9 ± 1.9 | 1.6 ± 0.2 | 38.0 ± 17.3 | 1.7 ± 0.9 | 0.8 ± 0.1 | 8.6 ± 2.9 |
| Cdkn1a | 0.3 ± 0.1 | 0.5 ± 0.2 | 22.7 ± 6.9 | 0.3 ± 0.1 | 0.4 ± 0.1 | 9.3 ± 3.7 |
| Hmox1 | 0.9 ± 0.1 | 2.8 ± 0.6 | 19.0 ± 8.8 * | 1.5 ± 0.4 | 1.5 ± 0.3 | 2.4 ± 1.2 |
| Nqo1 | 3.6 ± 0.8 | 4.92 ± 1.0 * | 9.7 ± 1.7 * | 1.0 ± 0.1 | 1.1 ± 0.1 | 6.2 ± 1.2 * |
| Ugt1a1 | 4.8 ± 0.5 | 7.8 ± 0.6 | 7.5 ± 1.0 | 2.7 ± 0.1 | 4.1 ± 0.2 | 9.1 ± 0.9 |
| Rplp2 | 1.0 ± 0.1 | 1.5 ± 0.2 | 5.7 ± 0.8 * | 0.5 ± 0.1 | 0.5 ± 0.1 | 0.7 ± 0.2 |
| Abcb1a | 1.5 ± 0.4 | 1.0 ± 0.2 | 5.6 ± 0.8 | 2.1 ± 0.5 | 2.1 ± 0.2 | 6.4 ± 1.8 * |
| Slc39a6 | 2.0 ± 0.3 | 1.4 ± 0.1 | 5.5 ± 1.3 | 1.1 ± 0.2 | 0.9 ± 0.1 | 2.9 ± 1.1 |
| Aldoa | 2.8 ± 0.9 | 2.1 ± 0.2 | 5.4 ± 1.4 | 1.3 ± 0.1 | 1.1 ± 0.1 | 2.8 ± 0.5 * |
| Pla2g12a | 1.6 ± 0.3 | 2.0 ± 0.3 | 5.3 ± 0.6 | 1.7 ± 0.3 | 1.4 ± 0.1 | 3.5 ± 0.3 |
| Ubc | 1.3 ± 0.1 | 1.1 ± 0.2 | 4.8 ± 0.6 * | 0.6 ± 0.1 | 1.1 ± 0.1 | 1.6 ± 0.3 |
| Abcc3 | 2.6 ± 0.6 | 2.4 ± 0.4 | 4.5 ± 1.2 | 1.2 ± 0.2 | 1.1 ± 0.1 | 2.2 ± 0.3 * |
| Abcc2 | 1.4 ± 0.2 | 1.6 ± 0.3 | 3.9 ± 0.3 * | 1.2 ± 0.1 | 0.9 ± 0.0 | 3.4 ± 1.3 |
| Gsr | 1.9 ± 0.5 | 2.7 ± 0.3 * | 3.9 ± 0.4 * | 0.8 ± 0.1 | 0.9 ± 0.1 | 2.9 ± 0.5 * |
| Icam1 | 1.9 ± 0.4 | 1.2 ± 0.2 | 3.8 ± 0.9 | 0.8 ± 0.1 | 0.7 ± 0.1 | 1.9 ± 0.6 |
| Cyp3a11 | 2.9 ± 0.3 * | 1.6 ± 0.2 | 3.6 ± 0.7 * | 2.3 ± 0.2 * | 1.6 ± 0.2 | 2.9 ± 0.3 * |
| Txnrd1 | 1.3 ± 0.2 | 1.6 ± 0.3 | 3.5 ± 0.4 | 1.4 ± 0.3 | 1.0 ± 0.2 | 2.6 ± 1.0 |
| Lss | 3.2 ± 0.5 | 2.2 ± 0.1 | 0.3 ± 0.0 | 0.5 ± 0.2 | 0.4 ± 0.2 * | 0.9 ± 0.7 |
| Pgk1 | 1.7 ± 0.4 | 1.3 ± 0.1 | 3.1 ± 0.9 | 0.9 ± 0.0 | 1.0 ± 0.1 | 1.6 ± 0.3 |
| Ddx39 | 1.1 ± 0.1 | 2.2 ± 0.6 * | 2.6 ± 0.3 * | 0.9 ± 0.1 | 0.6 ± 0.1 | 3.1 ± 0.7 |
| Psme3 | 1.2 ± 0.2 | 1.0 ± 0.1 | 2.6 ± 0.5 | 1.0 ± 0.1 | 0.8 ± 0.1 | 1.5 ± 0.3 |
| Ipo4 | 1.1 ± 0.1 | 1.9 ± 0.3 * | 2.5 ± 0.2 * | 0.8 ± 0.1 | 0.9 ± 0.1 | 1.7 ± 0.4 |
| Osmr | 1.4 ± 0.2 | 1.0 ± 0.2 | 2.4 ± 0.3 * | 0.7 ± 0.1 | 0.4 ± 0.1 | 1.5 ± 0.6 |
| Krt18 | 1.5 ± 0.2 | 2.0 ± 0.2 * | 2.2 ± 0.4 * | 0.7 ± 0.1 | 0.7 ± 0.1 | 3.2 ± 0.9 |
| Timm10b | 1.3 ± 0.1 | 1.7 ± 0.2 * | 1.9 ± 0.3 * | 1.0 ± 0.1 | 1.1 ± 0.2 | 1.7± 0.4 |
| Tfrc | 2.0 ± 0.1 | 3.3 ± 0.6 | 1.8 ± 0.1 | 1.3 ± 0.1 | 0.7 ± 0.1 | 2.6 ± 0.3 * |
| Mrps18b | 0.8 ± 0.0 | 0.9 ± 0.1 | 1.7 ± 0.2 * | 1.0 ± 0.1 | 0.8 ± 0.1 | 1.6 ± 0.3 |
| Down-Regulated | ||||||
| Single Dose | 2 Week Dosing | |||||
| Gene | 20 mg/kg | 60 mg/kg | 200 mg/kg | 5 mg/kg | 15 mg/kg | 50 mg/kg |
| Igfals | 1.1 ± 0.1 | 0.5 ± 0.1 * | 0.02 ± 0.0 * | 0.8 ± 0.1 | 0.9 ± 0.2 | 0.2 ± 0.1 * |
| Lgr5 | 1.2 ± 0.1 | 0.5 ± 0.1 * | 0.04 ± 0.0 * | 0.4 ± 0.0 * | 0.3 ± 0.1 * | 0.2 ± 0.0 * |
| Car3 | 0.8 ± 0.1 | 0.2 ± 0.0 * | 0.1 ± 0.1 * | 0.5 ± 0.1 * | 0.5 ± 0.0 * | 0.1 ± 0.0 * |
| Atp8b1 | 1.4 ± 0.3 | 0.5 ± 0.1 | 0.2 ± 0.0 | 0.6 ± 0.1 | 0.5 ± 0.1 | 0.4 ± 0.1 |
| Ppara | 0.7 ± 0.1* | 0.6 ± 0.0 * | 0.2 ± 0.0 * | 0.5 ± 0.1 * | 0.5 ± 0.1 * | 0.3 ± 0.1 * |
| Avpr1a | 1.1 ± 0.2 | 0.8 ± 0.1 | 0.2 ± 0.0 * | 0.5 ± 0.1 * | 0.3 ± 0.1 * | 0.3 ± 0.1 * |
| Abcb11 | 1.1 ± 0.2 | 0.5 ± 0.0 * | 0.2 ± 0.0 * | 0.6 ± 0.1 | 0.7 ± 0.1 | 0.3 ± 0.1 * |
| Mcm10 | 1.9 ± 0.5 | 1.4 ± 0.1 | 0.2 ± 0.0 | 0.9 ± 0.2 | 0.6 ± 0.1 | 0.2 ± 0.0 * |
| Fabp1 | 0.6 ± 0.0 * | 0.4 ± 0.0 * | 0.2 ± 0.1 * | 0.8 ± 0.1 | 0.7 ± 0.0 * | 0.1 ± 0.0 * |
| Fads1 | 0.7 ± 0.1 | 0.6 ± 0.0 | 0.2 ± 0.0 | 0.9 ± 0.1 | 0.8 ± 0.1 | 0.6 ± 0.2 |
| Cdc14b | 0.9 ± 0.1 | 0.7 ± 0.1 | 0.3 ± 0.0 | 0.6 ± 0.1 * | 0.7 ± 0.1 | 0.4 ± 0.1 * |
| Mbl2 | 1.3 ± 0.1 | 0.7 ± 0.0 | 0.3 ± 0.0 * | 0.9 ± 0.1 | 0.9 ± 0.1 | 0.6 ± 0.1 * |
| Asah1 | 1.1 ± 0.1 | 0.9 ± 0.1 | 0.4 ± 0.1 * | 0.8 ± 0.1 | 0.7 ± 0.1 | 0.6 ± 0.1 |
| Lpl | 0.7 ± 0.0 | 0.4 ± 0.1 | 0.5 ± 0.1 | 0.4 ± 0.1 | 0.5 ± 0.1 | 0.2 ± 0.1 |
| Emc9 | 1.3 ± 0.2 | 0.7 ± 0.0 | 0.5 ± 0.0 | 0.9 ± 0.1 | 0.9 ± 0.1 | 0.6 ± 0.1 |
| Rhbg | 0.9 ± 0.1 | 0.5 ± 0.0 * | 0.5 ± 0.1 * | 0.7 ± 0.1 | 1.0 ± 0.1 | 0.6 ± 0.2 |
| L2hgdh | 0.9 ± 0.1 | 0.8 ± 0.0 | 0.5 ± 0.1 * | 0.7 ± 0.1 | 0.7 ± 0.1 | 0.4 ± 0.1 * |
| Cxcl12 | 1.2 ± 0.2 | 0.8 ± 0.1 | 0.5 ± 0.1 | 0.8 ± 0.0 | 0.7 ± 0.0 * | 0.4 ± 0.1 * |
| Maob | 1.0 ± 0.1 | 0.8 ± 0.1 | 0.6 ± 0.0 * | 0.8 ± 0.1 | 0.8 ± 0.1 | 0.6 ± 0.1 * |
| Rdx | 1.1 ± 0.1 | 0.8 ± 0.1 | 0.6 ± 0.0 * | 0.7 ± 0.1 | 0.8 ± 0.1 | 0.7 ± 0.1 |
| B2m | 1.0 ± 0.1 | 0.6 ± 0.0 * | 0.7 ± 0.1 | 0.9 ± 0.1 | 0.8 ± 0.1 | 0.6 ± 0.1 * |
| Cryl1 | 1.0 ± 0.2 | 0.4 ± 0.0 | 0.7 ± 0.1 | 0.8 ± 0.1 | 0.8 ± 0.1 | 0.6 ± 0.1 |
| Ipo8 | 1.4 ± 0.1 | 0.8 ± 0.1 * | 0.9 ± 0.1 | 0.9 ± 0.1 | 0.7 ± 0.1 | 0.5 ± 0.2 * |
| Srebf1 | 1.2 ± 0.1 | 0.7 ± 0.1 | 0.9 ± 0.1 | 0.8 ± 0.1 | 0.7 ± 0.1 | 0.7 ± 0.1 * |
| Scd1 | 0.6 ± 0.1 | 0.3 ± 0.0 * | 0.9 ± 0.3 | 0.5 ± 0.1 | 0.6 ± 0.0 | 0.1 ± 0.0 |
| Dnajb11 | 1.3 ± 0.2 | 1.1 ± 0.1 | 1.1 ± 0.2 | 0.7 ± 0.1 | 0.4 ± 0.1 * | 0.9 ± 0.1 |
| Tagln | 1.0 ± 0.1 | 0.8 ± 0.2 | 1.2 ± 0.7 | 0.6 ± 0.1 | 0.5 ± 0.1 * | 0.3 ± 0.1 * |
| Abcb4 | 1.1 ± 0.3 | 0.6 ± 0.1 | 1.4 ± 0.4 | 0.8 ± 0.1 | 0.6 ± 0.1 | 0.4 ± 0.1 * |
| Fasn | 2.2 ± 0.3 | 1.4 ± 0.1 | 1.5 ± 0.5 | 0.5 ± 0.0 | 0.4 ± 0.1 * | 0.5 ± 0.2 |
© 2019 by the authors. Licensee MDPI, Basel, Switzerland. This article is an open access article distributed under the terms and conditions of the Creative Commons Attribution (CC BY) license (http://creativecommons.org/licenses/by/4.0/).
Share and Cite
Ewing, L.E.; Skinner, C.M.; Quick, C.M.; Kennon-McGill, S.; McGill, M.R.; Walker, L.A.; ElSohly, M.A.; Gurley, B.J.; Koturbash, I. Hepatotoxicity of a Cannabidiol-Rich Cannabis Extract in the Mouse Model. Molecules 2019, 24, 1694. https://doi.org/10.3390/molecules24091694
Ewing LE, Skinner CM, Quick CM, Kennon-McGill S, McGill MR, Walker LA, ElSohly MA, Gurley BJ, Koturbash I. Hepatotoxicity of a Cannabidiol-Rich Cannabis Extract in the Mouse Model. Molecules. 2019; 24(9):1694. https://doi.org/10.3390/molecules24091694
Chicago/Turabian StyleEwing, Laura E., Charles M. Skinner, Charles M. Quick, Stefanie Kennon-McGill, Mitchell R. McGill, Larry A. Walker, Mahmoud A. ElSohly, Bill J. Gurley, and Igor Koturbash. 2019. "Hepatotoxicity of a Cannabidiol-Rich Cannabis Extract in the Mouse Model" Molecules 24, no. 9: 1694. https://doi.org/10.3390/molecules24091694
APA StyleEwing, L. E., Skinner, C. M., Quick, C. M., Kennon-McGill, S., McGill, M. R., Walker, L. A., ElSohly, M. A., Gurley, B. J., & Koturbash, I. (2019). Hepatotoxicity of a Cannabidiol-Rich Cannabis Extract in the Mouse Model. Molecules, 24(9), 1694. https://doi.org/10.3390/molecules24091694