Comparison of Biogenic Amines in Chinese Commercial Soy Sauces

 ,
, 
Abstract
:1. Introduction
2. Results and Discussion
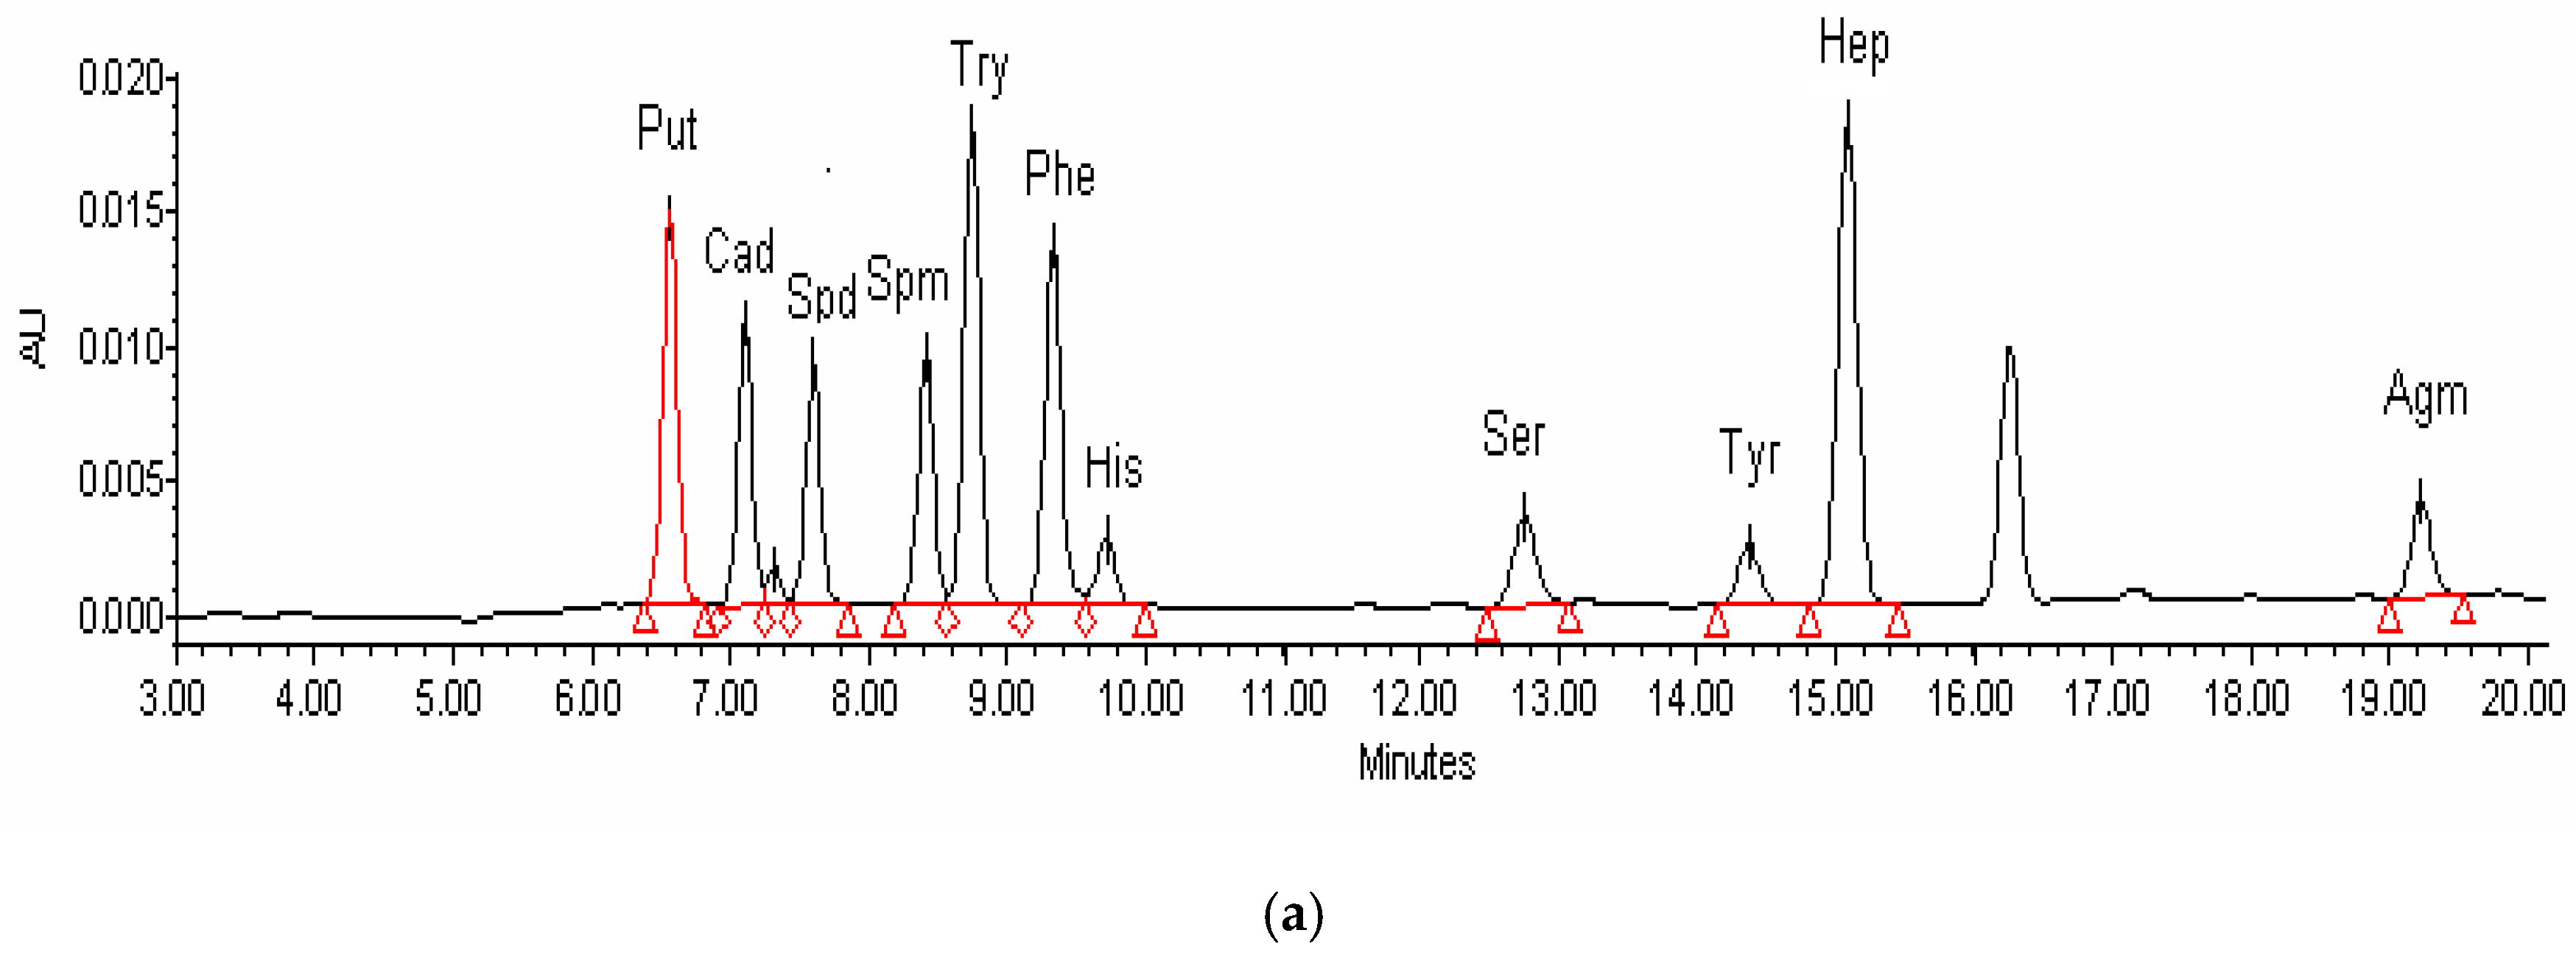
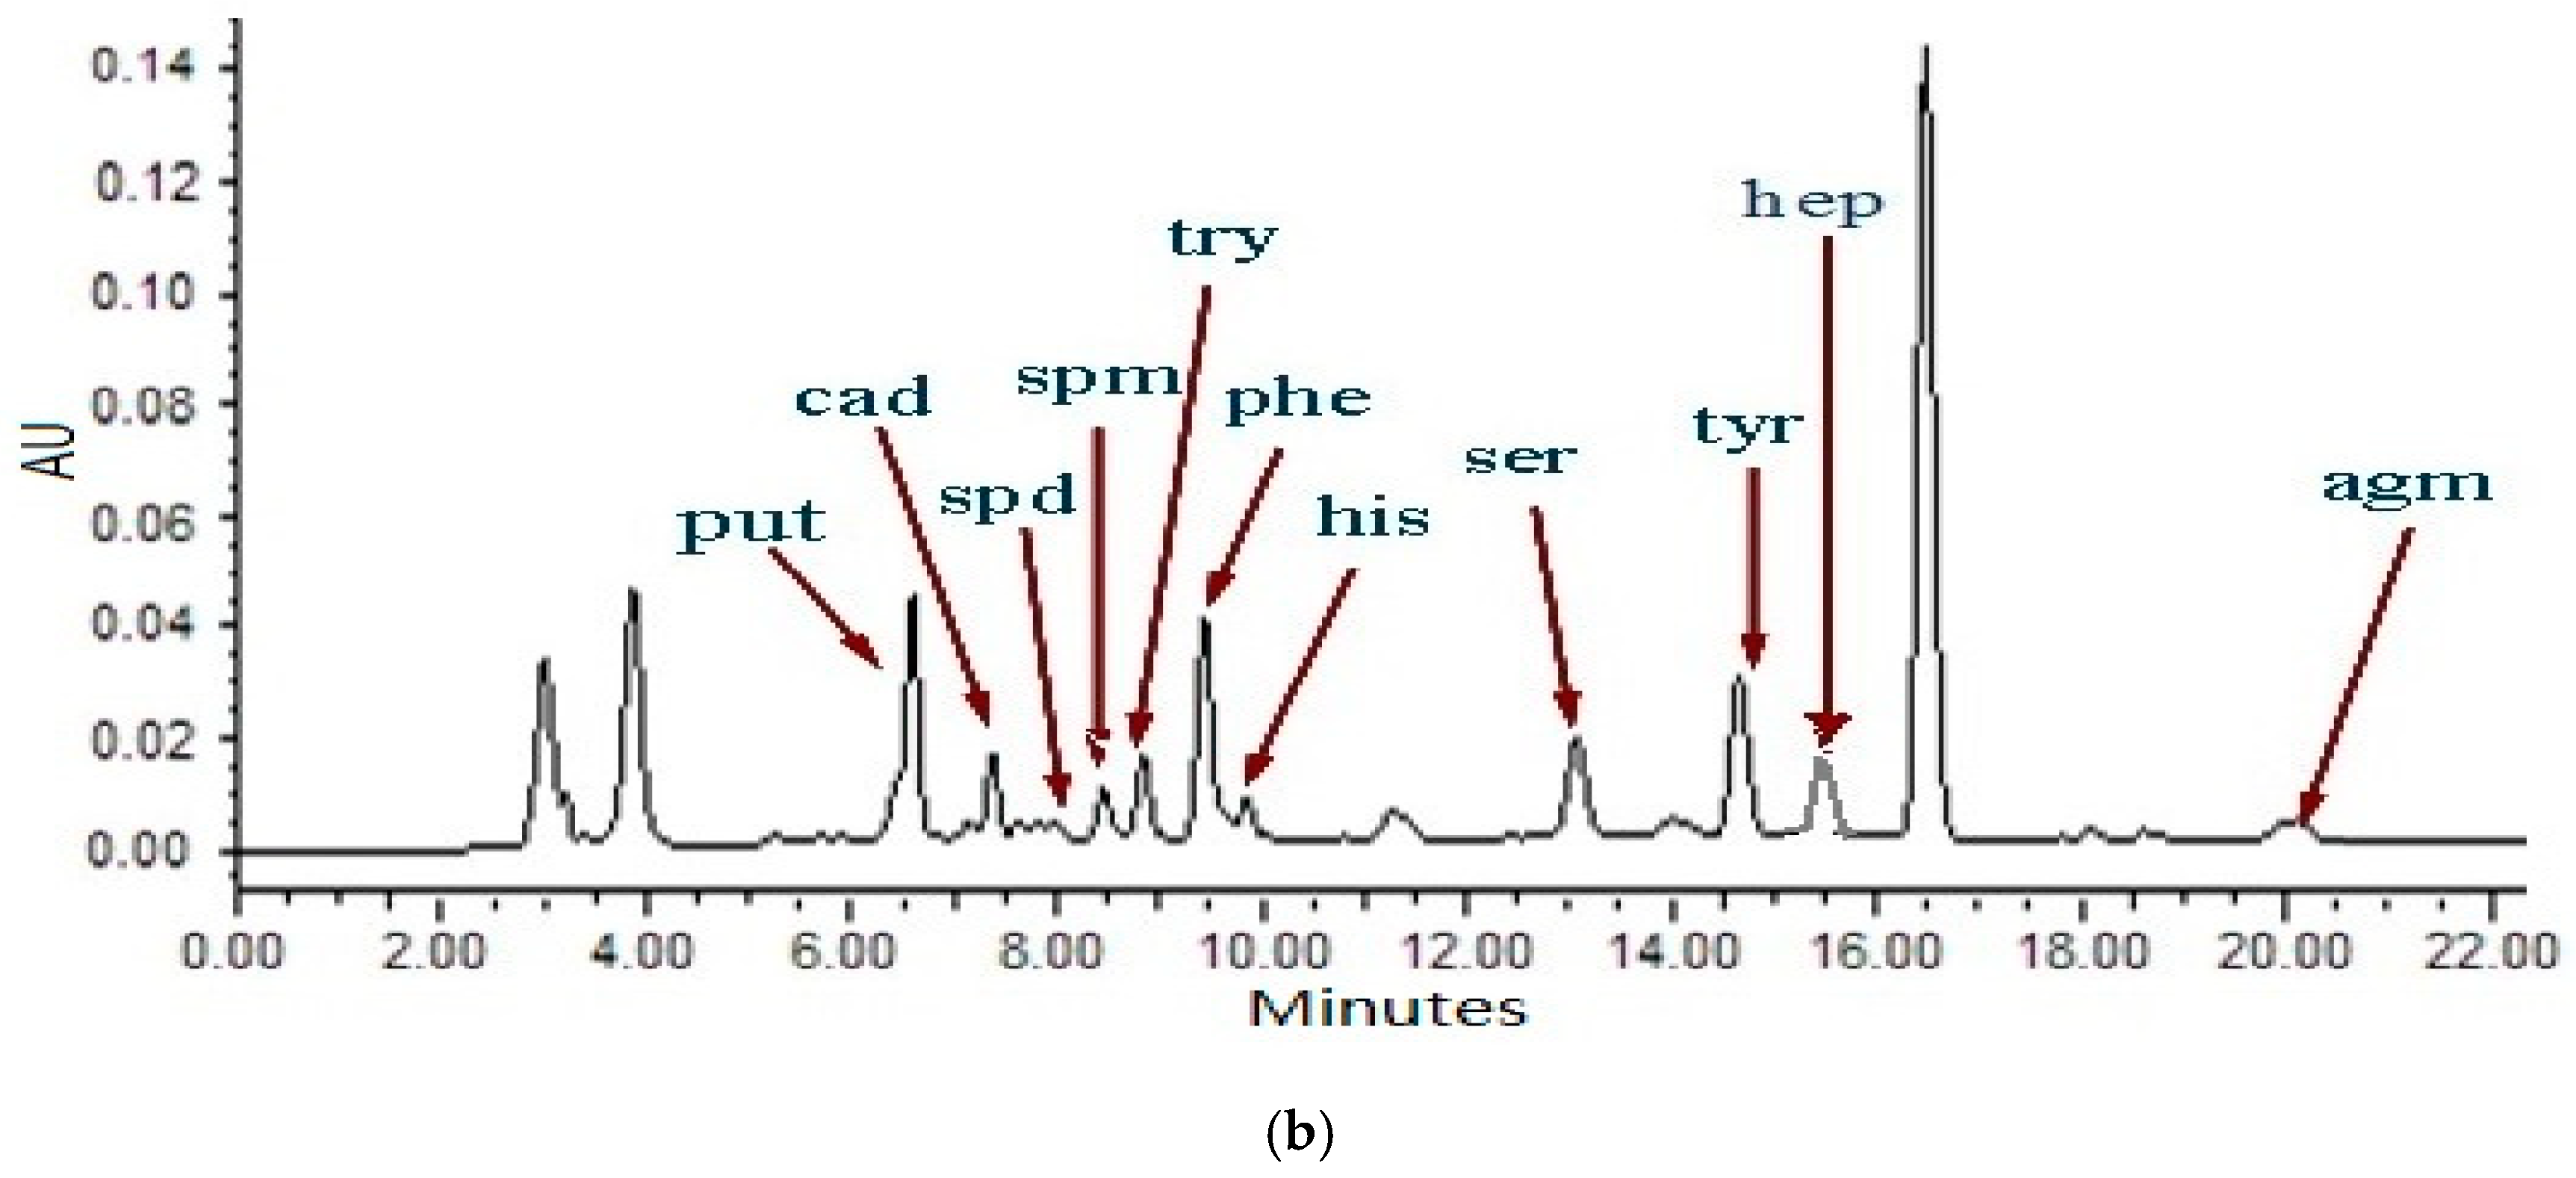
2.1. Method Evaluation for Biogenic Amines Analysis
2.2. Method Validation
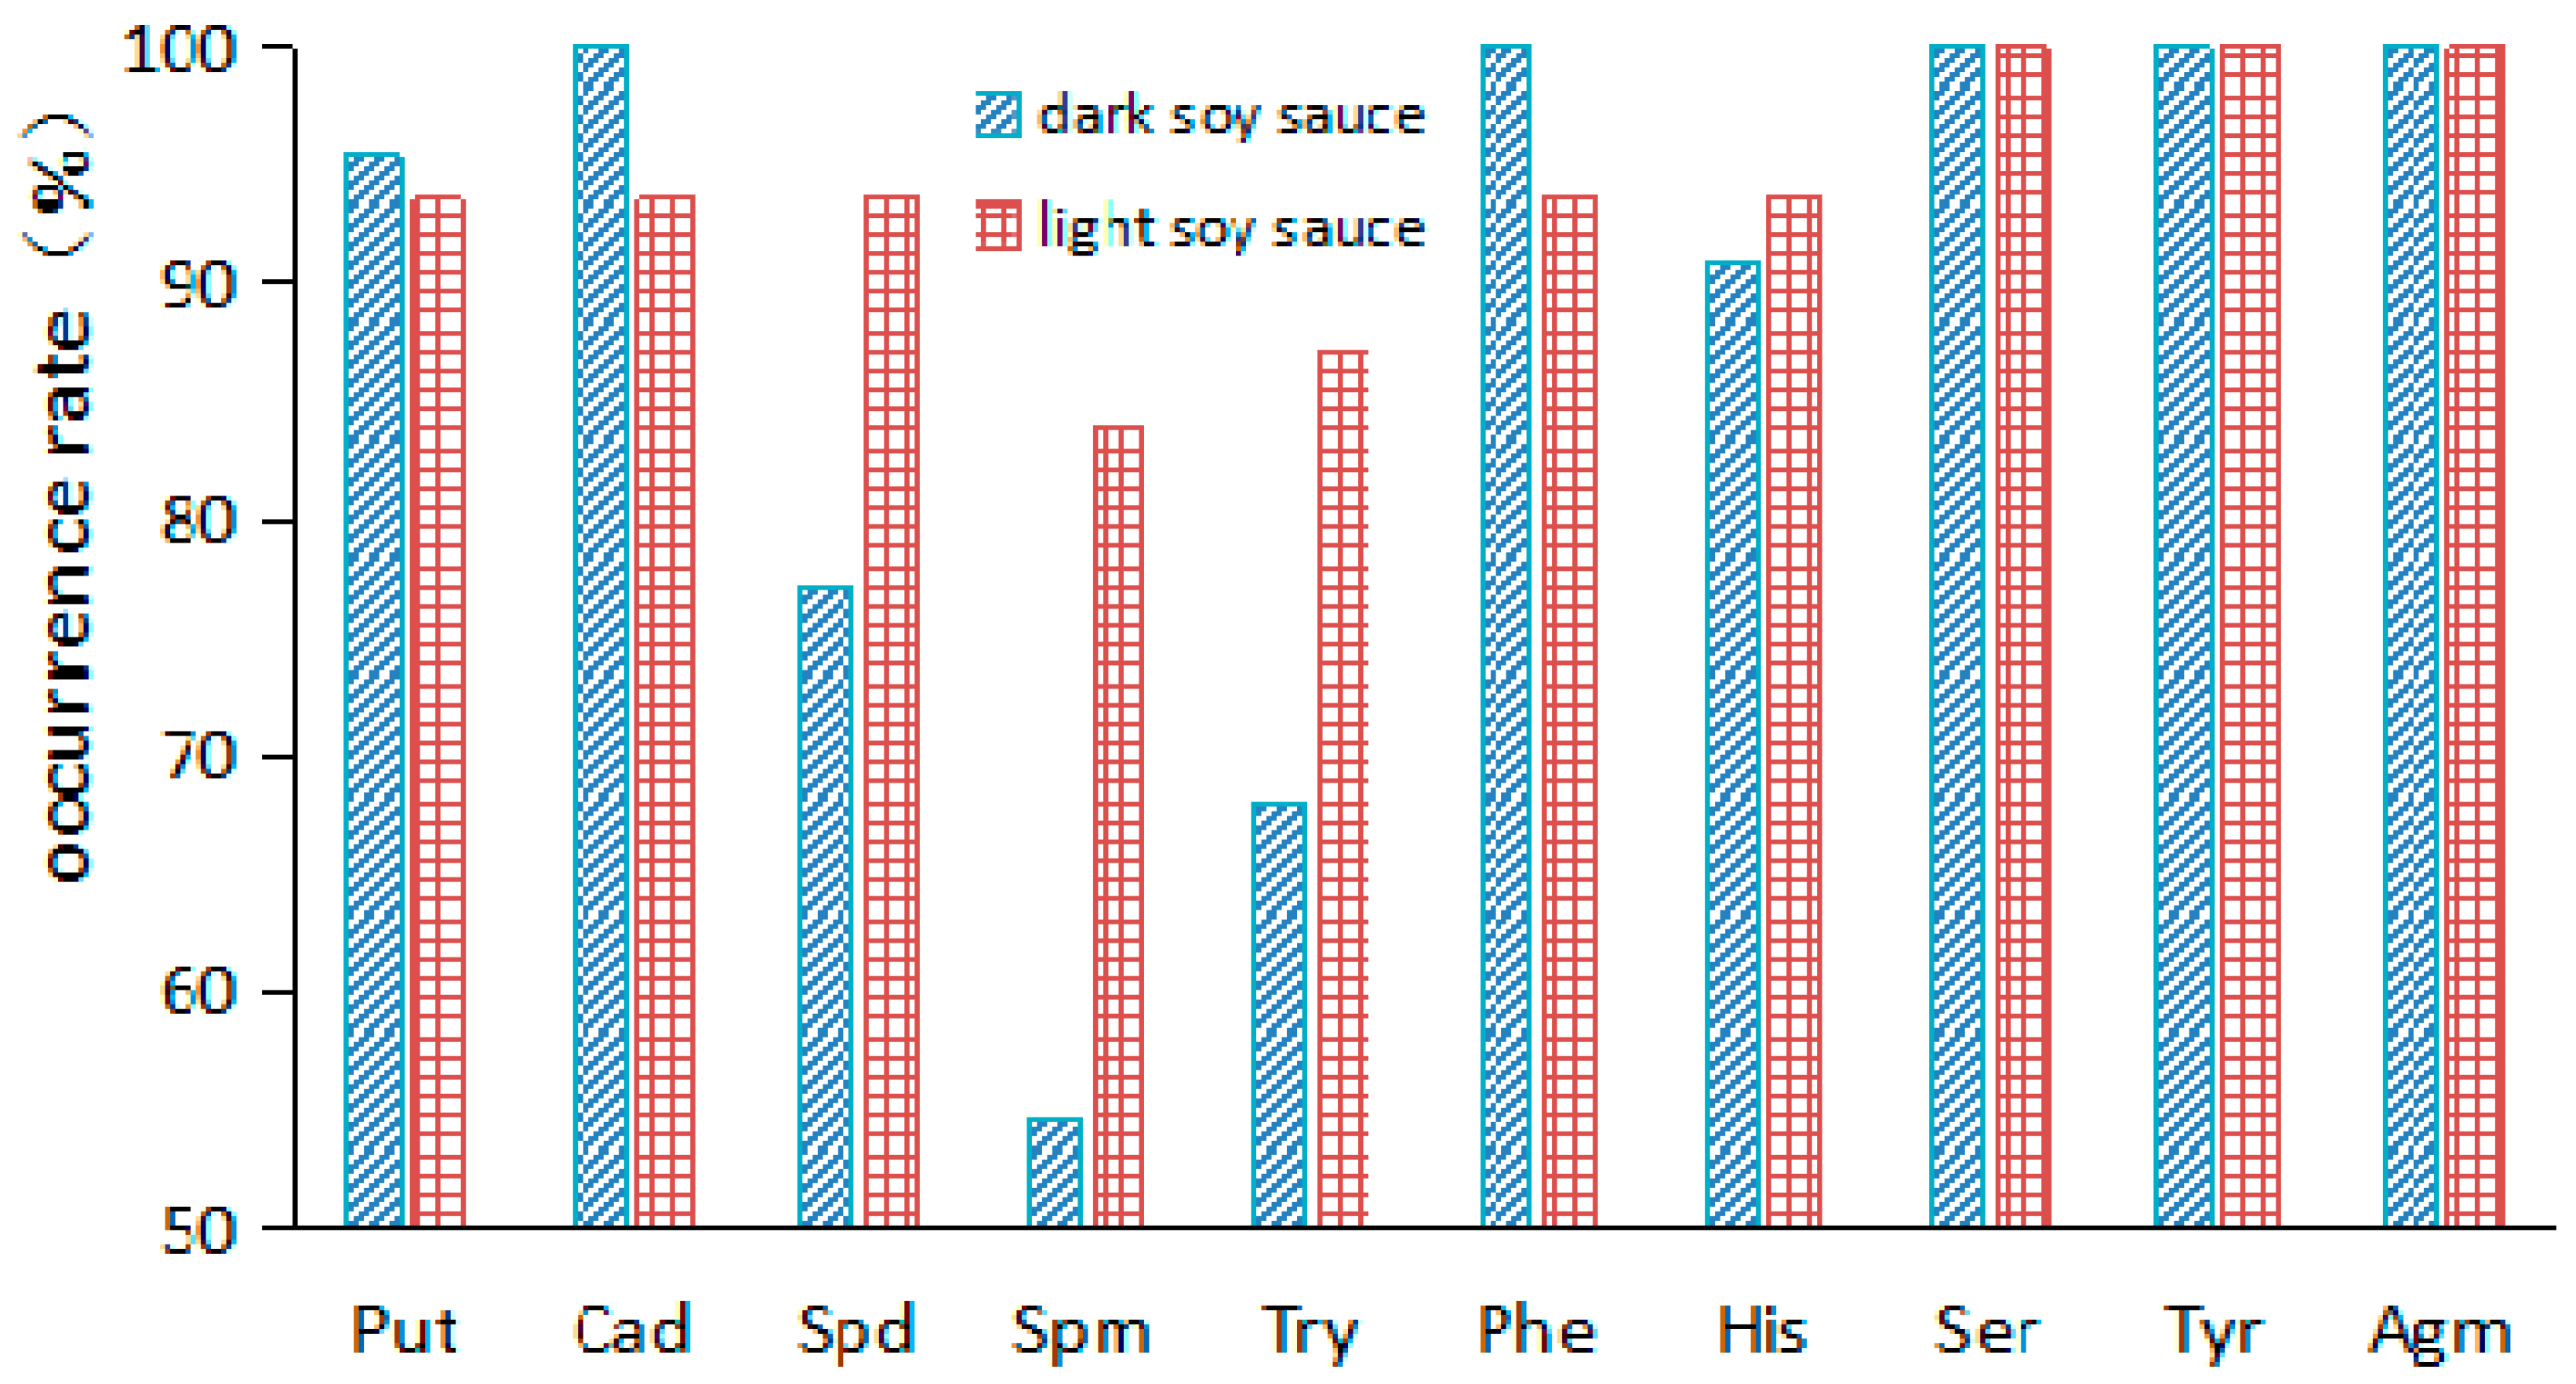
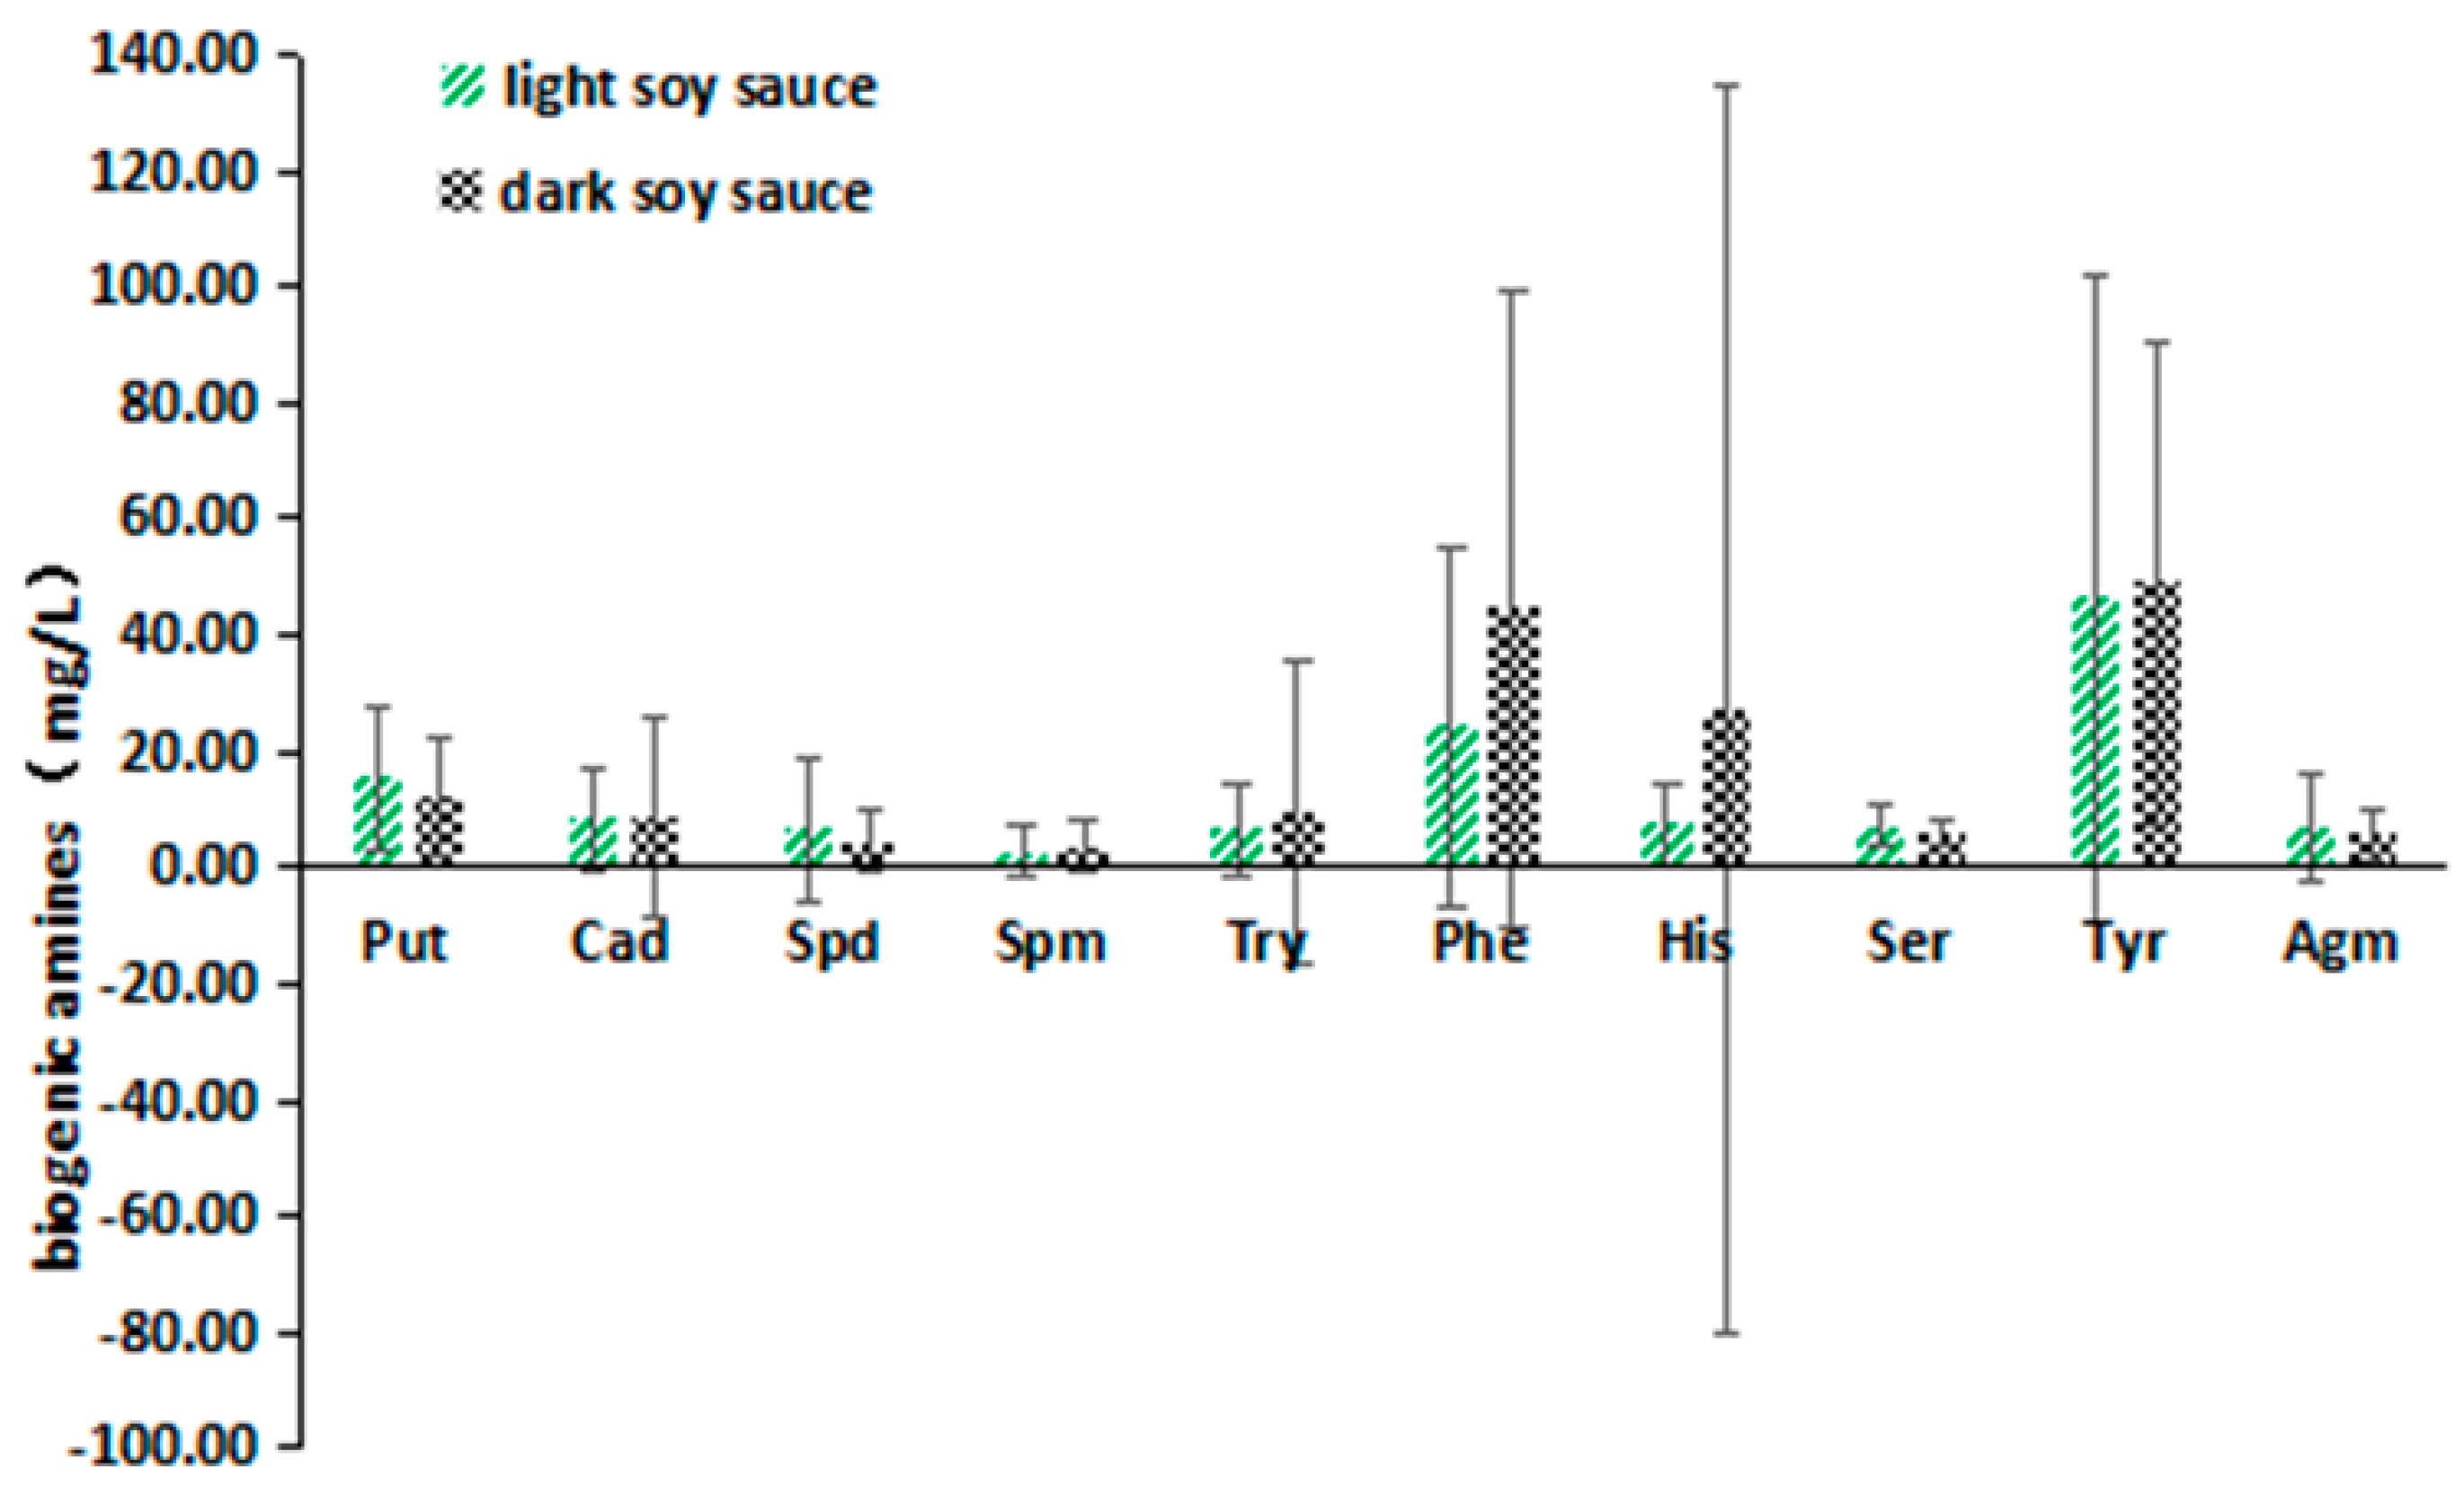
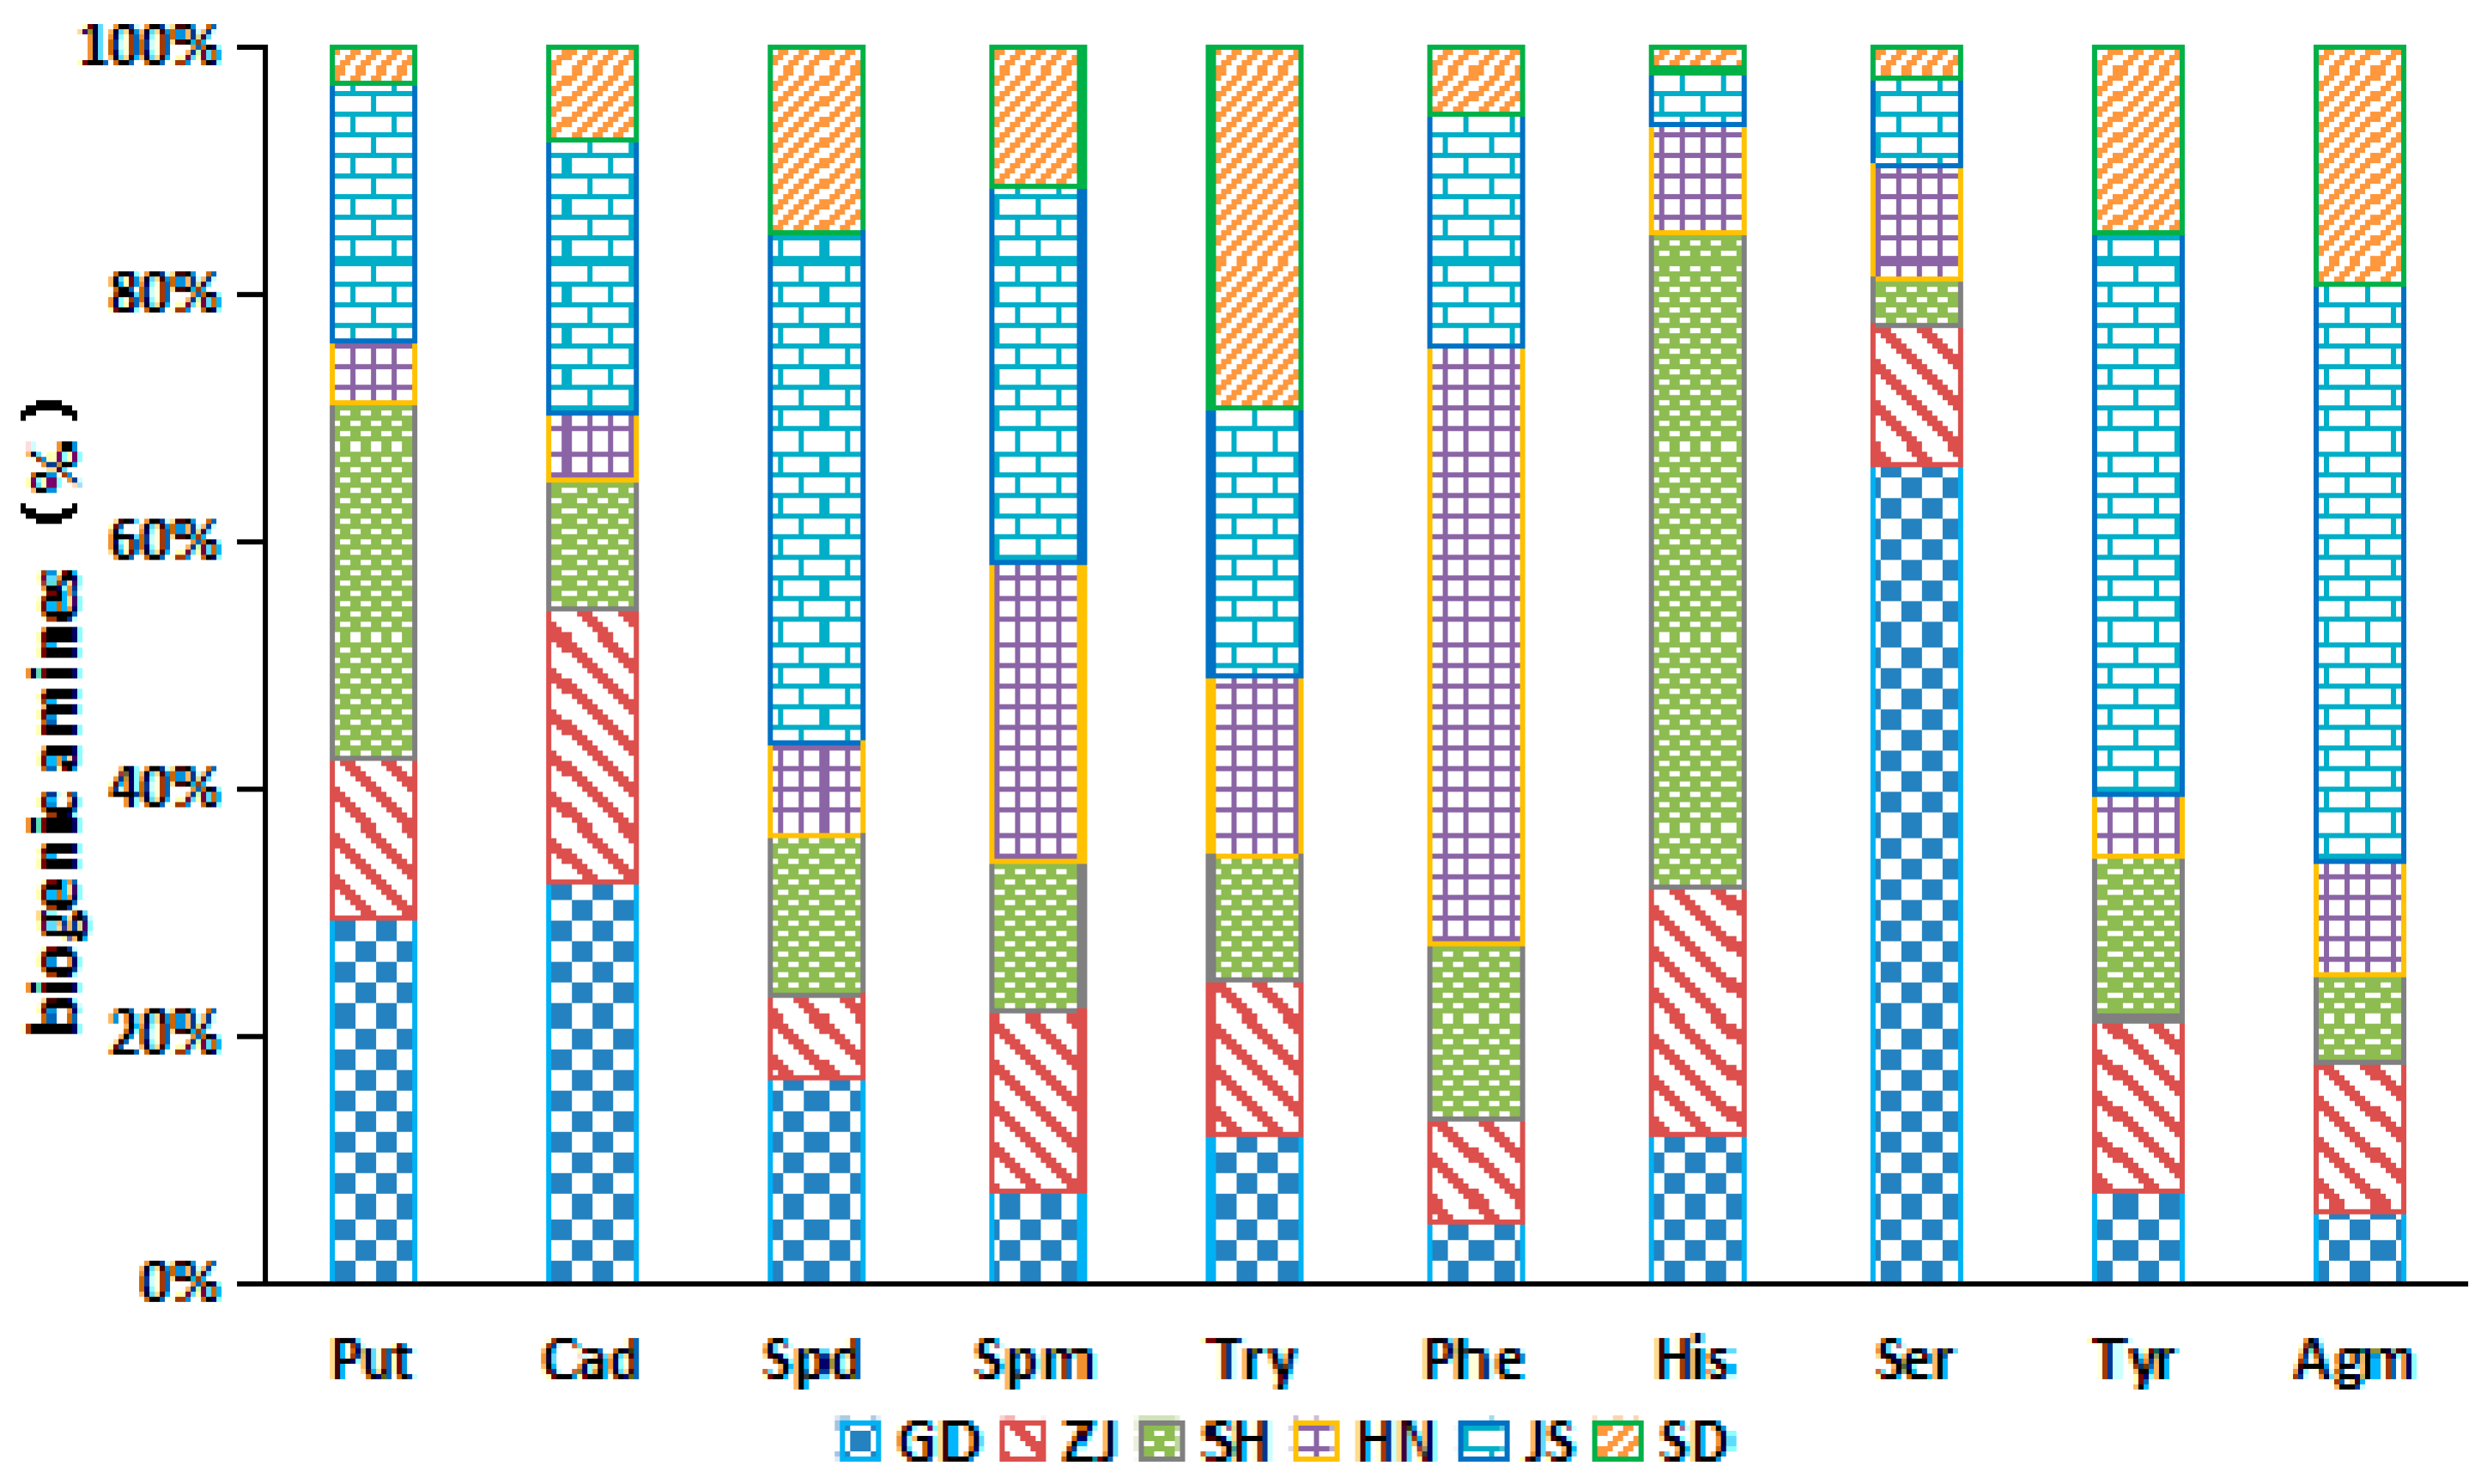
2.3. BAs Contents in Chinese Commercial Soy Sauces
3. Materials and Methods
3.1. Samples, Reagents and Instrument
3.2. Determination of BAs
3.2.1. Preparation of BA Standard Solutions
3.2.2. Standard Curve
3.2.3. Sample Pretreatment
3.2.4. HPLC Detection
3.3. Statistical Analysis
4. Conclusions
Author Contributions
Funding
Conflicts of Interest
References
- Shukla, S.; Kim, M. Determination of biogenic amines and total aflatoxins: Quality index of starter culture soy sauce samples. Food Sci. Biotechnol. 2016, 25, 1221–1224. [Google Scholar] [CrossRef] [PubMed]
- Qi, W.; Hou, L.H.; Guo, H.L.; Wang, C.L.; Fan, Z.C.; Liu, J.F.; Cao, X.H. Effect of salt-tolerant yeast of Candida versatilis and Zygosaccharomyces rouxii on the production of biogenic amines during soy sauce fermentation. J. Sci. Food Agric. 2014, 94, 1537–1542. [Google Scholar] [CrossRef] [PubMed]
- Guidi, L.R.; Gloria, M.B. Bioactive amines in soy sauce: Validation of method, occurrence and potential health effects. Food Chem. 2012, 133, 323–328. [Google Scholar] [CrossRef] [PubMed]
- Qiu, S.; Wang, Y.; Cheng, Y.; Liu, Y.; Yadav, M.P.; Yin, L. Reduction of biogenic amines in sufu by ethanol addition during ripening stage. Food Chem. 2018, 239, 1244–1252. [Google Scholar] [CrossRef] [PubMed]
- Santos, M.H.S. Biogenic amines: Their importance in foods. Int. J. Food Microbiol. 1996, 29, 213–231. [Google Scholar] [CrossRef]
- Dong, H.; Xiao, K. Modified QuEChERS combined with ultra high performance liquid chromatography tandem mass spectrometry to determine seven biogenic amines in Chinese traditional condiment soy sauce. Food Chem. 2017, 229, 502–508. [Google Scholar] [CrossRef] [PubMed]
- Büyükdeveci, M.E.; Boga, E.K.; Ozyurt, G. Gamma-irradiation induced effects on biogenic amine formation and quality of frog legs (Rana esculenta) during storage. LWT-Food Sci. Technol. 2019, 99, 379–386. [Google Scholar] [CrossRef]
- Gardini, F.; Ozogul, Y.; Suzzi, G.; Tabanelli, G.; Ozogul, F. Technological Factors Affecting Biogenic Amine Content in Foods: A Review. Front. Microbiol. 2016, 7, 1218. [Google Scholar] [CrossRef] [PubMed]
- Ordonez, J.L.; Troncoso, A.M.; Garcia-Parrilla, M.D.C.; Callejon, R.M. Recent trends in the determination of biogenic amines in fermented beverages—A review. Anal. Chim. Acta 2016, 939, 10–25. [Google Scholar] [CrossRef] [PubMed]
- Josea, M.; Landete, S.F. Lucia Polo, And Isabel Pardo, Biogenic Amines in Wines from Three Spanish Regions. J. Agric. Food Chem. 2005, 53, 1119–1124. [Google Scholar]
- Erim, F.B. Recent analytical approaches to the analysis of biogenic amines in food samples. Trend. Anal. Chem. 2013, 52, 239–247. [Google Scholar] [CrossRef]
- Yongmei, L.; Xiaohong, C.; Mei, J.; Xin, L.; Rahman, N.; Mingsheng, D.; Yan, G. Biogenic amines in Chinese soy sauce. Food Control. 2009, 20, 593–597. [Google Scholar] [CrossRef]
- Stute, R.; Petridis, K.; Steinhart, H.; Biernoth, G. Biogenic amines in fish and soy sauces. Eur. Food Res. Technol. 2002, 215, 101–107. [Google Scholar]
- Kim, J.Y.; Kim, D.; Park, P.; Kang, H.I.; Ryu, E.K.; Kim, S.M. Effects of storage temperature and time on the biogenic amine content and microflora in Korean turbid rice wine, Makgeolli. Food Chem. 2011, 128, 87–92. [Google Scholar] [CrossRef] [PubMed]
- Tang, T.; Qian, K.; Shi, T.; Wang, F.; Li, J.; Cao, Y.; Hu, Q. Monitoring the contents of biogenic amines in sufu by HPLC with SPE and pre-column derivatization. Food Control. 2011, 22, 1203–1208. [Google Scholar] [CrossRef]
- Lu, S.; Xu, X.; Zhou, G.; Zhu, Z.; Meng, Y.; Sun, Y. Effect of starter cultures on microbial ecosystem and biogenic amines in fermented sausage. Food Control. 2010, 21, 444–449. [Google Scholar] [CrossRef]
- Jochen Kirschbaum, K.R. Hans Bruckner, Liquid chromatographic determination of biogenic amines in fermented foods after derivatization with 3,5-dinitrobenzoyl chloride. J. Chromatogr. A 2000, 881, 517–530. [Google Scholar] [CrossRef]
- Bai, X.; Byun, B.Y.; Mah, J.H. Formation and destruction of biogenic amines in Chunjang (a black soybean paste) and Jajang (a black soybean sauce). Food Chem. 2013, 141, 1026–1031. [Google Scholar] [CrossRef]
- Tsai, Y.-H.; Kung, H.-F.; Chang, S.-C.; Lee, T.-M.; Wei, C.-I. Histamine formation by histamine-forming bacteria in douchi, a Chinese traditional fermented soybean product. Food Chem. 2007, 103, 1305–1311. [Google Scholar] [CrossRef]
- Del Rio, B.; Redruello, B.; Linares, D.M.; Ladero, V.; Fernandez, M.; Martin, M.C.; Ruas-Madiedo, P.; Alvarez, M.A. The dietary biogenic amines tyramine and histamine show synergistic toxicity towards intestinal cells in culture. Food Chem. 2017, 218, 249–255. [Google Scholar] [CrossRef]
- Jia, L.; Rong-Fa, G.; Xi-Ming, W.; Jian-Chu, C.; Ya-Qin, H.; Dong-Hong, L.; Xing-Qian, Y. Detection of ten biogenic amines in Chinese commercial soybean paste by HPLC. Int. J. Food Prop. 2018, 21, 1344–1350. [Google Scholar] [CrossRef]
- Liu, Z.-F.; Wei, Y.-X.; Zhang, J.-J.; Liu, D.-H.; Hu, Y.-Q.; Ye, X.-Q. Changes in biogenic amines during the conventional production of stinky tofu. Int. J. Food Sci. Technol. 2011, 46, 687–694. [Google Scholar] [CrossRef]
- Guan, R.-F.; Liu, Z.-F.; Zhang, J.-J.; Wei, Y.-X.; Wahab, S.; Liu, D.-H.; Ye, X.-Q. Investigation of biogenic amines in sufu (furu): A Chinese traditional fermented soybean food product. Food Control. 2013, 31, 345–352. [Google Scholar] [CrossRef]
Sample Availability: Samples of the compounds are not available from the authors. |

| Time (min) | 0 | 2 | 5 | 10 | 16 | 20 | 21 | 25 | 27 | 36 |
|---|---|---|---|---|---|---|---|---|---|---|
| Acetonitrile (%) | 60 | 60 | 38 | 38 | 20 | 20 | 0 | 0 | 60 | 60 |
| Water (%) | 40 | 40 | 62 | 62 | 80 | 80 | 100 | 100 | 40 | 40 |
| BA | Calibration Curves | R2 | Linearity Range (μg/mL) | MLODs (μg/mL) | MLOQs (μg/mL) |
|---|---|---|---|---|---|
| Put | y = 9.6368x − 0.5572 | 0.9969 | 0.1–80 | 0.01 | 0.03 |
| Cad | y = 15.548x − 0.6264 | 0.9980 | 0.1–80 | 0.01 | 0.04 |
| Spd | y = 13.048x − 0.5076 | 0.9951 | 0.1–80 | 0.01 | 0.04 |
| Spm | y = 14.387x − 0.6906 | 0.9935 | 0.1–80 | 0.01 | 0.03 |
| Tyr | y = 15.981x − 0.6751 | 0.9971 | 0.1–80 | 0.01 | 0.04 |
| Phe | y = 19.275x − 0.9176 | 0.9905 | 0.1–80 | 0.01 | 0.03 |
| His | y = 12.766x − 0.0525 | 0.9981 | 0.1–80 | 0.03 | 0.10 |
| Ser | y = 9.0984x + 1.6702 | 0.9909 | 0.1–80 | 0.03 | 0.10 |
| Try | y = 22.662x − 0.1399 | 0.9901 | 0.1–80 | 0.03 | 0.09 |
| Agm | y = 10.027x + 0.2399 | 0.9934 | 0.1–80 | 0.03 | 0.10 |
| Samples | Biogenic Aminesm | |||||||||||
|---|---|---|---|---|---|---|---|---|---|---|---|---|
| Put | Cad | Spd | Spm | Try | Phe | His | Ser | Tyr | Agm | Total | ||
| s1 | GDax | 16.63 ± 0.60 | 3.18 ± 0.28 | 2.50 ± 0.25 | 5.34 ± 0.47 | 11.40 ± 1.24 | 64.70 ± 5.30 | 4.50 ± 0.64 | 3.72 ± 0.06 | 14.09 ± 1.56 | 1.80 ± 0.58 | 127.84 ± 8.63 |
| s2 | GDy | 29.76 ± 1.11 | 4.58 ± 0.60 | 2.27 ± 0.72 | 7.65 ± 1.37 | 12.59 ± 0.95 | 68.10 ± 3.67 | 4.56 ± 0.34 | 3.55 ± 0.05 | 9.03 ± 0.28 | 1.41 ± 0.63 | 143.49 ± 7.69 |
| s3 | GDy | 3.23 ± 0.13 | 1.72 ± 0.08 | 3.17 ± 0.11 | 1.29 ± 0.08 | 2.40 ± 0.19 | 10.66 ± 0.63 | 2.68 ± 0.25 | 4.74 ± 0.15 | 31.35 ± 2.51 | 4.11 ± 0.23 | 65.36 ± 3.95 |
| s4 | HNbx | 2.02 ± 0.16 | NDn | 2.13 ± 0.10 | 8.92 ± 0.59 | 8.98 ± 0.86 | 26.51 ± 1.41 | 1.64 ± 0.78 | 8.93 ± 0.99 | 31.11 ± 1.86 | 6.41 ± 1.34 | 96.64 ± 1.22 |
| s5 | HNx | 8.68 ± 1.13 | ND | ND | 17.17 ± 1.09 | 124.34 ± 8.83 | 24.81 ± 2.15 | 1.93 ± 0.12 | 9.65 ± 0.37 | 34.22 ± 0.42 | 6.89 ± 1.04 | 227.69 ± 9.62 |
| s6 | HNy | 0.97 ± 0.32 | 5.05 ± 0.69 | 6.17 ± 0.97 | 2.58 ± 0.22 | 7.30 ± 0.74 | 7.22 ± 1.22 | 12.42 ± 1.22 | 8.76 ± 0.77 | 14.09 ± 1.79 | 7.31 ± 0.51 | 71.87 ± 4.40 |
| s7 | HNy | 0.67 ± 0.02 | 2.55 ± 0.18 | 3.65 ± 0.45 | ND | 9.11 ± 0.55 | 5.59 ± 0.41 | 1.40 ± 0.29 | 3.97 ± 0.43 | 12.44 ± 0.14 | 6.25 ± 0.55 | 45.63 ± 0.53 |
| s8 | GDy | 10.83 ± 0.33 | 1.93 ± 0.04 | 1.78 ± 0.34 | 0.98 ± 0.19 | 4.81 ± 0.52 | 38.43 ± 2.62 | 15.09 ± 0.04 | 4.78 ± 0.21 | 10.86 ± 1.02 | 2.19 ± 0.08 | 91.67 ± 2.85 |
| s9 | GDx | 25.45 ± 1.20 | 18.68 ± 1.45 | 8.83 ± 0.08 | 4.15 ± 0.12 | 2.88 ± 0.02 | 37.08 ± 2.84 | 198.35 ± 4.85 | 9.26 ± 0.06 | 85.75 ± 1.99 | 19.17 ± 1.05 | 409.60 ± 9.00 |
| s10 | GDy | 33.92 ± 0.27 | 2.58 ± 0.29 | 0.61 ± 0.12 | ND | 6.98 ± 0.80 | 35.56 ± 2.99 | 11.69 ± 0.74 | 4.14 ± 0.25 | 5.01 ± 0.10 | 0.79 ± 0.11 | 101.27 ± 5.66 |
| s11 | GDy | 34.50 ± 0.31 | 3.94 ± 0.30 | ND | ND | 6.71 ± 0.36 | 31.50 ± 2.41 | 13.37 ± 0.92 | 3.87 ± 0.02 | 4.64 ± 0.05 | 0.55 ± 0.02 | 99.07 ± 3.63 |
| s12 | GDy | 38.77 ± 1.13 | 7.43 ± 0.22 | 0.65 ± 0.02 | ND | 8.36 ± 1.40 | 62.93 ± 4.03 | 12.59 ± 1.14 | 3.55 ± 0.04 | 4.13 ± 0.07 | 0.78 ± 0.03 | 139.16 ± 7.98 |
| s13 | GDy | 25.57 ± 0.54 | 1.59 ± 0.12 | 1.47 ± 0.02 | ND | 3.25 ± 0.21 | 15.72 ± 0.86 | 6.84 ± 0.09 | 5.50 ± 0.06 | 13.66 ± 0.48 | 1.72 ± 0.09 | 75.31 ± 1.82 |
| s14 | JScy | 18.43 ± 0.97 | 13.82 ± 1.27 | 27.91 ± 0.96 | 14.68 ± 0.96 | 29.12 ± 1.22 | 12.77 ± 0.98 | 4.59 ± 0.18 | 11.81 ± 1.05 | 158.63 ± 6.37 | 34.57 ± 1.59 | 326.33 ± 13.09 |
| s15 | JSy | 7.73 ± 0.87 | 2.23 ± 0.32 | 5.32 ± 0.14 | 3.39 ± 0.34 | ND | 2.31 ± 0.05 | 2.17 ± 0.13 | 11.47 ± 0.45 | 257.38 ± 13.31 | 32.16 ± 1.37 | 324.16 ± 14.76 |
| s16 | ZJdy | ND | 19.04 ± 0.71 | 1.94 ± 0.01 | ND | ND | ND | 12.80 ± 0.38 | 9.18 ± 0.05 | 54.02 ± 0.32 | 7.03 ± 0.23 | 104.49 ± 0.34 |
| s17 | ZJy | 10.26 ± 0.84 | 9.94 ± 0.63 | 6.78 ± 0.22 | 10.86 ± 1.42 | 21.45 ± 0.69 | 7.77 ± 0.23 | 3.12 ± 0.18 | 7.94 ± 0.52 | 87.05 ± 5.16 | 24.42 ± 1.06 | 189.59 ± 2.97 |
| s18 | ZJy | 8.65 ± 0.42 | 8.52 ± 0.64 | 3.51 ± 0.77 | 9.50 ± 0.94 | 23.37 ± 2.14 | 5.98 ± 0.46 | 2.64 ± 0.51 | 10.11 ± 0.95 | 104.07 ± 7.14 | 24.39 ± 2.71 | 200.74 ± 12.86 |
| s19 | GDy | 13.69 ± 0.33 | 2.73 ± 0.11 | 0.54 ± 0.07 | 1.12 ± 0.21 | 3.19 ± 0.11 | 11.43 ± 0.56 | 8.08 ± 0.97 | 8.61 ± 0.66 | 44.10 ± 4.85 | 6.40 ± 0.22 | 99.90 ± 8.08 |
| s20 | GDx | 23.04 ± 1.17 | 16.20 ± 0.68 | 2.86 ± 0.17 | ND | 3.38 ± 0.34 | 66.85 ± 6.26 | 4.39 ± 0.31 | 4.36 ± 0.67 | 29.07 ± 2.42 | 3.31 ± 0.23 | 153.78 ± 8.51 |
| s21 | GDy | 14.88 ± 0.01 | 3.41 ± 0.10 | 1.32 ± 0.03 | ND | 1.92 ± 0.01 | 10.71 ± 0.32 | 6.83 ± 0.03 | 4.16 ± 0.01 | 12.30 ± 0.08 | 1.84 ± 0.20 | 57.76 ± 0.07 |
| s22 | GDy | 6.27 ± 0.34 | 3.88 ± 0.34 | 5.59 ± 0.29 | ND | 0.73 ± 0.06 | 5.70 ± 0.11 | 1.88 ± 0.06 | 8.88 ± 0.16 | 28.90 ± 0.35 | 1.76 ± 0.10 | 63.84 ± 0.79 |
| s23 | GDy | 4.12 ± 0.22 | 4.70 ± 0.21 | 4.60 ± 0.28 | 1.22 ± 0.10 | ND | 2.06 ± 0.06 | 2.87 ± 0.09 | 8.39 ± 0.06 | 28.52 ± 0.65 | 2.88 ± 0.47 | 59.37 ± 0.21 |
| s24 | GDy | 4.64 ± 0.00 | 4.62 ± 0.44 | 6.34 ± 0.33 | 1.60 ± 0.10 | ND | 6.25 ± 0.06 | 1.49 ± 0.02 | 9.10 ± 0.02 | 32.09 ± 0.26 | 2.62 ± 0.12 | 69.24 ± 0.13 |
| s25 | GDx | 22.41 ± 1.00 | 82.36 ± 3.75 | 21.69 ± 0.33 | 5.61 ± 0.13 | 4.57 ± 0.05 | 20.38 ± 1.05 | 5.25 ± 0.73 | 7.13 ± 0.08 | 40.41 ± 1.16 | 9.65 ± 0.20 | 219.46 ± 1.77 |
| s26 | GDx | 16.10 ± 0.84 | 5.17 ± 0.47 | ND | ND | ND | ND | 13.53 ± 1.12 | 6.59 ± 0.64 | 79.57 ± 5.26 | 5.73 ± 0.30 | 126.69 ± 6.95 |
| s27 | SDey | 1.62 ± 0.04 | 2.73 ± 0.04 | 6.08 ± 0.07 | 3.40 ± 0.26 | 3.99 ± 0.28 | 3.02 ± 0.70 | 1.08 ± 0.13 | 15.75 ± 0.57 | 68.78 ± 4.02 | 13.57 ± 0.79 | 120.02 ± 4.57 |
| s28 | GDy | 14.69 ± 1.08 | 9.39 ± 0.03 | 0.65 ± 0.11 | 0.93 ± 0.30 | 1.95 ± 0.46 | 9.99 ± 0.04 | 12.69 ± 1.27 | 7.85 ± 0.31 | 13.99 ± 0.35 | 2.82 ± 0.40 | 74.95 ± 2.93 |
| s29 | GDx | 4.83 ± 0.23 | 3.56 ± 0.15 | 3.80 ± 0.39 | 2.64 ± 0.23 | 5.16 ± 0.26 | 2.40 ± 0.52 | 1.04 ± 0.03 | 7.58 ± 0.31 | 38.61 ± 1.72 | 5.51 ± 0.92 | 75.15 ± 2.11 |
| s30 | GDx | 11.72 ± 0.92 | 5.67 ± 0.60 | 3.96 ± 0.65 | 3.77 ± 0.05 | 1.49 ± 0.07 | 4.09 ± 1.16 | 477.79 ± 23.52 | 9.77 ± 0.28 | 85.54 ± 5.37 | 7.46 ± 0.95 | 611.25 ± 22.13 |
| s31 | GDy | 37.80 ± 1.98 | 29.55 ± 1.32 | 63.47 ± 4.73 | 2.58 ± 0.24 | 8.08 ± 0.86 | 20.15 ± 1.27 | 36.36 ± 0.40 | 13.85 ± 0.35 | 70.66 ± 1.29 | 5.56 ± 0.78 | 288.08 ± 4.32 |
| s32 | GDx | 12.23 ± 0.99 | 24.17 ± 1.11 | 13.55 ± 0.40 | 3.89 ± 0.43 | ND | 3.29 ± 0.75 | 5.06 ± 0.21 | 8.61 ± 0.12 | 61.82 ± 3.96 | 6.26 ± 0.48 | 138.87 ± 2.97 |
| s33 | GDy | 18.77 ± 0.58 | 8.53 ± 0.04 | ND | ND | 1.23 ± 0.08 | 3.94 ± 0.19 | 12.20 ± 0.61 | 3.50 ± 0.03 | 9.53 ± 0.84 | 0.70 ± 0.09 | 58.66 ± 2.15 |
| s34 | GDy | 39.09 ± 1.73 | 28.09 ± 0.31 | 21.59 ± 0.80 | 1.52 ± 0.39 | 4.81 ± 0.44 | 5.86 ± 0.33 | 6.25 ± 0.14 | 8.15 ± 0.20 | 43.41 ± 1.31 | 4.84 ± 0.18 | 163.61 ± 5.46 |
| s35 | GDx | ND | 5.89 ± 0.32 | 5.08 ± 0.16 | 1.29 ± 0.00 | 1.90 ± 0.11 | 2.03 ± 0.24 | 1.54 ± 0.15 | 5.42 ± 0.04 | 31.54 ± 0.59 | 4.78 ± 0.46 | 59.93 ± 0.42 |
| s36 | GDx | 15.09 ± 0.46 | 8.96 ± 0.22 | 0.86 ± 0.07 | 1.48 ± 0.06 | 1.85 ± 0.07 | 19.50 ± 0.06 | 15.86 ± 0.77 | 3.92 ± 0.08 | 10.30 ± 1.61 | 2.09 ± 0.15 | 79.90 ± 1.93 |
| s37 | GDy | 29.84 ± 1.92 | 31.18 ± 1.92 | 8.41 ± 0.34 | 2.78 ± 0.75 | ND | 11.83 ± 0.54 | 1.07 ± 0.27 | 8.29 ± 0.25 | 75.93 ± 5.92 | 5.65 ± 0.51 | 174.96 ± 11.74 |
| s38 | ZJy | 14.41 ± 1.89 | 29.31 ± 0.10 | 5.98 ± 1.19 | 14.04 ± 0.53 | 1.50 ± 0.33 | 12.12 ± 1.13 | 5.71 ± 0.50 | 11.89 ± 1.06 | 144.55 ± 0.89 | 12.30 ± 0.68 | 251.81 ± 2.73 |
| s39 | ZJx | 5.97 ± 0.82 | 6.24 ± 0.60 | 1.72 ± 0.15 | 1.69 ± 0.31 | ND | 7.86 ± 0.68 | 6.98 ± 0.64 | 5.04 ± 0.01 | 26.24 ± 1.68 | 3.33 ± 0.26 | 65.29 ± 5.05 |
| s40 | ZJx | 13.03 ± 0.42 | 4.98 ± 0.25 | ND | 1.52 ± 0.22 | 4.05 ± 0.30 | 81.02 ± 4.48 | 7.48 ± 0.82 | 3.80 ± 0.07 | 16.40 ± 0.29 | 3.63 ± 0.21 | 136.26 ± 6.39 |
| s41 | ZJx | 7.08 ± 0.26 | 3.58 ± 0.01 | ND | 6.93 ± 0.85 | 9.97 ± 0.02 | 20.85 ± 0.51 | 0.82 ± 0.14 | 4.97 ± 0.20 | 59.01 ± 0.13 | 9.05 ± 0.07 | 122.27 ± 2.20 |
| s42 | ZJy | 3.74 ± 0.58 | 2.52 ± 0.70 | ND | 4.59 ± 0.58 | ND | 40.53 ± 2.37 | ND | 7.38 ± 0.89 | 89.20 ± 8.68 | 4.63 ± 0.85 | 152.93 ± 14.75 |
| s43 | ZJy | 5.81 ± 0.08 | 3.25 ± 0.03 | 0.63 ± 0.14 | 1.19 ± 0.04 | ND | 23.64 ± 0.57 | 1.40 ± 0.14 | 5.20 ± 0.08 | 42.47 ± 1.89 | 0.79 ± 0.13 | 84.38 ± 1.32 |
| s44 | ZJx | 12.63 ± 0.53 | 8.95 ± 1.22 | 9.27 ± 1.75 | 13.73 ± 0.29 | 11.11 ± 0.64 | 41.05 ± 0.28 | 4.78 ± 0.17 | 9.83 ± 0.44 | 167.02 ± 1.88 | 15.92 ± 0.26 | 294.29 ± 3.44 |
| s45 | ZJx | 17.84 ± 0.07 | 4.41 ± 0.03 | 4.80 ± 0.22 | 2.41 ± 0.37 | 10.76 ± 0.60 | 67.80 ± 2.59 | 4.60 ± 0.23 | 3.86 ± 0.33 | 21.91 ± 1.33 | 3.74 ± 0.74 | 142.12 ± 1.46 |
| s46 | ZJy | 44.59 ± 1.53 | 2.13 ± 0.27 | 10.41 ± 1.20 | ND | 20.18 ± 1.43 | 263.79 ± 16.14 | ND | 4.02 ± 0.14 | 17.96 ± 0.48 | 2.33 ± 0.15 | 365.41 ± 19.54 |
| s47 | SHfx | 16.87 ± 0.56 | 2.85 ± 0.54 | 3.13 ± 0.59 | ND | 5.67 ± 0.13 | 88.10 ± 1.27 | 7.97 ± 0.27 | 3.89 ± 0.17 | 19.02 ± 1.16 | 2.64 ± 0.09 | 150.55 ± 2.25 |
| s48 | SHx | 12.95 ± 0.03 | 1.36 ± 0.59 | 1.27 ± 0.10 | ND | 5.67 ± 0.84 | 96.24 ± 4.63 | 14.43 ± 0.70 | 3.62 ± 0.02 | 6.63 ± 0.49 | 1.35 ± 0.26 | 143.53 ± 7.55 |
| s49 | SHx | 2.52 ± 0.05 | 2.62 ± 0.06 | 4.68 ± 0.49 | 2.99 ± 0.27 | 1.63 ± 0.36 | 32.35 ± 2.02 | ND | 5.86 ± 0.32 | 92.08 ± 7.45 | 8.24 ± 0.63 | 152.96 ± 6.42 |
| s50 | SHx | 3.45 ± 0.08 | 2.99 ± 0.07 | 2.22 ± 0.23 | 4.34 ± 0.98 | 0.61 ± 0.01 | 42.79 ± 1.22 | 0.61 ± 0.41 | 8.11 ± 0.55 | 137.41 ± 4.72 | 4.81 ± 0.84 | 207.34 ± 7.15 |
| s51 | SHx | ND | 3.84 ± 0.02 | 0.96 ± 0.15 | 0.69 ± 0.04 | ND | 28.47 ± 0.41 | 2.73 ± 0.07 | 5.23 ± 0.15 | 27.73 ± 2.41 | 1.18 ± 0.12 | 70.83 ± 2.41 |
| s52 | SHy | 21.31 ± 2.05 | 2.20 ± 0.39 | 6.60 ± 0.37 | ND | 24.02 ± 3.96 | 119.46 ± 4.20 | ND | 4.09 ± 0.04 | 20.12 ± 1.18 | 2.04 ± 0.24 | 199.85 ± 12.36 |
| s53 | GDy | 1.55 ± 0.28 | 6.29 ± 0.12 | 2.15 ± 0.14 | 8.09 ± 0.98 | 9.62 ± 0.11 | 11.93 ± 0.18 | 4.00 ± 0.01 | 5.06 ± 0.07 | 33.02 ± 0.33 | 7.01 ± 0.55 | 88.72 ± 1.02 |
© 2019 by the authors. Licensee MDPI, Basel, Switzerland. This article is an open access article distributed under the terms and conditions of the Creative Commons Attribution (CC BY) license (http://creativecommons.org/licenses/by/4.0/).
Share and Cite
Li, J.; Zhou, L.; Feng, W.; Cheng, H.; Muhammad, A.I.; Ye, X.; Zhi, Z. Comparison of Biogenic Amines in Chinese Commercial Soy Sauces. Molecules 2019, 24, 1522. https://doi.org/10.3390/molecules24081522
Li J, Zhou L, Feng W, Cheng H, Muhammad AI, Ye X, Zhi Z. Comparison of Biogenic Amines in Chinese Commercial Soy Sauces. Molecules. 2019; 24(8):1522. https://doi.org/10.3390/molecules24081522
Chicago/Turabian StyleLi, Jia, Linan Zhou, Wei Feng, Huan Cheng, Aliyu Idris Muhammad, Xingqian Ye, and Zijian Zhi. 2019. "Comparison of Biogenic Amines in Chinese Commercial Soy Sauces" Molecules 24, no. 8: 1522. https://doi.org/10.3390/molecules24081522
APA StyleLi, J., Zhou, L., Feng, W., Cheng, H., Muhammad, A. I., Ye, X., & Zhi, Z. (2019). Comparison of Biogenic Amines in Chinese Commercial Soy Sauces. Molecules, 24(8), 1522. https://doi.org/10.3390/molecules24081522