
Cocaine-Induced Reinstatement of Cocaine Seeking Provokes Changes in the Endocannabinoid and N-Acylethanolamine Levels in Rat Brain Structures

 , ,
, ,
Abstract
:1. Introduction
2. Results
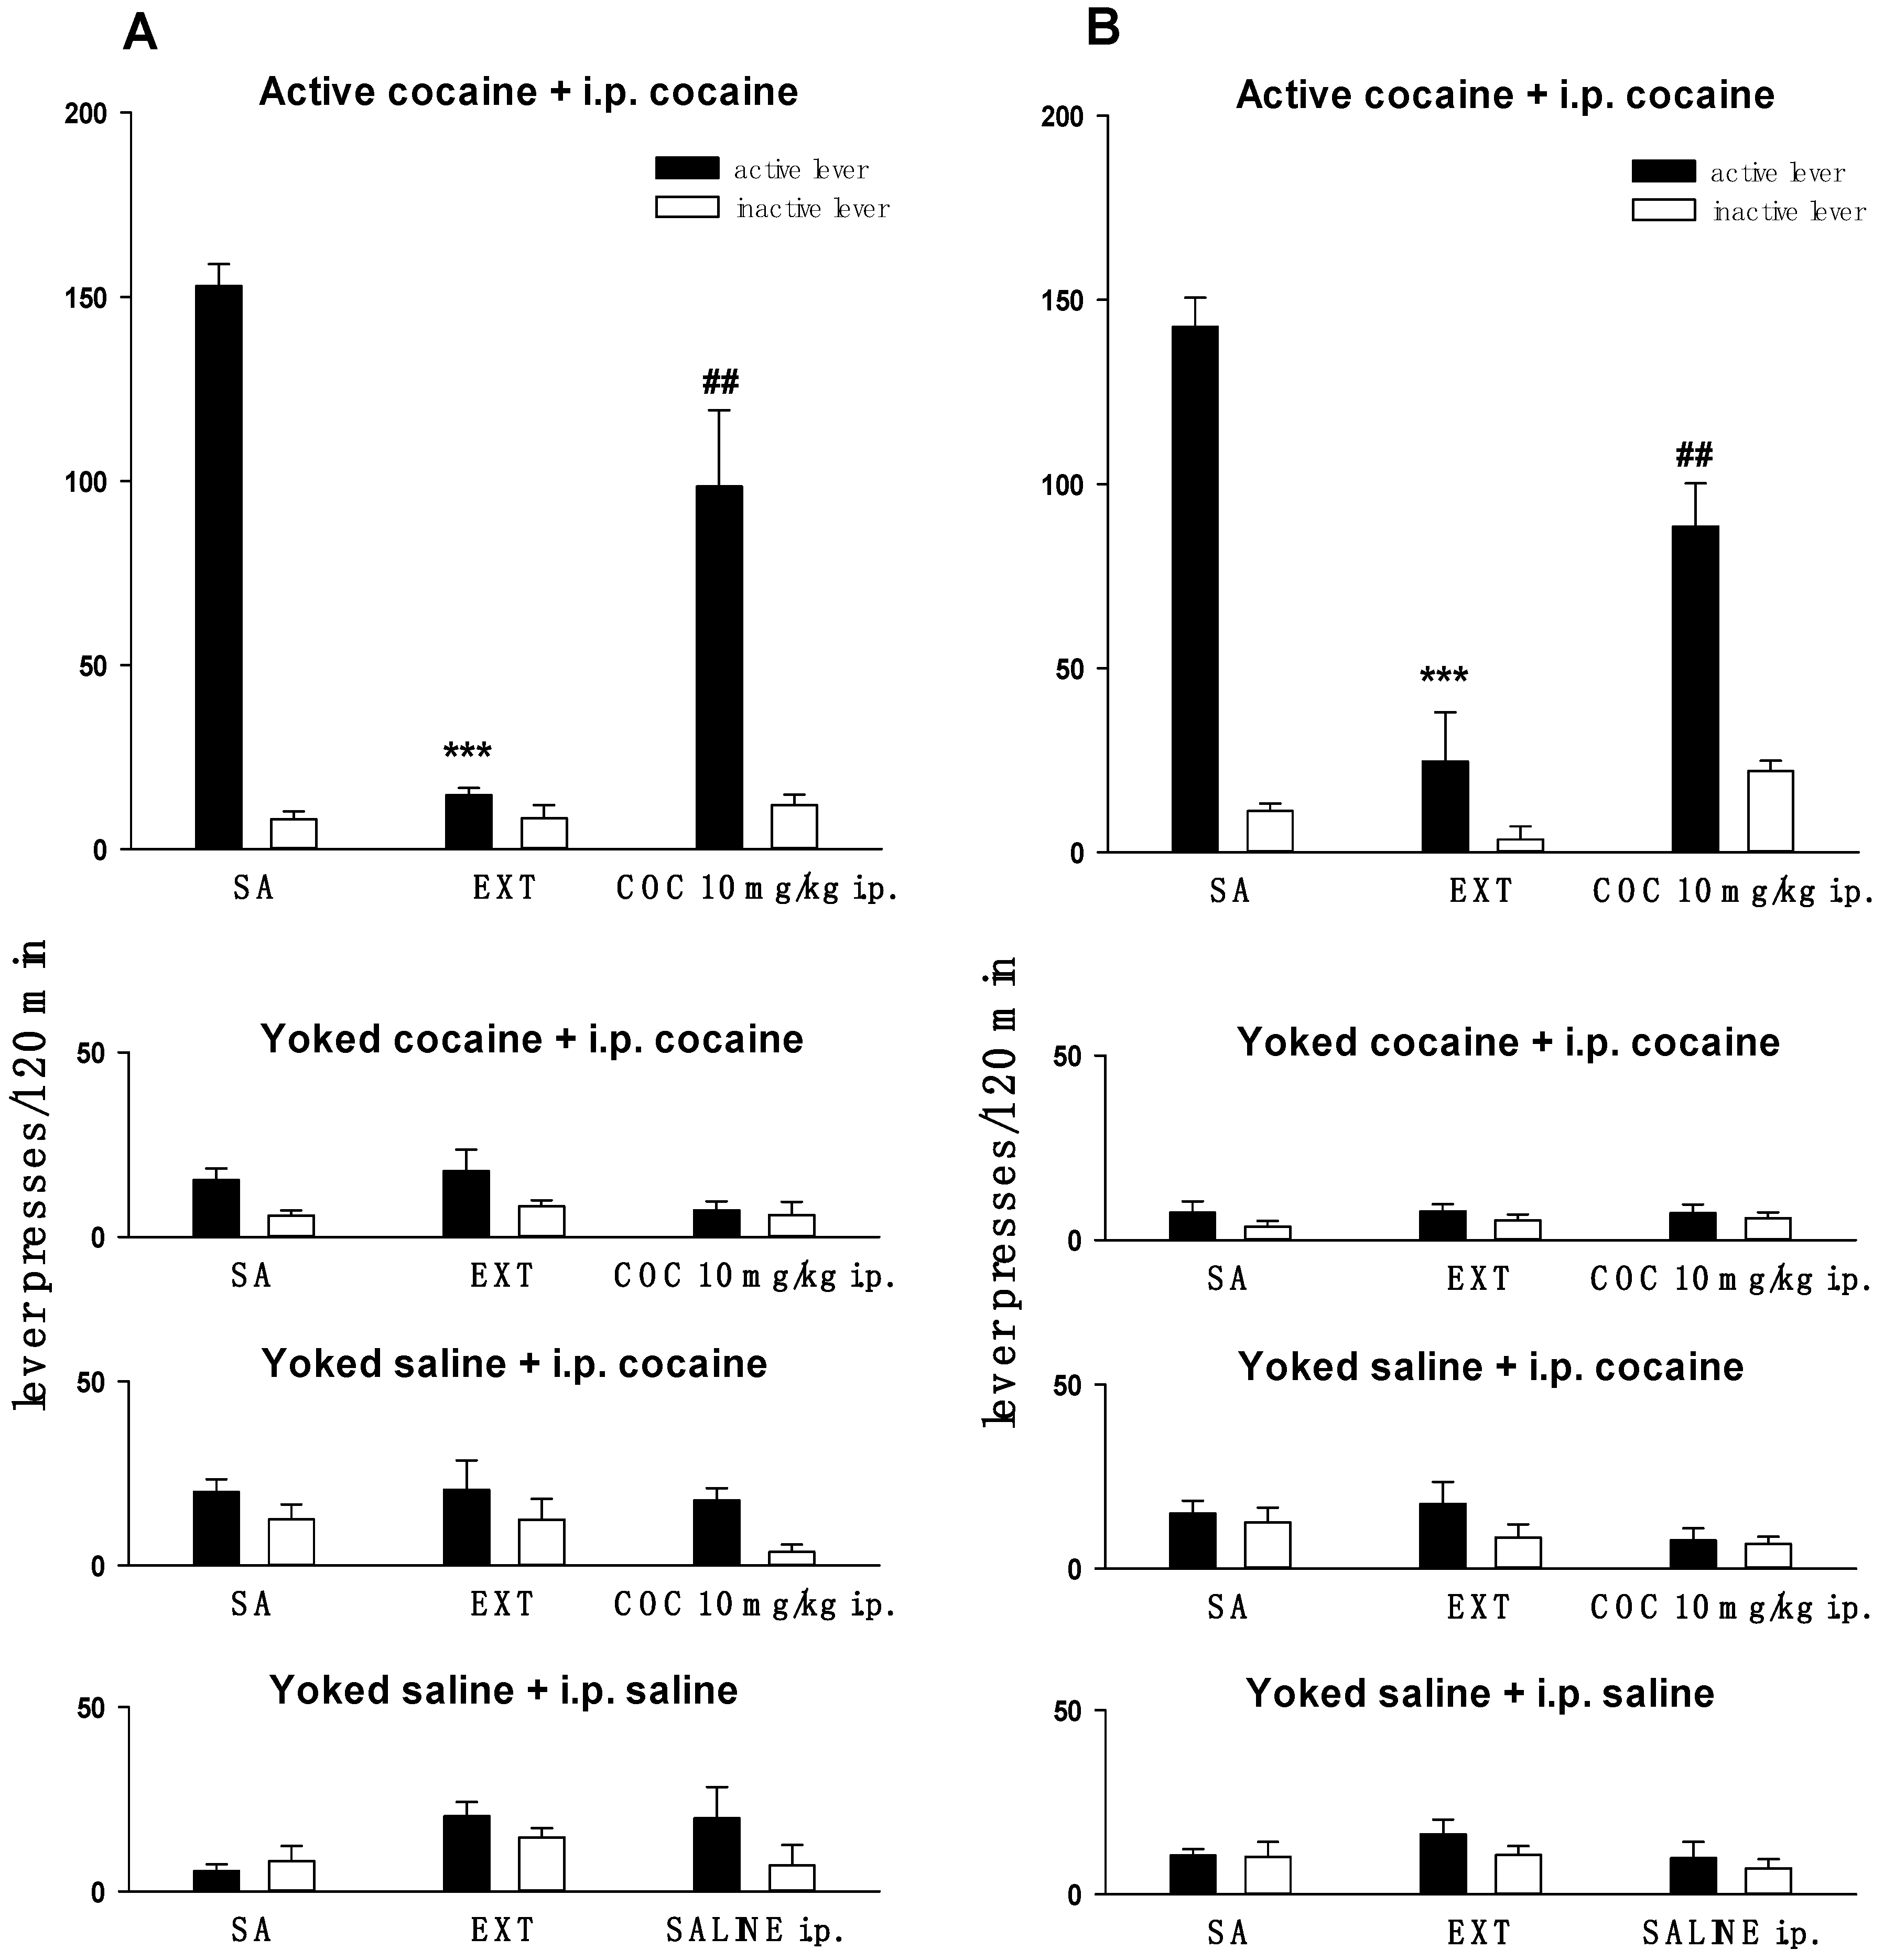
2.1. Behavioral Studies
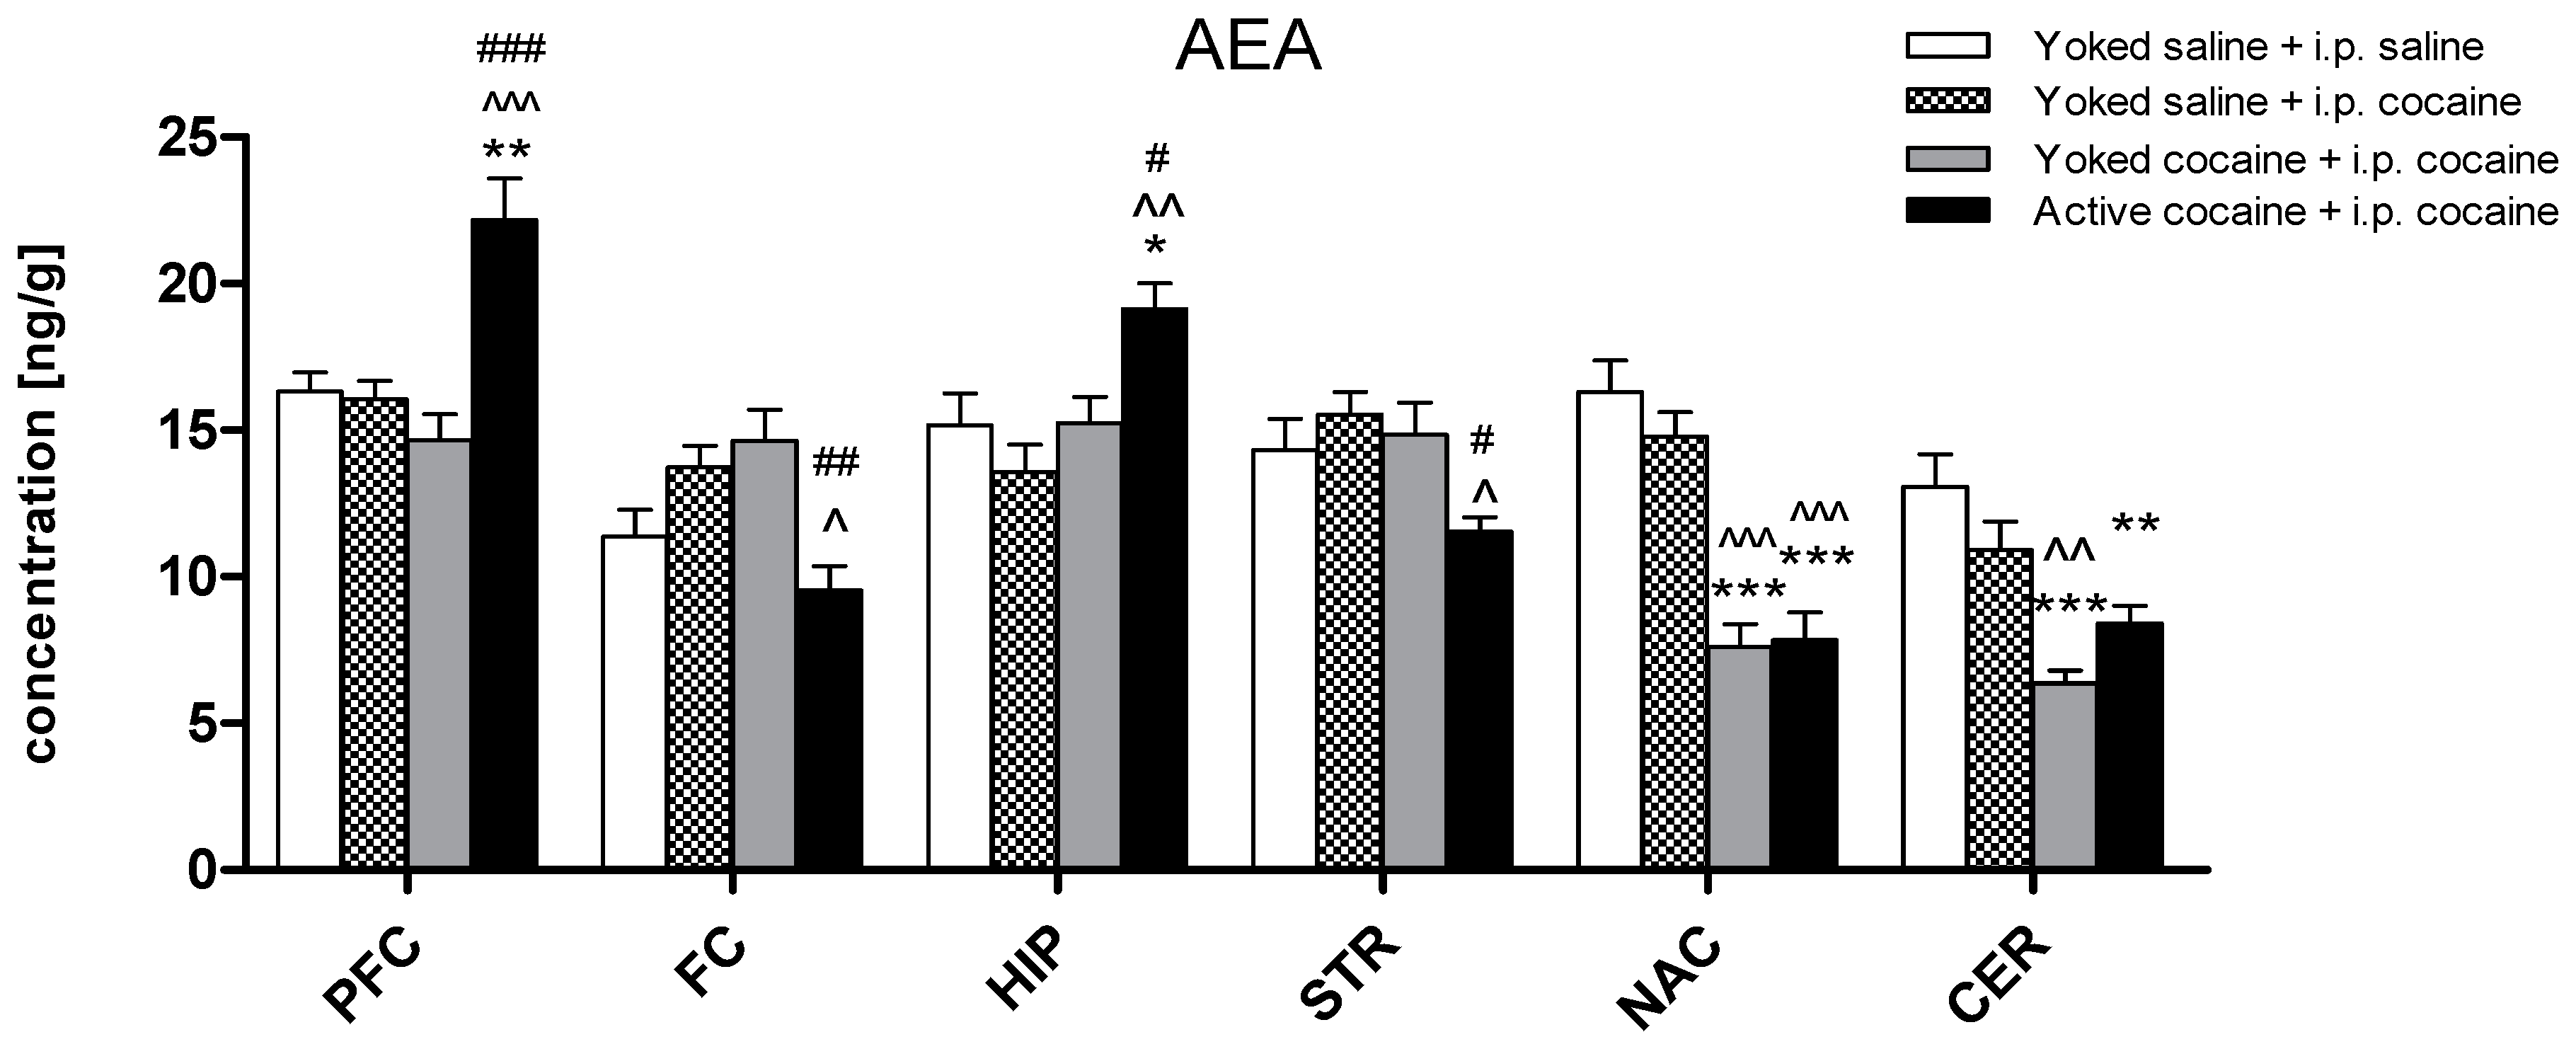
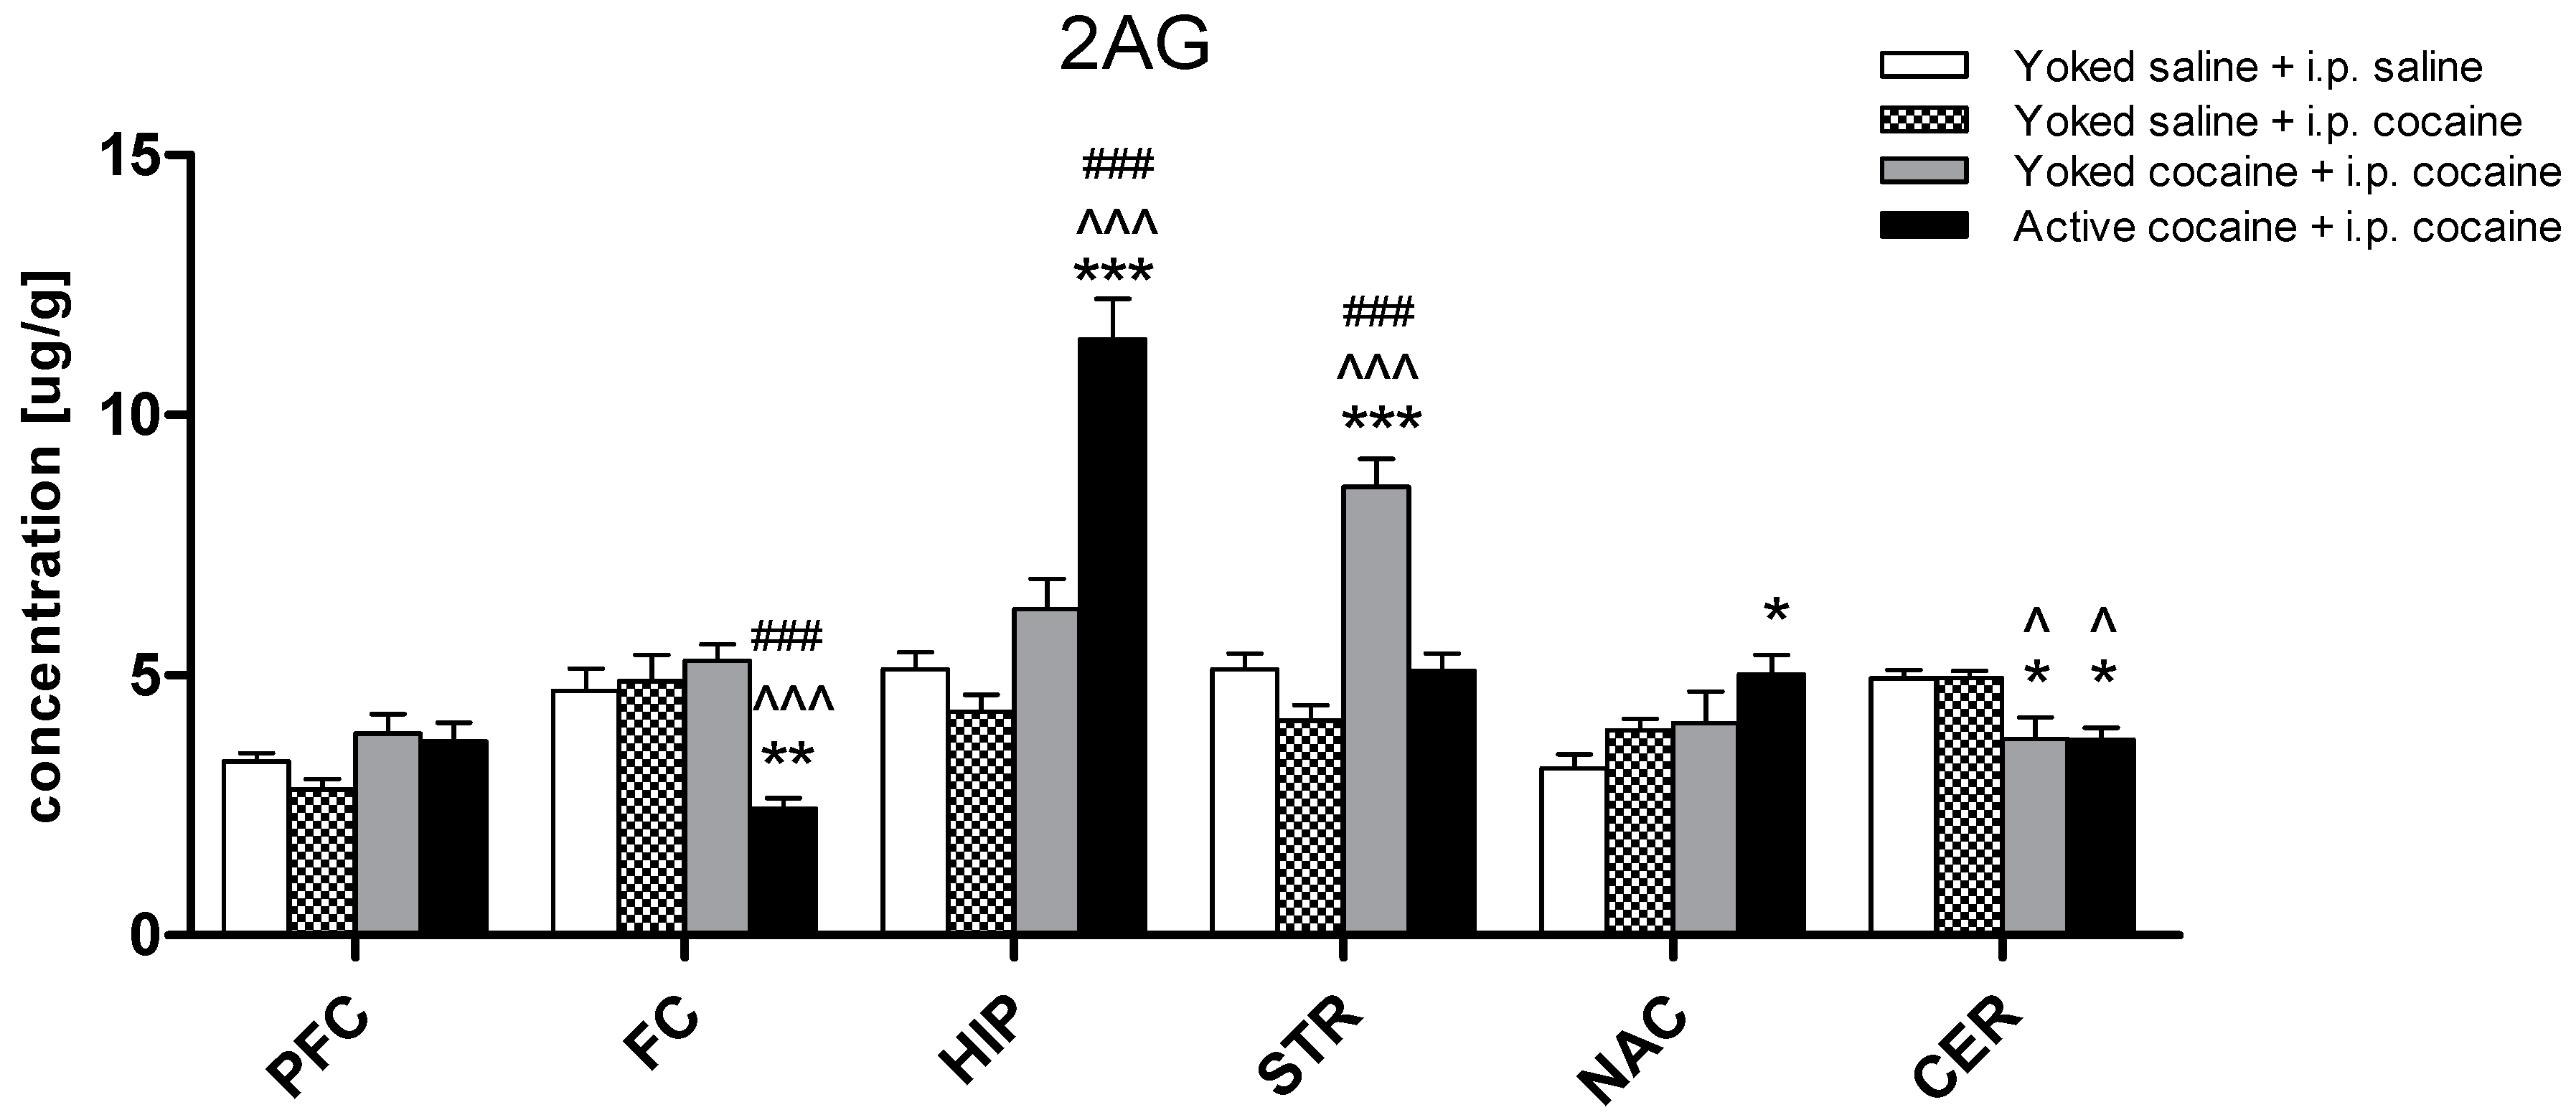
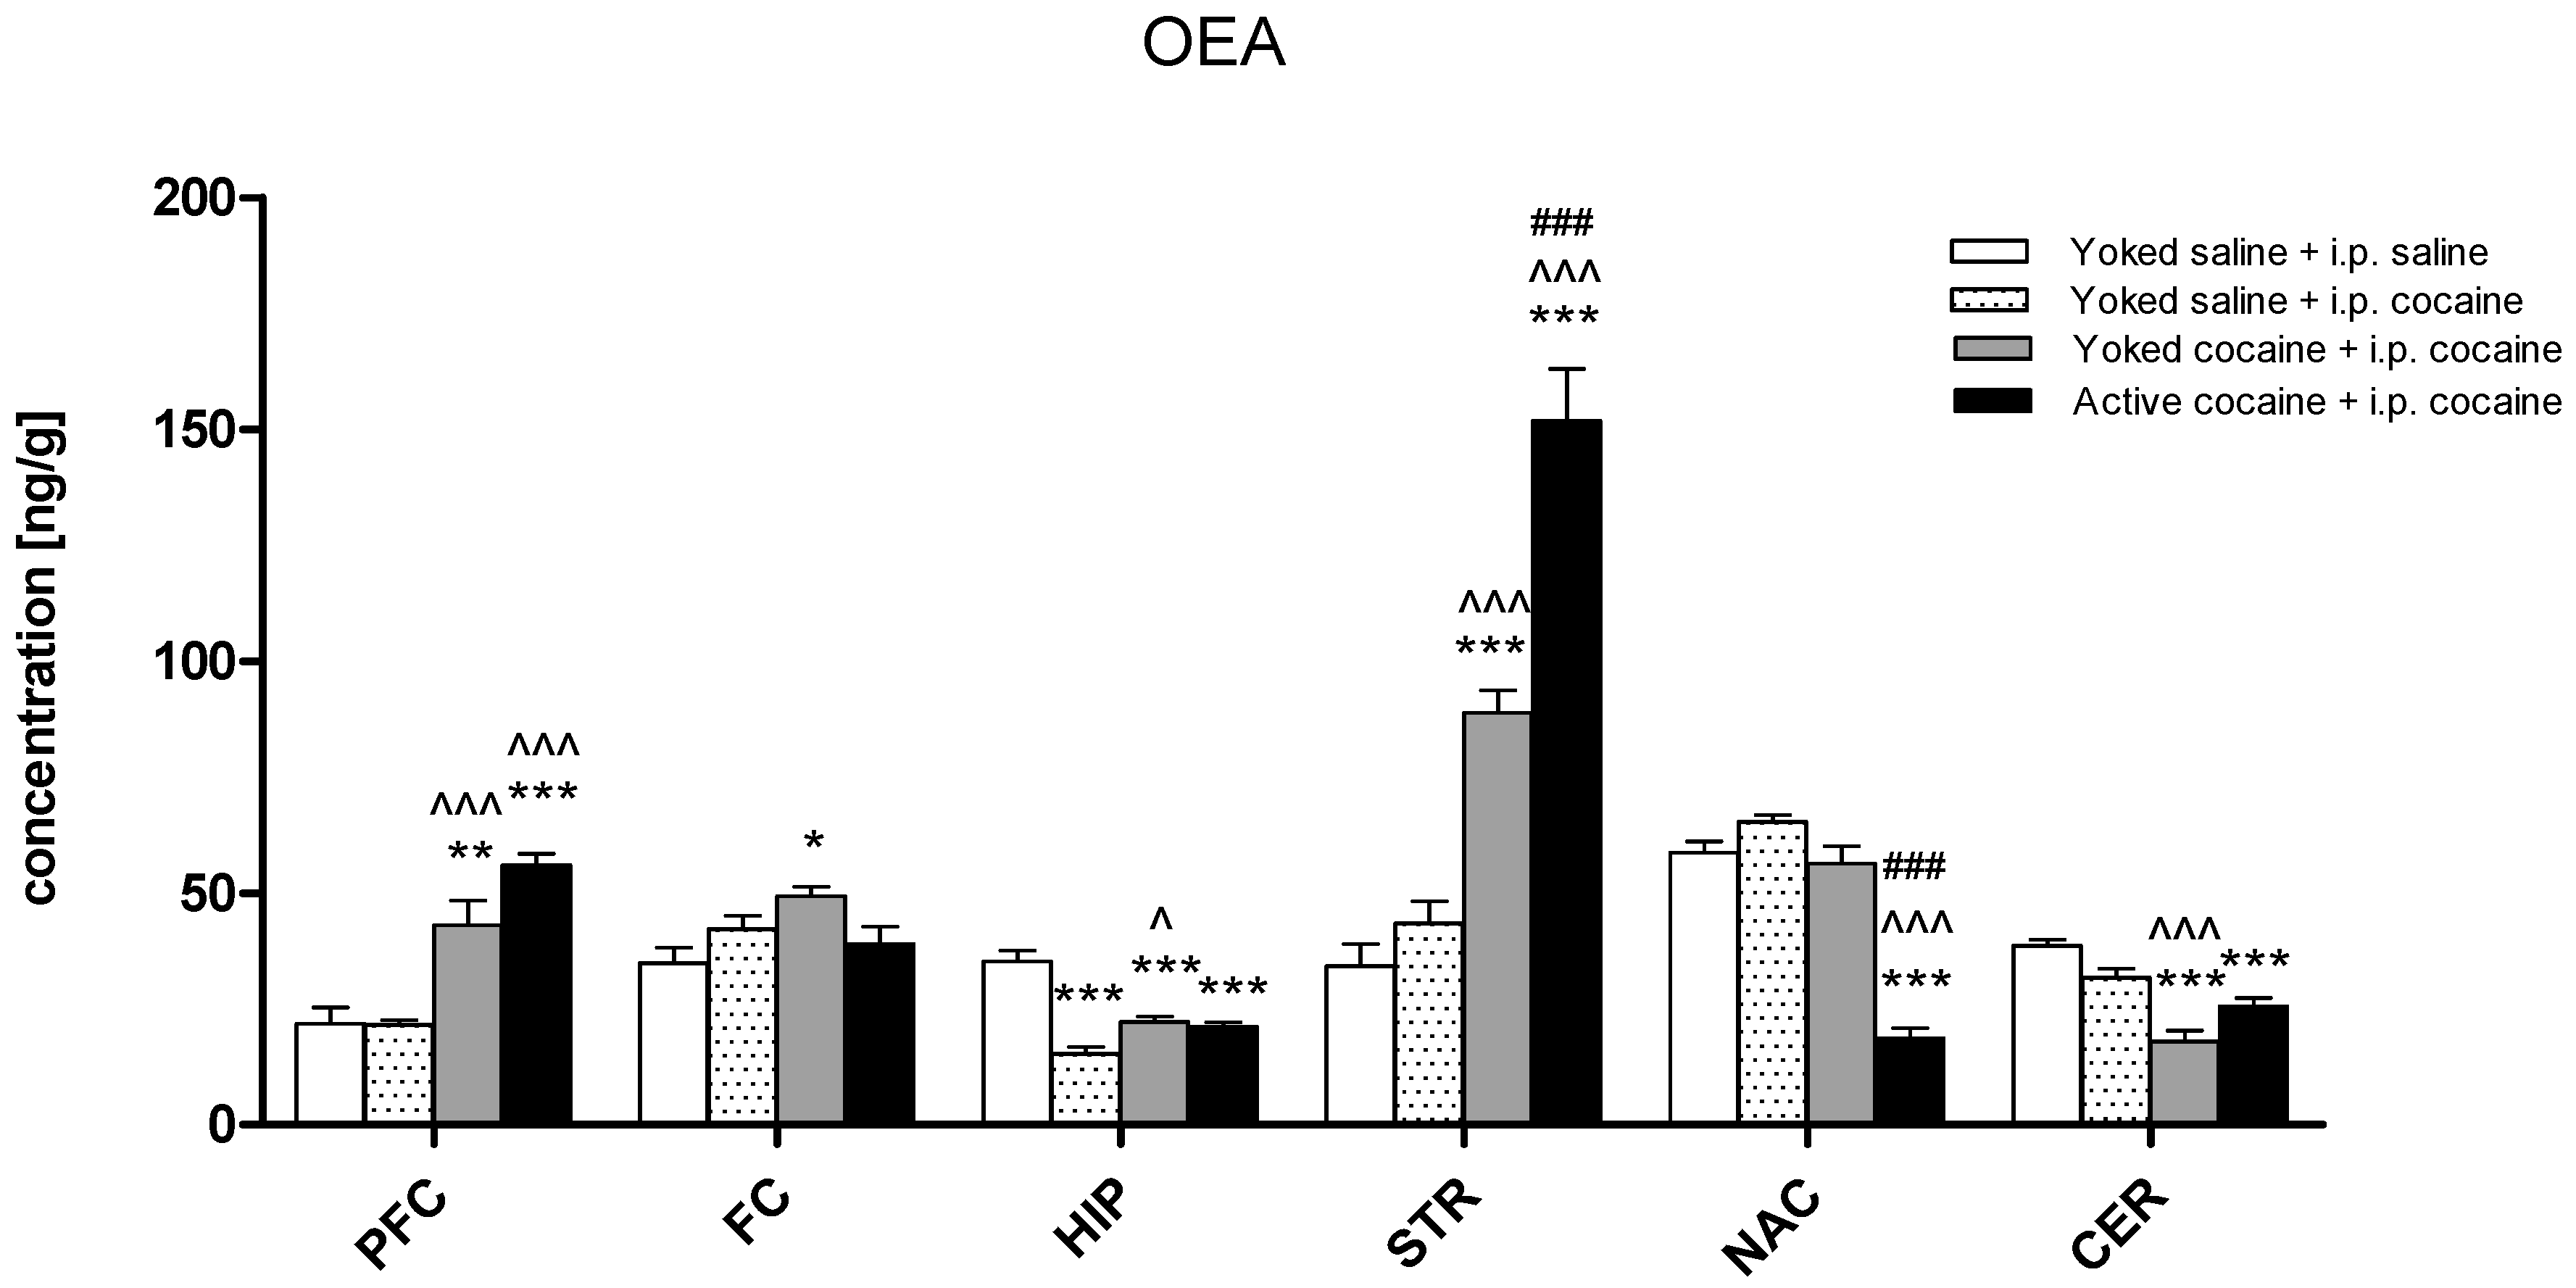
2.2. Tissue Level of Endocannabinoid and NAEs in Rat Brain Structures
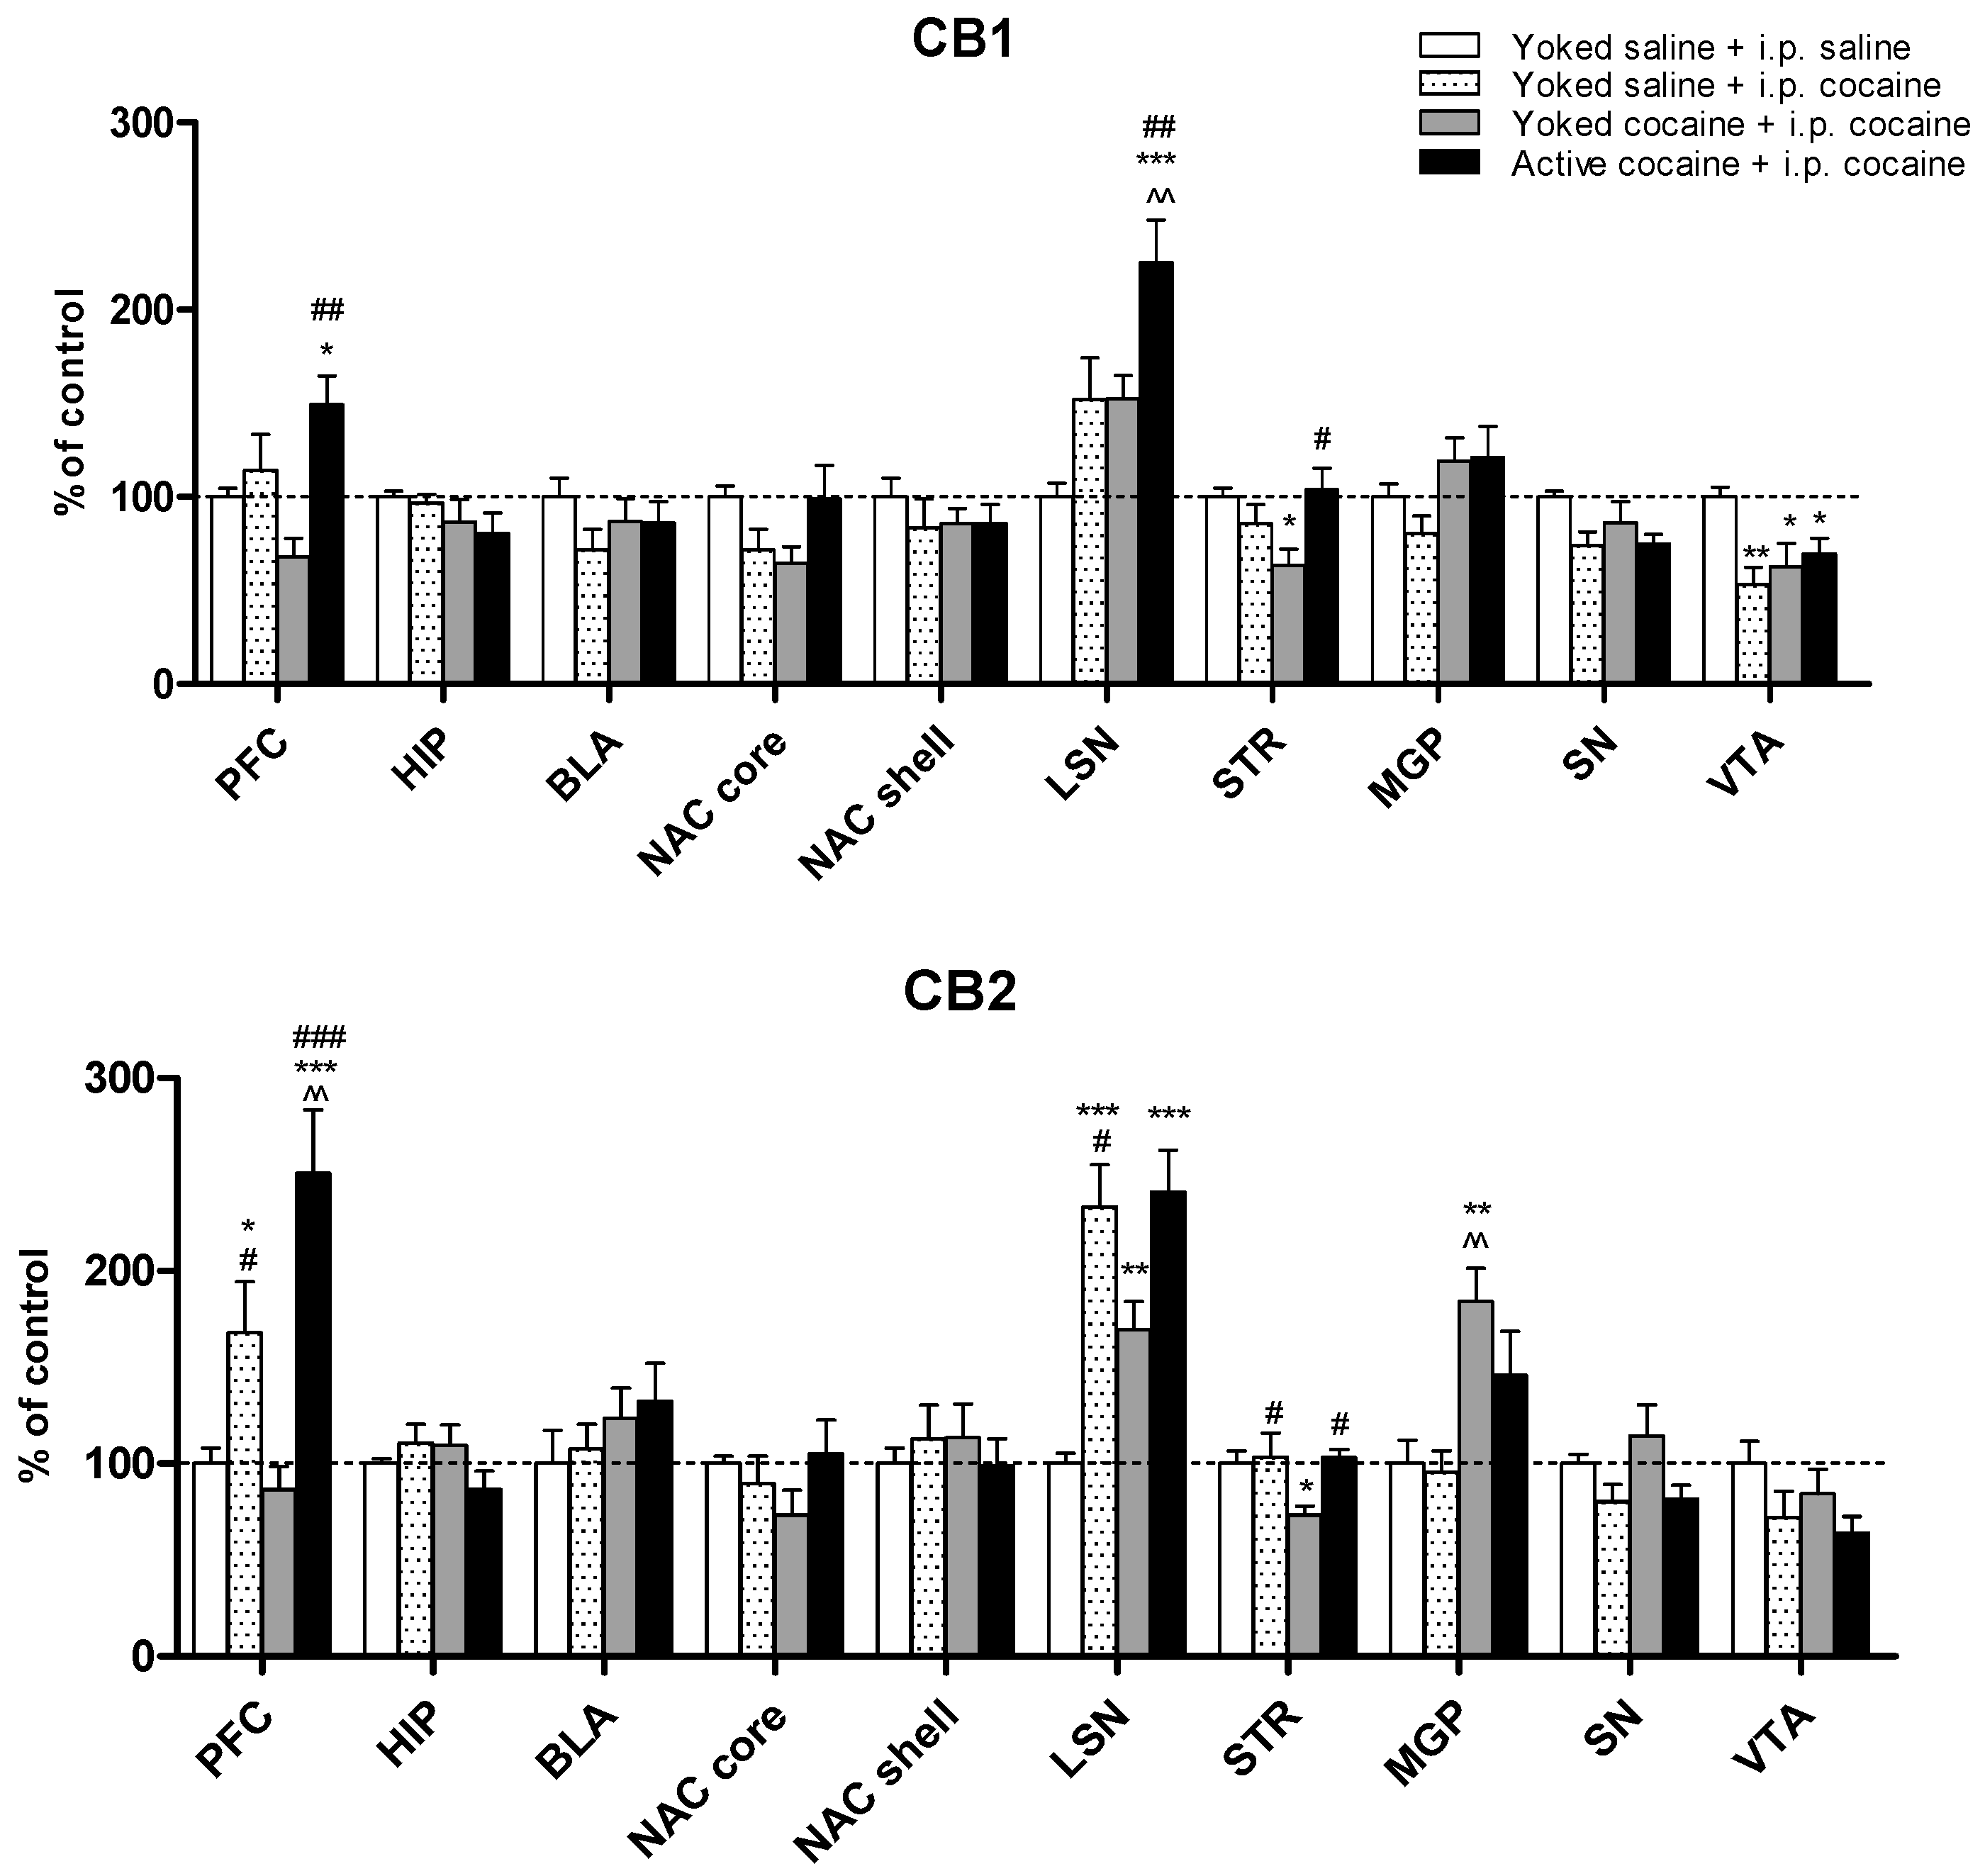
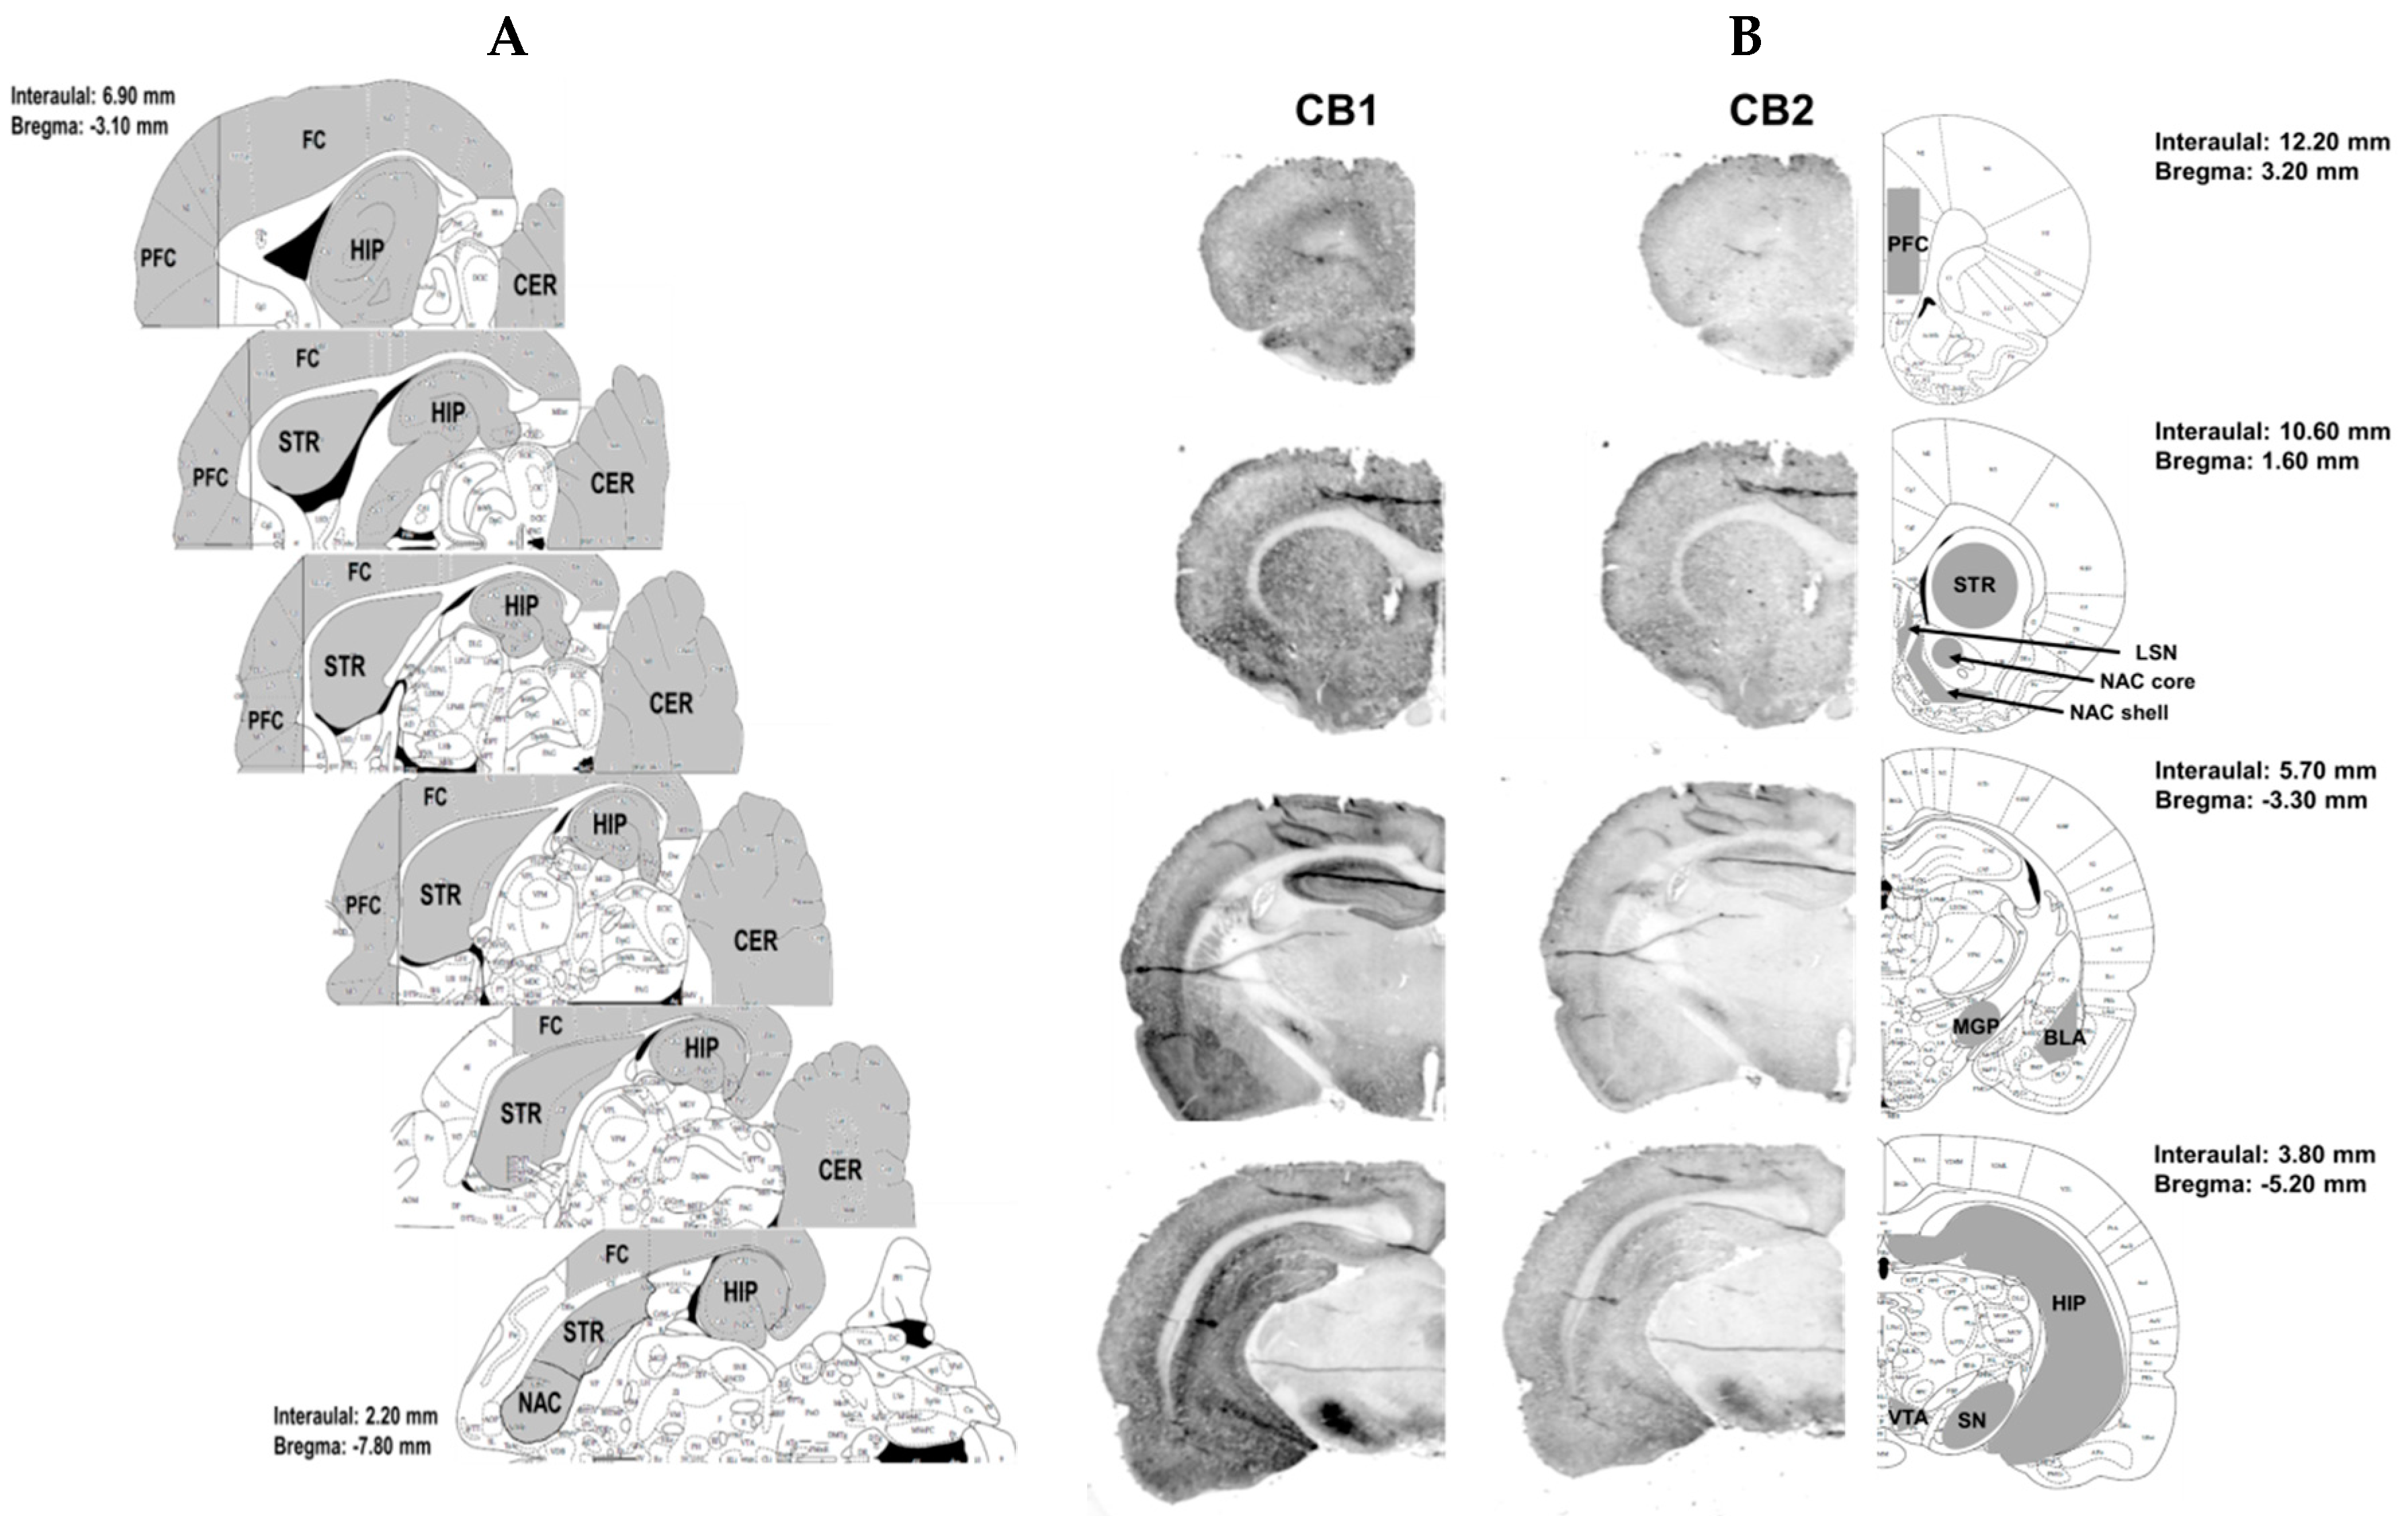
2.3. Expression of the CB1 and CB2 Receptor Protein
3. Discussion
4. Materials and Methods
4.1. Animals
4.2. Drugs
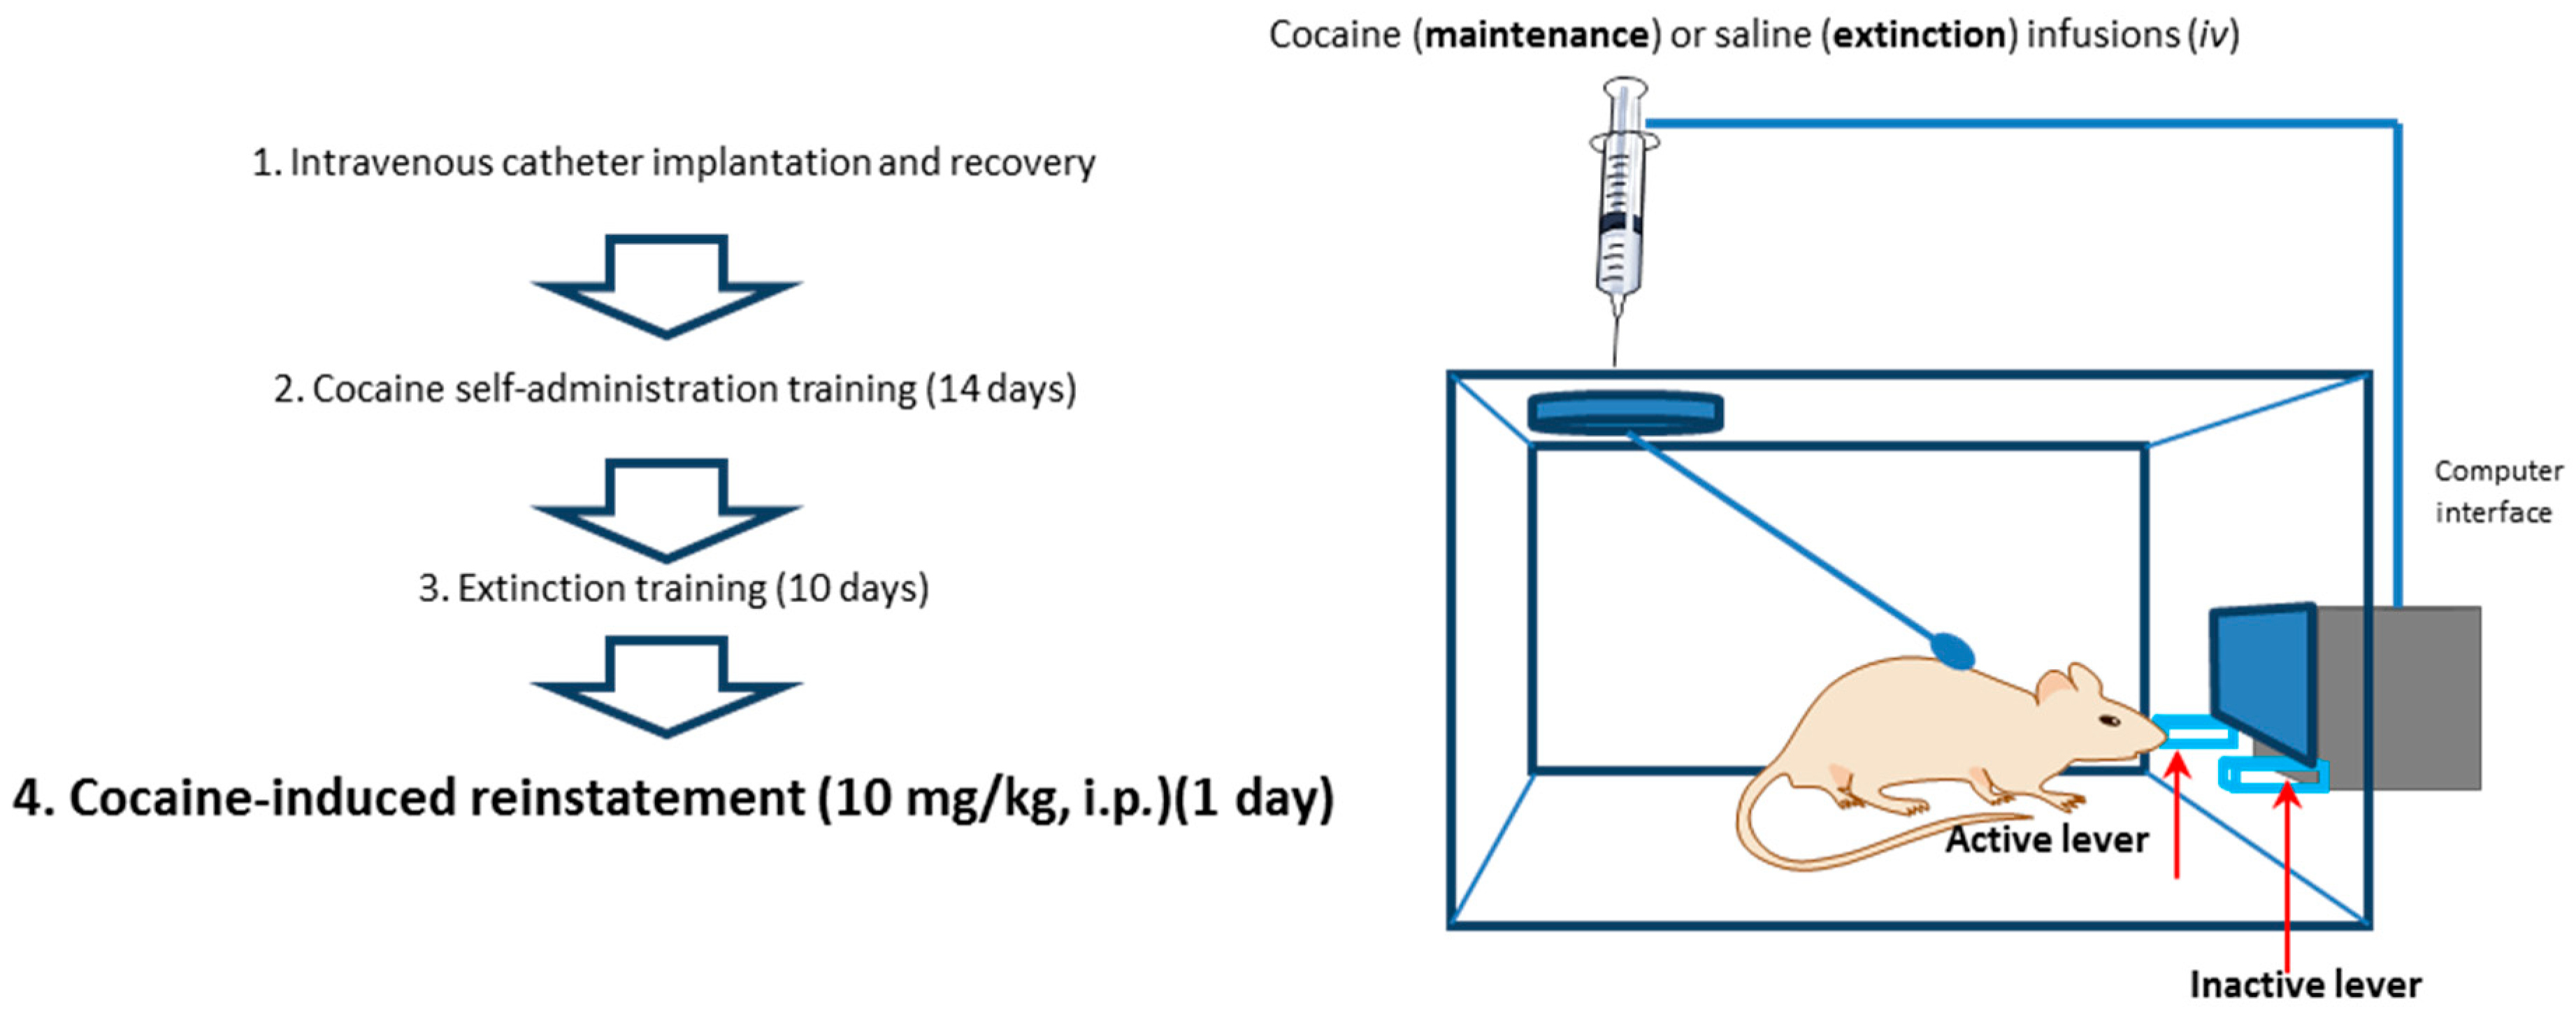
4.3. Behavioral Procedures
4.3.1. Cocaine Self-Administration, Extinction Training and Reinstatement of Drug-Seeking Behavior
4.3.2. Yoked Self-Administration Procedure
4.4. Neurochemical Analysis
4.4.1. LCMS/MS Analysis
Brain Structures Isolation and Tissue Preparation
Reagents
Lipid Extraction from Brain Tissue
Chromatographic Analysis: LC-MS/MS Conditions
4.4.2. Immunohistochemistry
Immunohistochemistry Procedure
4.5. Data Analysis
5. Conclusions
Author Contributions
Funding
Conflicts of Interest
Highlights
References
- European Monitoring Centre for Drugs and Drug Addiction. European Drug Report 2018: Trends and Developments; European Monitoring Centre for Drugs and Drug Addiction: Lisbon, Portugal, 2018; ISBN1 9789294972729. ISBN2 9294972720.
- Bystrowska, B.; Smaga, I.; Frankowska, M.; Filip, M. Changes in endocannabinoid and N-acylethanolamine levels in rat brain structures following cocaine self-administration and extinction training. Prog. Neuropsychopharmacol. Biol. Psychiatry 2014, 50, 1–10. [Google Scholar] [CrossRef] [PubMed]
- Cheer, J.F.; Wassum, K.M.; Sombers, L.A.; Heien, M.L.A.V.; Ariansen, J.L.; Aragona, B.J.; Phillips, P.E.M.; Wightman, R.M. Phasic dopamine release evoked by abused substances requires cannabinoid receptor activation. J. Neurosci. 2007, 27, 791–795. [Google Scholar] [CrossRef] [PubMed]
- Luo, A.H.; Tahsili-Fahadan, P.; Wise, R.A.; Lupica, C.R.; Aston-Jones, G. Linking context with reward: A functional circuit from hippocampal CA3 to ventral tegmental area. Science 2011, 333, 353–357. [Google Scholar] [CrossRef] [PubMed]
- Vaughn, L.K.; Mantsch, J.R.; Vranjkovic, O.; Stroh, G.; LaCourt, M.; Kreutter, M.; Hillard, C.J. Cannabinoid receptor involvement in stress-induced cocaine reinstatement: Potential interaction with noradrenergic pathways. Neuroscience 2012, 204, 117–124. [Google Scholar] [CrossRef] [PubMed]
- Panagis, G.; Mackey, B.; Vlachou, S. Cannabinoid Regulation of Brain Reward Processing with an Emphasis on the Role of CB1 Receptors: A Step Back into the Future. Front. Psychiatry 2014, 5, 92. [Google Scholar] [CrossRef] [PubMed]
- Bystrowska, B.; Frankowska, M.; Smaga, I.; Pomierny-Chamioło, L.; Filip, M. Effects of Cocaine Self-Administration and Its Extinction on the Rat Brain Cannabinoid CB1 and CB2 Receptors. Neurotox. Res. 2018, 34, 547–558. [Google Scholar] [CrossRef] [PubMed] [Green Version]
- Melis, M.; Pillolla, G.; Luchicchi, A.; Muntoni, A.L.; Yasar, S.; Goldberg, S.R.; Pistis, M. Endogenous fatty acid ethanolamides suppress nicotine-induced activation of mesolimbic dopamine neurons through nuclear receptors. J. Neurosci. 2008, 28, 13985–13994. [Google Scholar] [CrossRef] [PubMed] [Green Version]
- De Petrocellis, L.; Davis, J.B.; Di Marzo, V. Palmitoylethanolamide enhances anandamide stimulation of human vanilloid VR1 receptors. FEBS Lett. 2001, 506, 253–256. [Google Scholar] [CrossRef] [Green Version]
- Smaga, I.; Bystrowska, B.; Gawliński, D.; Przegaliński, E.; Filip, M. The endocannabinoid/endovanilloid system and depression. Curr. Neuropharmacol. 2014, 12, 462–474. [Google Scholar] [CrossRef]
- Filip, M.; Gołda, A.; Zaniewska, M.; McCreary, A.C.; Nowak, E.; Kolasiewicz, W.; Przegaliński, E. Involvement of cannabinoid CB1 receptors in drug addiction: Effects of rimonabant on behavioral responses induced by cocaine. Pharmacol. Rep. 2006, 58, 806–819. [Google Scholar]
- De Vries, T.J.; Shaham, Y.; Homberg, J.R.; Crombag, H.; Schuurman, K.; Dieben, J.; Vanderschuren, L.J.; Schoffelmeer, A.N. A cannabinoid mechanism in relapse to cocaine seeking. Nat. Med. 2001, 7, 1151–1154. [Google Scholar] [CrossRef] [PubMed] [Green Version]
- Xi, Z.-X.; Gilbert, J.G.; Peng, X.-Q.; Pak, A.C.; Li, X.; Gardner, E.L. Cannabinoid CB1 receptor antagonist AM251 inhibits cocaine-primed relapse in rats: Role of glutamate in the nucleus accumbens. J. Neurosci. 2006, 26, 8531–8536. [Google Scholar] [CrossRef] [PubMed]
- Pomierny-Chamiolo, L.; Miszkiel, J.; Frankowska, M.; Pomierny, B.; Niedzielska, E.; Smaga, I.; Fumagalli, F.; Filip, M. Withdrawal from cocaine self-administration and yoked cocaine delivery dysregulates glutamatergic mGlu5 and NMDA receptors in the rat brain. Neurotox. Res. 2015, 27, 246–258. [Google Scholar] [CrossRef] [PubMed]
- Koob, G.F.; Buck, C.L.; Cohen, A.; Edwards, S.; Park, P.E.; Schlosburg, J.E.; Schmeichel, B.; Vendruscolo, L.F.; Wade, C.L.; Whitfield, T.W.; et al. Addiction as a stress surfeit disorder. Neuropharmacology 2014, 76 Pt B, 370–382. [Google Scholar] [CrossRef] [Green Version]
- Wise, R.A. Roles for nigrostriatal—not just mesocorticolimbic—dopamine in reward and addiction. Trends Neurosci. 2009, 32, 517–524. [Google Scholar] [CrossRef] [PubMed]
- Lupica, C.R.; Hu, Y.; Devinsky, O.; Hoffman, A.F. Cannabinoids as hippocampal network administrators. Neuropharmacology 2017, 124, 25–37. [Google Scholar] [CrossRef] [PubMed]
- Wang, H.; Treadway, T.; Covey, D.P.; Cheer, J.F.; Lupica, C.R. Cocaine-Induced Endocannabinoid Mobilization in the Ventral Tegmental Area. Cell Rep. 2015, 12, 1997–2008. [Google Scholar] [CrossRef] [PubMed] [Green Version]
- Adamczyk, P.; McCreary, A.C.; Przegalinski, E.; Mierzejewski, P.; Bienkowski, P.; Filip, M. The effects of fatty acid amide hydrolase inhibitors on maintenance of cocaine and food self-administration and on reinstatement of cocaine-seeking and food-taking behavior in rats. J. Physiol. Pharmacol. 2009, 60, 119–125. [Google Scholar] [PubMed]
- Adamczyk, P.; Miszkiel, J.; McCreary, A.C.; Filip, M.; Papp, M.; Przegaliński, E. The effects of cannabinoid CB1, CB2 and vanilloid TRPV1 receptor antagonists on cocaine addictive behavior in rats. Brain Res. 2012, 1444, 45–54. [Google Scholar] [CrossRef]
- Vilela, L.R.; Gobira, P.H.; Viana, T.G.; Medeiros, D.C.; Ferreira-Vieira, T.H.; Doria, J.G.; Rodrigues, F.; Aguiar, D.C.; Pereira, G.S.; Massessini, A.R.; et al. Enhancement of endocannabinoid signaling protects against cocaine-induced neurotoxicity. Toxicol. Appl. Pharmacol. 2015, 286, 178–187. [Google Scholar] [CrossRef] [Green Version]
- Worley, N.B.; Hill, M.N.; Christianson, J.P. Prefrontal endocannabinoids, stress controllability and resilience: A hypothesis. Prog. Neuropsychopharmacol. Biol. Psychiatry 2018, 85, 180–188. [Google Scholar] [CrossRef] [PubMed]
- Roberts, C.J.; Stuhr, K.L.; Hillard, C.J. Swim stress differentially affects limbic contents of 2-arachidonoylglycerol and 2-oleoylglycerol. Neuroscience 2012, 204, 74–82. [Google Scholar] [CrossRef] [PubMed] [Green Version]
- Oleson, E.B.; Beckert, M.V.; Morra, J.T.; Lansink, C.S.; Cachope, R.; Abdullah, R.A.; Loriaux, A.L.; Schetters, D.; Pattij, T.; Roitman, M.F.; et al. Endocannabinoids shape accumbal encoding of cue-motivated behavior via CB1 receptor activation in the ventral tegmentum. Neuron 2012, 73, 360–373. [Google Scholar] [CrossRef] [PubMed] [Green Version]
- Inada, H.; Maejima, T.; Nakahata, Y.; Yamaguchi, J.; Nabekura, J.; Ishibashi, H. Endocannabinoids contribute to metabotropic glutamate receptor-mediated inhibition of GABA release onto hippocampal CA3 pyramidal neurons in an isolated neuron/bouton preparation. Neuroscience 2010, 165, 1377–1389. [Google Scholar] [CrossRef] [PubMed]
- Andó, R.D.; Bíró, J.; Csölle, C.; Ledent, C.; Sperlágh, B. The inhibitory action of exo- and endocannabinoids on [3H]GABA release are mediated by both CB₁ and CB₂ receptors in the mouse hippocampus. Neurochem. Int. 2012, 60, 145–152. [Google Scholar] [CrossRef] [PubMed]
- Micale, V.; Drago, F. Endocannabinoid system, stress and HPA axis. Eur. J. Pharmacol. 2018, 834, 230–239. [Google Scholar] [CrossRef] [PubMed]
- Luchicchi, A.; Lecca, S.; Carta, S.; Pillolla, G.; Muntoni, A.L.; Yasar, S.; Goldberg, S.R.; Pistis, M. Effects of fatty acid amide hydrolase inhibition on neuronal responses to nicotine, cocaine and morphine in the nucleus accumbens shell and ventral tegmental area: Involvement of PPAR-alpha nuclear receptors. Addict. Biol. 2010, 15, 277–288. [Google Scholar] [CrossRef] [PubMed]
- Zambrana-Infantes, E.; Rosell Del Valle, C.; Ladrón de Guevara-Miranda, D.; Galeano, P.; Castilla-Ortega, E.; Rodríguez De Fonseca, F.; Blanco, E.; Santín, L.J. Palmitoylethanolamide attenuates cocaine-induced behavioral sensitization and conditioned place preference in mice. Pharmacol. Biochem. Behav. 2018, 166, 1–12. [Google Scholar] [CrossRef]
- Bilbao, A.; Blanco, E.; Luque-Rojas, M.J.; Suárez, J.; Palomino, A.; Vida, M.; Araos, P.; Bermúdez-Silva, F.J.; Fernández-Espejo, E.; Spanagel, R.; et al. Oleoylethanolamide dose-dependently attenuates cocaine-induced behaviours through a PPARα receptor-independent mechanism. Addict. Biol. 2013, 18, 78–87. [Google Scholar] [CrossRef]
- Frankowska, M.; Gołda, A.; Wydra, K.; Gruca, P.; Papp, M.; Filip, M. Effects of imipramine or GABAB receptor ligands on the immobility, swimming and climbing in the forced swim test in rats following discontinuation of cocaine self-administration. Eur. J. Pharmacol. 2010, 627, 142–149. [Google Scholar] [CrossRef]
- Filip, M. Role of serotonin (5-HT)2 receptors in cocaine self-administration and seeking behavior in rats. Pharmacol Rep 2005, 57, 35–46. [Google Scholar] [PubMed]
- Frankowska, M.; Wydra, K.; Faron-Górecka, A.; Zaniewska, M.; Kuśmider, M.; Dziedzicka-Wasylewska, M.; Filip, M. Neuroadaptive changes in the rat brain GABA(B) receptors after withdrawal from cocaine self-administration. Eur. J. Pharmacol. 2008, 599, 58–64. [Google Scholar] [CrossRef] [PubMed]
- Paxinos, G.; Watson, C. The Rat Brain in Stereotaxic Coordinates; Elsevier: Amsterdam, The Netherlands; Boston, MA, USA, 2007; ISBN 978-0-08-047513-4. [Google Scholar]
- Spijker, S. Dissection of Rodent Brain Regions. In Neuroproteomics; Li, K.W., Ed.; Humana Press: Totowa, NJ, USA, 2011; Volume 57, pp. 13–26. ISBN 978-1-61779-110-9. [Google Scholar]
- Bystrowska, B.; Smaga, I.; Tyszka-Czochara, M.; Filip, M. Troubleshooting in LC-MS/MS method for determining endocannabinoid and endocannabinoid-like molecules in rat brain structures applied to assessing the brain endocannabinoid/endovanilloid system significance. Toxicol. Mech. Methods 2014, 24, 315–322. [Google Scholar] [CrossRef] [PubMed]
- Svízenská, I.H.; Brázda, V.; Klusáková, I.; Dubový, P. Bilateral changes of cannabinoid receptor type 2 protein and mRNA in the dorsal root ganglia of a rat neuropathic pain model. J. Histochem. Cytochem. 2013, 61, 529–547. [Google Scholar] [CrossRef]
Sample Availability: Not available. |


| Brain Structure | AEA | 2-AG | OEA | PEA | CB1 | CB2 | ||||||||||||
|---|---|---|---|---|---|---|---|---|---|---|---|---|---|---|---|---|---|---|
| A | Y | YS | A | Y | YS | A | Y | YS | A | Y | YS | A | Y | YS | A | Y | YS | |
| PFC | ↑ | -- | -- | -- | -- | -- | ↑ | ↑ | -- | ↑ | -- | -- | ↑ | -- | -- | ↑ | -- | ↑ |
| FC | -- | -- | -- | ↓ | -- | -- | -- | ↑ | -- | -- | ↑ | -- | -- | -- | -- | -- | -- | -- |
| HIP | ↑ | -- | -- | ↑ | -- | -- | ↓ | ↓ | ↓ | ↑ | -- | -- | -- | -- | -- | -- | -- | -- |
| BLA | n/a | -- | -- | -- | -- | -- | -- | |||||||||||
| NAC core | ↓ | ↓ | -- | ↑ | -- | -- | ↓ | -- | -- | ↓ | -- | -- | -- | -- | -- | -- | -- | -- |
| NAC shell | -- | -- | -- | -- | -- | -- | ||||||||||||
| LSN | n/a | ↑ | -- | -- | ↑ | ↑ | ↑ | |||||||||||
| STR | -- | -- | -- | -- | ↑ | -- | ↑ | ↑ | -- | ↑ | ↑ | -- | -- | ↓ | -- | -- | ↓ | -- |
| MGP | n/a | -- | -- | -- | -- | ↑ | -- | |||||||||||
| SN | -- | -- | -- | -- | -- | -- | ||||||||||||
| VTA | ↓ | ↓ | ↓ | -- | -- | -- | ||||||||||||
| CER | ↓ | ↓ | -- | ↓ | ↓ | -- | ↓ | ↓ | -- | ↓ | ↓ | -- | n/a | |||||
© 2019 by the authors. Licensee MDPI, Basel, Switzerland. This article is an open access article distributed under the terms and conditions of the Creative Commons Attribution (CC BY) license (http://creativecommons.org/licenses/by/4.0/).
Share and Cite
Bystrowska, B.; Frankowska, M.; Smaga, I.; Niedzielska-Andres, E.; Pomierny-Chamioło, L.; Filip, M. Cocaine-Induced Reinstatement of Cocaine Seeking Provokes Changes in the Endocannabinoid and N-Acylethanolamine Levels in Rat Brain Structures. Molecules 2019, 24, 1125. https://doi.org/10.3390/molecules24061125
Bystrowska B, Frankowska M, Smaga I, Niedzielska-Andres E, Pomierny-Chamioło L, Filip M. Cocaine-Induced Reinstatement of Cocaine Seeking Provokes Changes in the Endocannabinoid and N-Acylethanolamine Levels in Rat Brain Structures. Molecules. 2019; 24(6):1125. https://doi.org/10.3390/molecules24061125
Chicago/Turabian StyleBystrowska, Beata, Małgorzata Frankowska, Irena Smaga, Ewa Niedzielska-Andres, Lucyna Pomierny-Chamioło, and Małgorzata Filip. 2019. "Cocaine-Induced Reinstatement of Cocaine Seeking Provokes Changes in the Endocannabinoid and N-Acylethanolamine Levels in Rat Brain Structures" Molecules 24, no. 6: 1125. https://doi.org/10.3390/molecules24061125
APA StyleBystrowska, B., Frankowska, M., Smaga, I., Niedzielska-Andres, E., Pomierny-Chamioło, L., & Filip, M. (2019). Cocaine-Induced Reinstatement of Cocaine Seeking Provokes Changes in the Endocannabinoid and N-Acylethanolamine Levels in Rat Brain Structures. Molecules, 24(6), 1125. https://doi.org/10.3390/molecules24061125