Ultrasonic Generation of Pulsatile and Sequential Therapeutic Delivery Profiles from Calcium-Crosslinked Alginate Hydrogels

Abstract
1. Introduction
2. Results
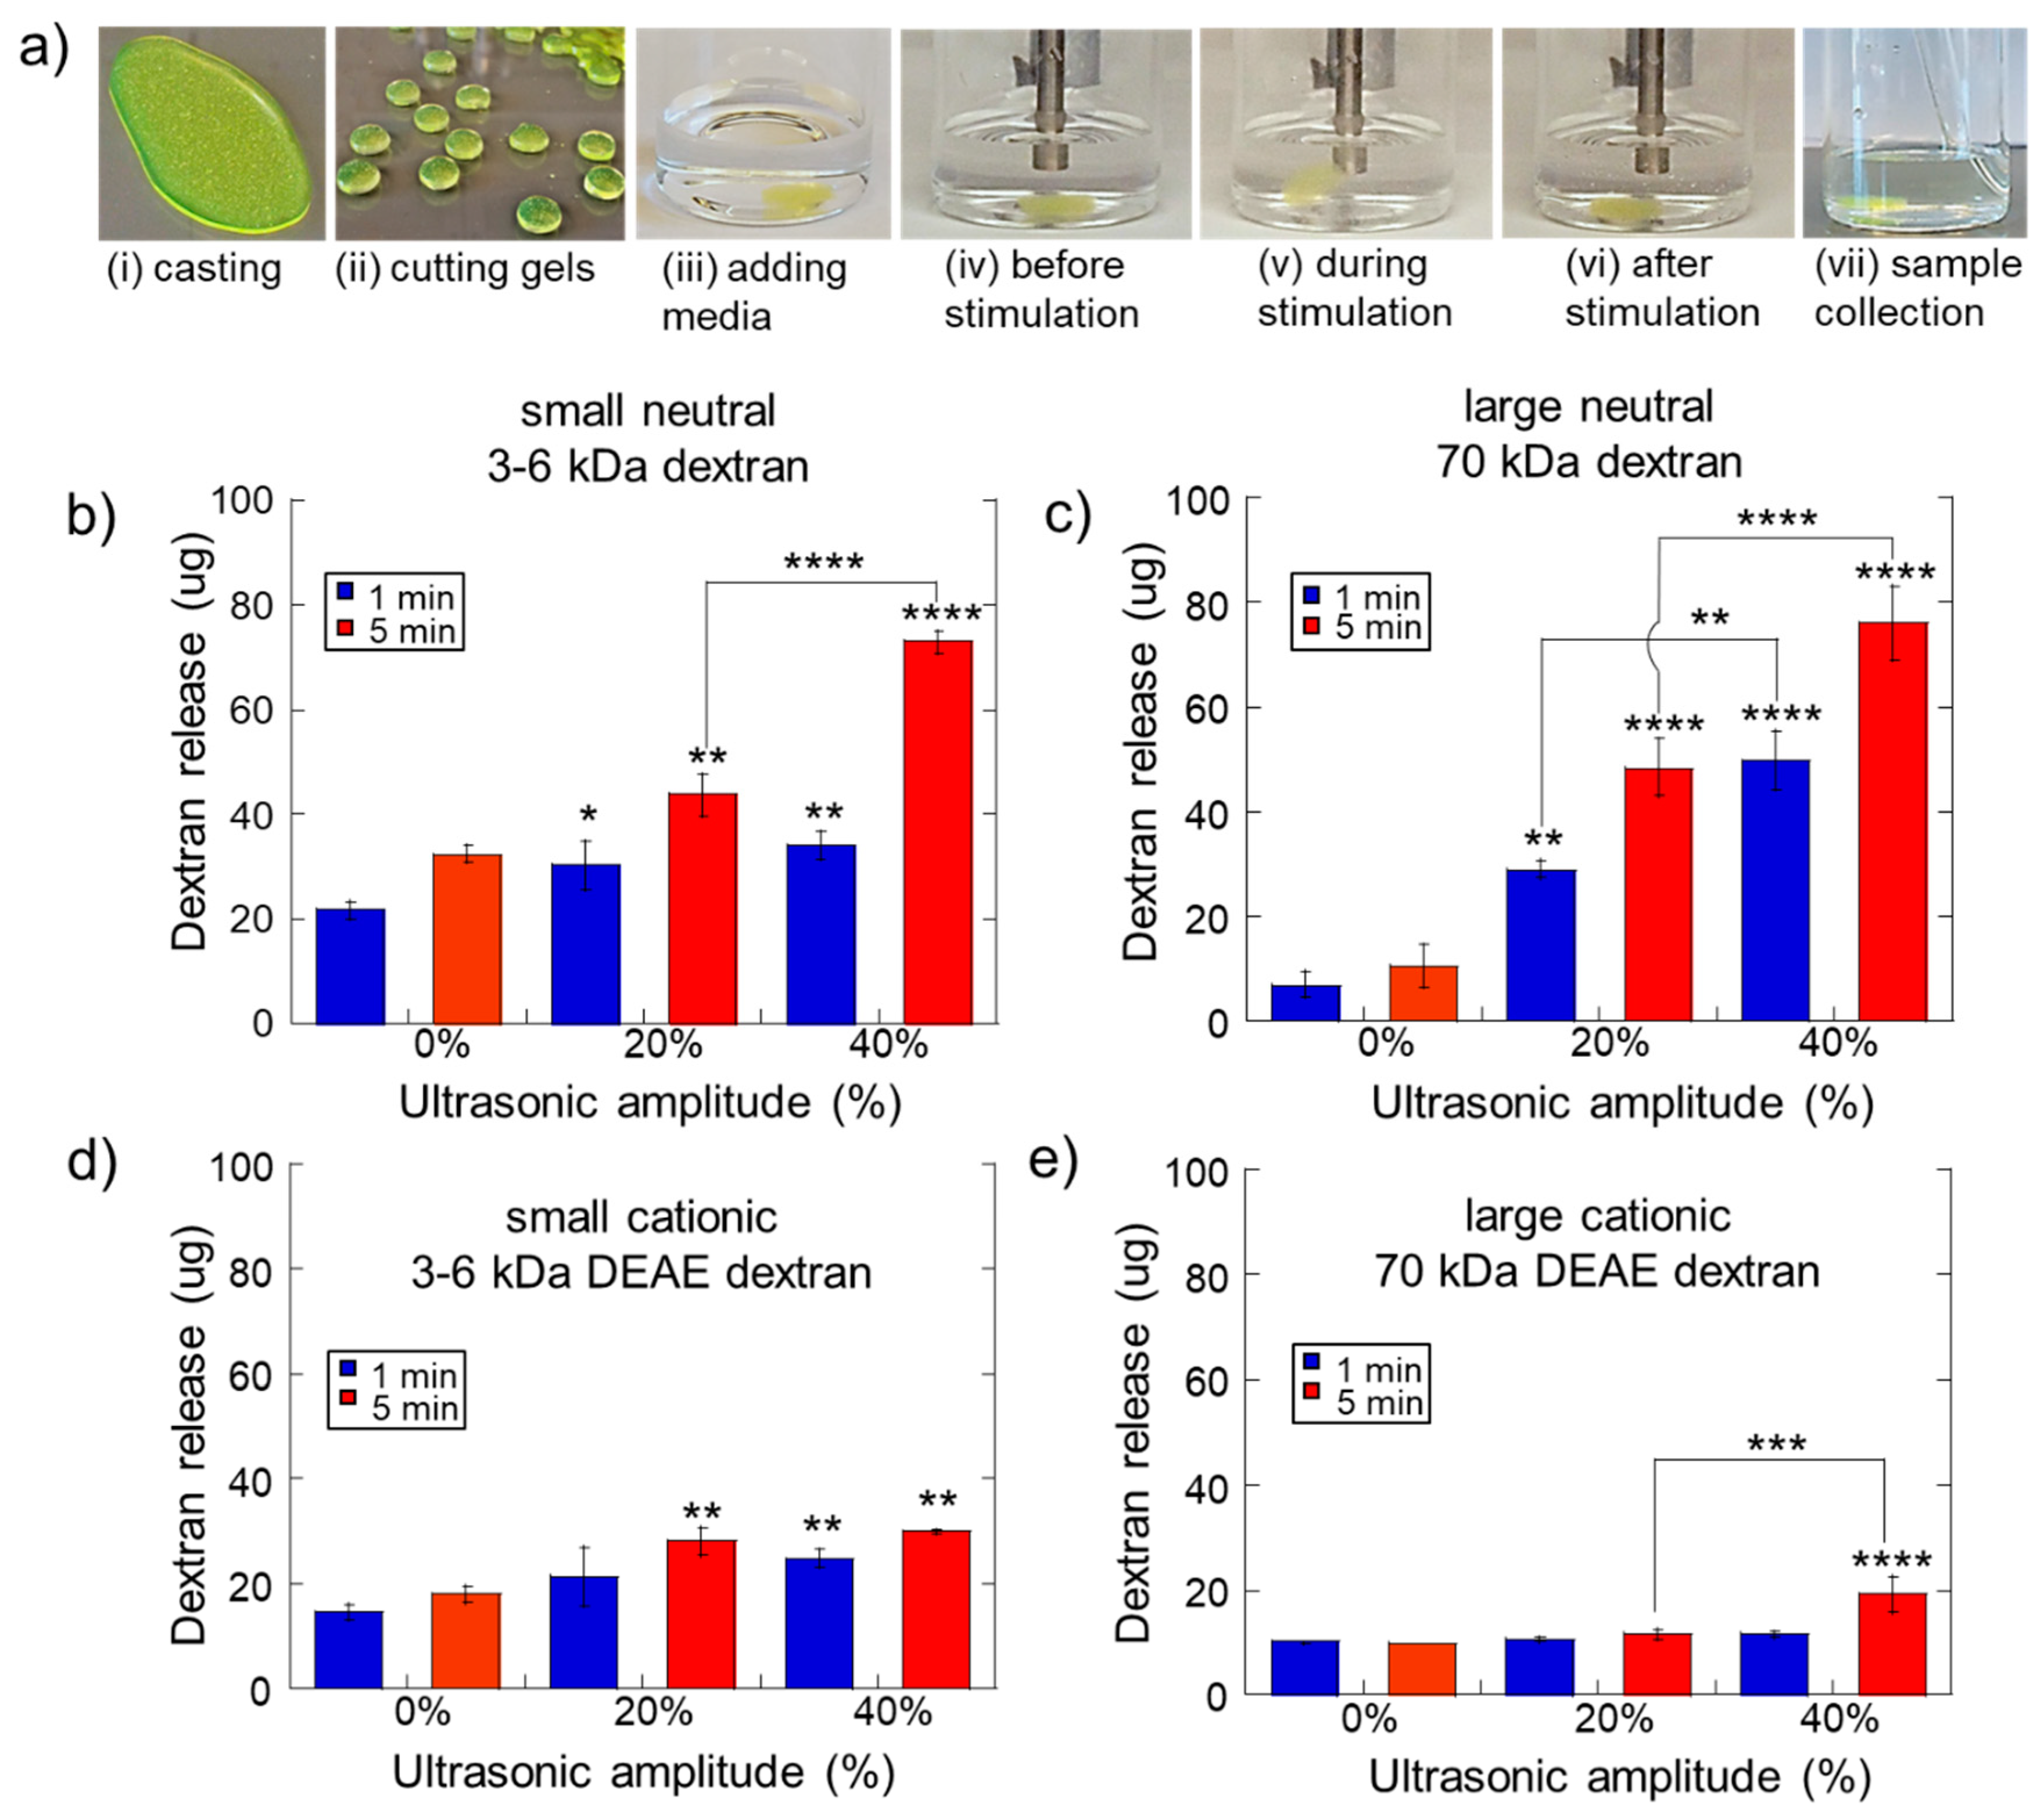
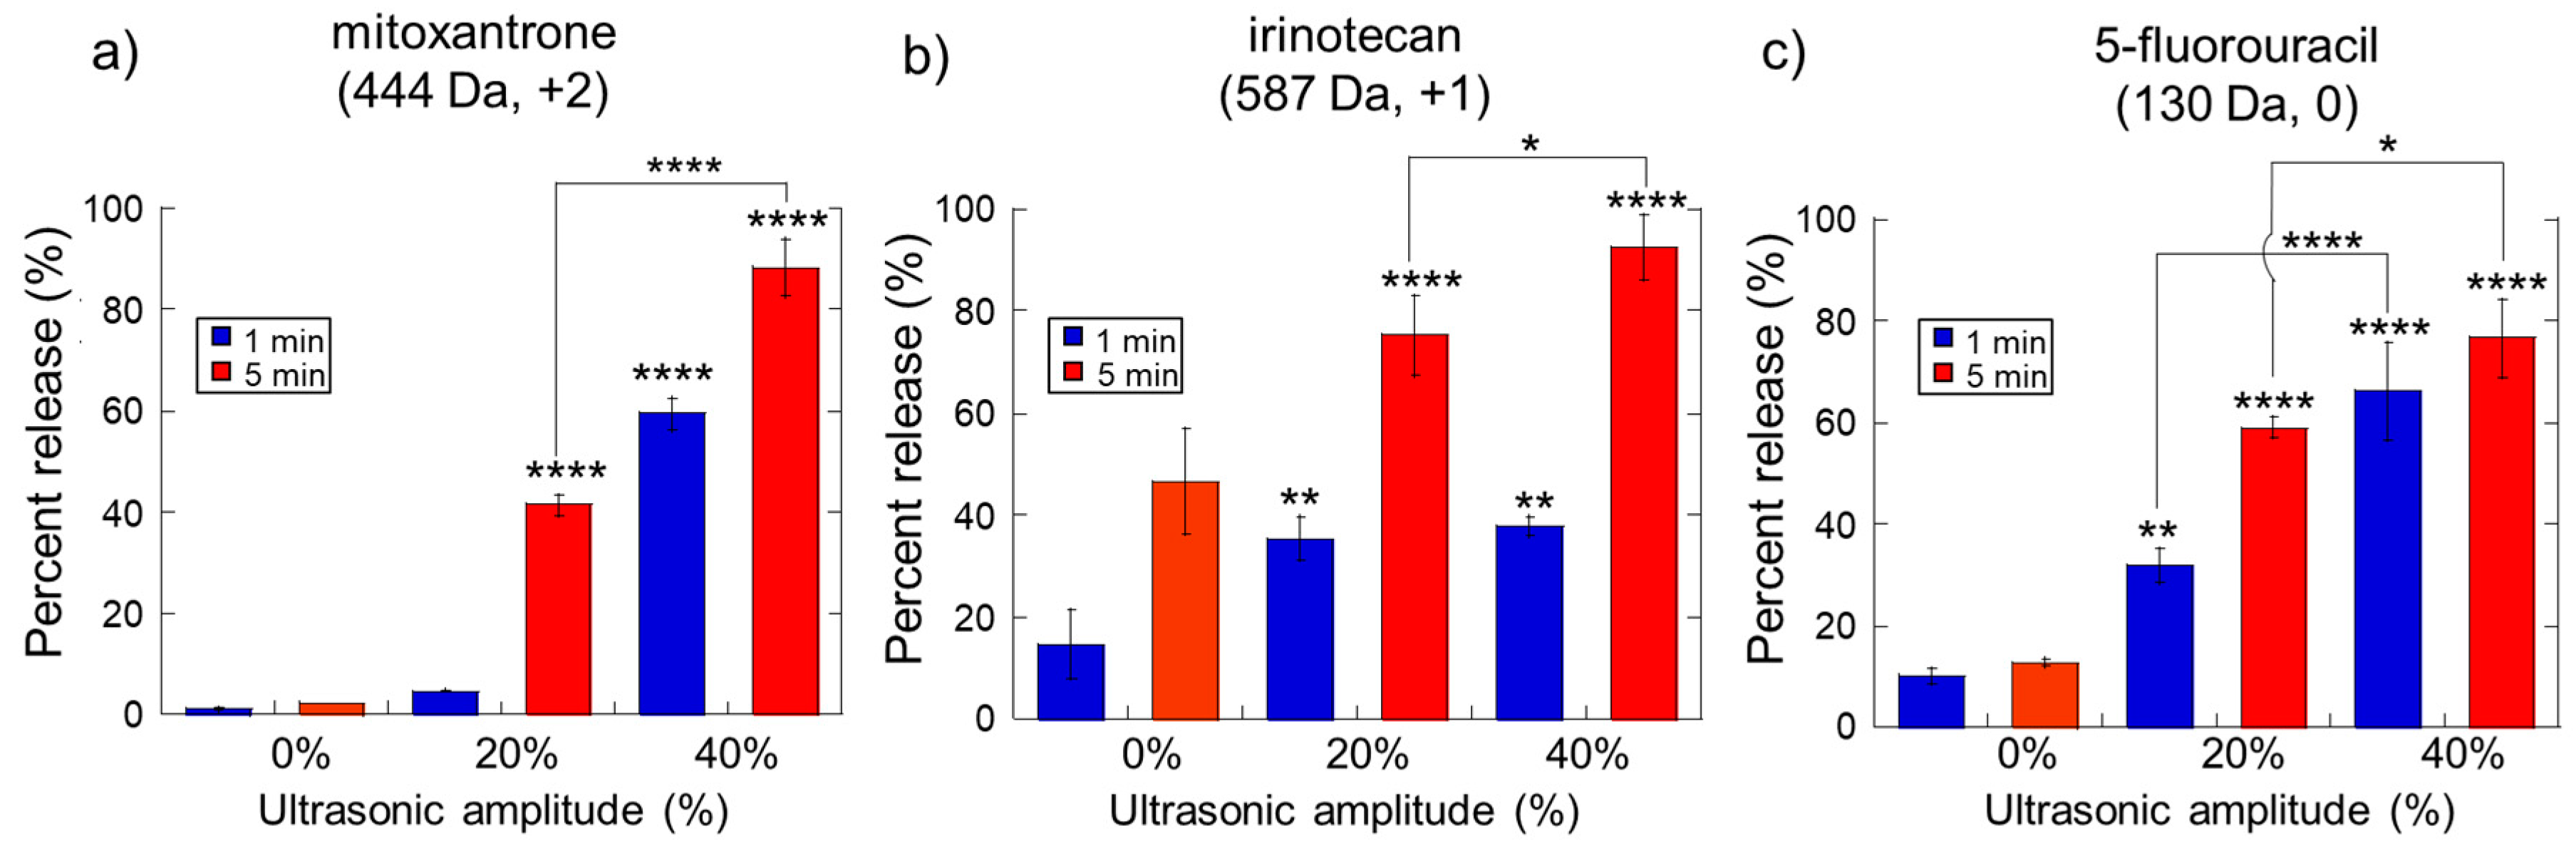
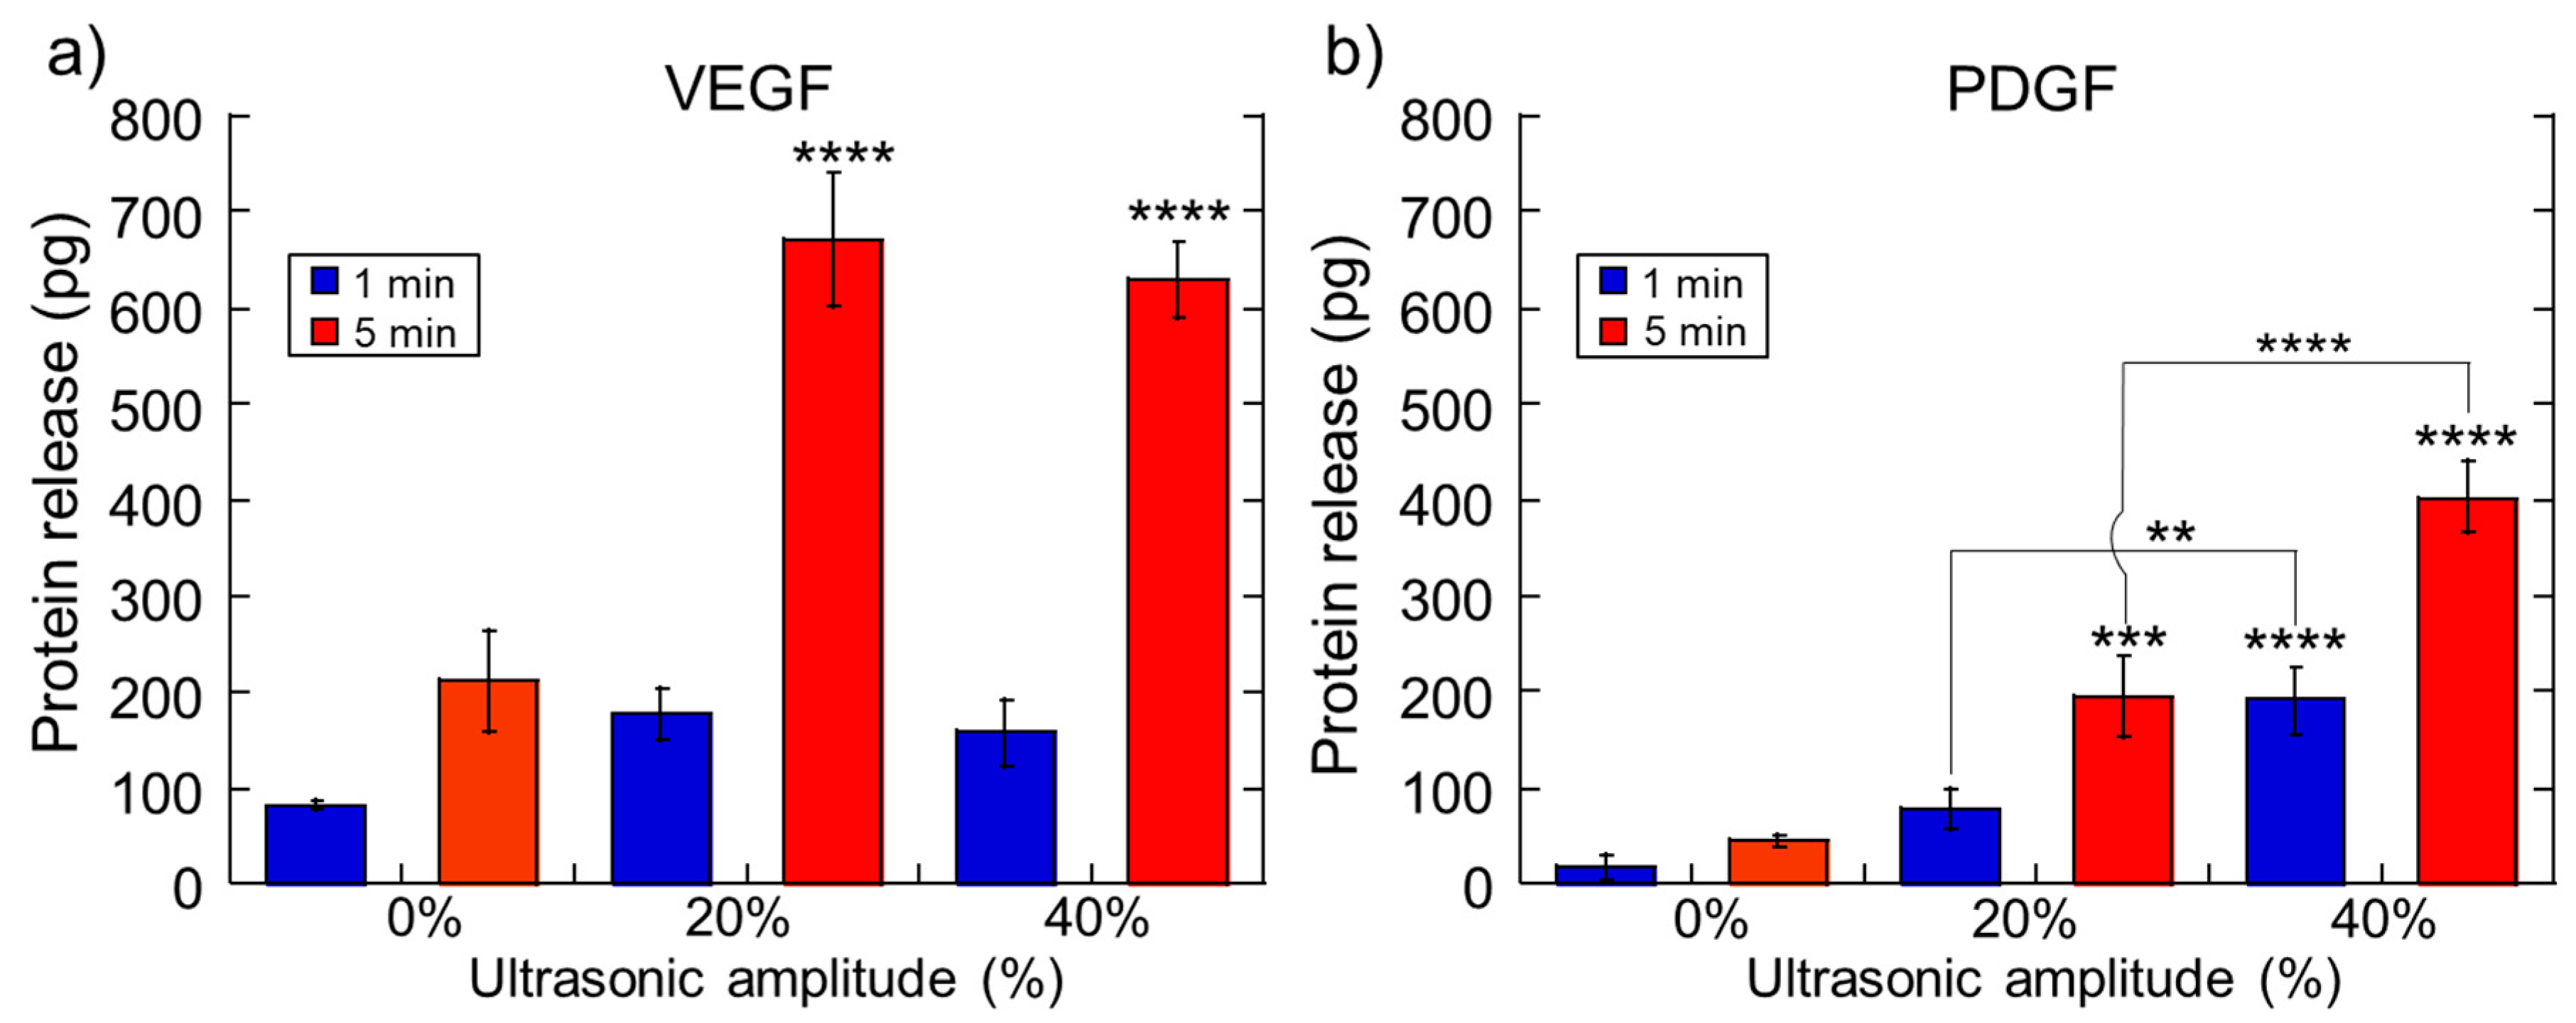
2.1. Impact of Ultrasonic Intensity and Duration on Therapeutic Release from Ca2+ Crosslinked Hydrogels
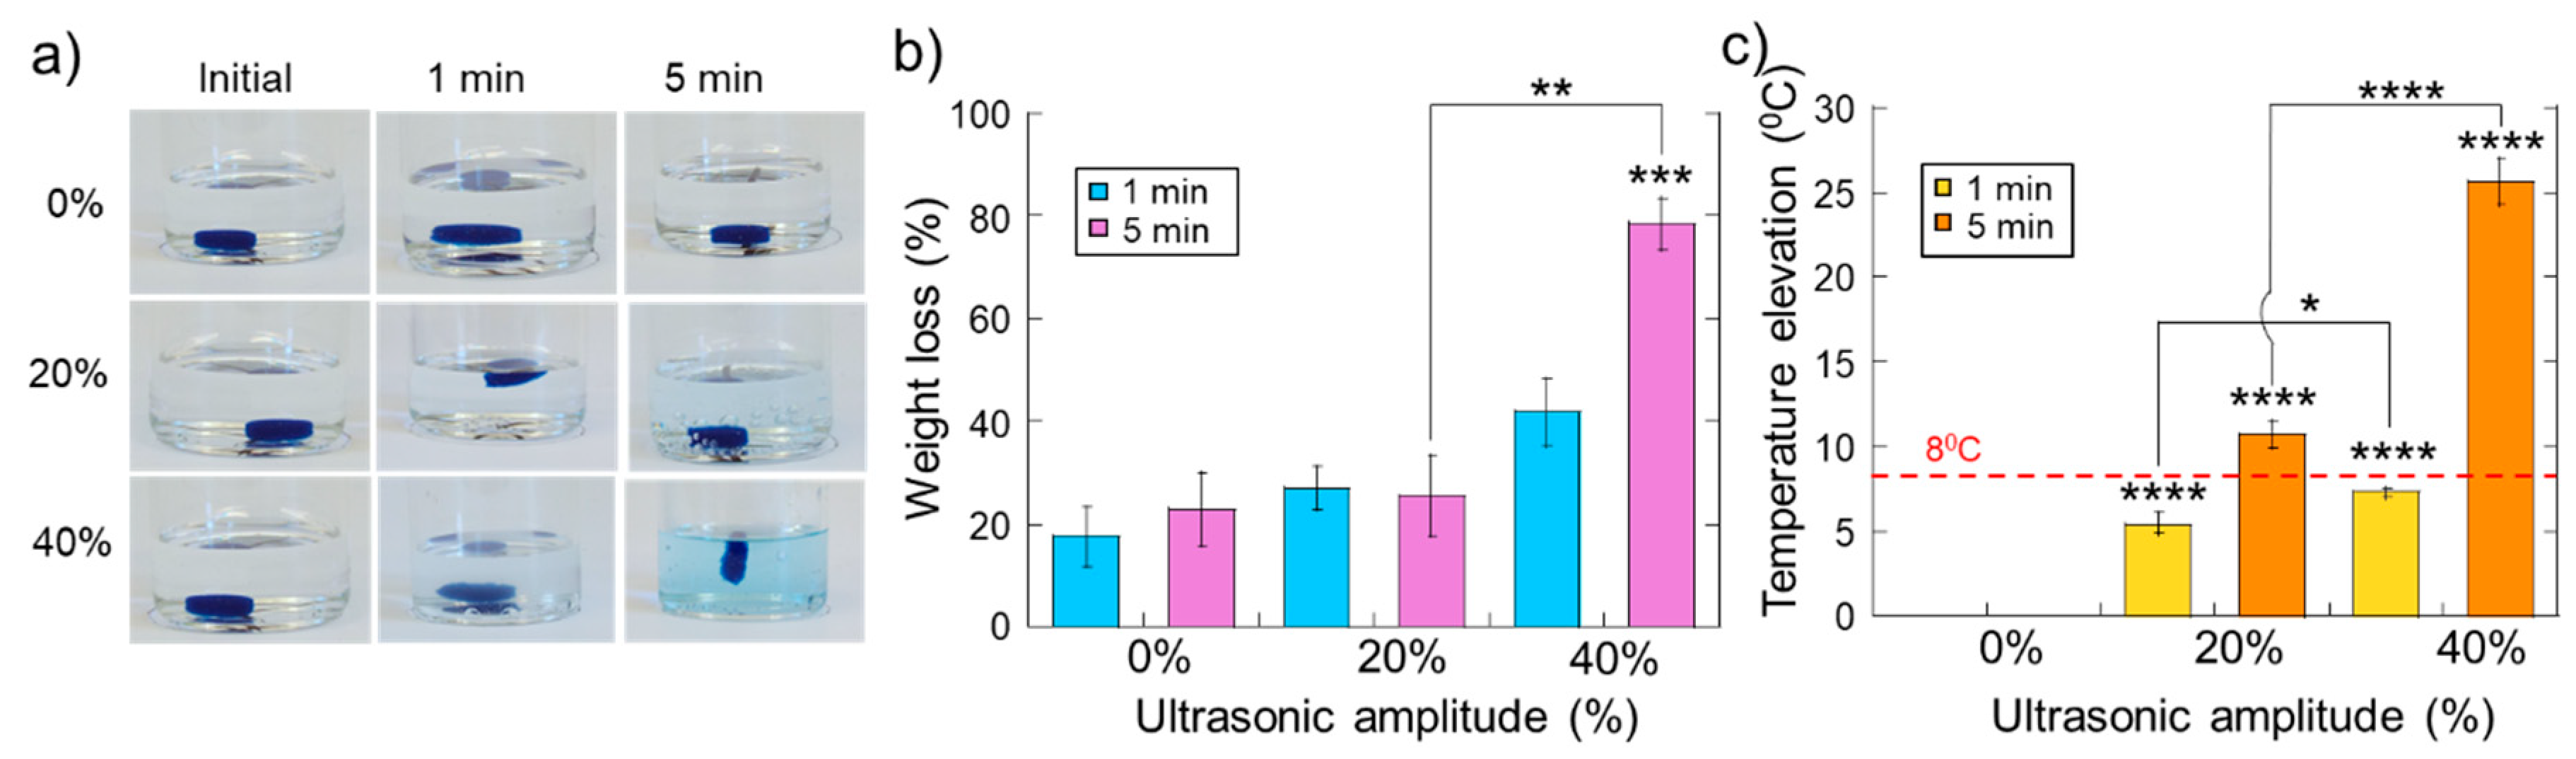
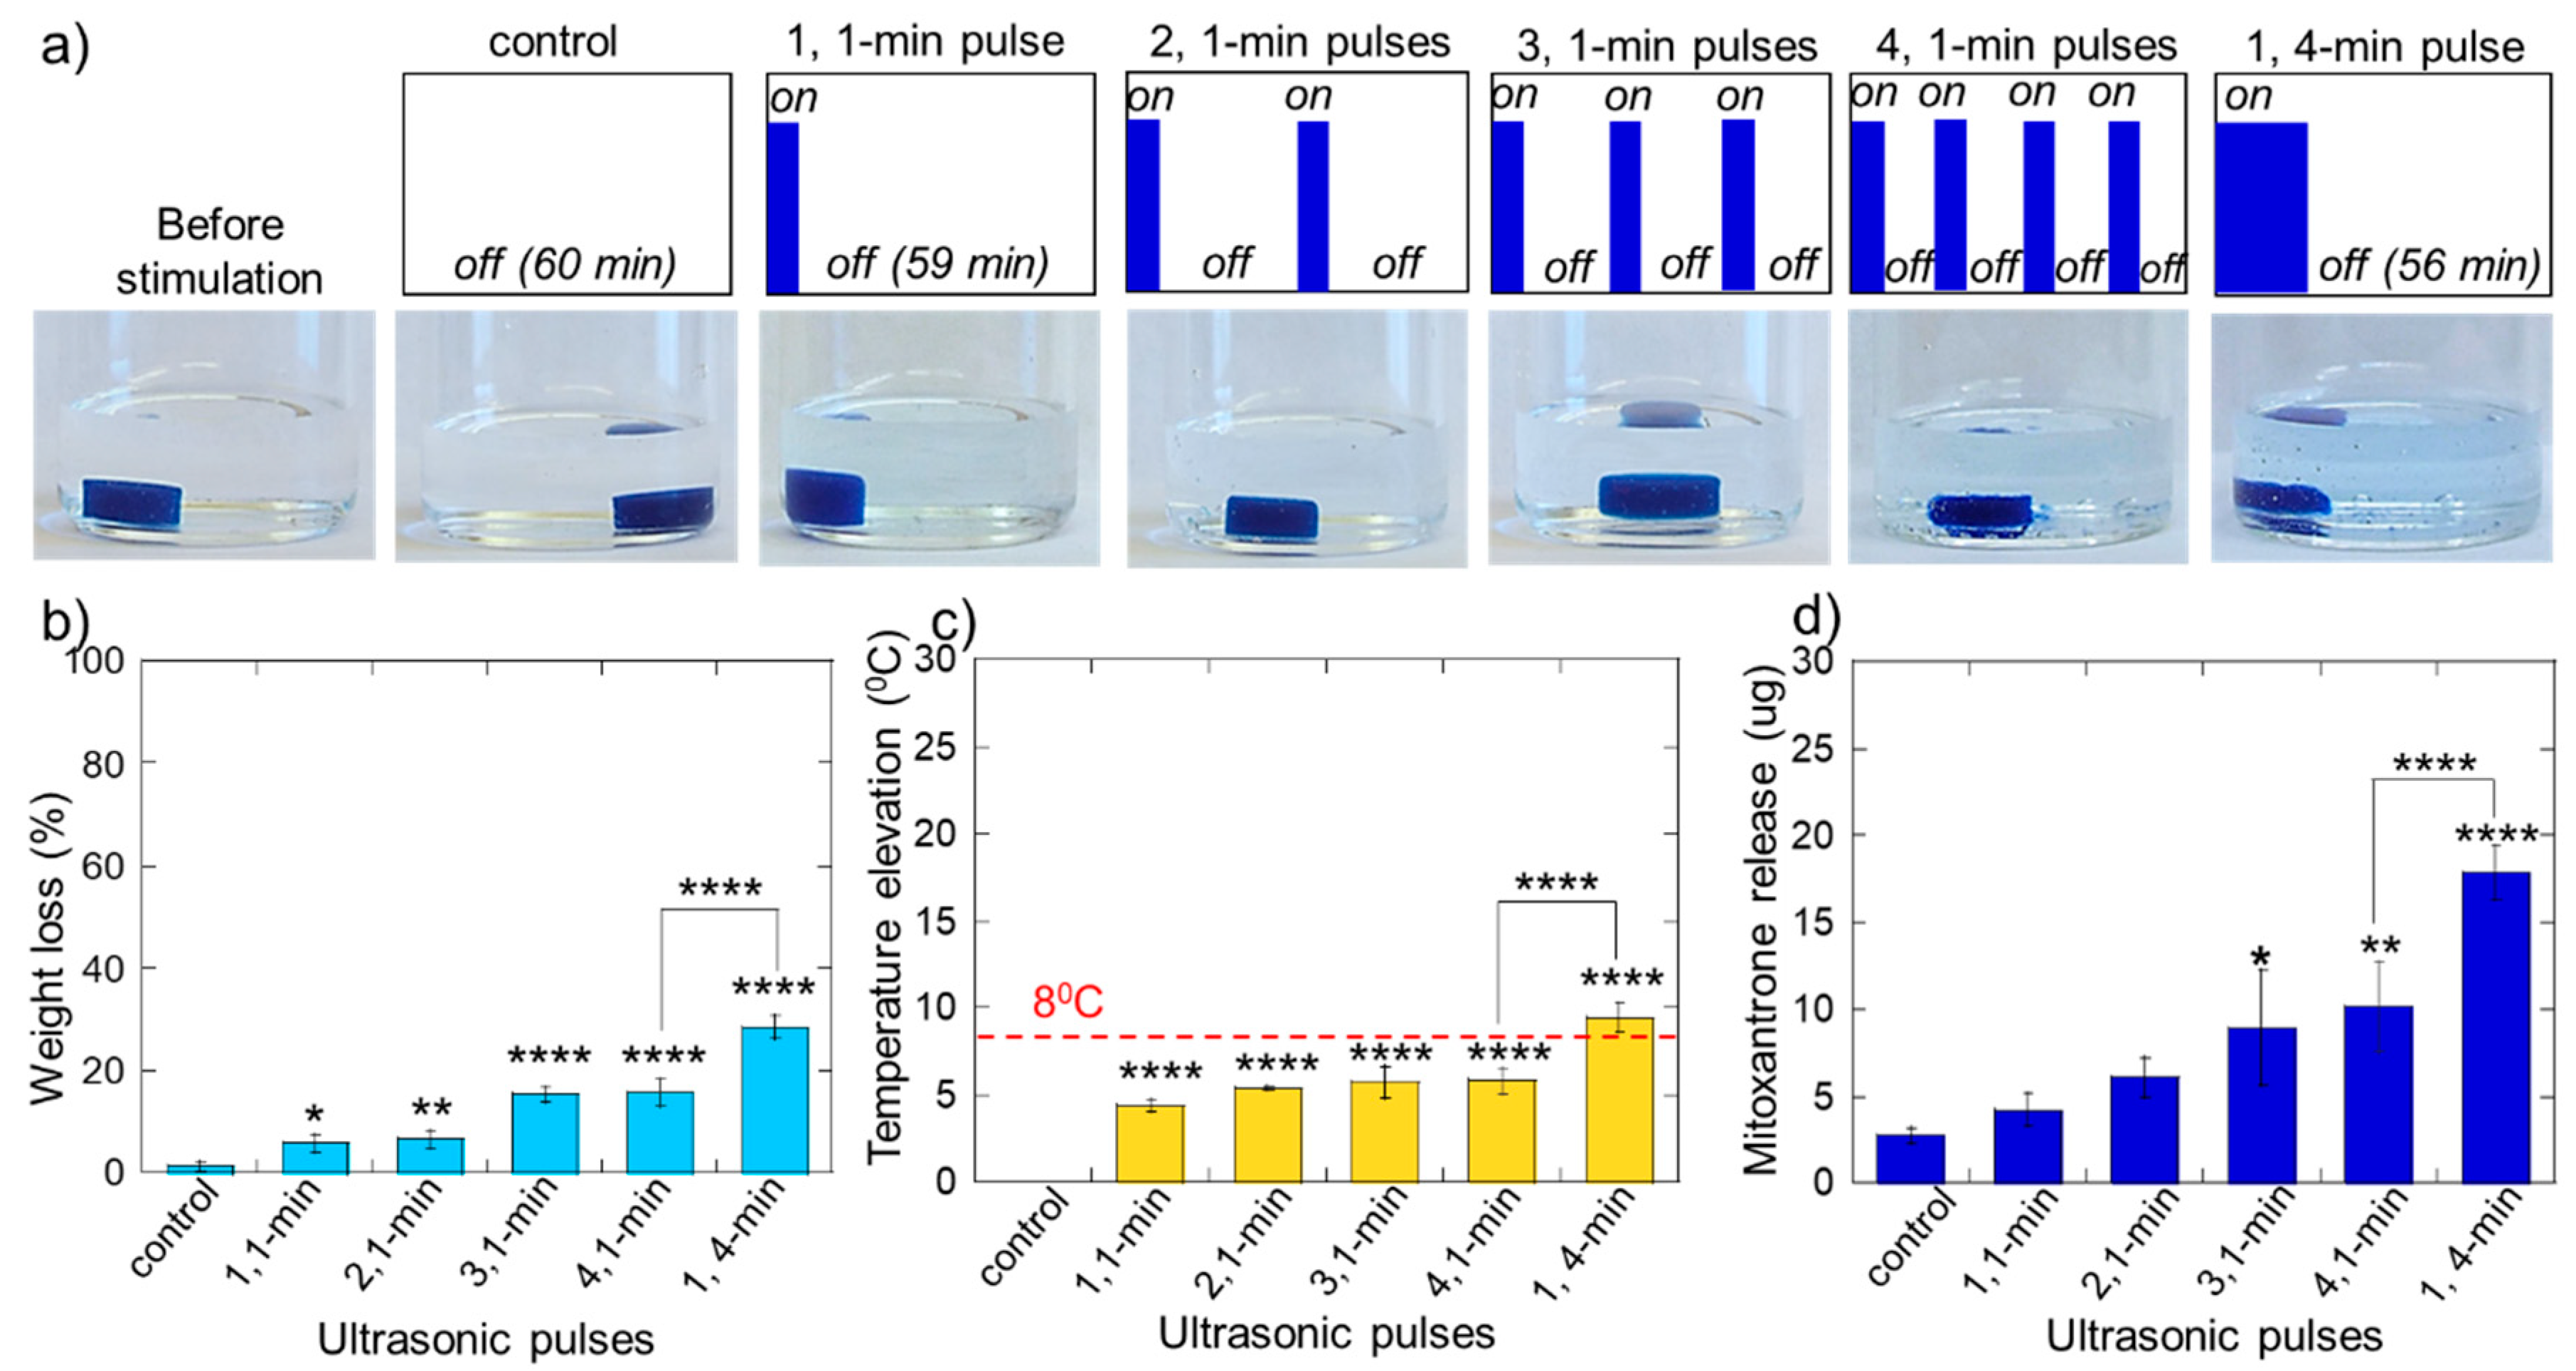
2.2. Erosion and Heating of Scaffold Due to Ultrasound Stimulation
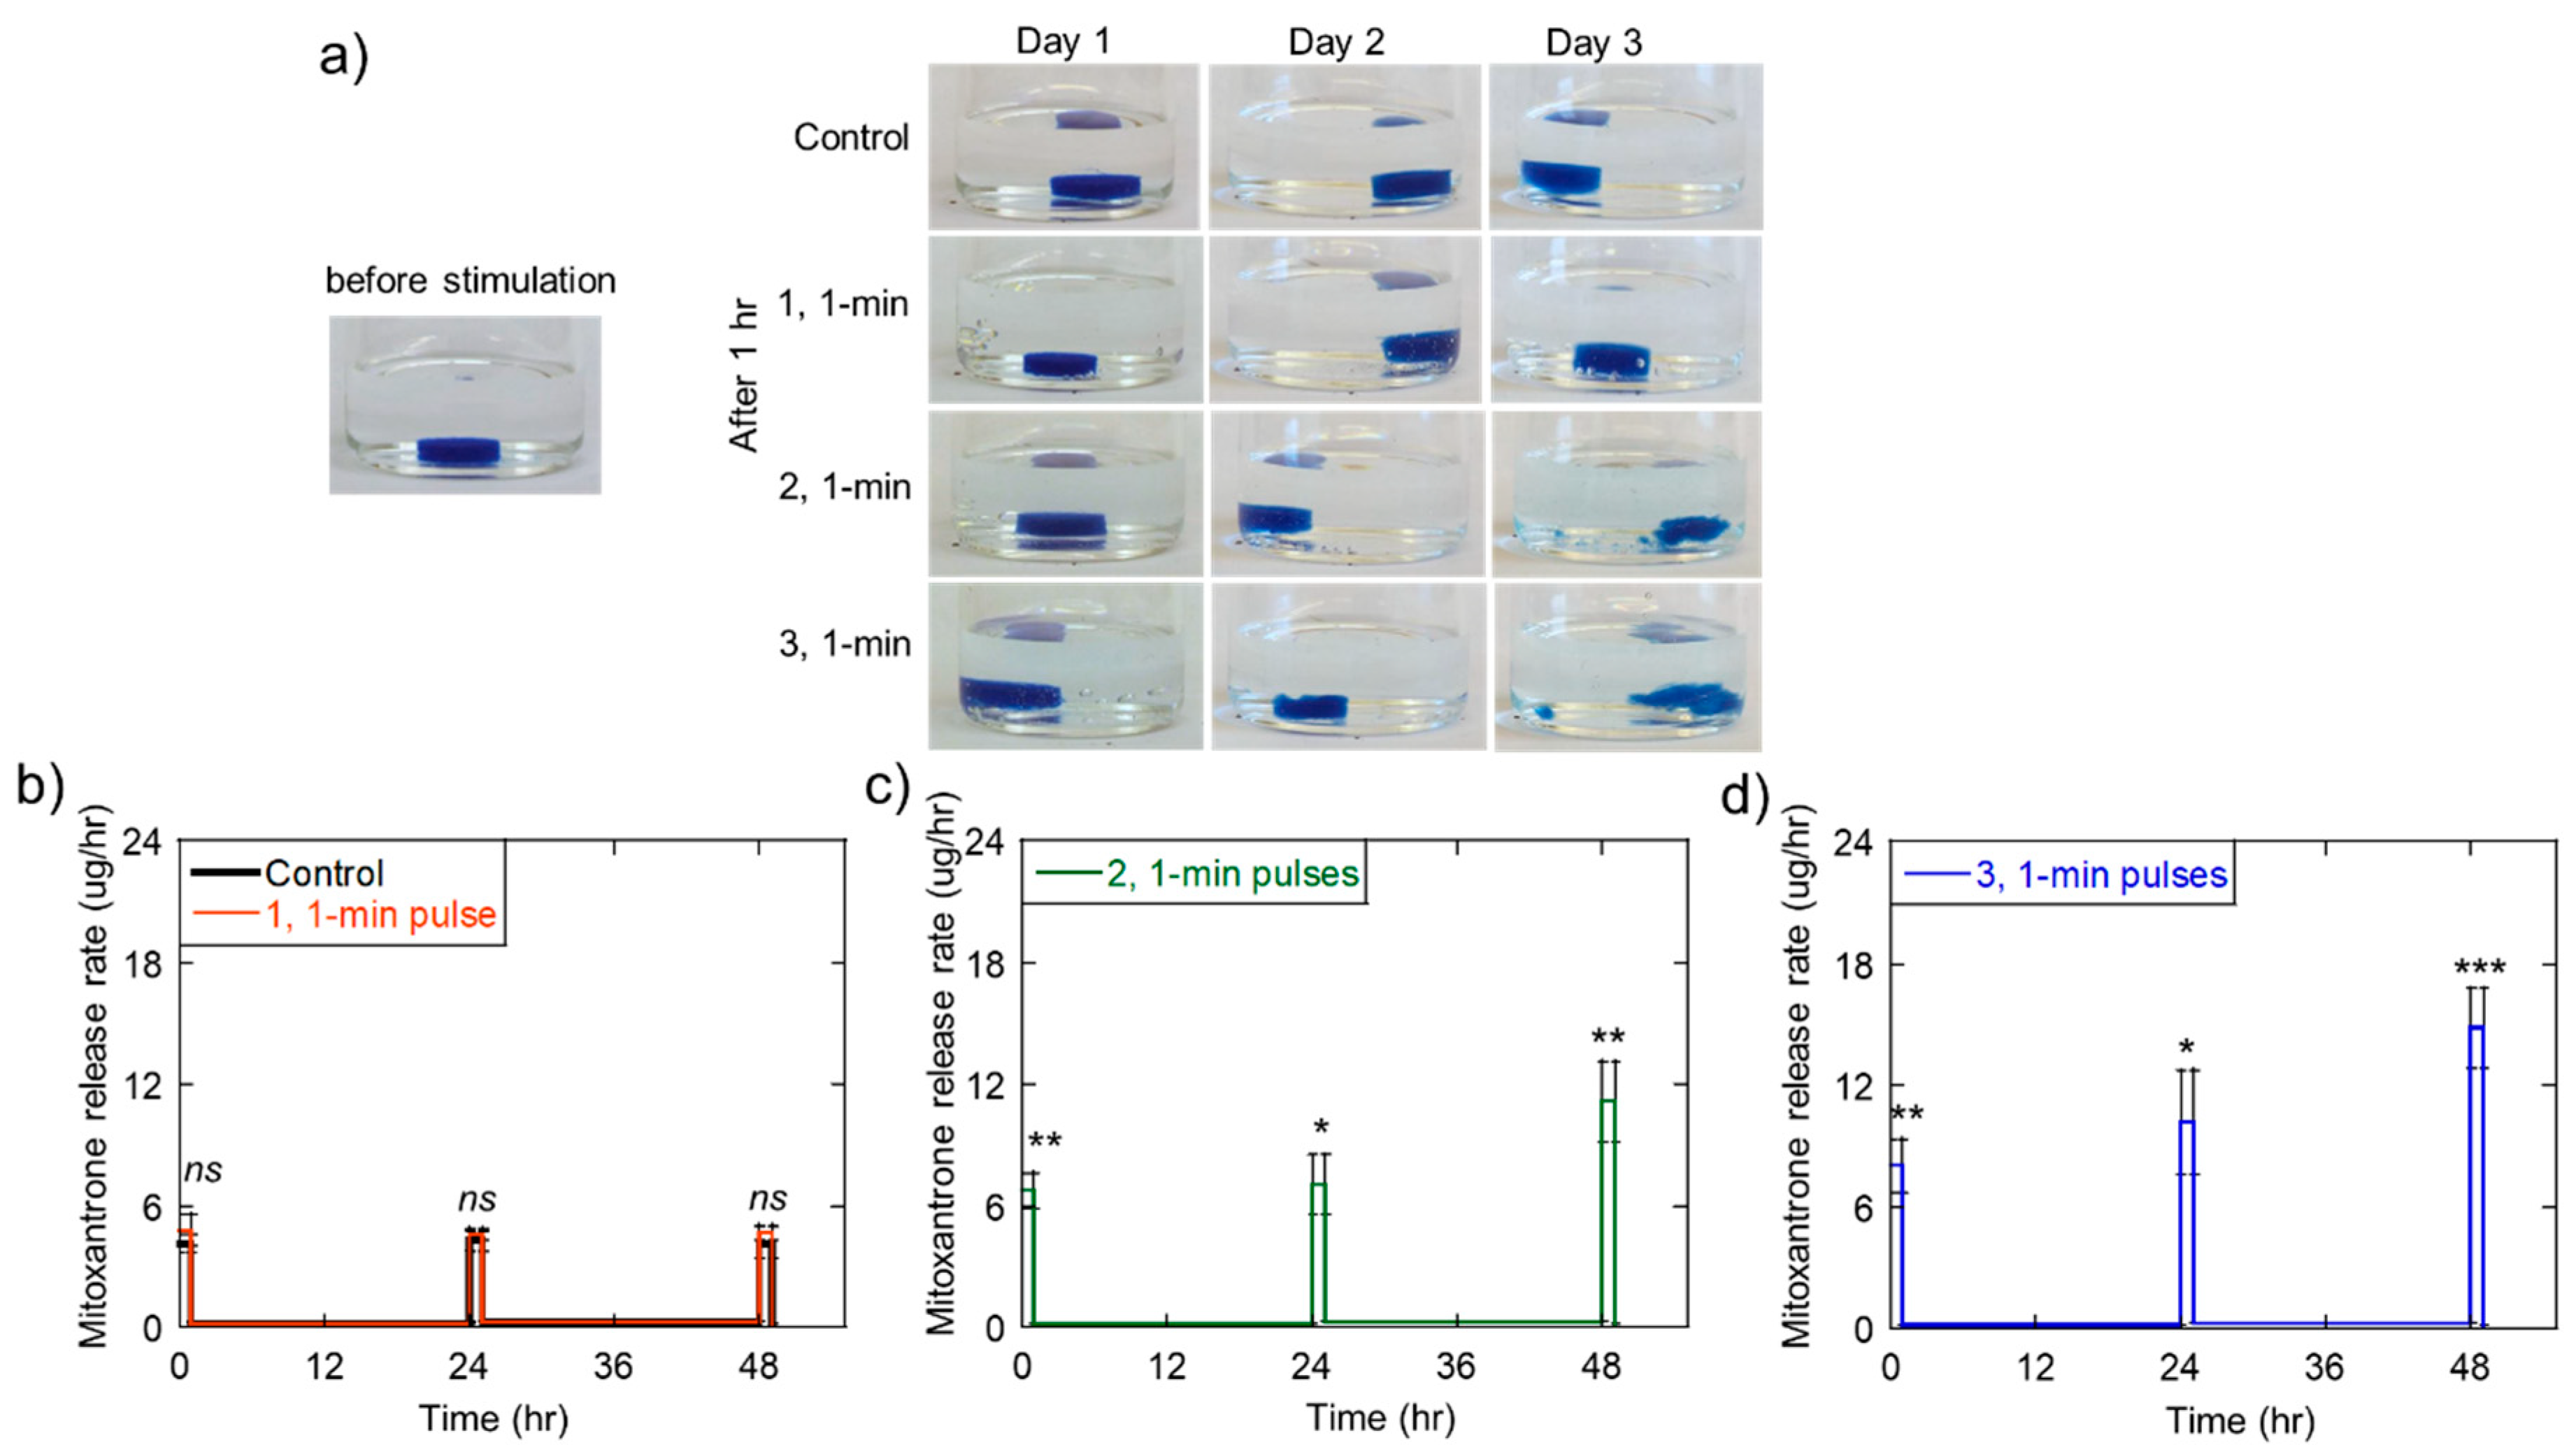
2.3. Triggered Therapeutic Delivery by Pulsing the Ultrasound Stimulation
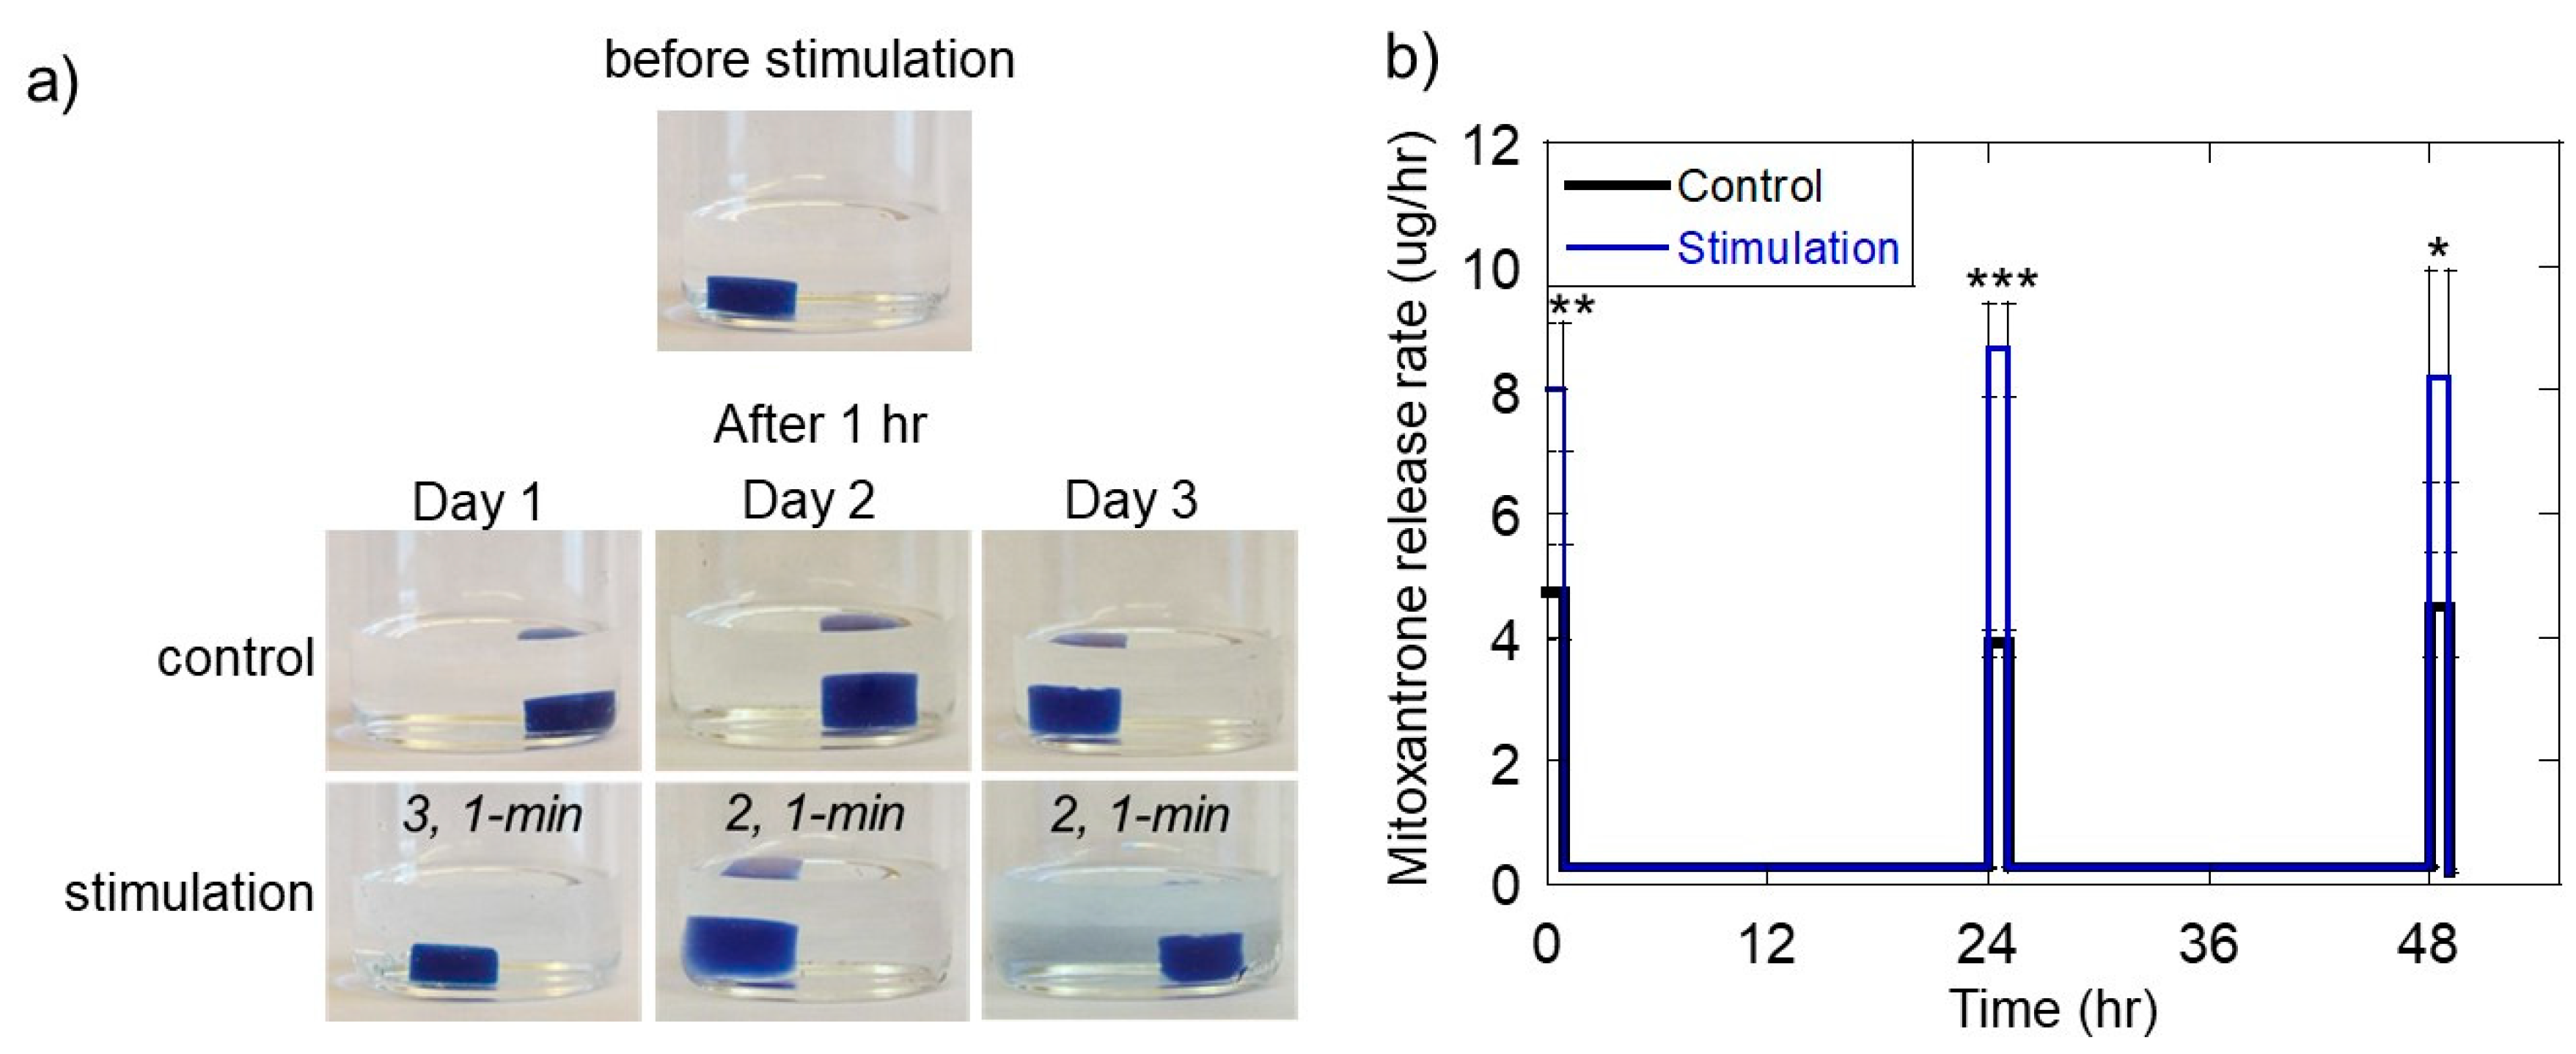
2.4. Ultrasonically Generating Pulsatile Therapeutic Delivery Profiles
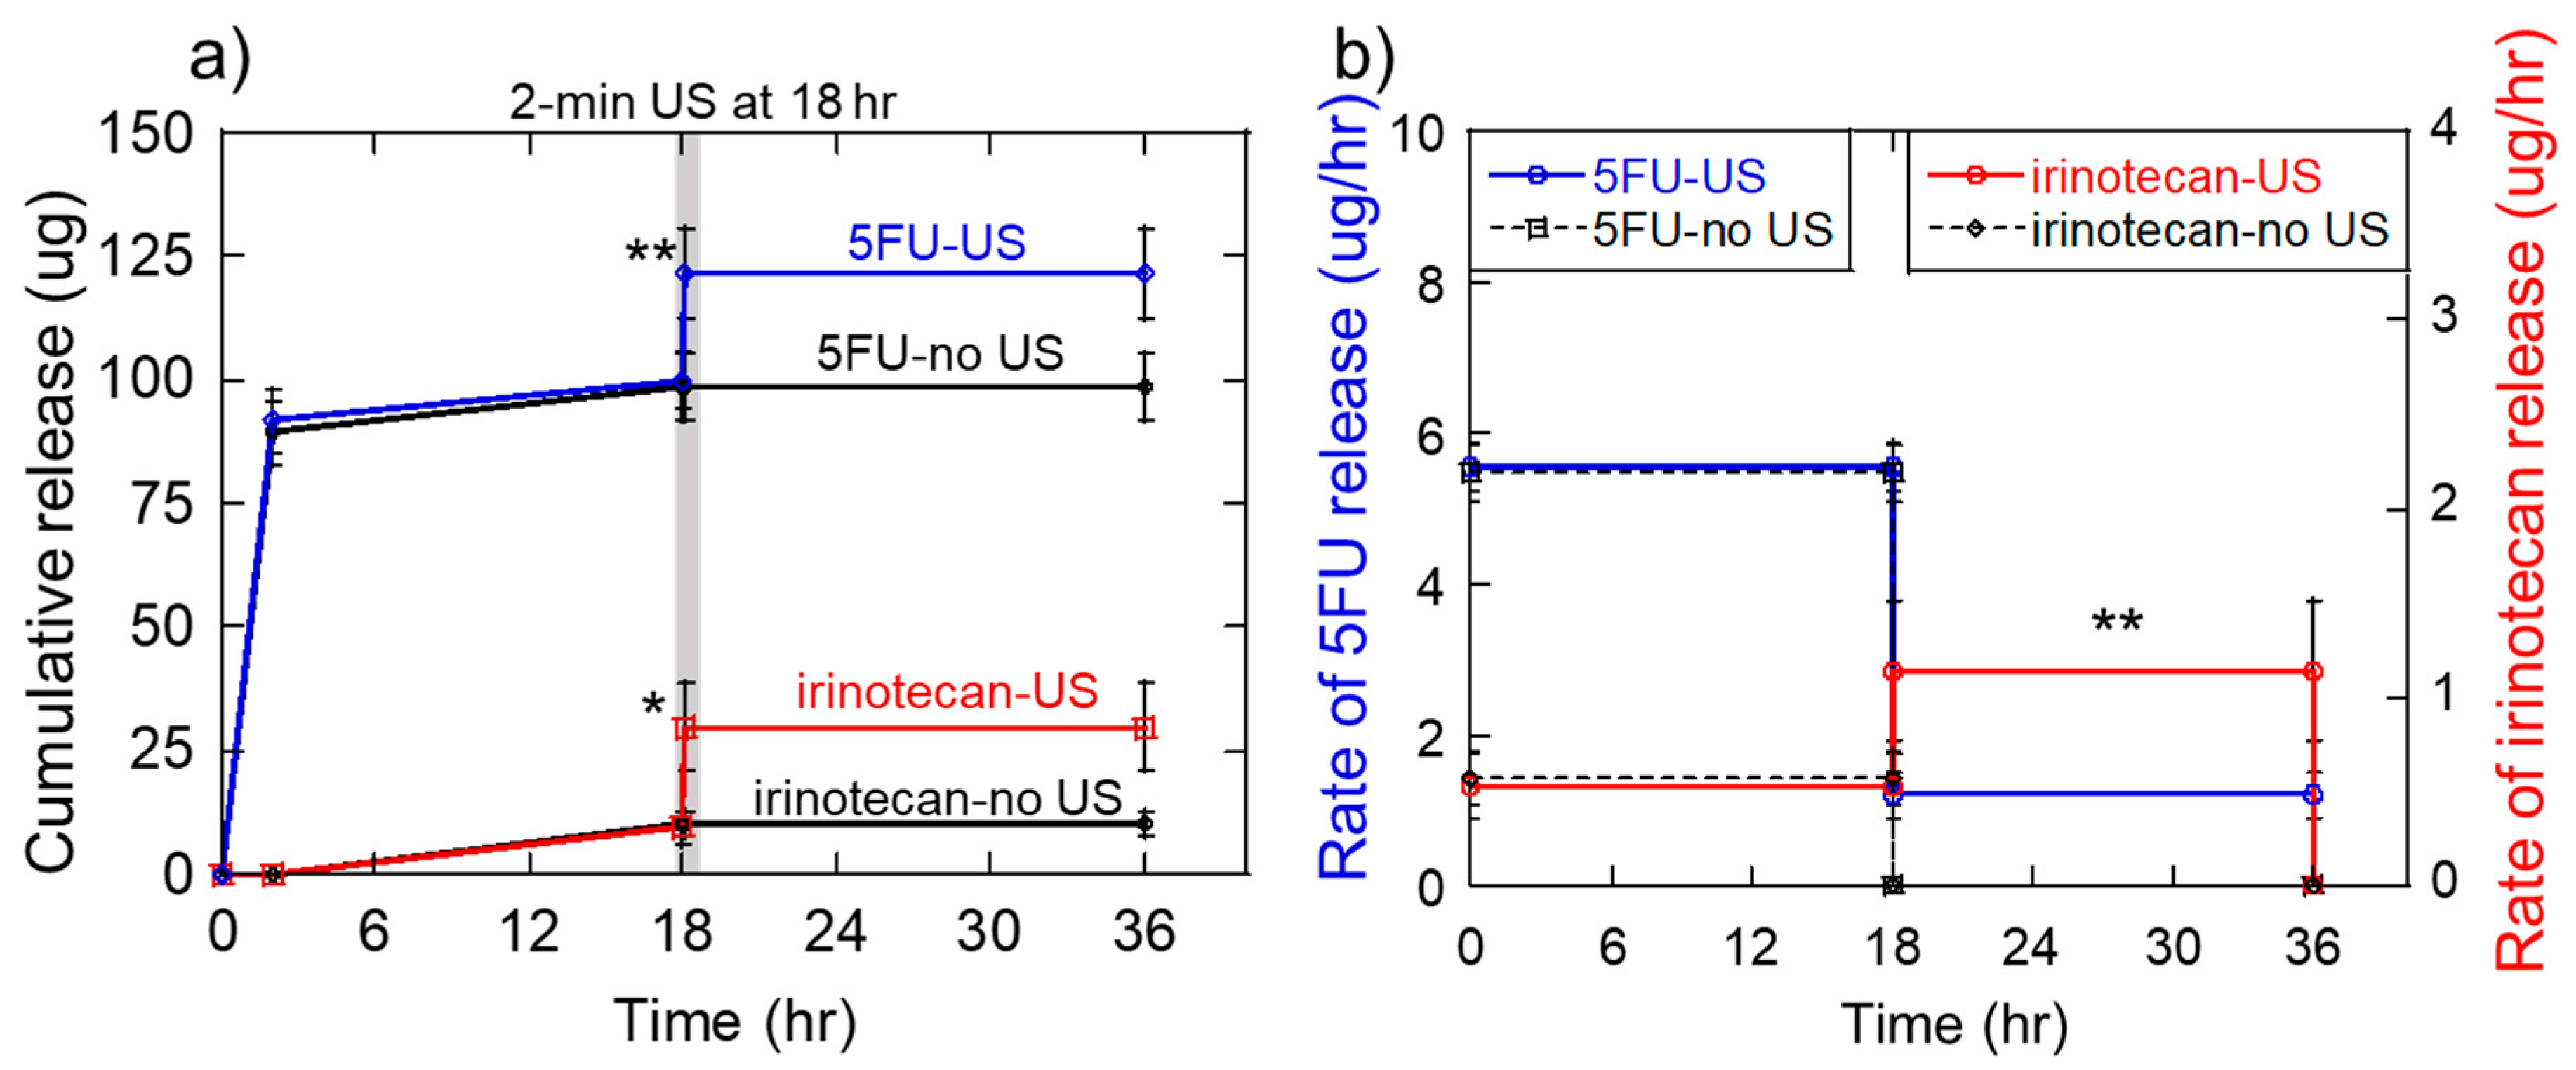
2.5. Sequential 5-Fluorouracil and Irinotecan Delivery On Melanoma Cells in Vitro
2.6. Generation of the Sequential 5-Fluorouracil and Irinotecan Deliveries
3. Discussion
4. Materials and Methods
4.1. Materials
4.2. Calcium Crosslinked Hydrogel Fabrication
4.3. Release Studies
4.4. Sequential Release Studies
4.5. Data Representation and Statistical Analysis
5. Conclusions
Supplementary Materials
Author Contributions
Funding
Acknowledgments
Conflicts of Interest
References
- Richardson, T.P.; Peters, M.C.; Ennett, A.B.; Mooney, D.J. Polymeric system for dual growth factor delivery. Nat. Biotechnol. 2001, 19, 1029–1034. [Google Scholar] [CrossRef]
- Brudno, Y.; Ennett-Shepard, A.B.; Chen, R.R.; Aizenberg, M.; Mooney, D.J. Enhancing microvascular formation and vessel maturation through temporal control over multiple pro-angiogenic and pro-maturation factors. Biomaterials 2013, 34, 9201–9209. [Google Scholar] [CrossRef] [PubMed]
- Mehta, M.; Schmidt-Bleek, K.; Duda, G.N.; Mooney, D.J. Biomaterial delivery of morphogens to mimic the natural healing cascade in bone. Adv. Drug Deliv. Rev. 2012, 64, 1257–1276. [Google Scholar] [CrossRef]
- Spiller, K.L.; Nassiri, S.; Witherel, C.E.; Anfang, R.R.; Ng, J.; Nakazawa, K.R.; Yu, T.; Vunjak-Novakovic, G. Sequential delivery of immunomodulatory cytokines to facilitate the M1-to-M2 transition of macrophages and enhance vascularization of bone scaffolds. Biomaterials 2015, 37, 194–207. [Google Scholar] [CrossRef] [PubMed]
- Martinez, F.O.; Gordon, S. The M1 and M2 paradigm of macrophage activation: Time for reassessment. F1000Prime Rep. 2014, 6. [Google Scholar] [CrossRef] [PubMed]
- Betz, O.B.; Betz, V.M.; Nazarian, A.; Egermann, M.; Gerstenfeld, L.C.; Einhorn, T.A.; Vrahas, M.S.; Bouxsein, M.L.; Evans, C.H. Delayed administration of adenoviral BMP-2 vector improves the formation of bone in osseous defects. Gene Ther. 2007, 14, 1039–1044. [Google Scholar] [CrossRef]
- Bertone, A.L.; Pittmann, D.D.; Bouxsein, M.L.; Li, J.; Clancy, B.; Seeherman, H.J. Adenoviral-mediated transfer of hBMP-6 gene accelerates osteotomy repair and return of bone mechanical properties. J. Orthop. Res. 2004, 22, 1261. [Google Scholar] [CrossRef]
- Ito, T.; Tokunaga, K.; Maruyama, H.; Kawashima, H.; Kitahara, H.; Horikoshi, T.; Ogose, A.; Hotta, Y.; Kuwano, R.; Katagiri, H.; et al. Coxsackievirus and adenovirus receptor (CAR)-positive immature osteoblasts as targets of adenovirus-mediated gene transfer for fracture healing. Gene Ther. 2003, 10, 1623. [Google Scholar] [CrossRef] [PubMed]
- Gerstenfeld, L.C.; Cullinane, D.M.; Barnes, G.L.; Graves, D.T.; Einhorn, T.A. Fracture healing as a post-natal developmental process: Molecular, spatial, and temporal aspects of its regulation. J. Cell. Biochem. 2003, 88, 873–884. [Google Scholar] [CrossRef] [PubMed]
- Kearney, C.J.; Mooney, D.J. Macroscale delivery systems for molecular and cellular payloads. Nat. Mater. 2013, 12, 1004–1017. [Google Scholar] [CrossRef]
- Cara, S.; Tannock, I.F. Retreatment of patients with the same chemotherapy: Implications for clinical mechanisms of drug resistance. Ann. Oncol. 2001, 12, 23–27. [Google Scholar] [CrossRef]
- Mormont, M.C.; Levi, F. Cancer chronotherapy: Principles, applications, and perspectives. Cancer 2003, 97, 155–169. [Google Scholar] [CrossRef] [PubMed]
- Mormont, M.C.; Lévi, F. Circadian-system alterations during cancer processes: A review. Int. J. Cancer 1997, 70, 241–247. [Google Scholar] [CrossRef]
- Goldman, A.; Majumder, B.; Dhawan, A.; Ravi, S.; Goldman, D.; Kohandel, M.; Majumder, P.K.; Sengupta, S. Temporally sequenced anticancer drugs overcome adaptive resistance by targeting a vulnerable chemotherapy-induced phenotypic transition. Nat. Commun. 2015, 6, 6139. [Google Scholar] [CrossRef] [PubMed]
- Araujo, J.C.; Mathew, P.; Armstrong, A.J.; Braud, E.L.; Posadas, E.; Lonberg, M.; Gallick, G.E.; Trudel, G.C.; Paliwal, P.; Agrawal, S.; et al. Dasatinib combined with docetaxel for castration-resistant prostate cancer: Results from a phase 1–2 study. Cancer 2012, 118, 63–71. [Google Scholar] [CrossRef] [PubMed]
- Lee, M.J.; Ye, A.S.; Gardino, A.K.; Heijink, A.M.; Sorger, P.K.; MacBeath, G.; Yaffe, M.B. Sequential application of anticancer drugs enhances cell death by rewiring apoptotic signaling networks. Cell 2012, 149, 780–794. [Google Scholar] [CrossRef] [PubMed]
- Xiao, D.; Yang, D.; Guo, L.; Lu, W.; Charpentier, M.; Yan, B. Regulation of carboxylesterase-2 expression by p53 family proteins and enhanced anti-cancer activities among 5-fluorouracil, irinotecan and doxazolidine prodrug. Br. J. Pharmacol. 2013, 168, 1989–1999. [Google Scholar] [CrossRef] [PubMed]
- Wu, M.H.; Yan, B.; Humerickhouse, R.; Dolan, M.E. Irinotecan Activation by Human Carboxylesterases in Colorectal Adenocarcinoma Cells. Clin. Cancer Res. 2002, 8, 2696–2700. [Google Scholar]
- Lévi, F.; Zidani, R.; Misset, J.-L. Randomised multicentre trial of chronotherapy with oxaliplatin, fluorouracil, and folinic acid in metastatic colorectal cancer. Lancet 1997, 350, 681–686. [Google Scholar] [CrossRef]
- Yu, T.; Huang, X.; Hu, K.; Bai, J.; Wang, Z. Treatment of transplanted adriamycin-resistant ovarian cancers in mice by combination of adriamycin and ultrasound exposure. Ultrason. Sonochem. 2004, 11, 287–291. [Google Scholar] [CrossRef] [PubMed]
- Douillard, J.Y.; Cunningham, D.; Roth, A.D.; Navarro, M.; James, R.D.; Karasek, P.; Jandik, P.; Iveson, T.; Carmichael, J.; Alakl, M.; et al. Irinotecan combined with fluorouracil compared with fluorouracil alone as first-line treatment for metastatic colorectal cancer: A multicentre randomised trial. Lancet 2000, 355, 1041–1047. [Google Scholar] [CrossRef]
- Hoare, T.R.; Kohane, D.S. Hydrogels in drug delivery: Progress and challenges. Polymer 2008, 49, 1993–2007. [Google Scholar] [CrossRef]
- Alvarez-Lorenzo, C.; Bromberg, L.; Concheiro, A. Light-sensitive Intelligent Drug Delivery Systems†. Photochem. Photobiol. 2009, 85, 848–860. [Google Scholar] [CrossRef] [PubMed]
- Bromberg, L.E.; Ron, E.S. Temperature-responsive gels and thermogelling polymer matrices for protein and peptide delivery. Adv. Drug Deliv. Rev. 1998, 31, 197–221. [Google Scholar] [CrossRef]
- Kennedy, S.; Bencherif, S.; Norton, D.; Weinstock, L.; Mehta, M.; Mooney, D. Rapid and Extensive Collapse from Electrically Responsive Macroporous Hydrogels. Adv. Healthc. Mater. 2014, 3, 500–507. [Google Scholar] [CrossRef]
- Hoare, T.; Santamaria, J.; Goya, G.F.; Irusta, S.; Lin, D.; Lau, S.; Padera, R.; Langer, R.; Kohane, D.S. A Magnetically Triggered Composite Membrane for On-Demand Drug Delivery. Nano Lett. 2009, 9, 3651–3657. [Google Scholar] [CrossRef]
- Hu, S.-H.; Liu, T.-Y.; Liu, D.-M.; Chen, S.-Y. Controlled Pulsatile Drug Release from a Ferrogel by a High-Frequency Magnetic Field. Macromolecules 2007, 40, 6786–6788. [Google Scholar] [CrossRef]
- Liu, T.-Y.; Hu, S.-H.; Liu, T.-Y.; Liu, D.-M.; Chen, S.-Y. Magnetic-sensitive behavior of intelligent ferrogels for controlled release of drug. Langmuir 2006, 22, 5974–5978. [Google Scholar] [CrossRef]
- Hu, S.-H.; Liu, T.-Y.; Liu, D.-M.; Chen, S.-Y. Nano-ferrosponges for controlled drug release. J. Contol. Release 2007, 121, 181–189. [Google Scholar] [CrossRef] [PubMed]
- Zhao, X.; Kim, J.; Cezar, C.A.; Huebsch, N.; Lee, K.; Bouhadir, K.; Mooney, D.J. Active scaffolds for on-demand drug and cell delivery. Proc. Natl. Acad. Sci. USA 2011, 108, 67–72. [Google Scholar] [CrossRef]
- Cezar, C.A.; Kennedy, S.M.; Mehta, M.; Weaver, J.C.; Gu, L.; Vandenburgh, H.; Mooney, D.J. Biphasic Ferrogels for Triggered Drug and Cell Delivery. Adv. Healthc. Mater. 2014, 3, 1869–1876. [Google Scholar] [CrossRef] [PubMed]
- Epstein-Barash, H.; Orbey, G.; Polat, B.E.; Ewoldt, R.H.; Feshitan, J.; Langer, R.; Borden, M.A.; Kohane, D.S. A microcomposite hydrogel for repeated on-demand ultrasound-triggered drug delivery. Biomaterials 2010, 31, 5208–5217. [Google Scholar] [CrossRef]
- Huebsch, N.; Kearney, C.J.; Zhao, X.; Kim, J.; Cezer, C.A.; Suo, Z.; Mooney, D.J. Ultrasound-triggered disruption and self-healing of reversibly cross-linked hydrogels for drug delivery and enhanced chemotherapy. Proc. Natl. Acad. Sci. USA 2014, 111, 9762–9767. [Google Scholar] [CrossRef] [PubMed]
- Wu, C.H.; Sun, M.K.; Shieh, J.; Chen, C.S.; Huang, C.W.; Dai, C.A.; Chang, S.W.; Chen, W.S.; Young, T.H. Ultrasound-responsive NIPAM-based hydrogels with tunable profile of controlled release of large molecules. Ultrasonics 2018, 83, 157–163. [Google Scholar] [CrossRef] [PubMed]
- Jiang, H.; Tovar-Carrillo, K.; Kobayashi, T. Ultrasound stimulated release of mimosa medicine from cellulose hydrogel matrix. Ultrason. Sonochem. 2016, 32, 398–406. [Google Scholar] [CrossRef] [PubMed]
- Miller, D.L.; Smith, N.B.; Bailey, M.R.; Czarnota, G.J.; Hynynen, K.; Makin, I.R.S. Overview of Therapeutic Ultrasound Application and Safety Considerations. J. Ultrasound Med. 2012, 31, 623–634. [Google Scholar] [CrossRef] [PubMed]
- Mitragotri, S.; Kost, J. Low-frequency sonophoresis: A review. Adv. Drug Deliv. Rev. 2004, 56, 589–601. [Google Scholar] [CrossRef] [PubMed]
- Tezel, A.; Sens, A.; Mitragotri, S. Investigations of the role of cavitation in low-frequency sonophoresis using acoustic spectroscopy. J. Pharm. Sci. 2002, 91, 444–453. [Google Scholar] [CrossRef]
- Kearney, C.J.; Skaat, H.; Kennedy, S.M.; Hu, J.; Darnell, M.; Raimondo, T.M.; Mooney, D.J. Switchable Release of Entrapped Nanoparticles from Alginate Hydrogels. Adv. Healthc. Mater. 2015, 4, 1634–1639. [Google Scholar] [CrossRef]
- Tolouei, A.E.; Dulger, N.; Ghatee, R.; Kennedy, S. A Magnetically Responsive Biomaterial System for Flexibly Regulating the Duration between Pro- and Anti-Inflammatory Cytokine Deliveries. Adv. Healthc. Mater. 2018, 7, e1800227. [Google Scholar] [CrossRef]
- Kennedy, S.; Roco, C.; Deleris, A.; Spoerri, P.; Cezar, C.; Weaver, J.; Vandenburgh, H.; Mooney, D. Improved magnetic regulation of delivery profiles from ferrogels. Biomaterials 2018, 161, 179–189. [Google Scholar] [CrossRef] [PubMed]
- Kennedy, S.; Hu, J.; Kearney, C.; Skaat, H.; Gu, L.; Gentili, M.; Vandenburgh, H.; Mooney, D. Sequential release of nanoparticle payloads from ultrasonically burstable capsules. Biomaterials 2016, 75, 91–101. [Google Scholar] [CrossRef] [PubMed]
- Emi, T.T.; Barnes, T.; Orton, E.; Reisch, A.; Tolouei, A.E.; Madani, S.Z.M.; Kennedy, S.M. Pulsatile Chemotherapeutic Delivery Profiles Using Magnetically Responsive Hydrogels. ACS Biomater. Sci. Eng. 2018, 4, 2412–2423. [Google Scholar] [CrossRef] [PubMed]
- Burgess, S.E.; Silverman, R.H.; Coleman, D.J.; Yablonski, M.E.; Lizzi, F.I.; Driller, J.; Rosado, A.; Dennis, P.H. Treatment of glaucoma with high-intensity focused ultrasound. Ophthalmology 1986, 93, 831–838. [Google Scholar] [CrossRef]
- Lepock, J.R. How do cells respond to their thermal environment? Int. J. Hyperth. 2005, 21, 681–687. [Google Scholar] [CrossRef] [PubMed]
- Bischof, J.C.; He, X. Thermal stability of proteins. Ann. N. Y. Acad. Sci. 2005, 1066, 12–33. [Google Scholar] [CrossRef] [PubMed]
- Berrada, M.; Yang, Z.; Lehnert, S. Tumor treatment by sustained intratumoral release of 5-fluorouracil: Effects of drug alone and in combined treatments. Int. J. Radiat. Oncol. Biol. Phys. 2002, 54, 1550–1557. [Google Scholar] [CrossRef]
Sample Availability: Not available. |


© 2019 by the authors. Licensee MDPI, Basel, Switzerland. This article is an open access article distributed under the terms and conditions of the Creative Commons Attribution (CC BY) license (http://creativecommons.org/licenses/by/4.0/).
Share and Cite
Emi, T.; Michaud, K.; Orton, E.; Santilli, G.; Linh, C.; O’Connell, M.; Issa, F.; Kennedy, S. Ultrasonic Generation of Pulsatile and Sequential Therapeutic Delivery Profiles from Calcium-Crosslinked Alginate Hydrogels. Molecules 2019, 24, 1048. https://doi.org/10.3390/molecules24061048
Emi T, Michaud K, Orton E, Santilli G, Linh C, O’Connell M, Issa F, Kennedy S. Ultrasonic Generation of Pulsatile and Sequential Therapeutic Delivery Profiles from Calcium-Crosslinked Alginate Hydrogels. Molecules. 2019; 24(6):1048. https://doi.org/10.3390/molecules24061048
Chicago/Turabian StyleEmi, Tania, Kendra Michaud, Emma Orton, Grace Santilli, Catherine Linh, Meaghan O’Connell, Fatima Issa, and Stephen Kennedy. 2019. "Ultrasonic Generation of Pulsatile and Sequential Therapeutic Delivery Profiles from Calcium-Crosslinked Alginate Hydrogels" Molecules 24, no. 6: 1048. https://doi.org/10.3390/molecules24061048
APA StyleEmi, T., Michaud, K., Orton, E., Santilli, G., Linh, C., O’Connell, M., Issa, F., & Kennedy, S. (2019). Ultrasonic Generation of Pulsatile and Sequential Therapeutic Delivery Profiles from Calcium-Crosslinked Alginate Hydrogels. Molecules, 24(6), 1048. https://doi.org/10.3390/molecules24061048