Article

Lysosome-Targeted Single Fluorescence Probe for Two-Channel Imaging Intracellular SO2 and Biothiols

School of Life Science and Engineering, Southwest Jiaotong University, Chengdu 610031, China
*
Author to whom correspondence should be addressed.
Molecules 2019, 24(3), 618; https://doi.org/10.3390/molecules24030618
Submission received: 16 January 2019 / Revised: 3 February 2019 / Accepted: 4 February 2019 / Published: 11 February 2019
(This article belongs to the Section Analytical Chemistry)

Abstract

:
As the members of reactive sulfur species, SO2 and biothiols play a significant role in physiological and pathological processes and directly influence numerous diseases. Furthermore, SO2 and biothiols can provide a reductive environment for lysosomes to carry out their optimal functionality. To this end, the development of single fluorescent probes for imaging SO2 and biothiols from different emission channels is highly desirable for understanding their physiological nature. Here, a lysosome-targeted fluorescent probe (BPO-DNSP) with a dual reaction site for SO2 and biothiols was presented. BPO-DNSP can sensitively and selectively respond to SO2 in the green channel with a large Stokes shift over 105 nm, and to biothiols in the near-infrared emission channel with a large Stokes shift over 109 nm. The emission shift for the two channels was as high as 170 nm. Colocalization experiments verified that BPO-DNSP can selectively enrich lysosomes. Notably, BPO-DNSP can not only be used to image intracellular SO2 and biothiols from two different channels, but also to monitor the conversion of biothiols to SO2 without adding exogenous enzymes in living HeLa cells.

Graphical Abstract

1. Introduction

Reactive sulfur species (RSS), such as SO2 and biothiols, play a critical role in physiological and pathological processes [1,2,3,4]. Biothiols, including cysteine (Cys), homocysteine (Hcy), and glutathione (GSH), can not only serve as unique units in intracellular signal transduction but can also maintain redox homeostasis in the biological environment [5,6,7,8]. The intracellular biothiol concentration can be as high as 1–10 mM [2,9]. Abnormal levels of biothiols are critical for many diseases. For example, the deficiency of biothiols can lead to lethargy, liver damage, psoriasis, and slow growth in children, whereas high levels of biothiols are considered to be associated with Alzheimer’s disease, cardiovascular disease, osteoporosis, and cancers [10,11,12]. SO2 is a potential signal transmitter generated endogenously via biosynthetic pathways in vivo [3,13,14]. It has been reported that SO2 is directly related to symptoms of neurological disorders, cardiovascular diseases, and lung cancer [15]. Furthermore, biothiols are essential molecules which are the source of other RSS, and SO2 can be generated endogenously from biothiols [13]. The metabolism of biothiols with dioxygenase as a catalyst can generate cysteinesulfinate which further converts to β-sulfinylpyruvate and then decomposes to SO2 by aspartate aminotransferase [16]. Nevertheless, it would be still highly valuable to better understand their relationship and cellular cross-talk. Thus, to investigate the pathological mechanisms of disease, it is of great importance to monitor both SO2 and biothiols with high sensitivity and selectivity in living cells.
Fluorescence technology is a powerful tool applied in the biological field due to its simple operation and high sensitivity as well as excellent spatial and temporal resolution [17,18,19,20]. Till now, numerous fluorescent probes have been developed for detecting biothiols or SO2 independently [16,19,21,22,23]. To better understand their physiological nature and cellular cross-talk, a single fluorescent probe with dual functions could provide more detailed information about the microenvironment and physical condition of the cells [24]. However, there are still few fluorescent probes presented for imaging SO2 and biothiols with distinct responses from different emission channels [25,26,27,28].
RSS widely exist in cytoplasm and different organelles, such as mitochondria, lysosomes, endoplasmic reticulum, and so on. Being an important organelle found in nearly all eukaryotic cells, lysosomes play an important role in intracellular digestion and cellular apoptosis—a function that requires a highly reductive environment provided by RSS for optimal functionality [29,30,31]. RSS, especially biothiols, can stabilize the lysosomal membrane, stimulate albumin degradation in liver lysosomes, and facilitate intralysosomal hydrolase [32,33]. Nevertheless, the introduction of oxidative stress or metabolic dysfunction affects biothiol and SO2 concentrations in the lysosome, and this could be a possible indicator of disease states [34]. Therefore, fluorescent probes that respond to SO2 and biothiols within the lysosomes could provide deep insights into their specific roles in the physiological and pathological process [35,36,37]. On this account, the development of lysosome-targeted, single, fluorescent probes for separate detection of SO2 and biothiols with high sensitivity and selectivity is highly desirable.

2. Results and Discussion

2.1. Design Strategy and Synthesis of Probes

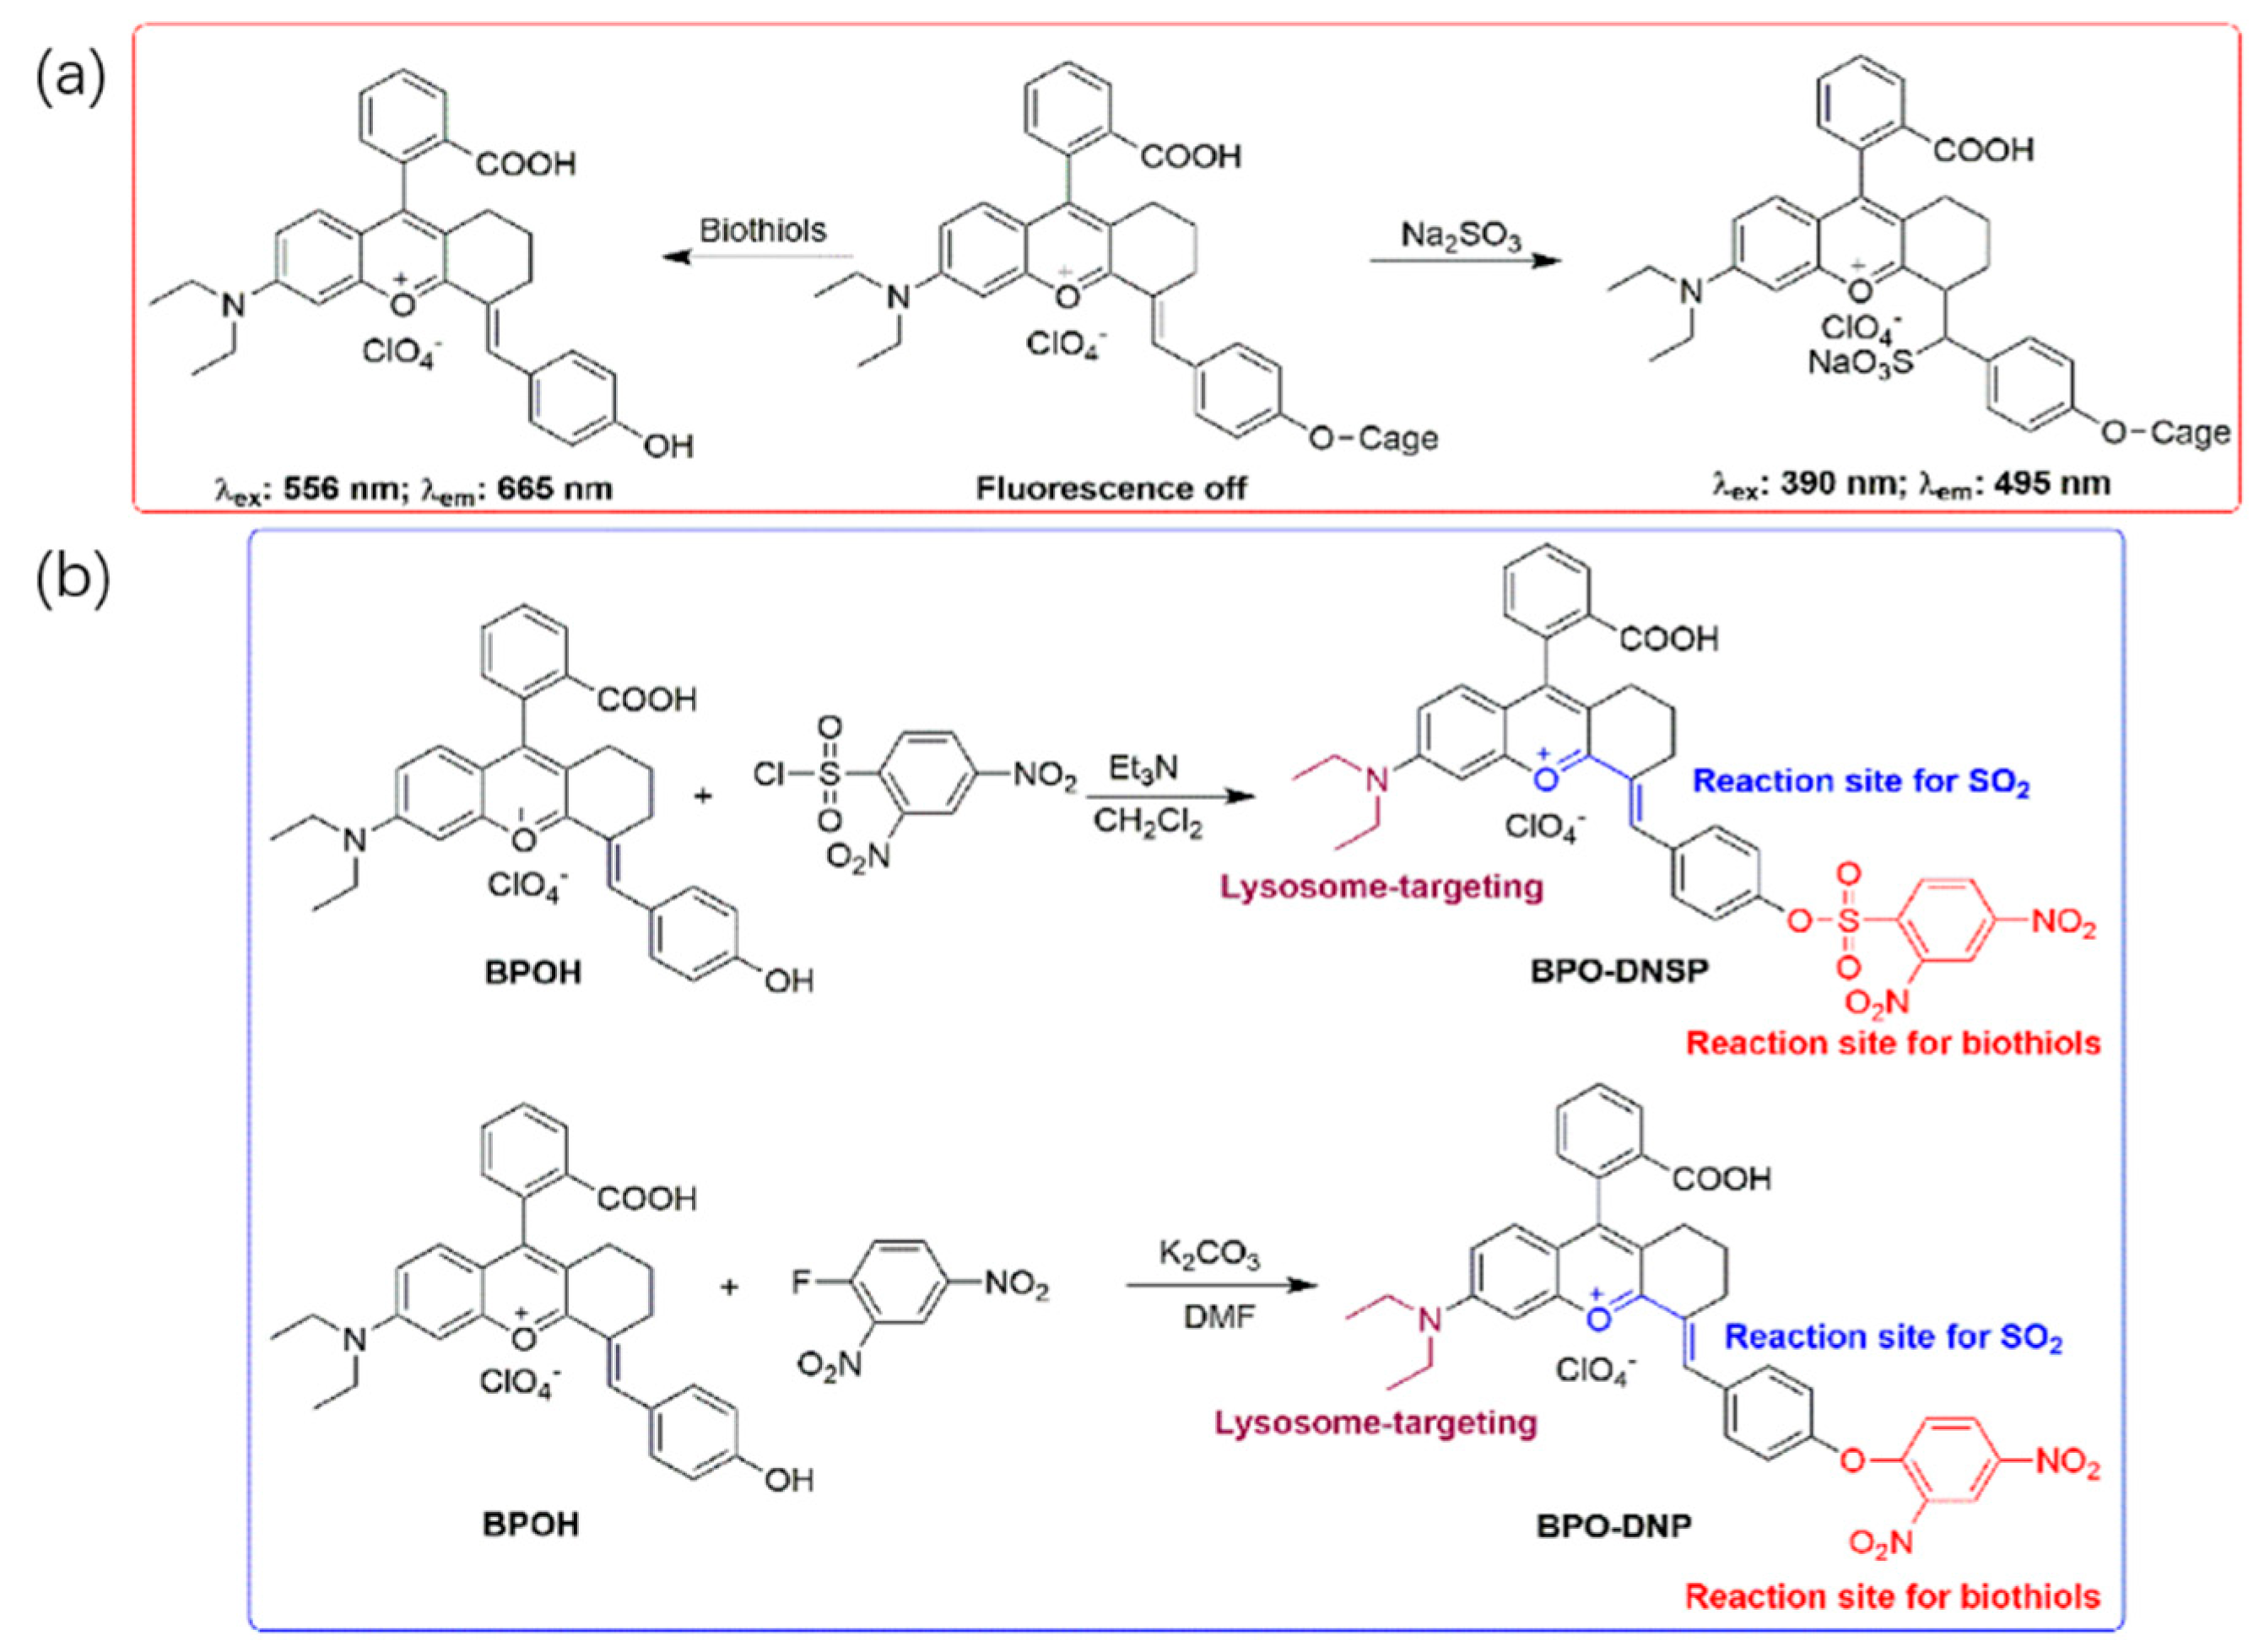
Frequently, strong, electron-withdrawing groups such as 2,4-dinitrofluorobenzene or 2,4-dinitrobenzenesulfonyl chloride were often used to cage the phenolic hydroxyl of chromophore and could be cleaved through a nucleophilic substitution reaction by thiols to release the fluorescence [38,39,40,41]. Meanwhile, the carbon–carbon double bond linked with strong electron-withdrawing groups was frequently used as a recognition site for SO2 [42,43,44,45,46,47]. Bearing these facts in mind, chromenylium with a phenolic hydroxyl group (BPOH) was a rational design caged with 2,4-dinitrobenzenesulfonyl chloride and 2,4-dinitrofluorobenzene to synthesize BPO-DNSP and BPO-DNP, respectively, as depicted in Scheme 1. Moreover, the caging group can regulate the charge distribution of the carbon–carbon double bond, which can improve the sensitivity and selectivity for SO2 detection. At the same time, the necessary molecular decoration for lysosome targeting was incorporated via the N,N-diethyl group according to the literature [33,48,49,50]. Thus, BPO-DNSP and BPO-DNP were synthesized (Scheme 1b) and anticipated to separate the response of SO2 and biothiols in lysosomes from distinct fluorescent signals with high sensitivity and selectivity. The structures of BPO-DNSP and BPO-DNP were characterized by 1H NMR, 13C NMR, and HRMS.

2.2. Separate Response of Probes to SO2 and Biothiols in Different Channels

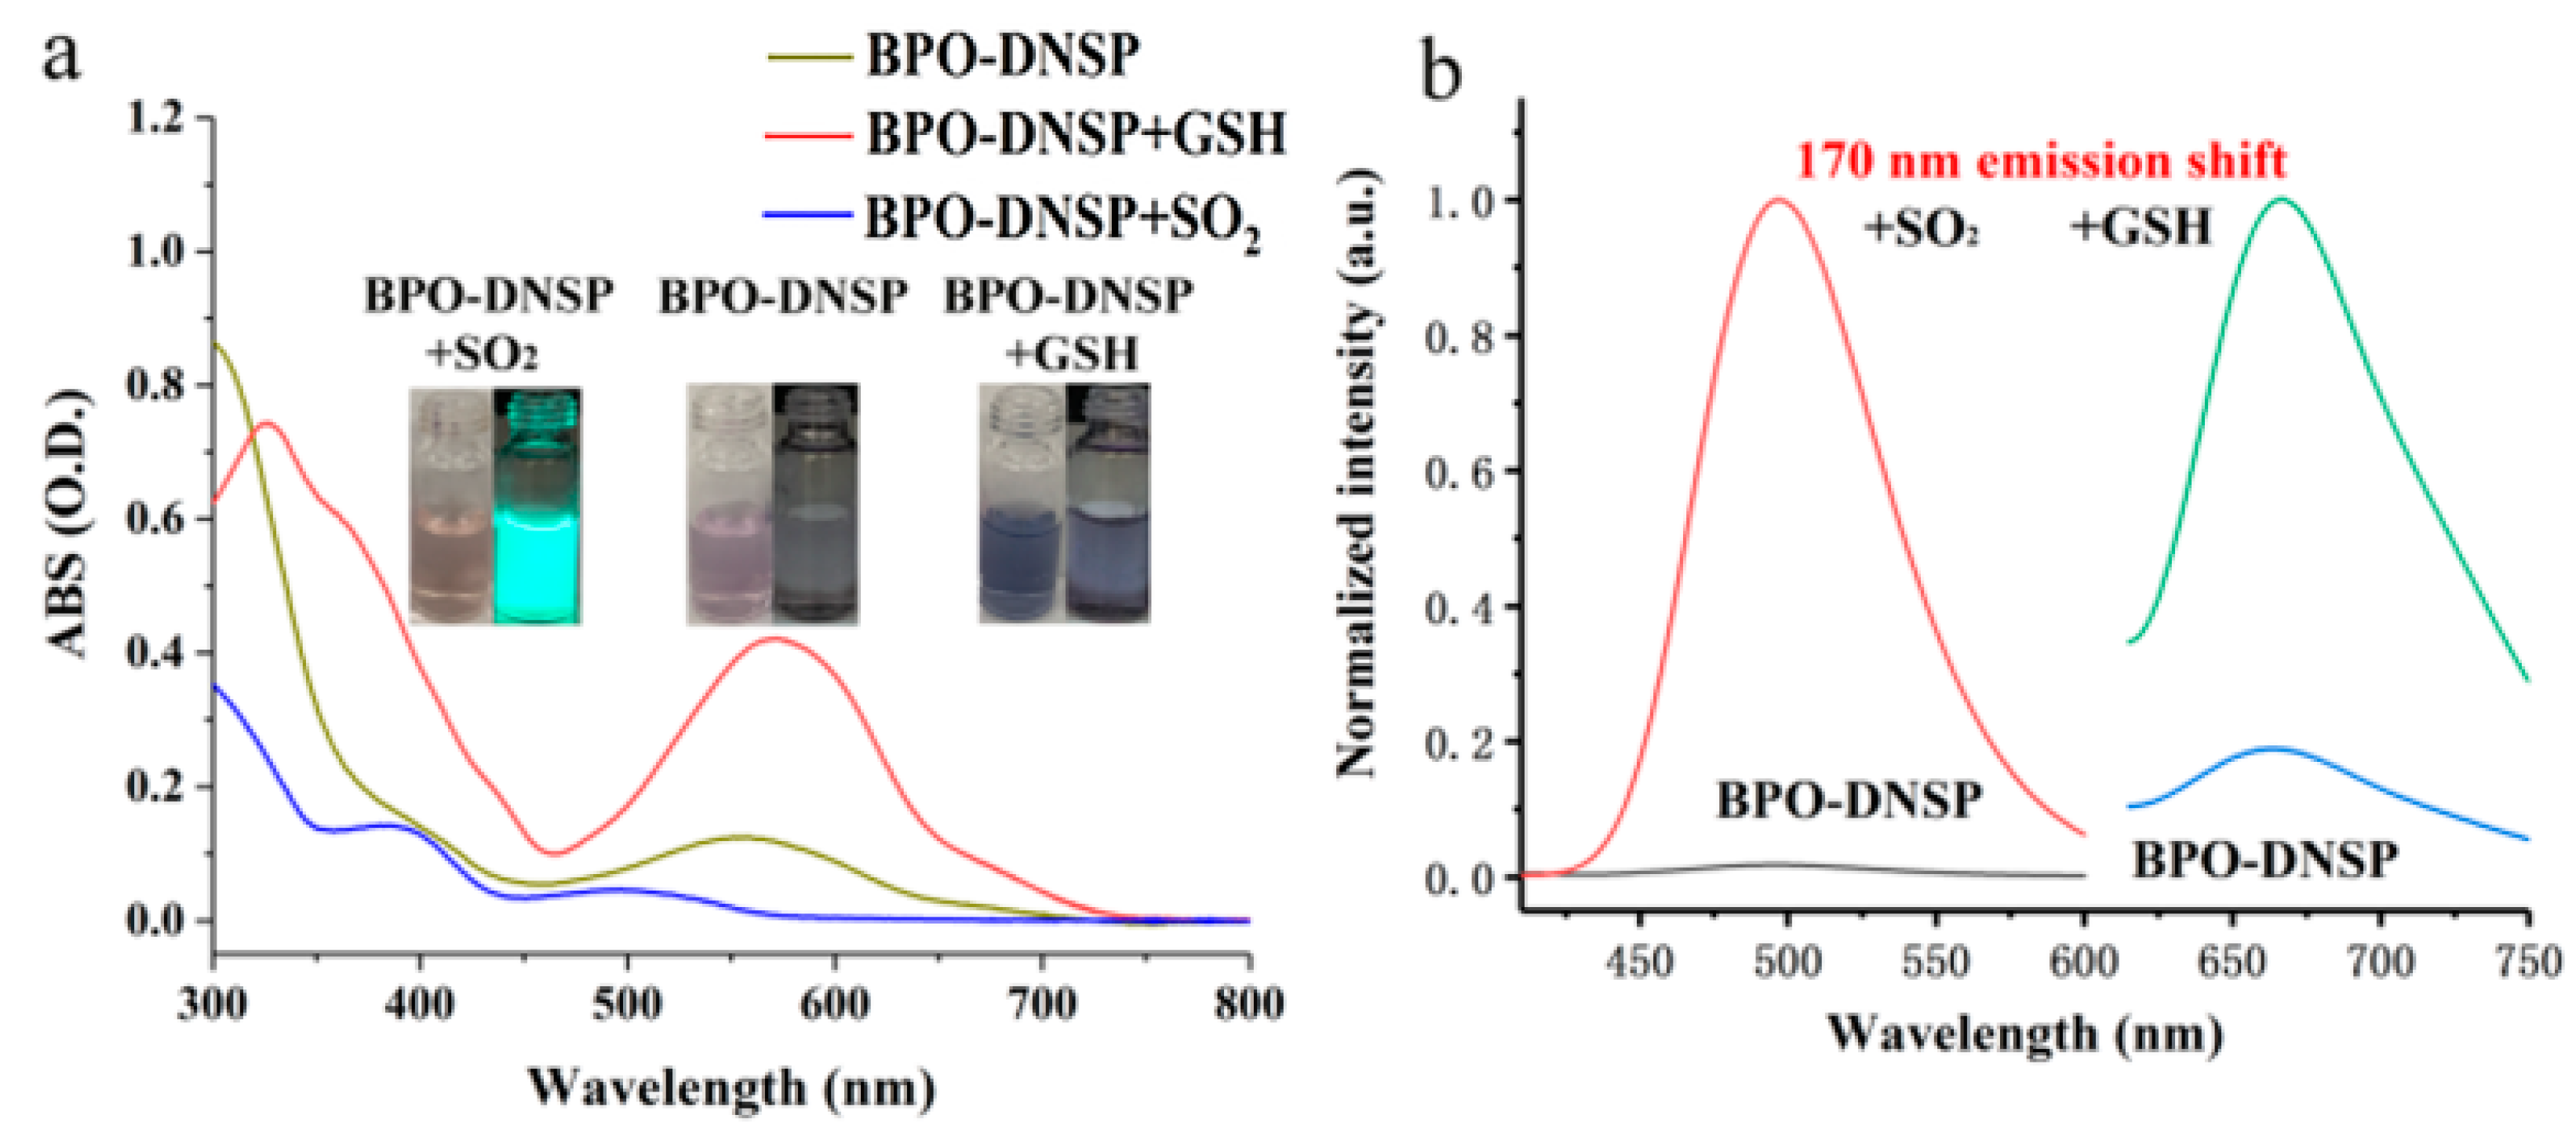
UV-vis absorption and fluorescence spectra were explored to evaluate the optical response of BPO-DNSP or BPO-DNP to SO2 and biothiols in different channels. BPO-DNSP showed a maximum absorption peak at approximately 556 nm in a phosphate-buffered saline (PBS) and dimethylsulfoxide (DMSO) mixture solution (8:2, v/v). After the addition of 500 μM SO2, the 556 nm absorption peaks shifted to 500 nm (Figure 1a), which suggested that SO2 indeed reacted with BPO-DNSP and broke the conjugated system. As a comparison, after adding 500 μM GSH, the absorption peak shifted from 556 nm to 566 nm and was accompanied by an increased absorption intensity (Figure 1a).
Thereafter, the fluorescence responses of BPO-DNSP to SO2 and biothiols in the same system were investigated. As depicted in Figure 1b, BPO-DNSP showed almost no fluorescence at 495 nm and 665 nm with the excitation at 390 nm and 556 nm, respectively. The fluorescence quantum yields were 0.003 and 0.0026 using fluorescein as a reference (Φs = 0.85 in 0.1M NaOH aqueous solution). However, after treatment with SO2, the emission intensity centred at 495 nm increased significantly (Figure 1b), with green fluorescence increasing observably under 365 nm excitation UV light (Figure 1a) and the quantum yield increasing up to 0.664. On the other hand, after treatment with GSH, the emission intensity at 665 nm enhanced (Figure 1b), with the color of the solution changing to dark purple under visible light (Figure 1a) and the fluorescence quantum yield increasing up to 0.0315.
As for BPO-DNP, it revealed similar response to SO2 in absorption and emission spectra (Figures S1 and S2). However, there were almost no absorption or fluorescence changes when treated with GSH or other biothiols, respectively (Figures S1 and S3). It indicated that BPO-DNP could only detect SO2, while BPO-DNSP could detect SO2 in the green channel with a 105 nm Stokes shift, and biothiols in the near-infrared emission channel with an approximate 109 nm Stokes shift. The emission shift for the two channels was as high as 170 nm, which was favorable for fluorescence imaging in living cells. From the aforementioned results, we can infer that fluorophore caging with a sulfonate bond revealed better reactivity and sensitivity toward biothiols compared with an ether bond.

2.3. Optical Response of BPO-DNSP to SO2 and Biothiols

The optical properties of BPO-DNSP to detect SO2 and biothiols were inspected in detail. As shown in Figure S4, the fluorescent intensities of BPO-DNSP at 495 nm almost had no change in the pH range from 4.0 to 10.0. However, once 500 μM SO2 was added, the 495 nm fluorescence intensity increased dramatically when the pH increased from 4.0 to 8.0. A further increase in the pH to 10.0 led to a gradual decrease in fluorescence intensity. Therefore, pH 8.0 was chosen to be the optimal condition.
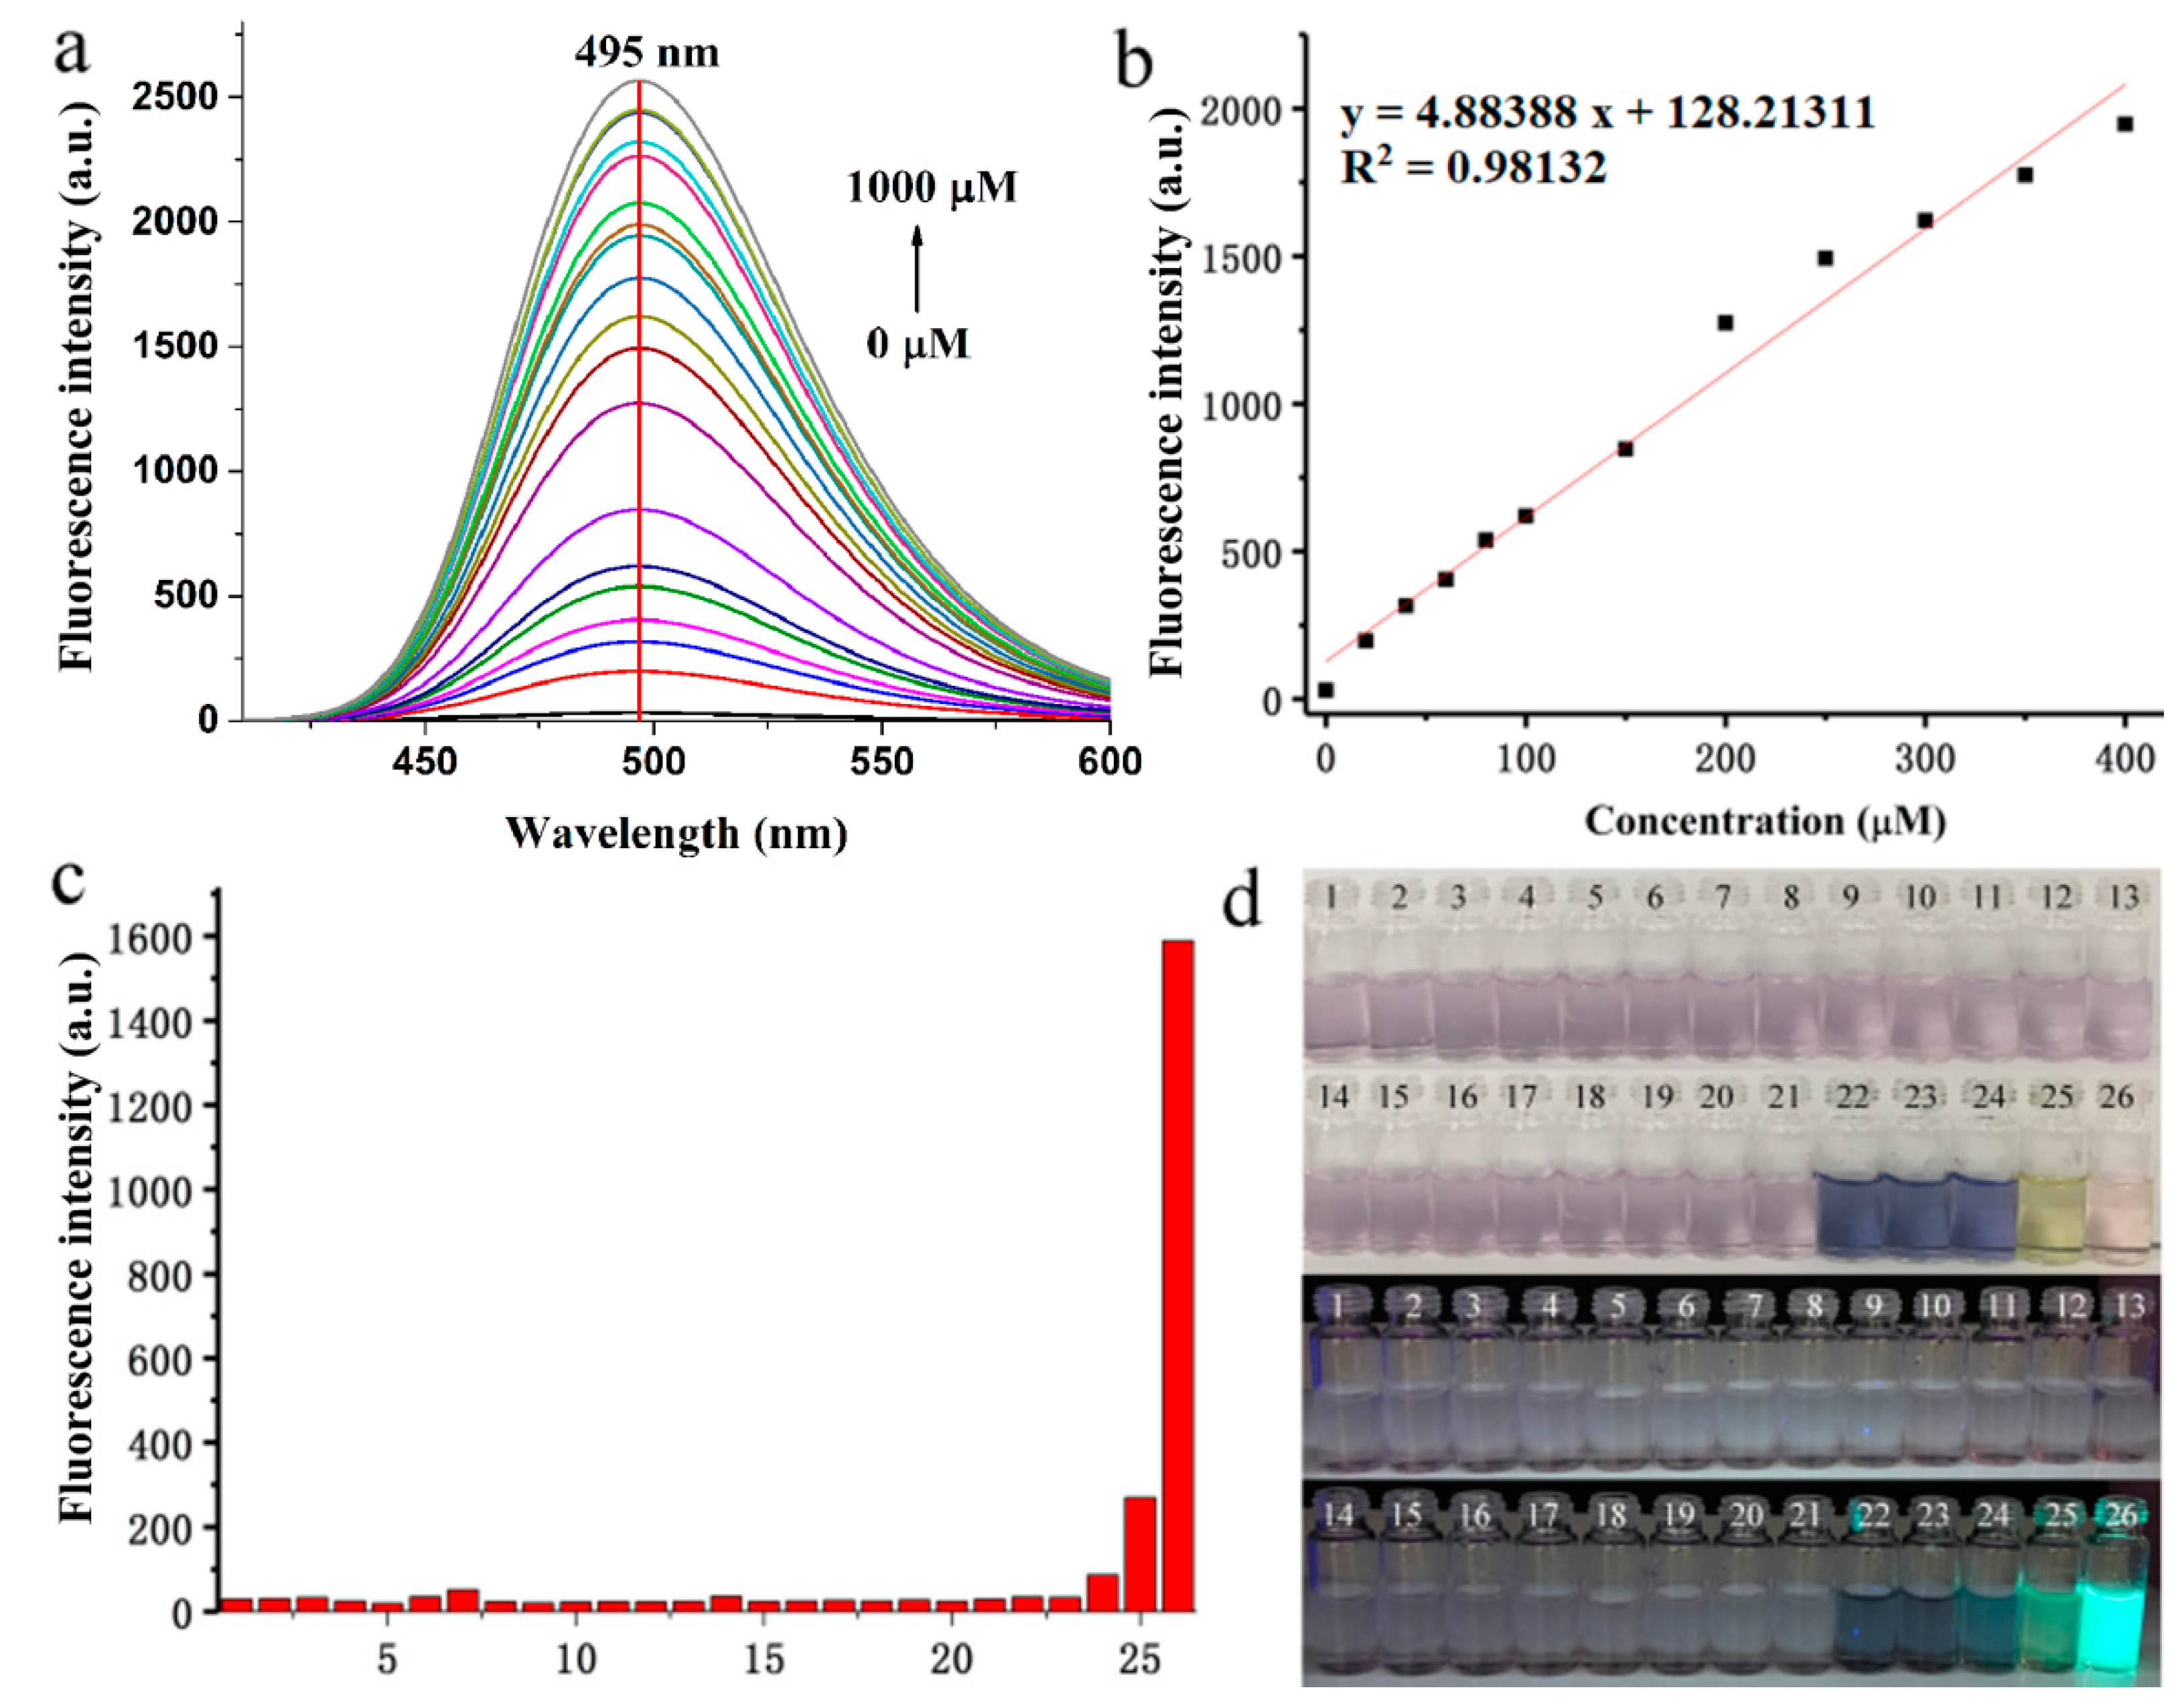
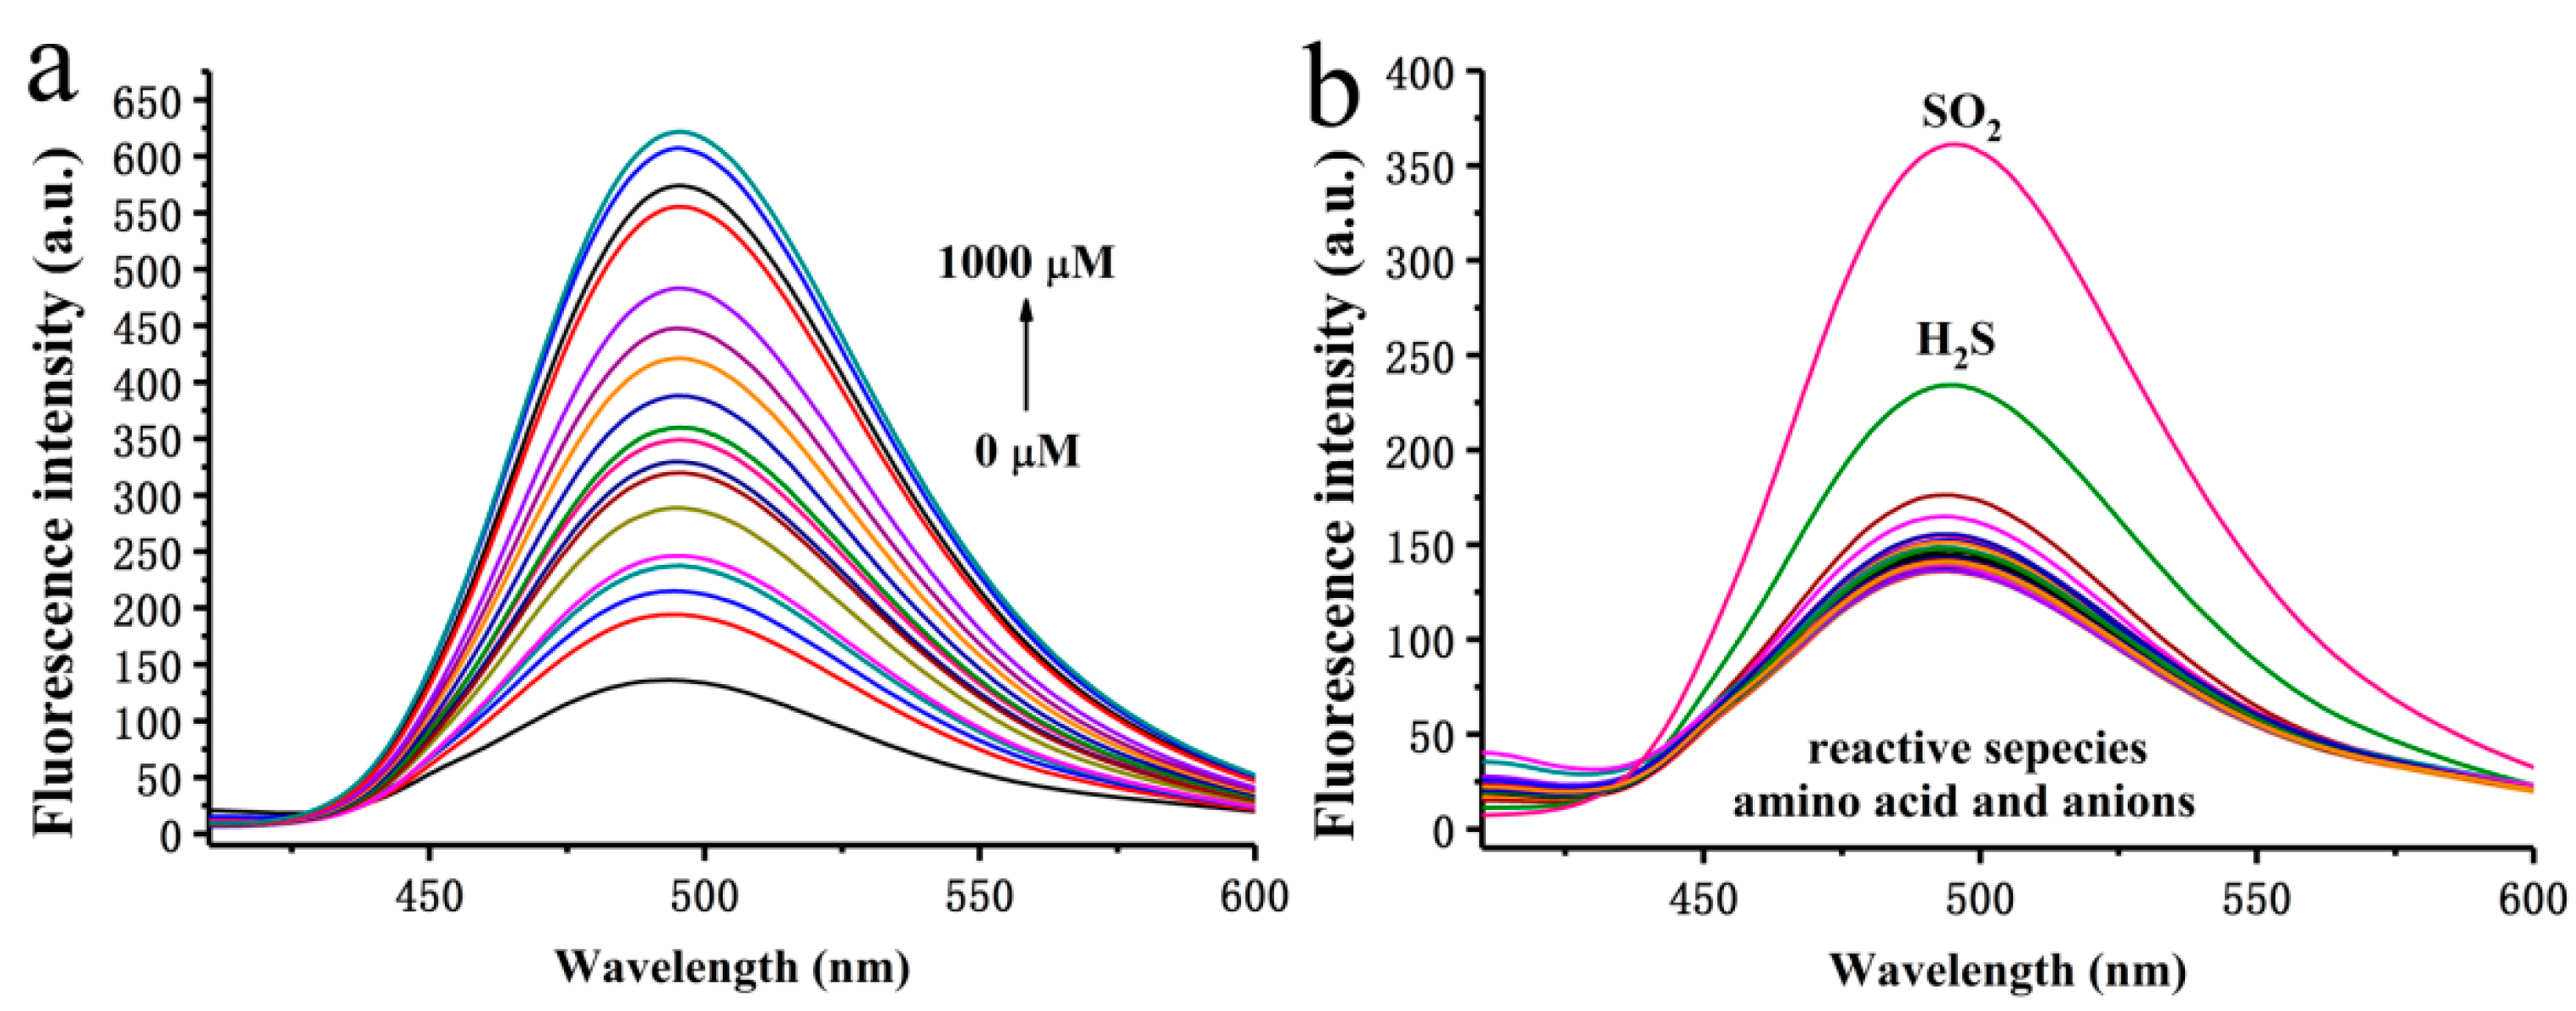
Figure 2 showed that the addition of SO2 from 0 to 1000 μM induced the intensity of fluorescence at 495 nm to increase gradually (Figure 2a,b), demonstrating up to an 86-fold enhancement with/without SO2. The fluorescence intensity of the probe BPO-DNSP showed a linear relationship with SO2 concentration ranges from 0 to 400 μM. A 149.3 nM detection limit was observed. As shown in the kinetic studies (Figure S5), the fluorescence at 495 nm remained constant within about 2 h after a reaction with excess SO2. The selectivity of BPO-DNSP towards SO2 at 495 nm over other species was then evaluated. It was observed that SO2 showed a remarkable fluorescence enhancement, while other biological molecules such as amino acids (Ala, Arg, Asp, Glu, Gly, His, Ile, Leu, Lys, Met, Phe, Pro, Ser, Val), reactive oxygen species (NaClO, H2O2, TBHP), reactive nitrogen species (NO2 and NO3), and other reactive sulfur species (SO42−, H2S, Cys, HCy, and GSH) led to negligible fluorescence changes. In addition, only SO2 induced a strong green fluorescence enhancement under 365 nm UV light, as shown in Figure 2d.
The 665 nm fluorescence intensity of BPO-DNSP showed to be almost constant, with pH increasing from 4.0 to 10.0 (Figure S6). Once 500 μM GSH was added, the fluorescence intensity firstly increased and reached a maximum at pH 6.0, then decreased with continuous increase in pH. Therefore, pH 6.0 should be the optimal pH value for detecting biothiols in the near-infrared region. As we know, biothiols were widespread in living cells with a concentration in the millimolar range [2,9], while the concentration of SO2 was much lower than that. With the aim to detect intracellular SO2 and biothiols with BPO-DNSP under the same conditions, pH 8.0 was chosen as the detection condition for both SO2 and biothiols.
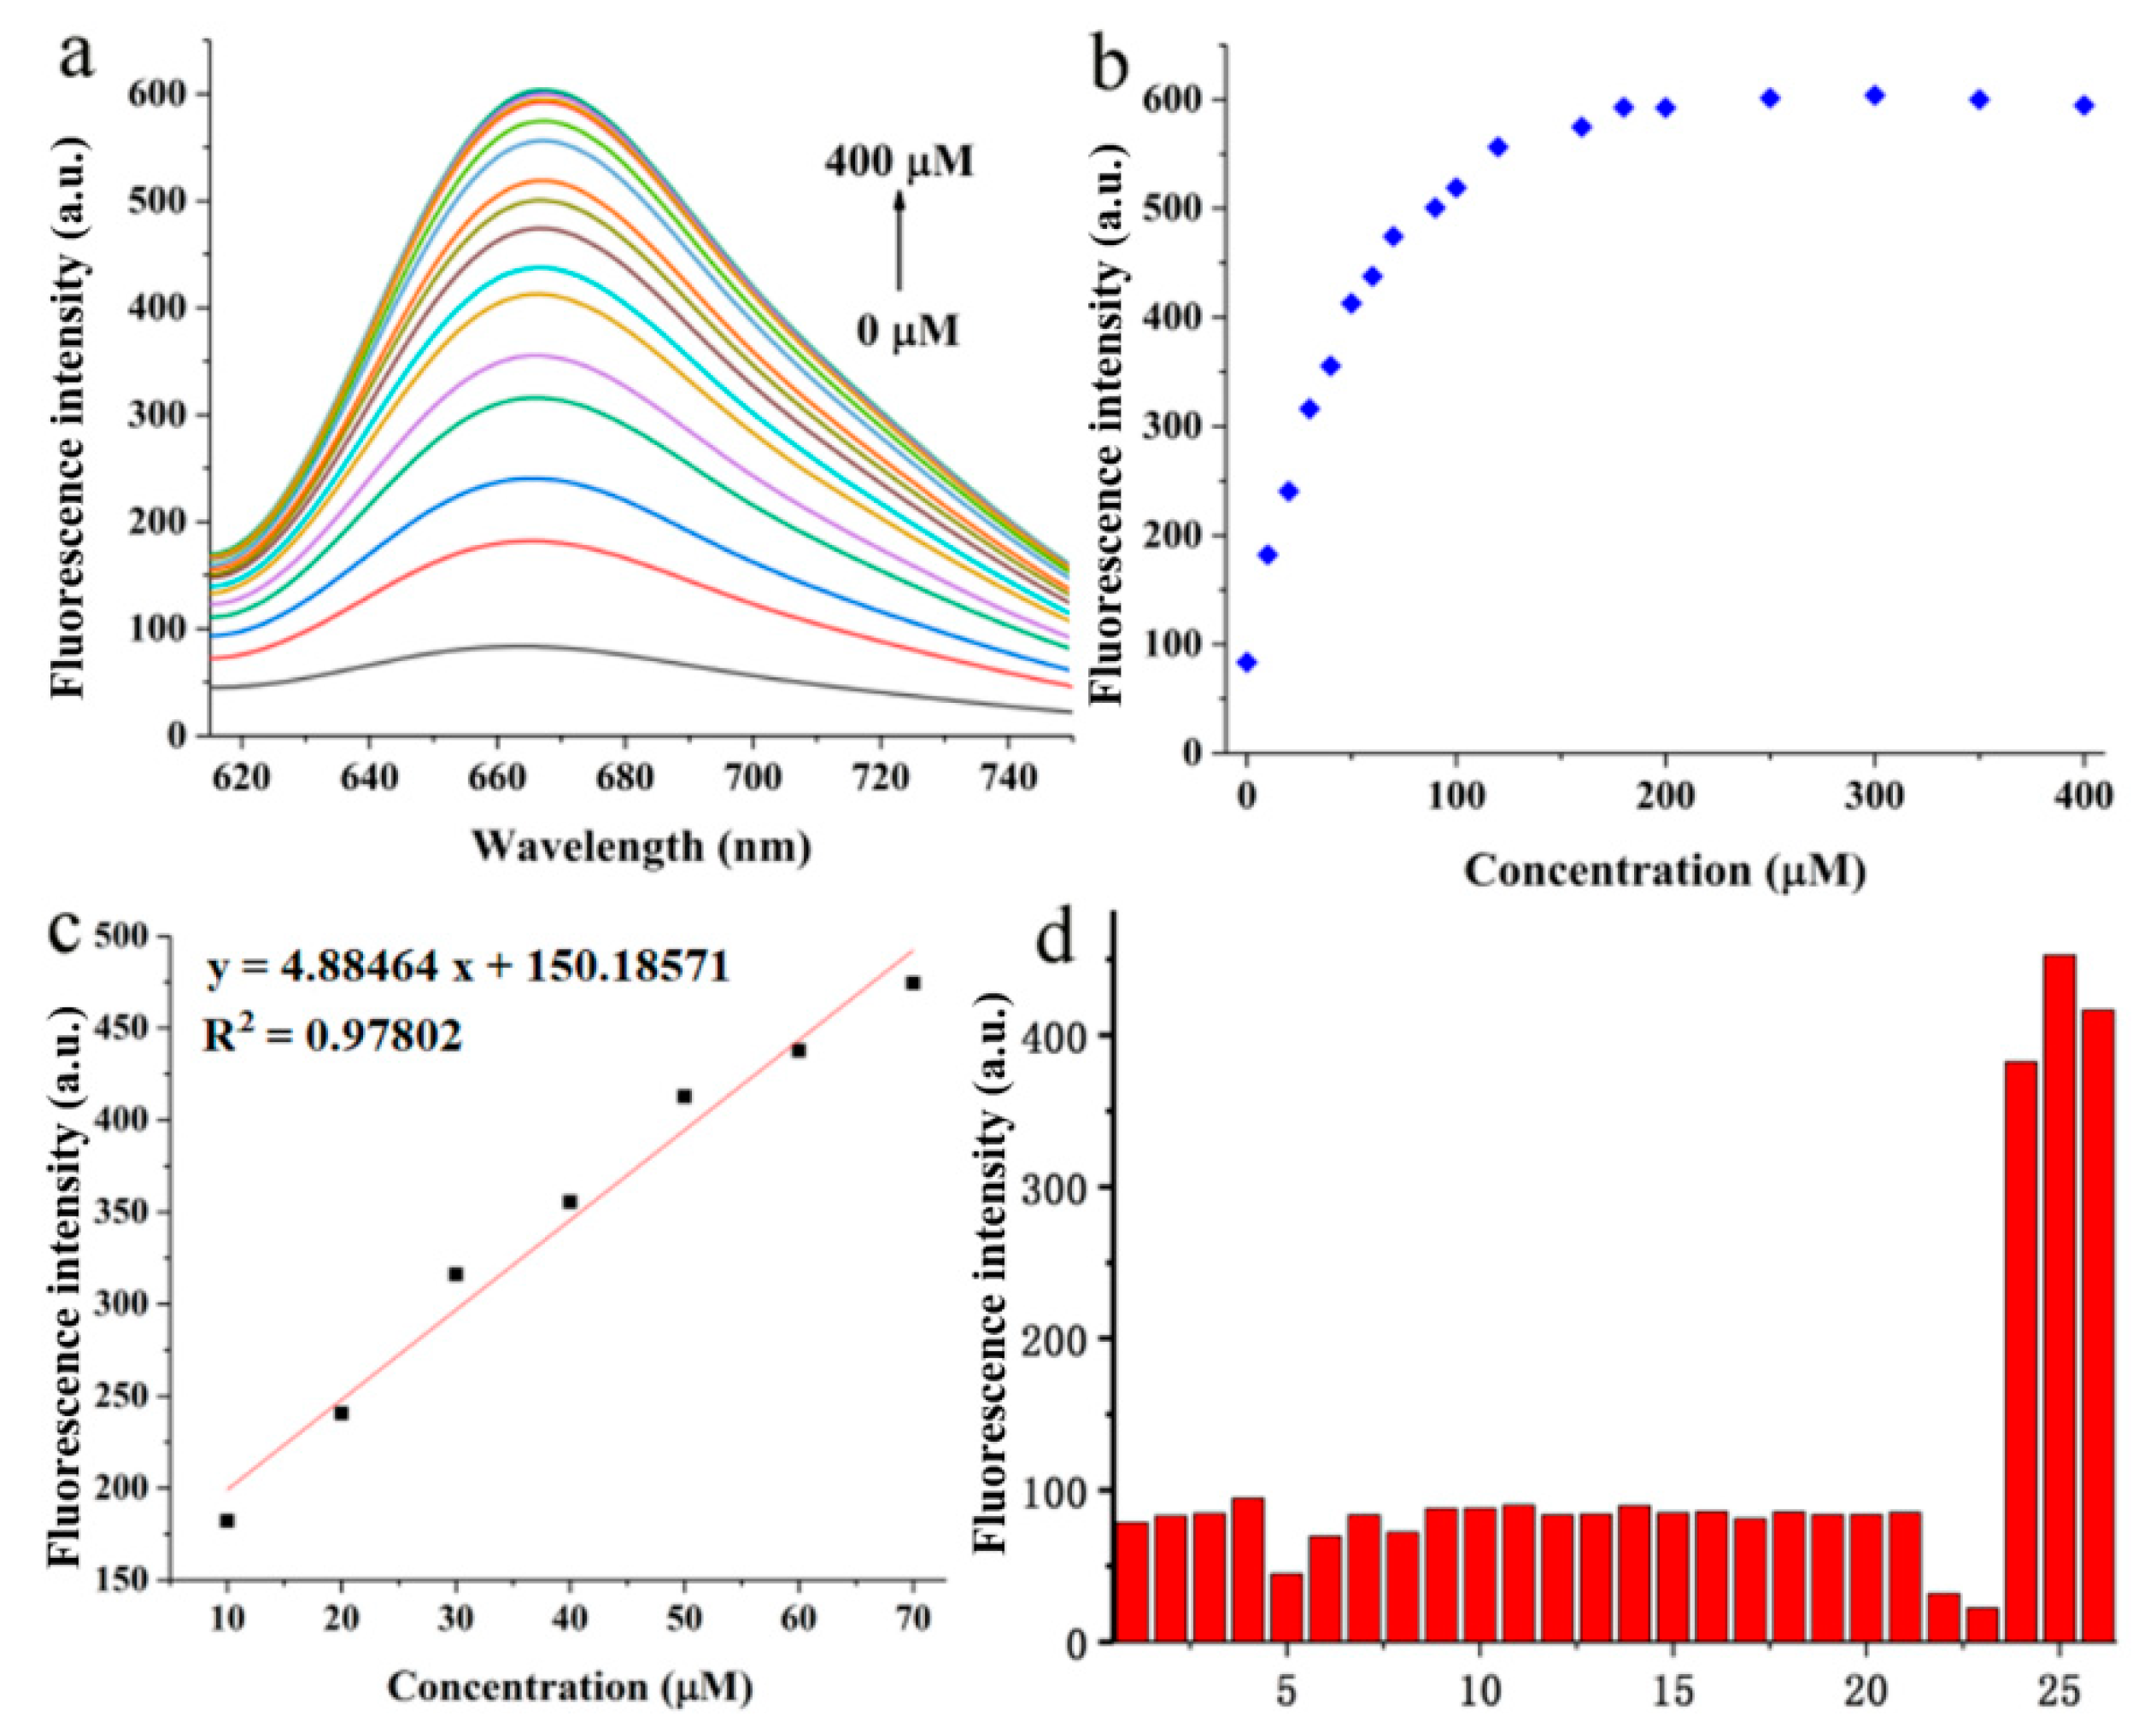
When GSH concentration increased from 0 to 200 μM, the 665-nm fluorescence intensity increased gradually as shown in Figure 3a. The intensity enhancement factor was 7.22, and the detection limit was 276.8 nM (Figure 3b). Kinetic studies (Figure S7) demonstrated that the fluorescence of BPO-DNSP reached the maximum within 15 min when reacted with 500 μM GSH. BPO-DNSP also exhibited good selectivity for biothiols at 665 nm (Figure 3d and Figure S8), which displayed no increase in other biological molecules (Ala, Arg, Asp, Glu, Gly, His, Ile, Leu, Lys, Met, Phe, Pro, Ser, Val, NaClO, H2O2, TBHP, NO2 and NO3, SO42−, H2S, SO2). Furthermore, only biothiols induced a color change from purple to dark purple under visible light (Figure 2d).

2.4. Optical Response of BPO-DNP to SO2

With the excitation at 390 nm, BPO-DNP (10 μM) showed a gradual increase following the addition of SO2 with a concentration from 0 to 1000 μM (Figure 4a), with an intensity enhancement factor of 4.6. The fluorescence quantum yield of BPO-DNP increased from 0.009 to 0.038. An excellent linearity between the fluorescence intensity and SO2 concentration (20–200 μM) could be observed (Figure S9), and the detection limit was calculated to be 1.58 μM. The selectivity of BPO-DNP to SO2 over other species was investigated in Figure 4b. Nevertheless, other than SO2, H2S also evidently enhanced the fluorescence intensity, which implied a bad selectivity of BPO-DNP towards SO2 (Figure 4b).

2.5. Fluorescence Imaging of SO2 and Biothiols in Living Cells

The applicability of BPO-DNSP for intracellular imaging of SO2 and biothiols was evaluated with HeLa cells. First, a standard cell counting kit-8 (CCK-8) assay was conducted with HeLa cells at different concentrations (Figures S10 and S11). Compared to BPO-DNP, BPO-DNSP exhibited more favorable biocompatibility. More than 85% of the cells survived when incubated with 10 μM BPO-DNSP for 24 h, suggesting that the probe could be used for imaging applications in living cells. In contrast, only about 65% of the cells survived when treated with 10 μM BPO-DNP for 24 h.
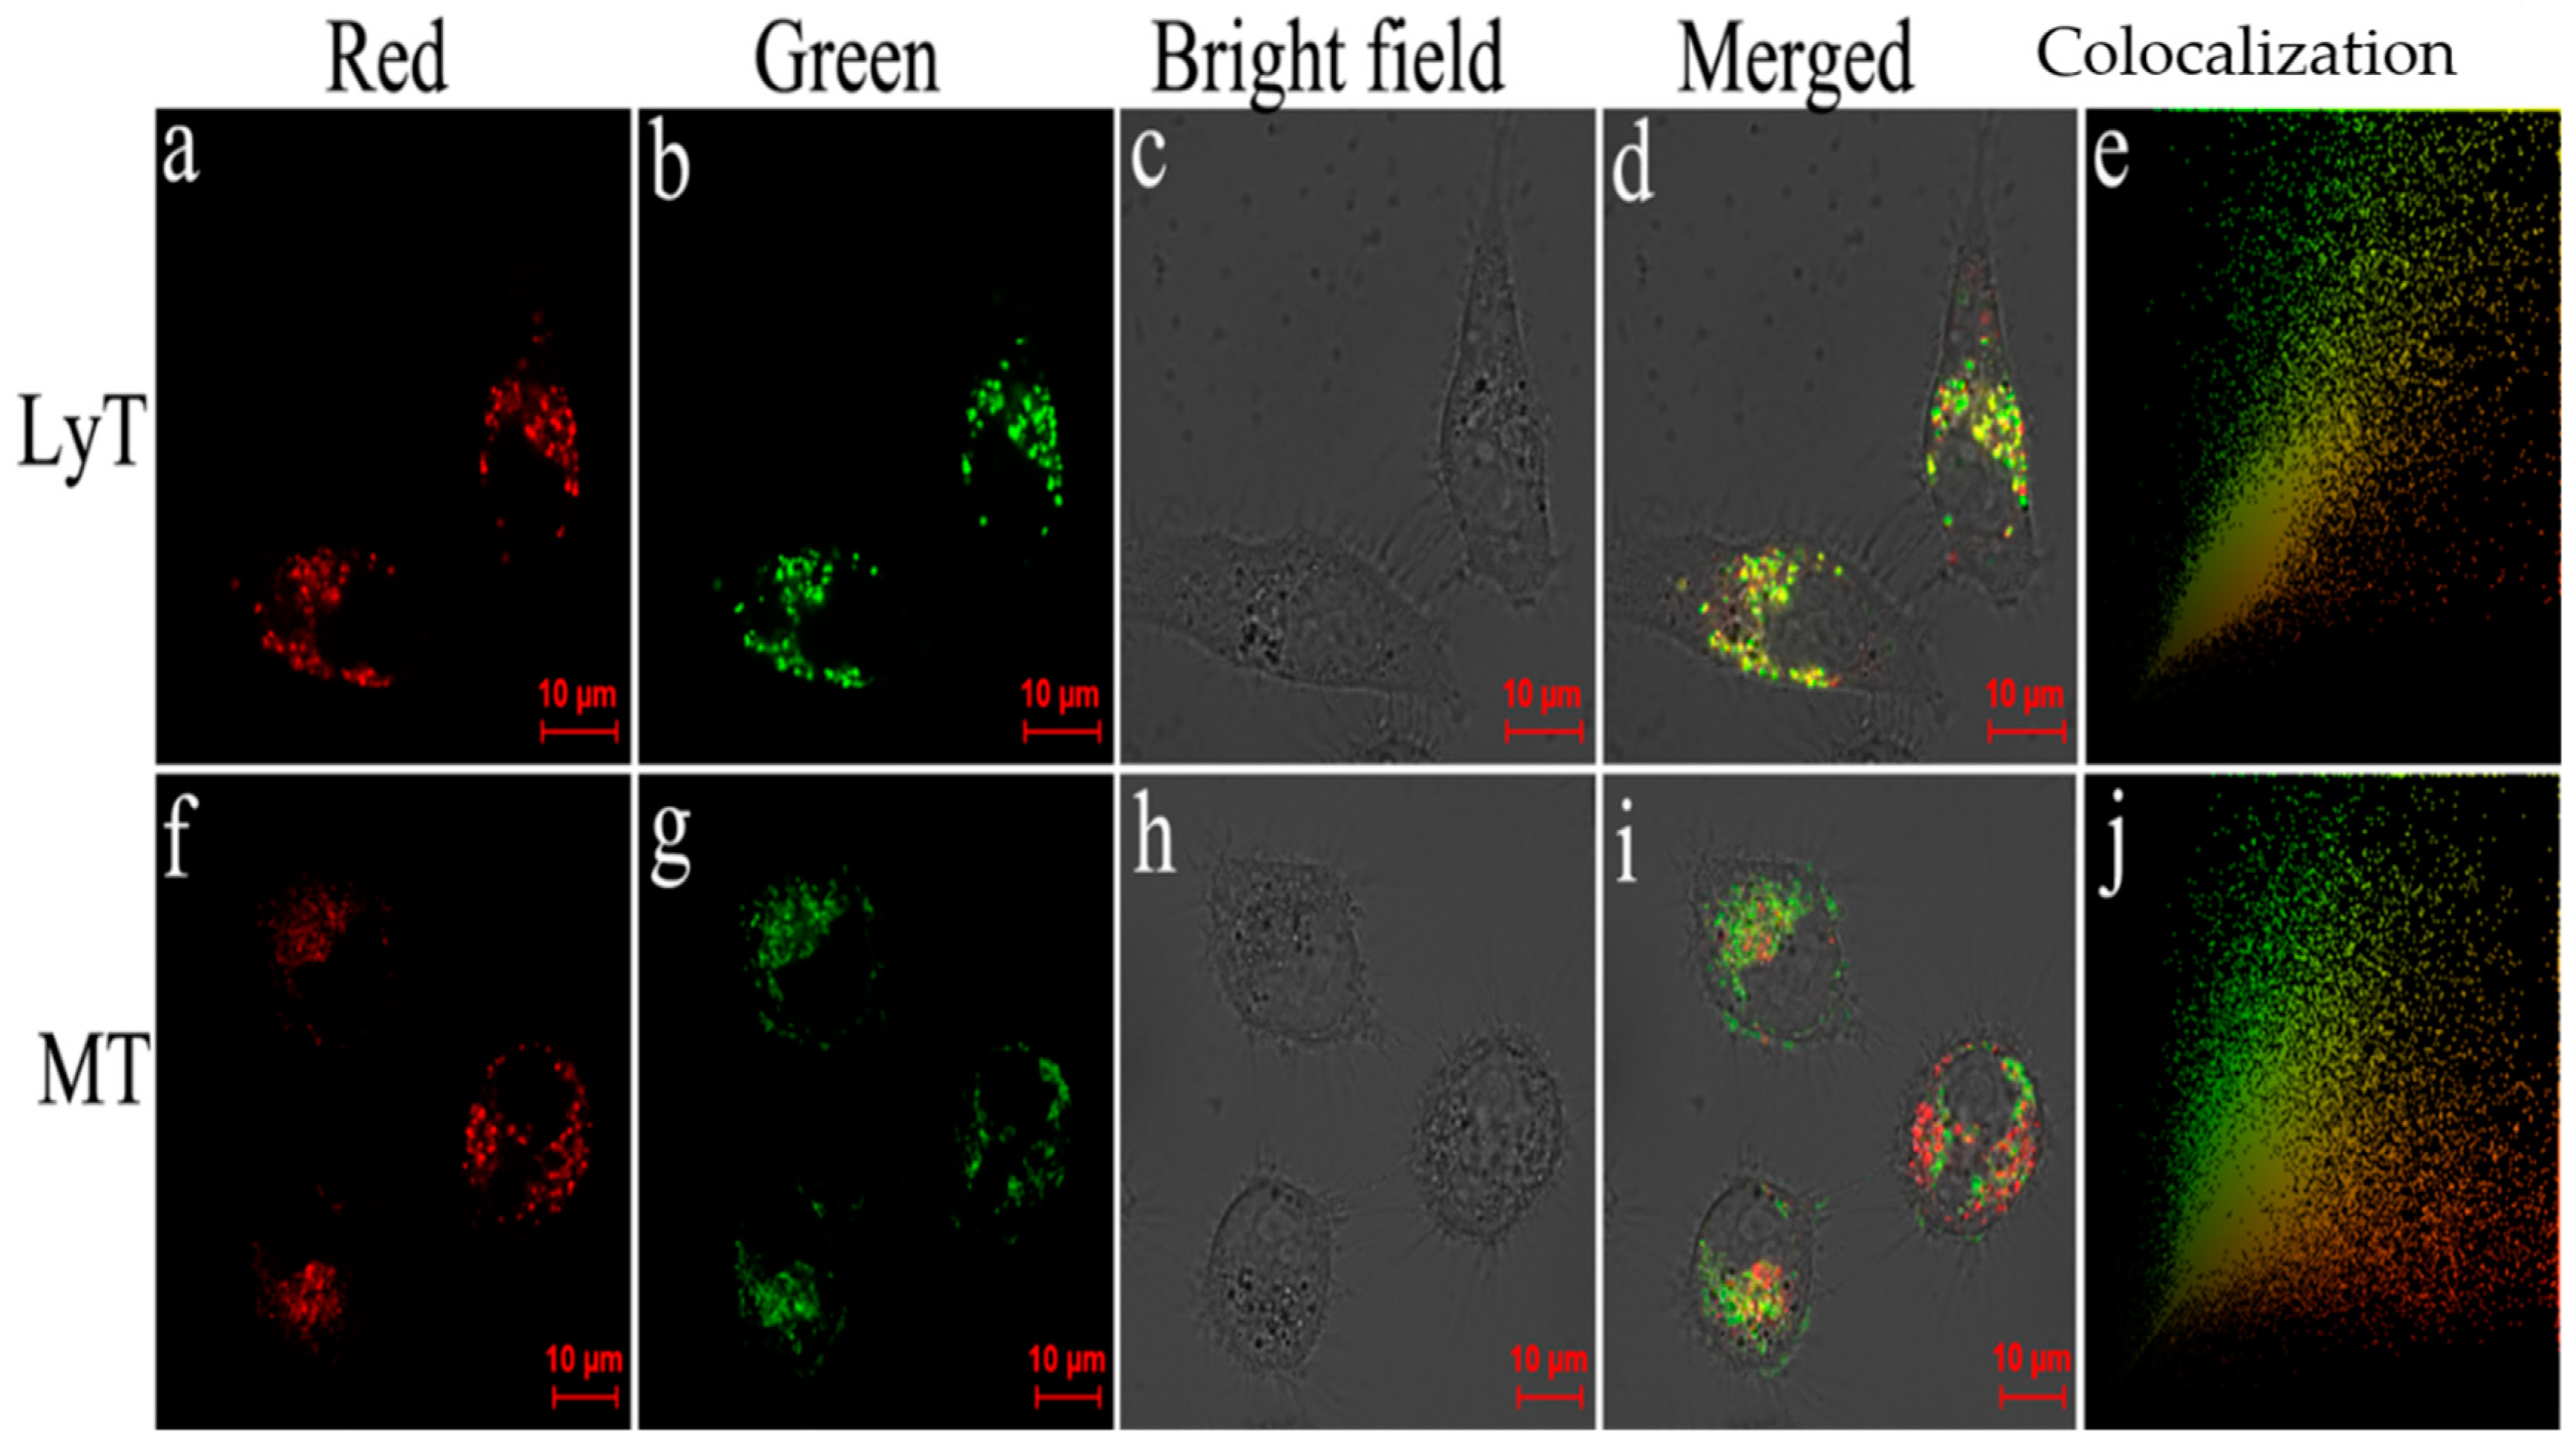
Colocalization experiments were then performed to confirm the lysosome-specific capability of BPO-DNSP. When the HeLa cells were incubated with BPO-DNSP at 37 °C for 30 min, a strong emission in the red channel was observed, indicating that BPO-DNSP could detect intracellular biothiols (detailed result can be found in Figure 5). Then, the HeLa cells were incubated with BPO-DNSP and commercial lysosome targeting (LyT, Figure 6a–e and Figure S12) or mitochondrial-targeting (MT, Figure 6f–j and Figure S13), green, fluorescent probes. The green fluorescence was emitted from Lyt or MT, and red fluorescence was ascribed to BPO-DNSP. The Pearson’s correlation coefficient of red fluorescence with Lyt was 0.87 and 0.57 for MT, indicating that BPO-DNSP could specifically target lysosomes in living HeLa cells.
Ultimately, fluorescence imaging of biothiol and SO2 was explored in living cells. As shown in Figure 5, HeLa cells with BPO-DNSP that were incubated for 30 min at 37 °C displayed almost no fluorescence in the green channel (Figure 5a), but they showed strong fluorescence in the red channel (Figure 5b). When the cells were pretreated with NEM (Figure 5e–h) for 30 min and further incubated with BPO-DNSP for another 30 min, HeLa cells exhibited a significant decrease in fluorescence in the red channel (Figure 6f) under the same image acquisition, indicating that BPO-DNSP could detect intracellular biothiols. At the same time, the green fluorescence ascribed to SO2 (Figure 5e) increased in contrast with Figure 5a, which demonstrates the potential to monitor endogenous SO2 production and the conversion from biothiols to SO2 without adding exogenous enzymes. If the cells were further treated with 500 μM exogenous SO2 for another 30 min (Figure 5i–l), the fluorescence in the green channel (Figure 5i) dramatically increased. These results indicated that BPO-DNSP could not only be used to image intracellular SO2 and biothiols from two different emission channels, but also provide a possible way to monitor the production of endogenous SO2 and the conversion from biothiols to SO2 without adding exogenous enzymes to living cells.

3. Experimental

3.1. Materials and Instruments

All chemical reagents were purchased from Energy Chemical and used without further purification. Na2SO3 was used as the source of SO2. All solvents for optical spectroscopic studies were high-pressure, liquid-chromatography grade. Thin-layer chromatography (TLC) analyses were performed on silica gel GF 254, while column chromatographic purifications were conducted over silica gel (300–400 mesh). UV-visible absorption spectra were obtained with a Hitachi PharmaSpec UV-1900 UV-visible spectrophotometer. A Hitachi F7000 spectrofluorometer was utilized to acquire the fluorescence spectra. A Bruker Daltonics Bio time-of-flight mass spectrometer was employed for high-resolution mass spectra. 1H NMR (600 MHz) and 13C NMR (150 MHz) spectra were recorded on a Bruker AMX-600 using tetramethyl silane (TMS) as the internal reference. Confocal fluorescent images were recorded with a Zeiss LSM 780 confocal laser scanning microscope.

3.2. Synthesis of BPO-DNSP and BPO-DNP

BPOH was synthesized according to the literature [51]. BPO-DNSP: 96 mg BPOH (0.2 mmol), 100 mg Et3N (1.0 mmol), and 10 mL dichloromethane were added to a 25-mL round-bottom flask. 64 mg (0.24 mmol) 2,4-dinitrobenzenesulfonyl chloride in 2 mL dichloromethane were added dropwise to the above mixture at 0 °C with vigorous stirring. The mixture was further stirred at 0 °C for 0.5 h and at room temperature for another 3 h. Then, 50 mL of DCM was added to the reaction mixture, and the mixture was washed with 50 mL water for three times. The organic layer was collected and dried with sodium sulfate. Subsequently, the solvent was removed under reduced pressure in a rotary evaporator. The crude product was purified via silica-gel column chromatography with DCM to DCM/MeOH (20/1, v/v) to obtain 52 mg dark purple solid (32% yield). 1H NMR (600 MHz, CDCl3), 8.86 (d, 1H, J = 1.8 Hz), 8.50 (dd, 1H, J = 2.4 Hz, J = 9.0 Hz), 8.22 (d, 1H, J = 8.4 Hz), 7.95 (d, 1H, J = 7.8 Hz), 7.65 (t, 1H, J = 7.2 Hz), 7.56 (t, 1H, J = 7.2 Hz), 7.37 (d, 2H, J = 8.4 Hz), 7.31 (s, 1H), 7.21 (t, 3H, J = 8.4 Hz), 6.48 (d, 2H, J = 9.0 Hz), 6.38 (d, 1H, J = 2.4 Hz), 6.35 (dd, 1H, J = 2.4 Hz, J = 9.0 Hz), 3.35 (q, 4H, J = 7.2 Hz), 2.73–2.70 (m, 1H), 2.57–2.53 (m, 1H), 2.05–2.03 (m, 1H), 1.65–1.60 (m, 3H), 1.18 (t, 6H, J = 7.2 Hz). 13C NMR (125 MHz, CDCl3), 170.0, 152.3, 152.2, 150.9, 149.4, 149.0, 147.3, 146.5, 137.5, 134.6, 134.0, 133.7, 132.0, 131.2, 129.4, 128.6, 127.6, 126.4, 125.0, 123.5, 123.3, 121.8, 120.3, 109.0, 108.9, 104.7, 97.1, 44.4, 27.1, 23.0, 22.3, 12.6. HRMS (ESI): m/z [M]+ calculated for C37H32N3O10S+: 710.1803; found 710.1798.
BPO-DNP: 96 mg (0.2 mmol) BPOH was dissolved in 5 mL dimethyl formamide. Then, 44.6 mg (0.24 mmol) 2,4-dinitrofluorobenzene and 110 mg K2CO3 (0.8 mmol) were added respectively. After being stirred for 5 h at 50 °C, the solvent was removed under reduced pressure in a rotary evaporator. The crude product was purified via silica-gel column chromatography with DCM to DCM/MeOH (20/1, v/v) to obtain 71.6 mg dark purple solid (48% yield). 1H NMR (600 MHz, CDCl3), 8.86 (d, 1H, J = 2.4 Hz), 8.34 (dd, 1H, J = 2.4 Hz, J = 9.0 Hz), 7.96 (d, 1H, J = 7.8 Hz), 7.66 (t, 1H, J = 7.2 Hz), 7.56 (t, 1H, J = 7.2 Hz), 7.50 (d, 2H, J = 8.4 Hz), 7.38 (s, 1H), 7.24 (t, 1H, J = 7.8 Hz), 7.15 (d, 2H, J = 8.4 Hz), 7.11 (d, 1H, J = 9.0 Hz), 6.49 (d, 1H, J = 8.4 Hz), 6.42 (d, 1H, J = 1.8 Hz), 6.36 (dd, 1H, J = 2.4 Hz, J = 9.0 Hz), 3.37 (q, 4H, J = 7.2 Hz), 2.82–2.79 (m, 1H), 2.65–2.62 (m, 1H), 2.08–2.05 (m, 1H), 1.71–1.62 (m, 3H), 1.18 (t, 6H, J = 7.2 Hz). 13C NMR (125 MHz, CDCl3), 170.0, 156.1, 152.5, 152.2, 152.1, 149.4, 146.6, 141.5, 139.6, 135.9, 134.6, 131.7, 131.6, 129.3, 128.9, 128.6, 127.6, 125.0, 123.5, 123.4, 122.2, 120.3, 118.6, 108.8, 108.6, 104.5, 97.2, 44.4, 27.2, 23.0, 22.4, 12.6. HRMS (ESI): m/z [M]+ calculated for C37H32N3O8+: 646.2184; found 646.2185.

3.3. Absorption and Fluorescence Spectra Measurement

All the test solutions were conducted in 3.0 mL of PBS buffer/DMSO (8:2, v/v) solution by adding an aliquot of stock solution and 15 μL of the probe stock solution. Absorption and fluorescence spectra were monitored on a UV-visible spectrophotometer or fluorescent spectrofluorometer after incubating the test solution for 2 h for SO2 or 30 min for biothiols at room temperature.

3.4. Detection Limit

The detection limit was calculated based on the fluorescence titration with the following equation:
detection limit = 3 σbi/m
where σbi is the standard deviation of blank measurements and m is the slope between intensity versus sample concentration (signal-to-noise ratio of 3:1). The standard deviation of blank measurements was determined when the emission intensity of probe (10 μM) without Na2SO3 (at 495 nm) or GSH (at 665 nm) was measured ten times. Then, fluorescent titrations were conducted under the present conditions. A good linear relationship between the fluorescence intensity and the concentration of Na2SO3 or GSH was obtained. The slope between intensity versus Na2SO3 or GSH concentration was m in the aforementioned formula.

3.5. CCK-8 Assay for the Cell Cytotoxicity

HeLa cells were seeded into 96-well plates (about 7000 cells per well) and cultured overnight to a 70–80% cell confluence. After replacing the medium with 100 μL fresh medium, different concentrations of BPO-DNSP and BPO-DNP (in DMSO stock solution) were then added and incubated for 24 h. Then, 10-μL CCK-8 mixed in 90 μL PBS was added to each well for additional 1 h incubation. The absorbance was measured at a wavelength of 450 nm. The viability of the treated cells was determined relative to the cell treated with same amount of DMSO as 100% activity.

3.6. Cell Culture and Confocal Imaging

HeLa cells were cultured in DMEM (Dullbecco Modified Eagle Medium) containing 10% fetal bovine serum (FBS) and 1% penicillin–streptomycin in a 5% CO2/95% air incubator at 37 °C. For colocalization and fluorescent imaging experiments, cells (4 × 10³ well−1) were placed on glass-bottom dishes and incubated for 24 h. Before staining, the cells were washed three times with physiological PBS.
For colocalization experiments with Lyso Tracker Green (Lyt) or Mito Tracker Green (MT), HeLa cells were incubated with BPO-DNSP (10 µM) in PBS for 30 min at 37 °C. After removing the medium and washing them three times with PBS, the cells were incubated with 1.0 µM Lyt or MT for another 30 min. Finally, cells were washed with PBS for fluorescent imaging. The fluorescence of LyT or MT in the green channel were collected at 510–600 nm with excitation at 488 nm, and the fluorescence of BPO-DNSP in the red channel was collected at 620–720 nm with excitation at 560 nm. Image Pro Plus 6.0 software was used for the colocalization analysis by measuring the colocalization of the merged figure in the red and green channels to create calculated correlations between the images for the Pearson correlation coefficient and to create a color view of color colocalization.
For living cell imaging of SO2 and biothiols experiments: the Hela cells were incubated with BPO-DNSP (10 µM) in PBS for 30 min at 37 °C as the control experiment. For the thiol-blocking experiment, Hela cells were pretreated with 50 μM NEM for 30 min at 37 °C and then incubated with BPO-DNSP (10 µM) for another 30 min. For fluorescent imaging of SO2 in living cells, after pretreatment with 50 μM NEM for 30 min at 37 °C, Hela cells were incubated with BPO-DNSP (10 µM) for another 30 min and then incubating with 500 μM SO2. The fluorescence for the green channel was recorded at the wavelength range 460–530 nm with excitation at 405 nm. For the red channel, the confocal fluorescent images were collected over the range 620–720 nm with excitation at 560 nm.

4. Conclusions

In summary, two fluorescent probes caged with 2,4-dinitrobenzenesulfonyl (BPO-DNSP) and 2,4-dinitrofluorobenzene (BPO-DNP) for sensing SO2 and biothiols from two different emission channels in living cells were developed. BPO-DNP can only detect SO2 with low sensitivity and poor selectivity. However, BPO-DNSP can sensitively and selectively respond to SO2 and emit green fluorescence with a large Stokes shift over 105 nm, and it can react with biothiols in the near-infrared emission channel with a Stokes shift over 109 nm. The emission wavelength shift from those two channels was as high as 170 nm. Colocalization experiments demonstrated that BPO-DNSP possessed lysosome-targeting properties. Furthermore, BPO-DNSP can not only be used for imaging intracellular SO2 and biothiols, but can also be used for monitoring the conversion from biothiols to SO2 without adding exogenous enzymes, which can help us better understand the physiological nature of RSS. In comparison with the reported probes [24,25,26,27,28] for two-channel imaging of SO2 and biothiols, BPO-DNSP exhibited three advantages for bioimaging: (1) as far as 170 nm emission shift from two different channels; (2) near-infrared wavelength detection of intracellular biothiols; and (3) monitoring the conversion from biothiols to SO2 without adding exogenous enzymes. Moreover, BPO-DNSP revealed its superiority in biological applications as it avoids potential interference compared with reported probes using an aldehyde group as a reaction site. However, BPO-DNSP also is disadvantageous due to its slow kinetics for both SO2 and biothiols. Further modification with much stronger electron-withdrawing groups to replace oxonium salt and the caging group is necessary for improving the reactivity and kinetics.

Supplementary Materials

The following are available online, Figures S1–S12: Optical Properties; Figures S13–S18: 1H NMR, 13C NMR, and HRMS spectrum.

Author Contributions

M.-Y.W. conceived and designed the work. M.-Y.W. carried out the synthetic work and wrote the paper. Y.W., L.L. and X.-L.Z. performed the fluorescence properties assay. All authors read and approved the final manuscript.

Funding

This work was supported by the Fundamental Research Funds for the Central University (no. 2682016CX102). We also thank the Comprehensive Training Platform of Specialized Laboratory, College of Chemistry, Sichuan University for laser scanning confocal imaging.

Conflicts of Interest

The authors declare no conflict of interest.

References

  1. Zhang, S.Y.; Ong, C.-N.; Shen, H.-M. Critical roles of intracellular thiols and calcium in parthenolide-induced apoptosis in human colorectal cancer cells. Cancer Lett. 2004, 208, 143–153. [Google Scholar] [CrossRef] [PubMed]
  2. Hwang, C.; Sinskey, A.J.; Lodish, H.F. Oxidized redox state of glutathione in the endoplasmic reticulum. Science 1992, 257, 1496–1502. [Google Scholar] [CrossRef] [PubMed]
  3. Liu, D.; Huang, Y.; Bu, D.; Liu, A.D.; Holmberg, L.; Jia, Y.; Tang, C.; Du, J.; Jin, H. Sulfur dioxide inhibits vascular smooth muscle cell proliferation via suppressing the Erk/MAP kinase pathway mediated by cAMP/PKA signalling. Cell Death Dis. 2014, 5, 1251. [Google Scholar] [CrossRef] [PubMed]
  4. Li, J.; Meng, Z. The role of sulfur dioxide as an endogenous gaseous vasoactive factor in synergy with nitric oxide. Nitric Oxide 2009, 20, 166–174. [Google Scholar] [CrossRef]
  5. Schulz, J.B.; Lindenau, J.; Seyfried, J.; Dichgans, J. Glutathione, oxidative stress and neurodegeneration. Eur. J. Biochem. 2000, 267, 4904–4911. [Google Scholar] [CrossRef] [PubMed] [Green Version]
  6. Marino, S.M.; Gladyshev, V.N. Cysteine function governs its conservation and degeneration and restricts its utilization on protein surfaces. J. Mol. Biol. 2010, 404, 902–916. [Google Scholar] [CrossRef] [PubMed]
  7. Giles, G.I.; Tasker, K.M.; Jacob, C. Hypothesis: The role of reactive sulfur species in oxidative stress. Free Radical Biol. Med. 2001, 31, 1279–1283. [Google Scholar] [CrossRef]
  8. Ishanina, M.T.V.; Libiad, M.; Banerjee, R. Biogenesis of reactive sulfur species for signaling by hydrogen sulfide oxidation pathways. Nat. Chem. Biol. 2015, 11, 457–464. [Google Scholar] [CrossRef] [Green Version]
  9. Lee, M.H.; Yang, Z.; Lim, C.W.; Lee, Y.H.; Dongbang, S.; Kang, C.; Kim, J.S. Disulfide-cleavage-triggered chemosensors and their biological applications. Chem. Rev. 2013, 113, 5071–5109. [Google Scholar] [CrossRef]
  10. Shahrokhian, S. Lead phthalocyanine as a selective carrier for preparation of a cysteine-selective electrode. Anal. Chem. 2001, 73, 5972–5978. [Google Scholar] [CrossRef]
  11. Seshadri, S.; Beiser, A.; Selhub, J.; Jacques, P.F.; Rosenberg, I.H.; D’Agostino, R.B.; Wilson, P.W.F.; Wolf, A.N.P. Plasma homocysteine as a risk factor for dementia and Alzheimer’s disease. Engl. J. Med. 2002, 346, 476–483. [Google Scholar] [CrossRef] [PubMed]
  12. Townsend, D.M.; Tew, K.D.; Tapiero, H. The importance of glutathione in human disease. Biomed. Pharmacother. 2003, 57, 145–155. [Google Scholar] [CrossRef]
  13. Li, X.; Bazer, F.W.; Gao, H.; Jobgen, W.; Johnson, G.A.; Li, P.; McKnight, J.R.; Satterfield, M.C.; Spencer, T.E.; Wu, S.G. Amino acids and gaseous signalling. Amino Acids 2009, 37, 65–78. [Google Scholar] [CrossRef]
  14. Griffith, O.W. Mammalian sulfur amino acid metabolism: An overview. Methods Enzymol. 1987, 143, 366–376. [Google Scholar]
  15. Sang, N.; Yun, Y.; Li, H.; Hou, L.; Han, M.; Li, G.K. SO2 inhalation contributes to the development and progression of ischemic stroke in the brain. Toxicol. Sci. 2010, 114, 226–236. [Google Scholar] [CrossRef] [PubMed]
  16. Lin, V.S.; Chen, W.; Xian, M.; Chang, C.J. Chemical probes for molecular imaging and detection of hydrogen sulfide and reactive sulfur species in biological systems. Chem. Soc. Rev. 2015, 44, 4596–4618. [Google Scholar] [CrossRef] [PubMed] [Green Version]
  17. Chen, H.; Dong, B.; Tang, Y.; Lin, W. A unique “integration” strategy for the rational design of optically tunable near-infrared fluorophores. Acc. Chem. Res. 2017, 50, 1410–1422. [Google Scholar] [CrossRef]
  18. Hou, J.-T.; Ren, W.X.; Li, K.; Seo, J.; Sharma, A.; Yu, X.-Q.; Kim, J.S. Fluorescent bioimaging of pH: From design to applications. Chem. Soc. Rev. 2017, 46, 2076–2090. [Google Scholar] [CrossRef]
  19. Jiao, X.; Li, Y.; Niu, J.; Xie, X.; Wang, X.; Tang, B. Small-molecule fluorescent probes for imaging and detection of reactive oxygen, nitrogen, and sulfur species in biological systems. Anal. Chem. 2018, 90, 533–555. [Google Scholar] [CrossRef]
  20. Sun, W.; Guo, S.; Hu, C.; Fan, J.; Peng, X. Recent development of chemosensors based on cyanine platforms. Chem. Rev. 2016, 116, 7768–7817. [Google Scholar] [CrossRef]
  21. Yin, C.-X.; Xiong, K.-M.; Huo, F.-J.; Salamanca, J.C.; Strongin, R.M. Fluorescent probes with multiple binding sites for the discrimination of Cys, Hcy, and GSH. Angew. Chem. Int. Ed. 2017, 56, 13188–13198. [Google Scholar] [CrossRef] [PubMed]
  22. Jung, H.S.; Chen, X.; Kim, J.S.; Yoon, J. Recent progress in luminescent and colorimetric chemosensors for detection of thiols. Chem. Soc. Rev. 2013, 42, 6019–6031. [Google Scholar] [CrossRef] [PubMed]
  23. Yu, F.; Han, X.; Chen, L. Fluorescent probes for hydrogen sulfide detection and bioimaging. Chem. Commun. 2014, 50, 12234–12249. [Google Scholar] [CrossRef] [PubMed] [Green Version]
  24. Yue, Y.; Huo, F.; Ning, P.; Zhang, Y.; Chao, J.; Meng, X.; Yin, C. Dual-site fluorescent probe for visualizing the metabolism of Cys in living cells. J. Am. Chem. Soc. 2017, 139, 3181–3185. [Google Scholar] [CrossRef] [PubMed]
  25. Li, M.; Cui, P.; Li, K.; Feng, J.; Zou, M.; Yu, X. Dual-site fluorescent probe for highly selective and sensitive detection of sulfite and biothiols. Chine. Chem. Lett. 2018, 29, 992–994. [Google Scholar] [CrossRef]
  26. Guo, X.; Xia, L.; Huang, J.; Wang, Y.; Gu, Y.; Wang, P. Novel dual-site fluorescent probe for monitoring cysteine and sulfite in living cells. RSC Adv. 2018, 8, 21047–21054. [Google Scholar] [CrossRef]
  27. Xie, X.; Yin, C.; Yue, Y.; Chao, J.; Huo, F. Fluorescent probe detect distinguishly sulfite/hydrogen sulfide and thiol via two emission channels in vivo. Sens. Actuators B 2018, 277, 647–653. [Google Scholar] [CrossRef]
  28. Wu, M.-Y.; Wang, Y.; Liu, Y.-H.; Yu, X.-Q. Dual-site lysosome-targeted fluorescent probe for separate detection of endogenous biothiols and SO2 in living cells. J. Mater. Chem. B 2018, 6, 4232–4238. [Google Scholar] [CrossRef]
  29. Zhu, H.; Fan, J.; Xu, Q.; Wang, J.; Gao, P.; Peng, X. Imaging of lysosomal pH changes with a fluorescent sensor containing a novel lysosome-locating group. Chem. Commun. 2012, 48, 11766–11768. [Google Scholar] [CrossRef]
  30. Surendran, K.; Vitiello, S.P.; Pearce, D.A. Lysosome dysfunction in the pathogenesis of kidney diseases. Pediatr. Nephrol. 2014, 29, 2253–2261. [Google Scholar] [CrossRef]
  31. Phan, U.T.; Arunachalam, B.; Cresswell, P. Gamma-interferon-inducible lysosomal thiol reductase (GILT) maturation, activity, and mechanism of action. J. Biol. Chem. 2000, 275, 25907–25914. [Google Scholar] [CrossRef]
  32. Kand, D.; Saha, T.; Lahiri, M.; Talukdar, P. Lysosome targeting fluorescence probe for imaging intracellular thiols. Org. Biomol. Chem. 2015, 13, 8163–8168. [Google Scholar] [CrossRef] [PubMed] [Green Version]
  33. Chen, C.; Zhou, L.; Liu, W.; Liu, W. Coumarinocoumarin-based two-photon fluorescent cysteine biosensor for targeting lysosome. Anal. Chem. 2018, 90, 6138–6143. [Google Scholar] [CrossRef] [PubMed]
  34. Balce, D.R.; Allan, E.R.O.; Mckenna, N.; Yates, R.M. Gamma-interferon-inducible lysosomal thiol reductase (GILT) maintains phagosomal proteolysis in alternatively activated macrophages. J. Biol. Chem. 2014, 289, 31891–31904. [Google Scholar] [CrossRef]
  35. Yue, Y.; Huo, F.; Yue, P.; Meng, X.; Salamanca, J.C.; Escobedo, J.O.; Strongin, R.M.; Yin, C. In situ lysosomal cysteine-specific targeting and imaging during dexamethasone induced apoptosis. Anal. Chem. 2018, 90, 7018–7024. [Google Scholar] [CrossRef] [PubMed]
  36. Fan, J.; Han, Z.; Kang, Y.; Peng, X. A two-photon fluorescent probe for lysosomal thiols in live cells and tissues. Sci. Rep. 2016, 6, 19562. [Google Scholar] [CrossRef] [PubMed]
  37. Huang, R.; Wang, B.-B.; Si-Tu, X.-M.; Wang, F.-F.; He, H.; Fan, X.-Y.; Jiang, F.-L.; Liu, Y. A lysosome-targeted fluorescent sensor for the detection of glutathione in cells with an extremely fast response. Chem. Commun. 2016, 52, 11579–11582. [Google Scholar]
  38. Wang, K.; Leng, T.; Liu, Y.; Wang, C.; Shi, P.; Shen, Y.; Zhu, W.-H. A novel near-infrared fluorescent probe with a large stokes shift for the detection and imaging of biothiols. Sens. Actuators B 2017, 248, 338–345. [Google Scholar] [CrossRef]
  39. Chen, H.; Tang, Y.; Ren, M.; Lin, W. Single near-infrared fluorescent probe with high- and low-sensitivity sites for sensing different concentration ranges of biological thiols with distinct modes of fluorescence signals. Chem. Sci. 2016, 7, 1896–19023. [Google Scholar] [CrossRef]
  40. Dai, X.; Zhang, T.; Miao, J.-Y.; Zhao, B.-X. A ratiometric fluorescent probe with DNBS group for biothiols in aqueous solution. Sens. Actuators B 2016, 223, 274–279. [Google Scholar] [CrossRef]
  41. Liu, K.; Shang, H.; Kong, X.; Lin, W. A novel near-infrared fluorescent probe with a large Stokes shift for biothiol detection and application in in vitro and in vivo fluorescence imaging. J. Mater. Chem. B 2017, 5, 3836–3841. [Google Scholar] [CrossRef]
  42. Sun, Y.-Q.; Liu, J.; Zhang, J.; Yang, T.; Guo, W. Fluorescent probe for biological gas SO2 derivatives bisulfite and sulphite. Chem. Commun. 2013, 49, 2637–2639. [Google Scholar] [CrossRef] [PubMed]
  43. Wu, M.-Y.; Li, K.; Li, C.-Y.; Hou, J.-T.; Yu, X.-Q. A water-soluble near-infrared probe for colorimetric and ratiometric sensing of SO2 derivatives in living cells. Chem. Commun. 2014, 50, 183–185. [Google Scholar] [CrossRef] [PubMed]
  44. Chen, W.; Liu, X.; Chen, S.; Song, X.; Kang, J. A real-time colorimetric and ratiometric fluorescent probe for rapid detection of SO2 derivatives in living cells based on a near-infrared benzopyrylium dye. RSC Adv. 2015, 5, 25409–25415. [Google Scholar] [CrossRef]
  45. Wu, M.-Y.; Wu, J.; Wang, Y.; Liu, Y.-H.; Yu, X.-Q. A Novel Colorimetric Fluorescent Probe for SO2 and Its Application in Living Cells Imaging. Molecules 2018, 23, 871. [Google Scholar] [CrossRef] [PubMed]
  46. Liu, K.; Chen, Y.; Sun, H.; Wang, S.; Kong, F. Construction of a novel near infrared fluorescent probe with multiple fluorescence emission and its application for SO2 derivative detection in cells and living zebrafish. J. Mat. Chem. B 2018, 6, 7060–7065. [Google Scholar] [CrossRef]
  47. Shang, H.; Liu, K.; Lin, W. Construction of a novel ratiometric near-infrared fluorescent probe for SO2 derivatives and its application for biological imaging. Anal. Methods 2017, 9, 3790–3794. [Google Scholar]
  48. Zhang, X.; Wang, B.; Wang, C.; Chen, L.; Xiao, Y. Monitoring lipid peroxidation within foam cells by lysosome-targetable and ratiometric probe. Anal. Chem. 2015, 87, 8292–8300. [Google Scholar] [CrossRef]
  49. He, D.-D.; Liu, W.; Sun, R.; Fan, C.; Xu, Y.-J.; Ge, J.-F. N-Pyridineium-2-yl Darrow Red analogue: Unique near-infrared lysosome-biomarker for the detection of cancer cells. Anal. Chem. 2015, 87, 1499–1502. [Google Scholar] [CrossRef]
  50. Dou, Y.; Gu, X.; Ying, S.; Zhu, S.; Yu, S.; Sheng, W.; Zhu, Q. A novel lysosome-targeted fluorogenic probe based on 5-triazole-quinoline for the rapid detection of hydrogen sulfide in living cells. Org. Biomol. Chem. 2018, 16, 712–716. [Google Scholar] [CrossRef]
  51. Yuan, L.; Lin, W.; Chen, H. Analogs of Changsha near-infrared dyes with large Stokes Shifts for bioimaging. Biomaterials 2013, 34, 9566–9571. [Google Scholar] [CrossRef] [PubMed]
Sample Availability: Samples of the compounds are not available from the authors.
Scheme 1. Design strategy and synthesis routes of a lysosome-targeted fluorescent probe (BPO-DNSP) and BPO-DNP. (a) The reaction mechanisms of the fluorescent probe for SO2 and biothiols; (b) Synthesis routes of BPO-DNSP and BPO-DNP.
Molecules 24 00618 sch001
Figure 1. (a) UV-vis absorption and (b) normalized fluorescence spectra of BPO-DNSP (10 μM) and its interaction with 500 μM SO2 or glutathione (GSH). Excitation wavelength for BPO-DNSP with SO2ex) = 390 nm. Slit: 2.5 nm/5 nm. Excitation wavelength for BPO-DNSP with GSH (λex) = 556 nm. Slit: 10 nm/10 nm. Inset: corresponding color and fluorescence changes under visible light and a 365 nm UV lamp.
Molecules 24 00618 g001
Figure 2. Fluorescence responses of BPO-DNSP to SO2. (a) Fluorescence responses of BPO-DNSP (10 μM) to different concentrations of SO2 (0–1000 μM); (b) Plot of BPO-DNSP fluorescence intensity to 0–400 μM SO2 at 495 nm; (c) fluorescence intensity and (d) color changes of BPO-DNSP (10 μM) treated with 500 μM of various relevant analytes. λex = 390 nm. Slit: 2.5 nm/5 nm. 1. BPO-DNSP, 2. Ala, 3. Arg. 4. Asp, 5. Glu, 6. Gly, 7. His, 8. Ile, 9. Leu, 10. Lys, 11. Met, 12. Phe, 13. Pro, 14. Ser, 15. Val, 16. H2O2, 17. NaClO, 18. TBHP, 19. NO3, 20. NO2, 21. SO42−, 22. Cys, 23. Hcy, 24. GSH, 25. H2S, 26. SO2.
Molecules 24 00618 g002
Figure 3. (a) Fluorescence responses of BPO-DNSP to GSH and (b) fluorescence responses of BPO-DNSP (10 μM) to different concentrations of GSH (0–400 μM); (c) plot of BPO-DNSP fluorescence intensity to 10–70 μM GSH at 665 nm; (d) fluorescence intensity changes of BPO-DNSP (10 μM) treated with 500 μM of various relevant analytes. λex = 556 nm. Slit: 10 nm/10 nm. 1. BPO-DNSP, 2. Ala, 3. Arg. 4. Asp, 5. Glu, 6. Gly, 7. His, 8. Ile, 9. Leu, 10. Lys, 11. Met, 12. Phe, 13. Pro, 14. Ser, 15. Val, 16. H2O2, 17. NaClO, 18. TBHP, 19. NO3, 20. NO2, 21. SO42−, 22. H2S, 23. SO2, 24. Cys, 25. Hcy, 26. GSH.
Molecules 24 00618 g003
Figure 4. Fluorescence responses of BPO-DNP to SO2. (a) Fluorescence responses of BPO-DNP (10 μM) to different concentrations of SO2 (0–1000 μM). (b) Fluorescence response of BPO-DNP (10 μM) with 500 μM of different kinds of amino acids (Arg, Met, Ser, Asp, Gly, Ala, His, Val, Lys, Leu, Glu, Pro, Ile, Phe), reactive species, and anions (H2O2, NaClO, TBHP, NO3, NO2, SO42−, Cys, Hcy, GSH, H2S, SO2) in 10 mM pH 8.0 phosphated-buffered saline (PBS) and dimethylsulfoxide (DMSO) mixture solution (8:2, v/v), λex = 556 nm. Slit: 10 nm/10 nm.
Molecules 24 00618 g004
Figure 5. Confocal fluorescence images of living HeLa cells (ad) incubated with 10 μM BPO-DNSP; (eh) HeLa cells pretreated with 50 μM NEM and further incubated with 10 μM BPO-DNSP; (il) after pretreatment with 50 μM NEM, HeLa cells were loaded with 10 μM BPO-DNSP and then incubated with SO2 (500 μM) in the green channel, red channel, bright-field, and merged images. For green channel: λex = 405 nm, λem = 460–530 nm; for red channel: λex = 560 nm, λem = 620–720 nm.
Molecules 24 00618 g005
Figure 6. Colocalization experiments of BPO-DNSP with LyT (ae) and MT (fj) in HeLa cells. (a) and (f) fluorescence image of BPO-DNSP (10 μM) on red channel (λem = 620–720 nm) with excitation at 560 nm; fluorescence image of 1 μM LyT (b) and MT (g) on green channel (λem = 510–600 nm) with excitation at 488 nm; (c) and (h) image from bright field; (d) and (i) merged image of red, green, and bright field channels, colocalization of BPO-DNSP with (e) lysosome tracking (LyT) (j) and mitochondrial targeting (MT).
Molecules 24 00618 g006