1. Introduction
Infrared absorption spectroscopy in the mid-infrared spectral range (approximately 2.5–25 µm or 4000–400 cm−1) is a valuable technique for investigating molecular properties in soft matter research, including samples of biochemical and biological interest. Over the last few decades, it has been used extensively for investigating composition, structure, and reactivity of a wide range of samples, ranging in complexity from purified biomolecules to tissue sections. The introduction of microscopes for IR spectroscopy and imaging has extended applications to the spatially resolved analysis of sample heterogeneity on the micrometric scale. IR microscopes have been successfully used with tissue sections and biopsies, and in the spectroscopic study of single eukaryotic cells. However, the use of far-field optics has constrained the spatial resolution of the measurement to the values imposed by diffraction, of the order of the wavelength in the mid-IR spectral region. The size of most prokaryotic cells is below the shortest wavelength while most eukaryotic cells range in size between 10 and 100 µm. As a result, most IR microscopy studies have been restricted to performing spectroscopy of single whole eukaryotic cells. Studies with subcellular resolution have been few and limited to larger cells, often requiring the use of synchrotron radiation to improve signal-to-noise at diffraction-limited resolution. In most cases, such studies allow selective probing of the nucleus and the larger vacuoles, but most subcellular structures remained unresolved.
The introduction of techniques for nanoscale IR spectroscopy has promised to open the way to measurements with a resolution that is better than that allowed by optical diffraction. Several designs have been introduced that allow a resolution better than λ and often better than 1/10 λ in the mid-IR spectral region, including transmission-mode scanning near field optical microscopy (SNOM) [
1,
2] scattering-mode SNOM [
3], photothermal-induced resonance (PTIR), sometimes called AFM-IR [
4], photothermal microspectroscopy (PTMS) [
5] and its nanoscale analogue, scanning thermal infrared microscopy (STIRM) [
6] photoinduced force microscopy (PiFM) [
7]. Among these techniques, PTIR detects absorption of IR light by relying on the deflection of an AFM probe following photothermal expansion of the sample in the contact location. PTIR was originally introduced by Dazzi et al. [
4] and was based on the use of CO
2 and free electron laser (FEL) sources for excitation. The later introduction of a more extensive park of benchtop light sources, including the optical parametric oscillator (OPO) and quantum cascade lasers (QCL), allowed extension of the accessible wavenumber region and introduction of novel experimental configurations that made the technique more accessible and applicable to a wider sample range [
8]. As a result, PTIR has seen increased application in material characterization, particularly concerning soft matter samples. These developments have been recently reviewed [
8]. It is generally accepted that PTIR can be successfully used for the study of single cells with a resolution better than 100 nm. Samples that have been investigated by PTIR to date include both prokaryotic cells [
9,
10,
11,
12] and eukaryotic cells [
13,
14,
15,
16,
17,
18,
19,
20]. Among the latter, one example includes the study of living yeast [
16]. To our knowledge, the latter is the only reported example of PTIR measurements on a single living cell in an aqueous environment to date. The reason for the limited amount of work done on the subject can be ascribed to the difficulty of performing PTIR measurements in an aqueous solution. Complications arise from a combination of factors that include the high absorption of water in the mid-IR region, the need to retain the alignment of a light beam that crosses the air–water interface, and the general damping of cantilever resonances in a liquid medium [
21]. Optical and mechanical limitations make the measurement of even simple molecules challenging. The use of an aqueous environment is often considered a necessary condition for the investigation of living cells, because it reproduces the typical conditions used in cell culture. However, while water retention in a eukaryotic cell maintains cellular viability, the presence of a bulk aqueous environment at the exterior of the cell is not strictly necessary. Living cells in vertebrate tissue exist in three-dimensional ensembles that have no direct contact with a bulk aqueous phase. Only a few of them exist in aqueous suspension, notably blood cells, while more exist in tissue layers in contact with an aqueous phase, such as epithelial cells in blood vessels. It is therefore of interest to explore the feasibility of PTIR measurements on eukaryotic cells in the absence of a bulk aqueous phase but without drying of the cells. We aimed to assess the capability of the sample to retain its structure despite the mechanical stress associated with AFM scanning in contact mode and the thermal stress associated with PTIR measurements. In the present work, we used buccal cheek cells because of their accessibility and because of their stability when exposed to air. The cells can be collected together with their coating of salivary biopolymers, which are involved in the retention of humidity in the mouth cavity and contribute to the stabilization of the sample in the atmosphere. We performed both spectromicroscopy and imaging experiments on the cells and demonstrated the capability of resolving subcellular structures less than a micrometer in size.
2. Results
We used PTIR in contact mode to obtain images and single spectra of freshly collected buccal epithelial cells. Cellular topography was characterized by recording AFM images in contact mode. The cells responded well to contact scans, without major structural changes, and were mechanically stable over multiple AFM imaging scans. When measured with high resolution, either in AFM and/or in PTIR images (under irradiation with IR light), the cells only displayed slow changes in morphology over time. This morphological evolution appears to be the result of slow drying and mechanical settling of the cell, rather than of mechanical damage caused by scanning, as already remarked. We then recorded multiple parallel AFM and PTIR images of the sample ranging from a full cell to subcellular regions of decreasing size.
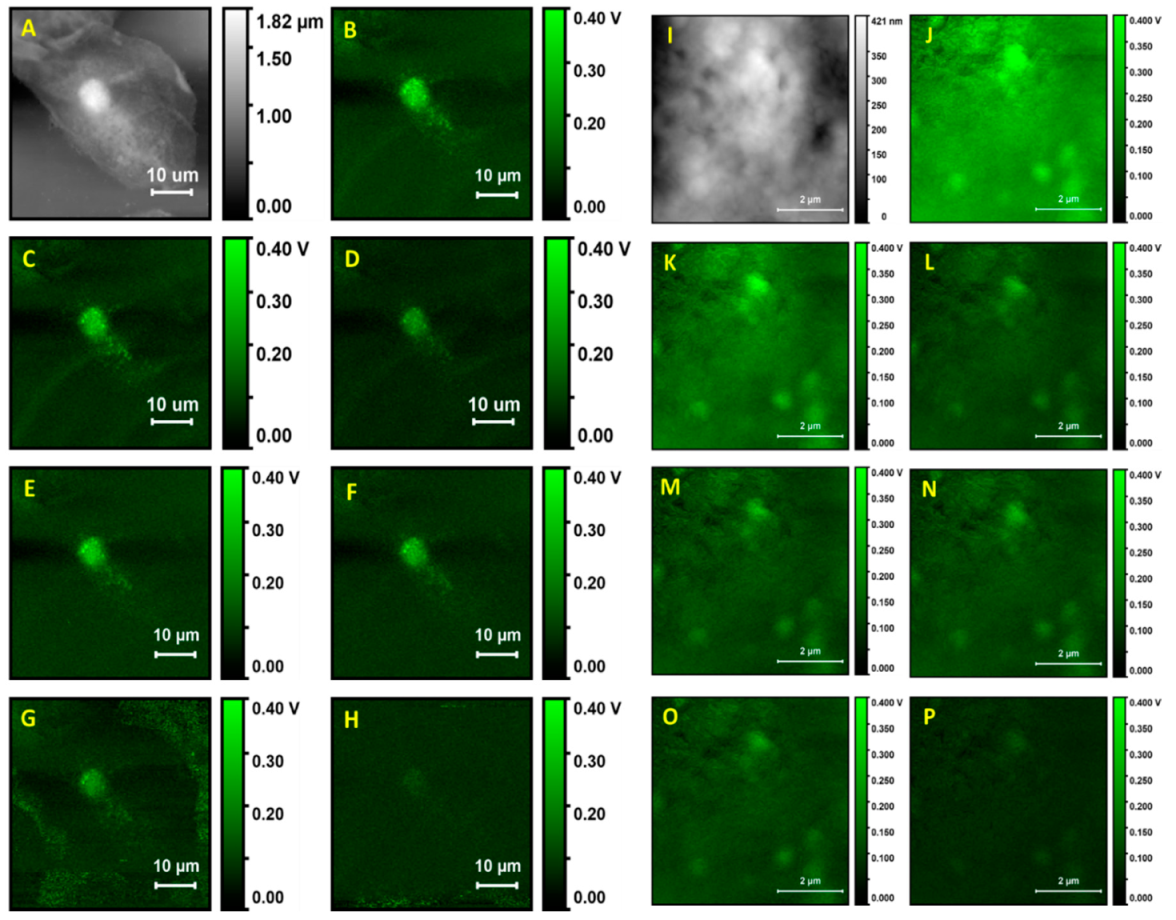
Figure 1 shows an AFM image and corresponding PTIR images of a single whole cell and of a subcellular portion. The wavelengths for photothermal excitation were chosen to match the known absorption bands of cellular samples between 1700 and 1000 cm
−1.
The overview of cell topography by contact mode AFM is shown in
Figure 1A. The cell appears to be flattened on the surface of the support. The nucleus can be easily identified because it gives rise to an ellipsoidal protrusion 8 to 10 µm in size. Similar to the case of adherent cells, the nuclear location corresponds to the position of maximum thickness for the cell, about 1.8 µm in our case. From this position, the cell body decreases progressively in thickness towards the edges. Much of the cell body appears to be between 0.6 and 1.2 µm in thickness. Overall, the cell has a granular appearance and inspection of a portion at higher resolution (
Figure 1J) shows a rough and puckered surface, with rugosity of the order of 100 to 200 nm. Except for the nucleus, no other subcellular structures can be clearly discerned from the topography image.
PTIR images of the same cell were recorded while exciting the sample at different wavelengths, corresponding to different absorption peaks. The nucleus is clearly observed with excellent contrast in images collected at most wavelengths, except at 1090 cm−1, which provides a weak image. In addition to the nucleus, a strong signal is observed from particles with a spheroidal or occasionally oblong structure, about 0.5 to 1.5 µm in size, which can also be observed at all excitation wavelengths. Because of the size, abundance, and cellular distribution, the structures are likely identified as organelles, probably peroxisomes or lysosomes, although we cannot rule out mitochondria or lipid droplets. Except for these structures, very weak signals are obtained from the remainder of the cell. The signal decreases rapidly away from the nucleus, at all exciting wavelengths, and is close to 0 mV throughout much of the cell volume.
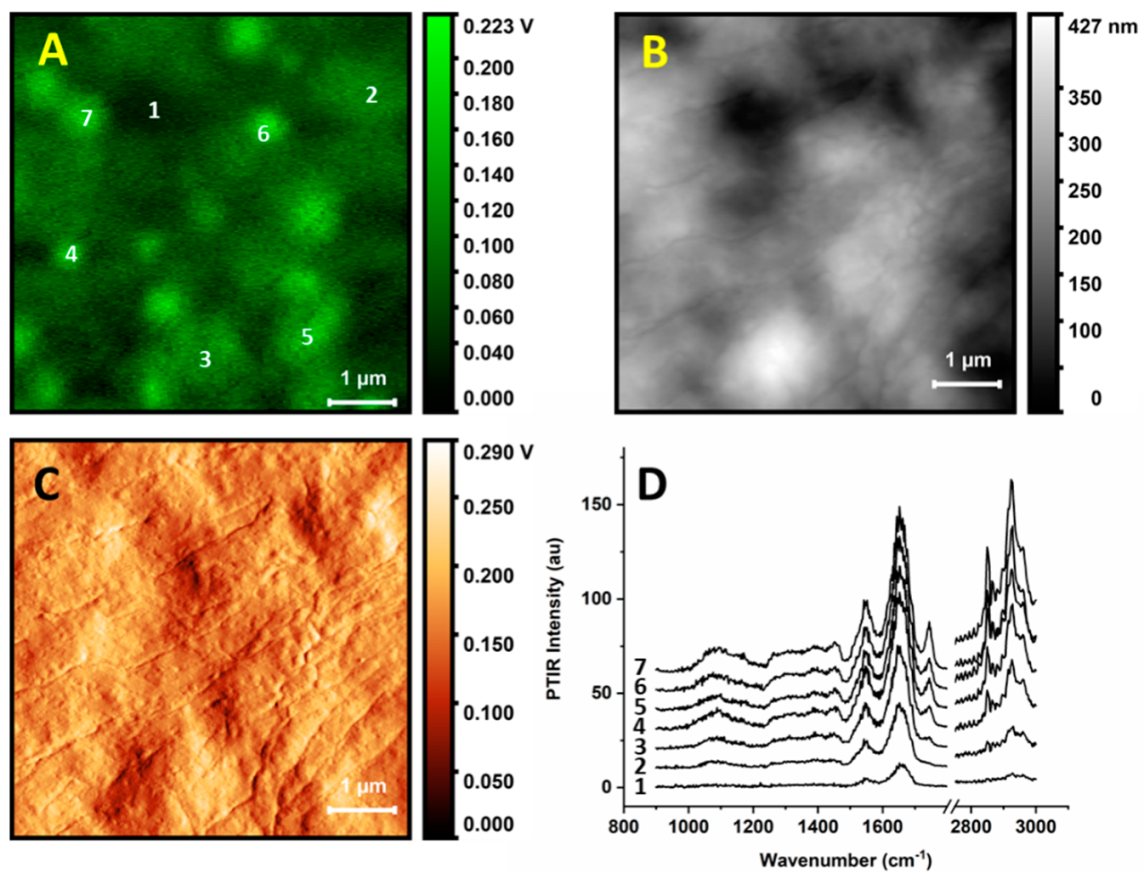
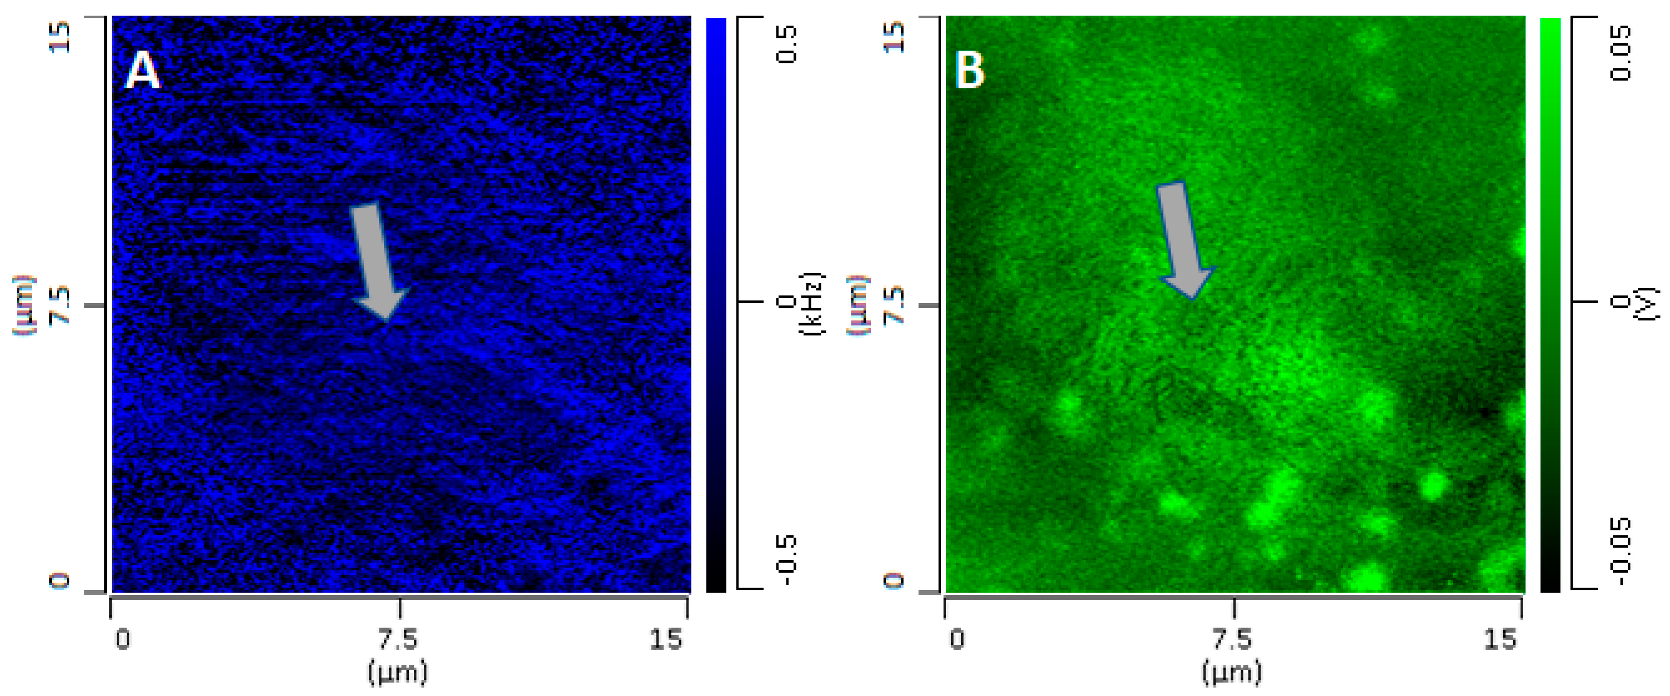
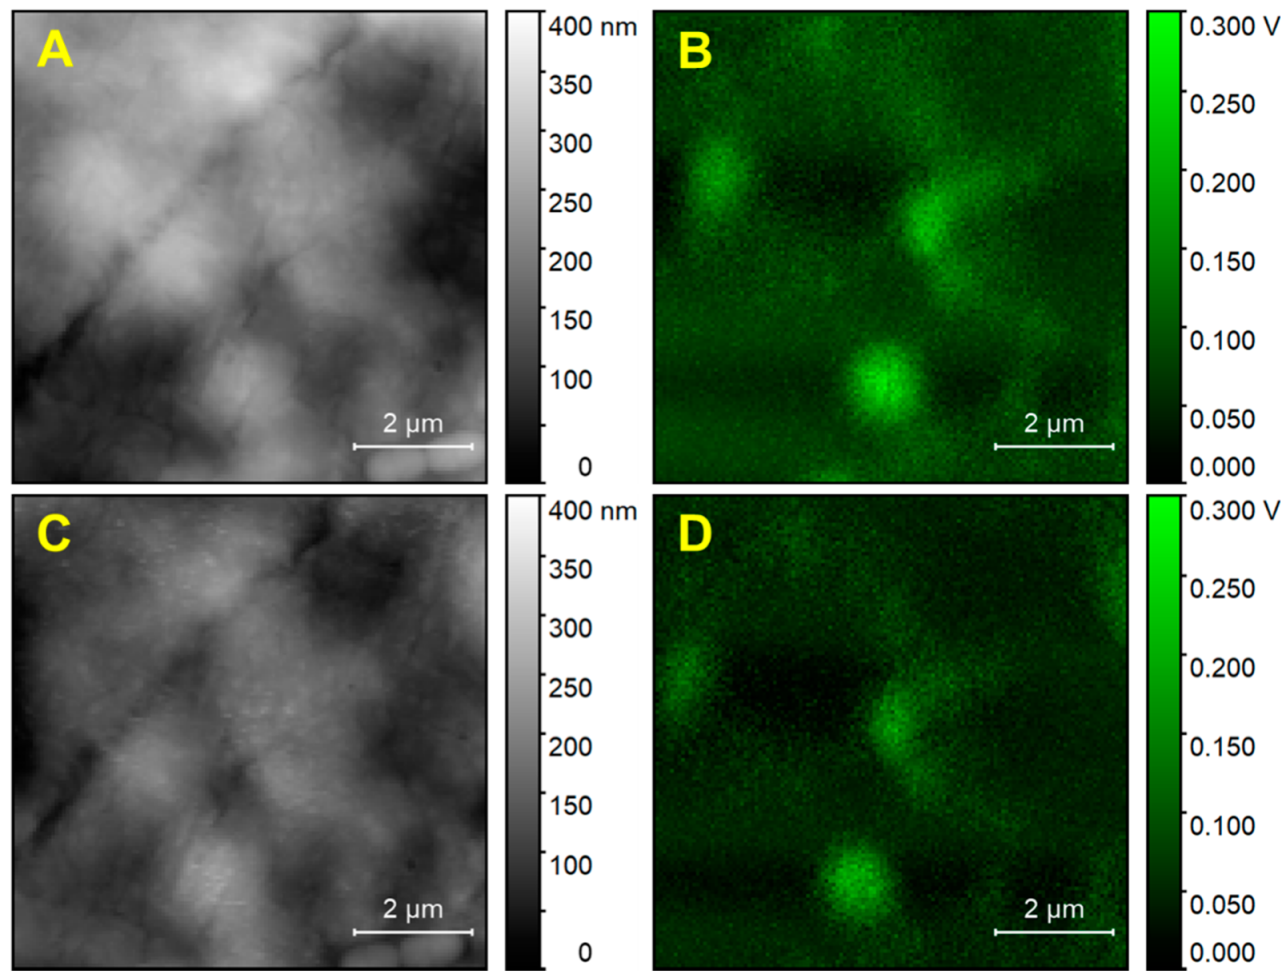
Figure 2 shows spectra collected at single locations of a cell (this is a different cell than the one used in
Figure 1). AFM and PTIR images were used to locate an area of interest, in this case a portion of a cell away from the nucleus. The region allows an investigation of multiple organelles in a single frame, as well as the space between them. We also show height and deflection maps (
Figure 2B,D respectively) for comparison with the PTIR map at 1670 cm
−1. The comparison shows that while some particles in
Figure 2A are in the correspondence of protuberances, others (e.g., in locations 6 and 7) are located on the side of slopes, indicating that the PTIR map is not simply reporting a change in sample thickness. This is also true for the deflection map, as locations of high PTIR signal do not necessarily correspond to the locations of high deflection. Therefore, contributions from the topography, even if present, are not dominating the PTIR signal. The probe was located at the selected position and spectra were recorded using the second resonance of the cantilever (
Figure 2D). The numbering of the spectra in
Figure 2D matches the locations marked in
Figure 2A.
Repeated measurements of the sample over several hours (see
Appendix C) show little change in the overall structure of PTIR images. The only changes involve a slow decrease of thickness and signal intensity, although the cell does not appear to dry out fully.
All PTIR spectra show a similar pattern of bands. The strongest bands are observed at 1650 and 1545 cm
−1, as is common in the IR absorption spectra of single cells. This region is typically dominated by a strong contribution from the amide I and amide II band doublet of polypeptides and amides, plus water, although contributions from amines, carboxylate, and other carbonyl groups are also present. Weaker absorption bands are observed at lower wavenumbers, down to 1050 to 1100 cm
−1. Most spectra display similar band patterns and differ mostly in overall intensity. The main clear variable between spectra is a set of peaks at 1740, 2850, and 2925 cm
−1. The bands are present in all spectra measured on organelle particles but are not seen when measuring away from them. In cellular IR spectra, these bands typically arise from the long chain acyl groups of fatty acids and lipids, including phospholipids and triglycerides, although overlap with bands from other molecular components is also possible. Remarkably, other bands arising from acyl lipids, such as the CH
2 bending mode around 1460 cm
−1 and headgroup vibrations around 1050 to 1090 cm
−1, are not obvious and may be present only as weak or unresolved components of the broad featureless bands observed below 1500 cm
−1. Stronger spectra arise from the brighter spots observed in the PTIR map. In contrast, spectra measured away from the organelles are much weaker and allow only the doublet of peaks in the amide region to be discerned. The intensity of the spectra does not seem to be clearly related to the thickness of the sample: Positions 4, 5, 6, and 7 give the strongest spectra despite being as thick as positions 2 and 3.
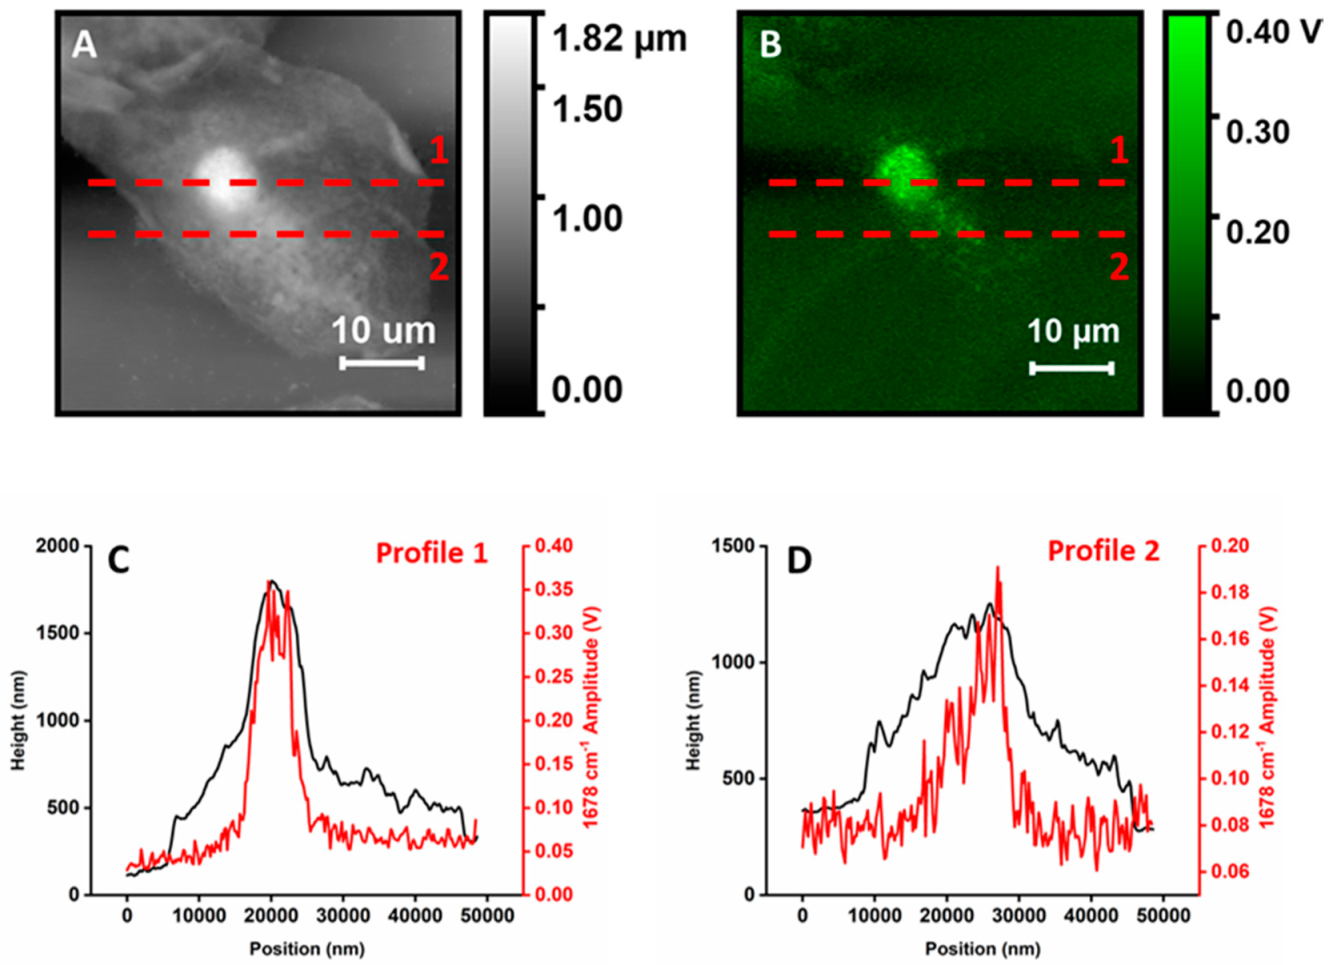
Figure 3 highlights this observation by showing matched profiles along selected locations of a height map and the corresponding PTIR map from
Figure 1. The stronger spikes on top of the two PTIR profiles are signals from organelles.
3. Discussion
Buccal cheek epithelial cells are components of the mouth epithelium that are continually shed into the saliva. The cells are harvested either from the saliva or directly by scraping the epithelium in a variety of states, ranging from intact to micronucleated, binucleated, pyknotic, or karyolitic. The cells can be successfully transferred to culture conditions, indicating that at least some of them are generally viable [
22,
23]. When tested by Trypan Blue, many cells show dye exclusion, indicating that the membrane is generally intact. However, dye exclusion tests on these cells are also known to give ambiguous results, with some live cells showing dye uptake [
23], and we could not confirm whether the individual cells investigated in this work were alive. We avoided cells with an irregular appearance and fragmented edges and selected cells with a visible nucleus at least 8 to 10 µm in size, to exclude karyolitic, necrotic, and binucleated cells. Even when exposed to the atmosphere, in the course of the measurement, the cells dry out slowly and retain their morphology for a few hours and over repeated AFM and PTIR scans. The stability of this cellular system in air is remarkable and permits the collection of multiple AFM/PTIR images of the same cell at different excitation wavelengths without loss of structure. A measurable PTIR signal is obtained even at relatively modest excitation power (~0.1–1.0 mW). Together with the stability of the sample, the response permits the collection of multiple PTIR images at different wavelengths while retaining comparable structure.
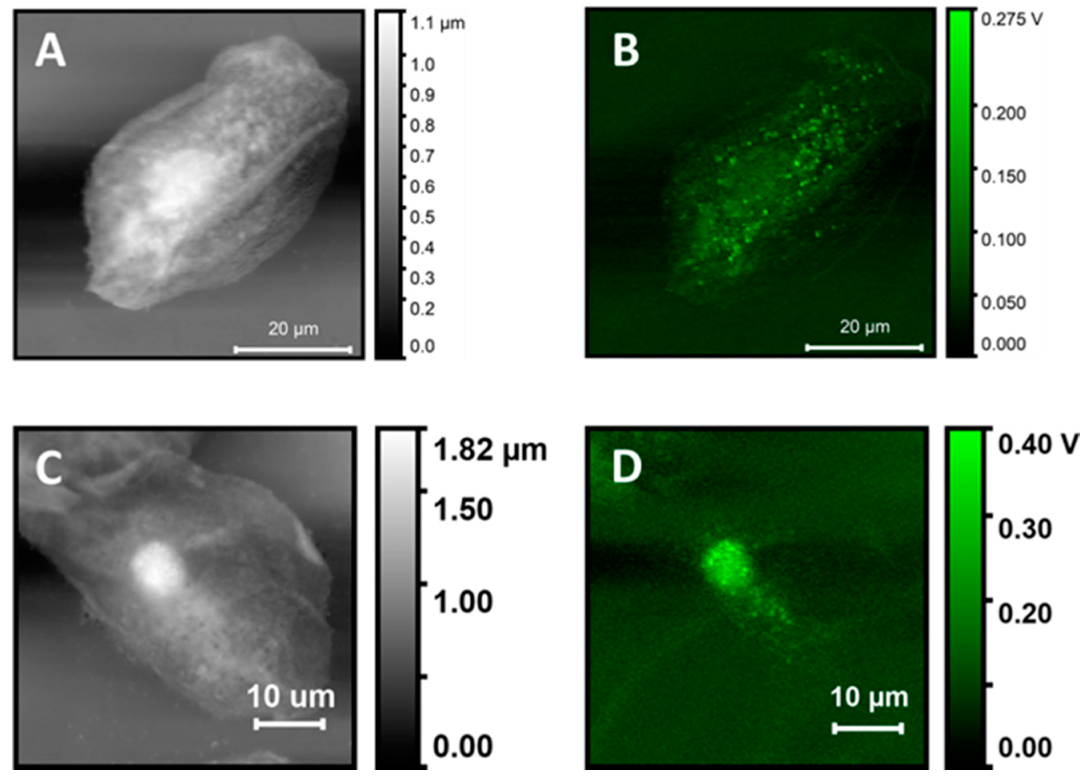
Figure A1 compares the results for two separate cells of different thicknesses and structures. Comparison of the PTIR signal at the nuclei shows that the intensity is proportional to the height of the nucleus. For bulk compounds, the PTIR signal is expected to increase with the thickness of the sample, as shown experimentally in the case of polymethylmethacrylate (PMMA), for which the signal shows a linear increase with the sample thickness, up to about 1 µm, followed by a decrease. [
24]. However, complications are observed for layered materials, where the mechanical properties of the tip–sample contact affect the signal intensity [
25]. In our experiments, the linearity of the response with thickness was confirmed when looking at nuclei of different thicknesses (see
Appendix A and
Figure A1). However, the relationship between the sample thickness and signal intensity is no longer linear when comparing different subcellular regions. Comparison of the PTIR and AFM topography maps of
Figure 1 shows that the PTIR signal is maximal at the nucleus, corresponding to about 1.8 µm in thickness, but is minimal or absent in other locations of the cell that are as thick as 1 µm. The organelles are about 0.5 to 1 µm thick but provide a stronger signal than cellular regions of comparable or greater thickness.
Figure 3 uses line profiles to highlight that signal intensity does not increase linearly with the thickness of the cell but is localized mostly at spherical or spheroidal structures. Apart from nucleus and organelles, the only other visible structures, although with weaker contrast, are pits and protuberances in the cellular surface that are apparent in higher-resolution higher-intensity images (
Figure 1 J–M). The latter structures arise from changes in the contact frequency of the tip as it scans through regions of the sample with different mechanical properties (see
Appendix B and
Figure A2). Changes in the Young modulus of microscopic and nanoscopic regions of the surface, as revealed by changes in the contact frequency, correspond to changes in the PTIR signal that modulate the intensity of spectral bands and PTIR maps [
26]. Overall, changes in the contact frequency introduce fine patterns in PTIR images, often with very high spatial resolution, which do not necessarily correspond to changes in the IR absorption of the sample. While these patterns contain interesting information about the micromechanical properties of the surface of the sample, they will not be addressed further in this work and will be the subject of future investigations.
The chemical composition of a eukaryotic cell is complex and inhomogeneous and varies throughout the location within the cell. Excitation at different wavelengths, corresponding to the absorption maxima of different molecular components, is expected to generate contrast based on the varying chemical composition and molecular properties of subcellular regions. This was indeed observed in our recent work on fixed fibroblast cells, where we could selectively image components of the cytoskeleton, lipid droplets, vesicles, and fragments of organelles by changing the excitation wavelength [
18]. Surprisingly, we did not observe the same variety of structures in the present work. Overall, it appears that the largest PTIR signals are produced by spheroidal organelles and are dominated by the bands typically assigned to acyl lipids and polypeptides, although other contributions are possible. Weaker signals come from the nucleus and seem to arise mostly from bands in the amide absorption region. Little contribution is seen on the nucleus from bands of acyl lipids, in agreement with what we know about its composition of the nucleus and with far-field FTIR studies of nucleated eukaryotic cells. Other components expected to give significant IR absorption, such as the larger cytoskeletal structures, were barely visible or not observed at all.
The relative lack of content in PTIR images is confirmed by spectromicroscopy measurements at specific locations. Strong spectra are observed when measuring on top of the organelles, with the band patterns expected from particles that are rich in both proteins and phospholipids. In contrast, much weaker spectra are measured elsewhere. In contrast to PTIR imaging measurements, PTIR spectra recorded on the nucleus, where the only obvious bands are the ones conventionally assigned to polypeptides and the overlapping water absorption, also show weak absorption bands. Some instances of PTIR measurements on fixed and dried cells [
18] and on proteins [
27] have provided extremely skewed amide I to amide II ratios, where the amide II band is nearly undetected and/or where the amide I band is unusually sharp. None of these effects, so far still unexplained, were seen in the spectra reported in this study.
Part of the difference between the PTIR spectra and maps of fixed and intact cells is likely due to the treatment that accompanied fixation. Fixed samples from our previous experiments had also been treated with Triton X-100 to disaggregate the cellular membrane. The treatment also appeared to degrade most organelles. It is also likely that some of the larger lipid and protein rich particles that were observed in fixed cells (e.g., the lipid-coated spheroid with a protein core shown in Figure 4 of [
18]) are the remains of those organelles that survived fixation. Other differences, such as the difficulty in detecting cytoskeletal components, may arise from the physiology of the different cell types. The fixed cells studied in our previous work were fibroblasts, which display a more extensive cytoskeletal network related to their function.
One interesting question is the contribution of water absorption to PTIR spectra, particularly in the 1640–1650 cm
−1 region. In far field FTIR measurements of aqueous samples, this region typically shows saturation or higher noise levels due to decreased light throughput, hindering measurements of samples thicker than 10 µm. In the present samples, avoiding the use of a bulk aqueous phase reduces this contribution to that of intracellular water (50% to 70% of the cell mass, depending on the cell type, although this is presumably lower in our samples because of water loss after removal from the buccal cavity), in cells that are between 1 and 2 µm at the thickest location. The contribution from water to the PTIR spectra of these cells, which falls at 1645 cm
−1 in far-field IR absorption spectra of bulk water, is surprisingly small, even though the cells were not actively dried and atmospheric humidity was relatively high at approximately 50%. Water is expected to contribute to cellular PTIR spectra in two ways. One is absorption of the incident laser beam itself by cellular water, which would lead to a drop in the intensity of the PTIR signal around 1645 cm
−1 because of decreased incident power. For thicker samples or for samples in an aqueous medium, this would lead to saturation effects and is one of the main complicating factors in performing PTIR in an aqueous environment. However, this is not expected in our case since cells were in air and thinner than 2 µm. The other contribution would come from the photothermal expansion of water itself and would give a positive contribution to the PTIR signal. For an intact hydrated cell, this is expected to be comparable to the contribution of other cellular components. This was not observed. The only indication that water may contribute to the PTIR spectrum is that the apparent ratio of bands at 1650 and 1545 cm
−1 is qualitatively higher than is commonly observed in the FTIR of fixed cells. One possible reason for the absence of a strong water contribution is that absorption at 1645 cm
−1 is observed for bulk water while the structure of water inside a cell is believed to be substantially different from and more ordered than that of the bulk liquid phase [
28]. Cytoplasmic water is generally described as a complex web of interconnected water molecules that include the hydration sphere of all biomolecules within the cell and pockets of confined micro and nanoscopic water clusters. Detailed studies of the water bending mode for intracellular water have not been performed. Our previous studies on water turnover in cells in a heavy water medium suggest that it falls in the 1600–1700 cm
−1 region, since it cannot be resolved from the amide I mode [
29]. IR spectroscopy studies of this band for nanostructured water in biological macromolecules [
30], and spectroscopic [
31] and theoretical studies of solvated protons [
32] have shown that this mode can vary over tens of wavenumbers, depending on the microenvironment and molecular interactions of specific water molecules, while nano-IR spectroscopy of confined water [
33,
34] has also shown that the absorption band of this mode is weak. The spread can lead to a broad and featureless absorption, which may be hard to resolve from other contributions. Specific experiments are necessary to explain water IR absorption, or lack thereof, in the cytoplasm of cells.
It is surprising to see such a strong and specific response from the membrane components of single organelles under the measurement conditions used in this experiment. Mitochondria are enclosed by two membranes while lysosomes and peroxisomes are enclosed by one membrane, corresponding to a phospholipid bilayer and associated proteins. Even accounting for the folding of the inner membrane of mitochondria into stacks of cristae, which increases the effective thickness, this is too small an amount of material and is not expected to give an easily detected signal. The measurement of monomolecular layers on gold (roughly equivalent to one leaflet of a membrane) requires the combined contribution of resonant mode PTIR, enhancement by optical coupling between a sharp metallic tip and a gold substrate, and a laser power of the order of 1 kW/cm2, none of which correspond to our experiment. A possible explanation is that the signal is affected by the heterogeneity in the chemical composition of the sample and the difference in composition between the content of the organelles and other subcellular structures. Peroxisomes and lysosomes are all involved in lipid and protein metabolism and catabolism and accumulate acyl lipids and proteins at high density. Other metabolites that are turned over by the organelles and can contribute to the observed spectra are small molecules containing amines or protonated carboxylic acid groups.
There are multiple conceivable explanations, not necessarily exclusive. One possibility is that the signal is modulated by the different mechanical properties of the organelles and the nucleus when compared to other structures. The mechanics of tip–sample interaction, as defined by the Young modulus, affect the signal intensity [
26], with changes in the stiffness giving rise to changes in the signal intensity [
25]. Other thermomechanical parameters of the sample are predicted to affect the PTIR response, such as density, thermal conductivity, and heath capacity [
26,
35]. It is known that some of these quantities are different from organelle to organelle, which allows their separation by centrifugation with a density gradient. Differential distribution of water within the cell is another factor that can have a major impact on the thermal capacity and thermal conductivity of an organelle and of its surrounding environment and can explain the different contrast observed between dry or fixed cells and intact cells, which still retain a degree of hydration.
A contribution to the PTIR signal, not considered in existing theoretical treatments, may come from the electrical properties of the sample. Biological membranes act as capacitors, accumulating charges on opposite leaflets in the form of electrolyte distribution, a property that is exploited for energy storage and signal transduction within the cell. In our samples, water loss during the measurement has plausibly affected the distribution and effective concentration of electrolytes and their mobility but without removing them from the cell. Photothermal expansion of membrane lipids and membrane proteins can affect the capacitance of membranes, which in turn would perturb the electrolyte distribution in the cytoplasm. AFM probes are known to be sensitive to changes in the electrical properties of the sample and AFM technology has been used to measure charge distribution, electrical potential, and capacitance with high resolution. It is notable that the tip used in the present experiments, made of silicon with a 20-nm gold coating, has a similar design to the one used in the original demonstration of Kelvin probe microscopy [
36]. However, an explanation based on changes in membrane capacitance does not account for the lack of a clear contribution from membranes of the Golgi and endoplasmic reticulum. In addition, the presence of adsorbed water on the sample surface, as in our samples, degrades contrast in Kelvin probe microscopy [
37] and would lead to poorer contrast in intact cells than in fixed and dried cells. Based on the latter arguments, an electrodynamical interpretation of the effect looks unlikely based on existing information.
Finally, the geometry of the observed structures could also affect signal generation. IR microscopy measurements with far-field optics are affected by distortion of spectral line shapes away from a purely absorptive profile because of optical effects that involve the interplay of the real and imaginary parts of the refractive index of the sample [
38]. Most commonly, the distortion results in absorption bands taking on a derivative-like profile when measuring objects with a spherical shape. No such distortions are obvious in the spectra reported in this work. This is expected, since IR absorption measurements that rely on the photothermal effect, including PTIR photoacoustic measurements, are believed to be free of contributions from the real refractive index [
39]. However, the present experiments do show a stronger signal arising from structures with a spherical or spheroidal shape. The apparent correlation between shape and signal intensity leaves open the possibility that sample geometry may affect the response via a hitherto unknown mechanism.
With the present data set, it is not possible to discriminate between the various hypothesis. It may eventually be possible in future work by appropriate experimental design and by the complementary use of modelling and computations.
4. Materials and Methods
PTIR measurements were performed on a nanoIR2 instrument (Anasys, Santa Barbara, CA, USA) working in contact mode using PR-EX-nIR probes. The probes are manufactured out of Au-coated silicon, have a cantilever with a force constant of 0.007 to 0.4 N/m, nominal tip diameter of 30 nm, and eigen frequency equal to 12.79 ± 0.64 kHz in air. The movement of the AFM laser was used to record the PTIR signal as an oscillatory decay. The peak-to-peak amplitude of this signal or the amplitude of a resonance peak in the cantilever spectrum were used as a measure of the PTIR signal intensity. The resonance spectrum of the cantilever was calculated from the oscillatory decay using the fast Fourier-transform (FFT) algorithm.
An OPO (Optical Parametric Oscillator) laser was used as the excitation source. For the measurement of PTIR spectra, the laser was scanned from 900 to 3000 cm
−1 in 2 cm
−1 steps, with a gap in the interval 1800–2700 cm
−1 to reduce measurement time. The plane of polarization was 20° from the normal (perpendicular polarization—this is called 90° degrees in the instrument settings). Power was set at 17% of the maximum and 512 measurements were co-averaged for each spectral point. The contact resonances were selected using a search location of 184 kHz and a Gaussian filter with a width at half-maximum of 10 kHz. The maximum peak-to-peak amplitude of the oscillatory decay was used for recording PTIR spectra. For the measurement of PTIR maps, the laser was set at the selected wavenumber while the AFM tip was scanned over the sample in contact mode. The contact mode scan was performed using a scan rate of 0.1 to 0.2 Hz. Spatial resolution varied from 256-pixel per line to 512-pixel per line in the X and Y direction using the feedback loop of the Z scanner. Power was set at 8% to 20% of the maximum and 8 to 16 pulses were co-averaged for each spectral point. The contact resonance was selected using a search location of 64 or 184 kHz via a Gaussian filter with a half-width of 10 to 50 kHz. Either the maximum peak-to-peak amplitude of the oscillatory decay or the amplitude of the resonance peak in the resonance spectrum were used for PTIR mapping. PTIR maps were not normalized to laser power. AFM images were collected in contact mode using the AFM functionality of the nanoIR2 instrument, either without laser excitation or in conjunction with PTIR imaging. AFM and PTIR maps were imported into Gwyddion 2.53 (
http://gwyddion.net/) for processing and presentation. All maps were offset-corrected to assign a value of zero to the minimal signal. PTIR spectral traces were imported into OriginPro 2019 (Origin Lab) for graphical plotting.
Buccal cells were collected from the cheek epithelium of a volunteer via a buccal swab using a cotton-tipped stick, transferred to a ZnSe window (Crystran, Poole, UK), and used for PTIR measurements. Samples were inspected using the optical imaging pathway of the instrument. Only cells with a larger, well defined nucleus were retained. Cells with a micronucleus, double nuclei, or a fragmented nucleus were avoided. Selected cells were used for PTIR experiments without further processing.


