
Influence of Storage Time and Temperature on the Toxicity, Endocrine Potential, and Migration of Epoxy Resin Precursors in Extracts of Food Packaging Materials


Abstract
: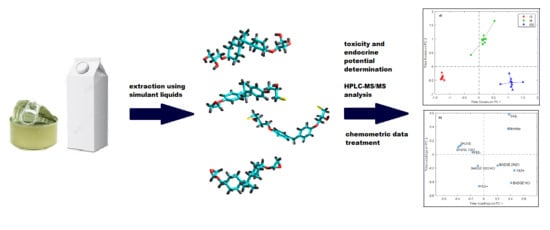
1. Introduction
2. Results
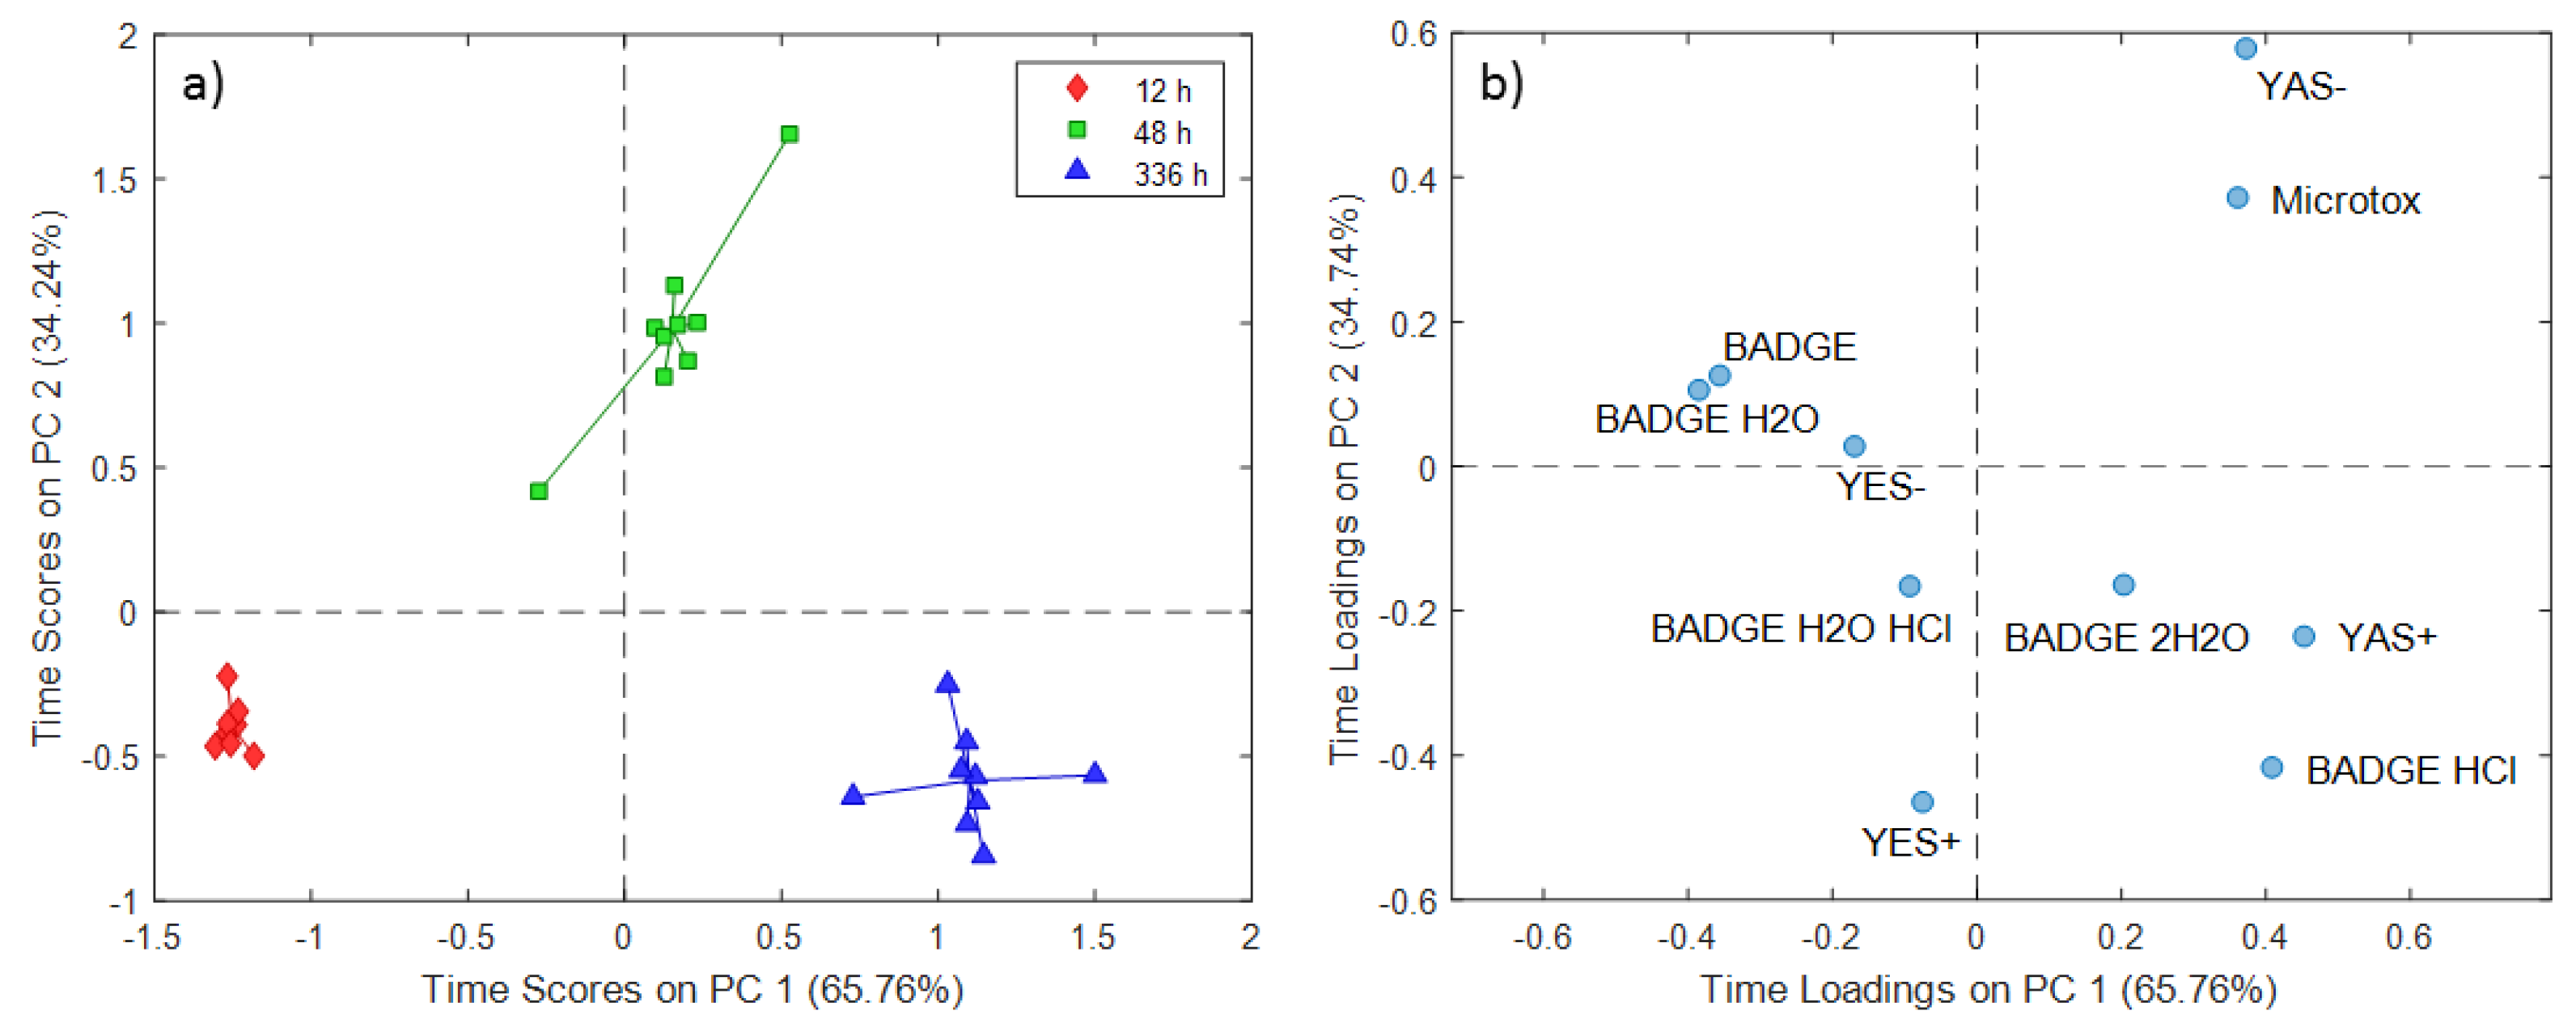
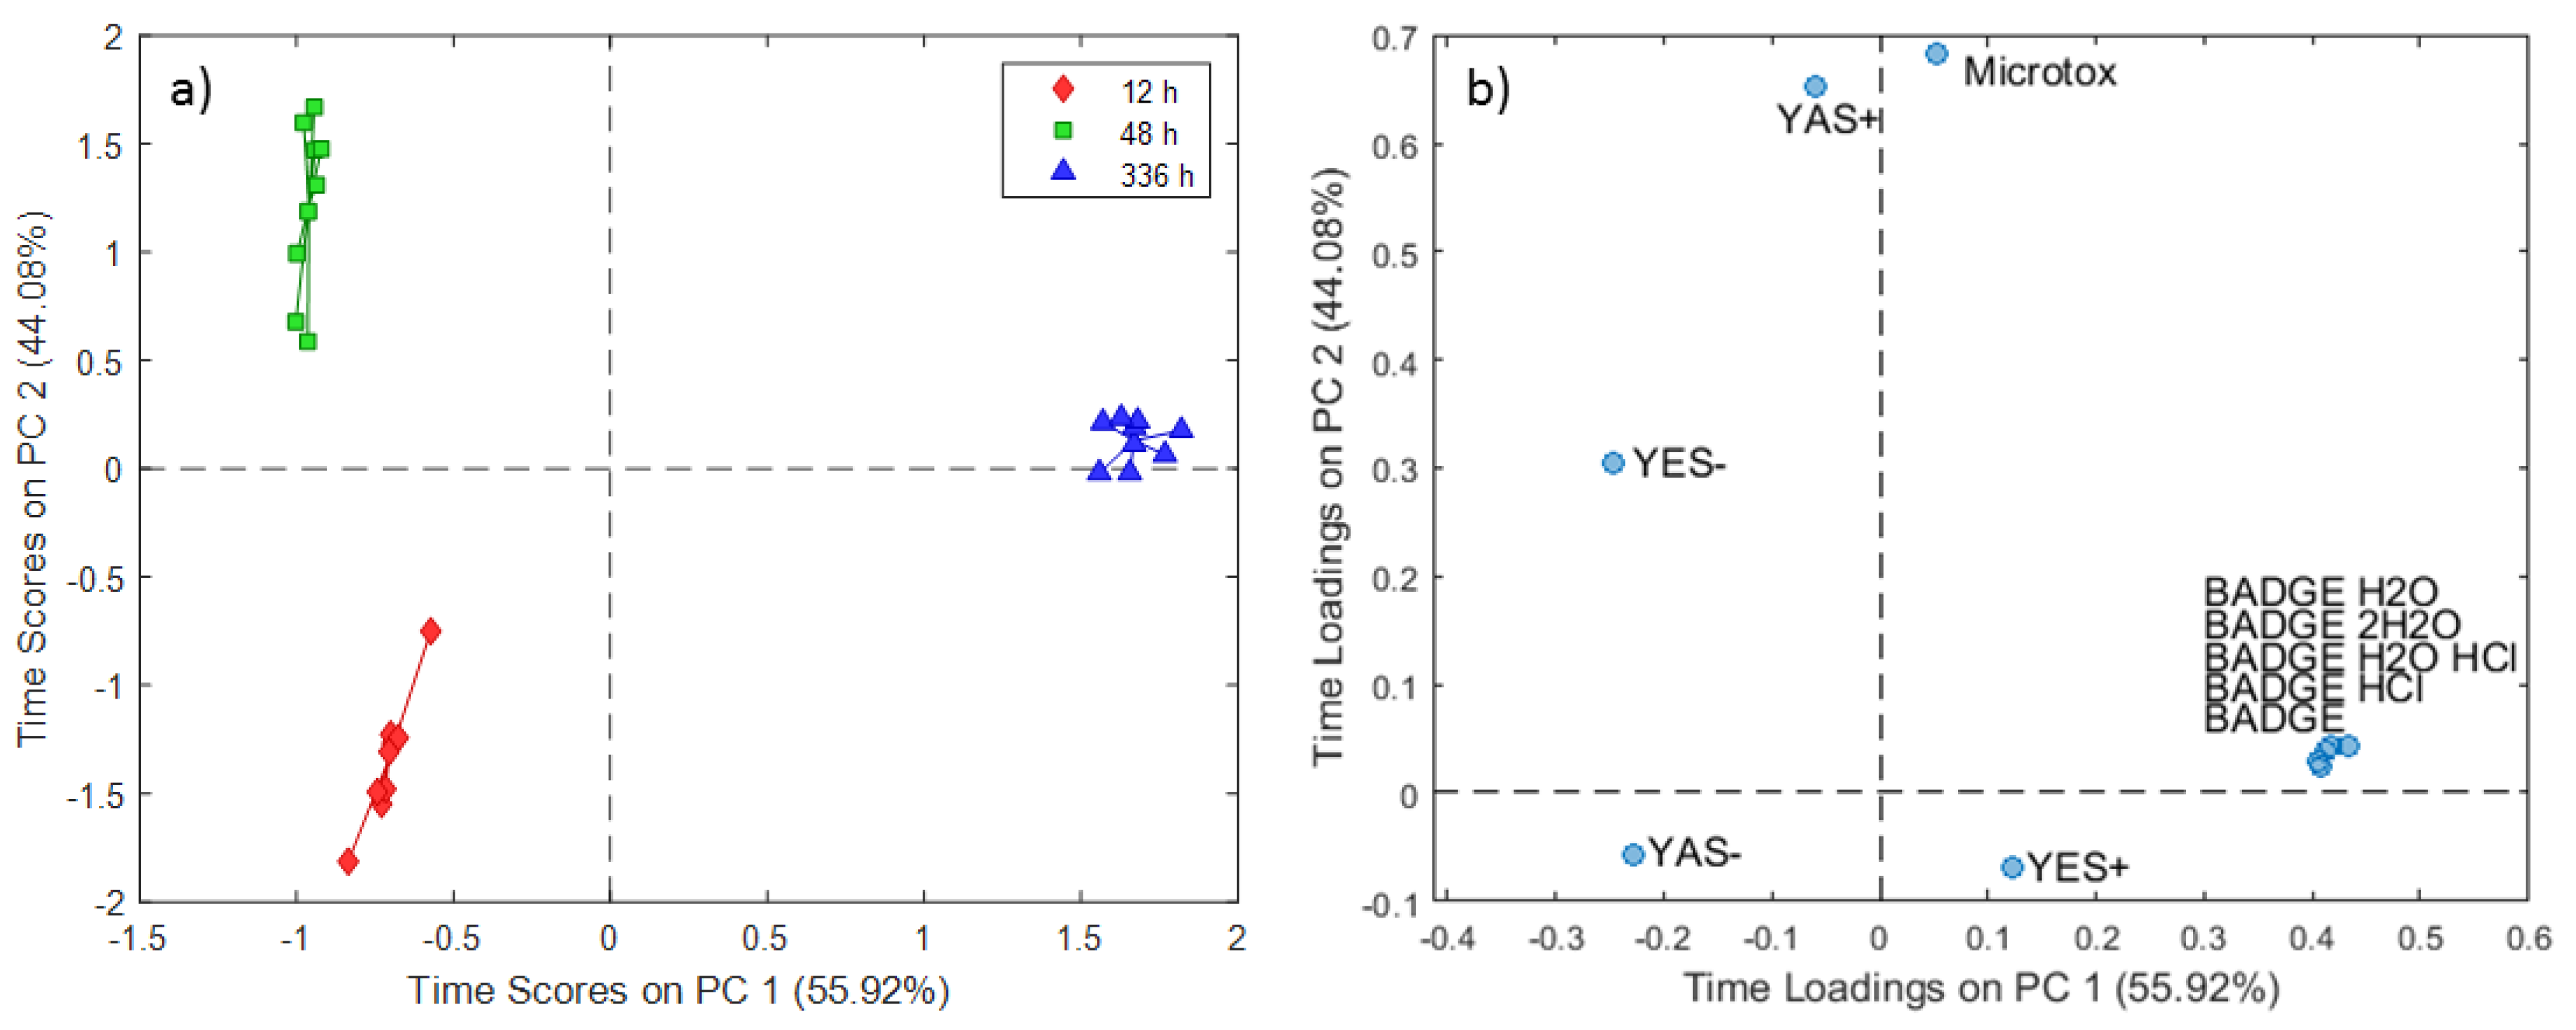
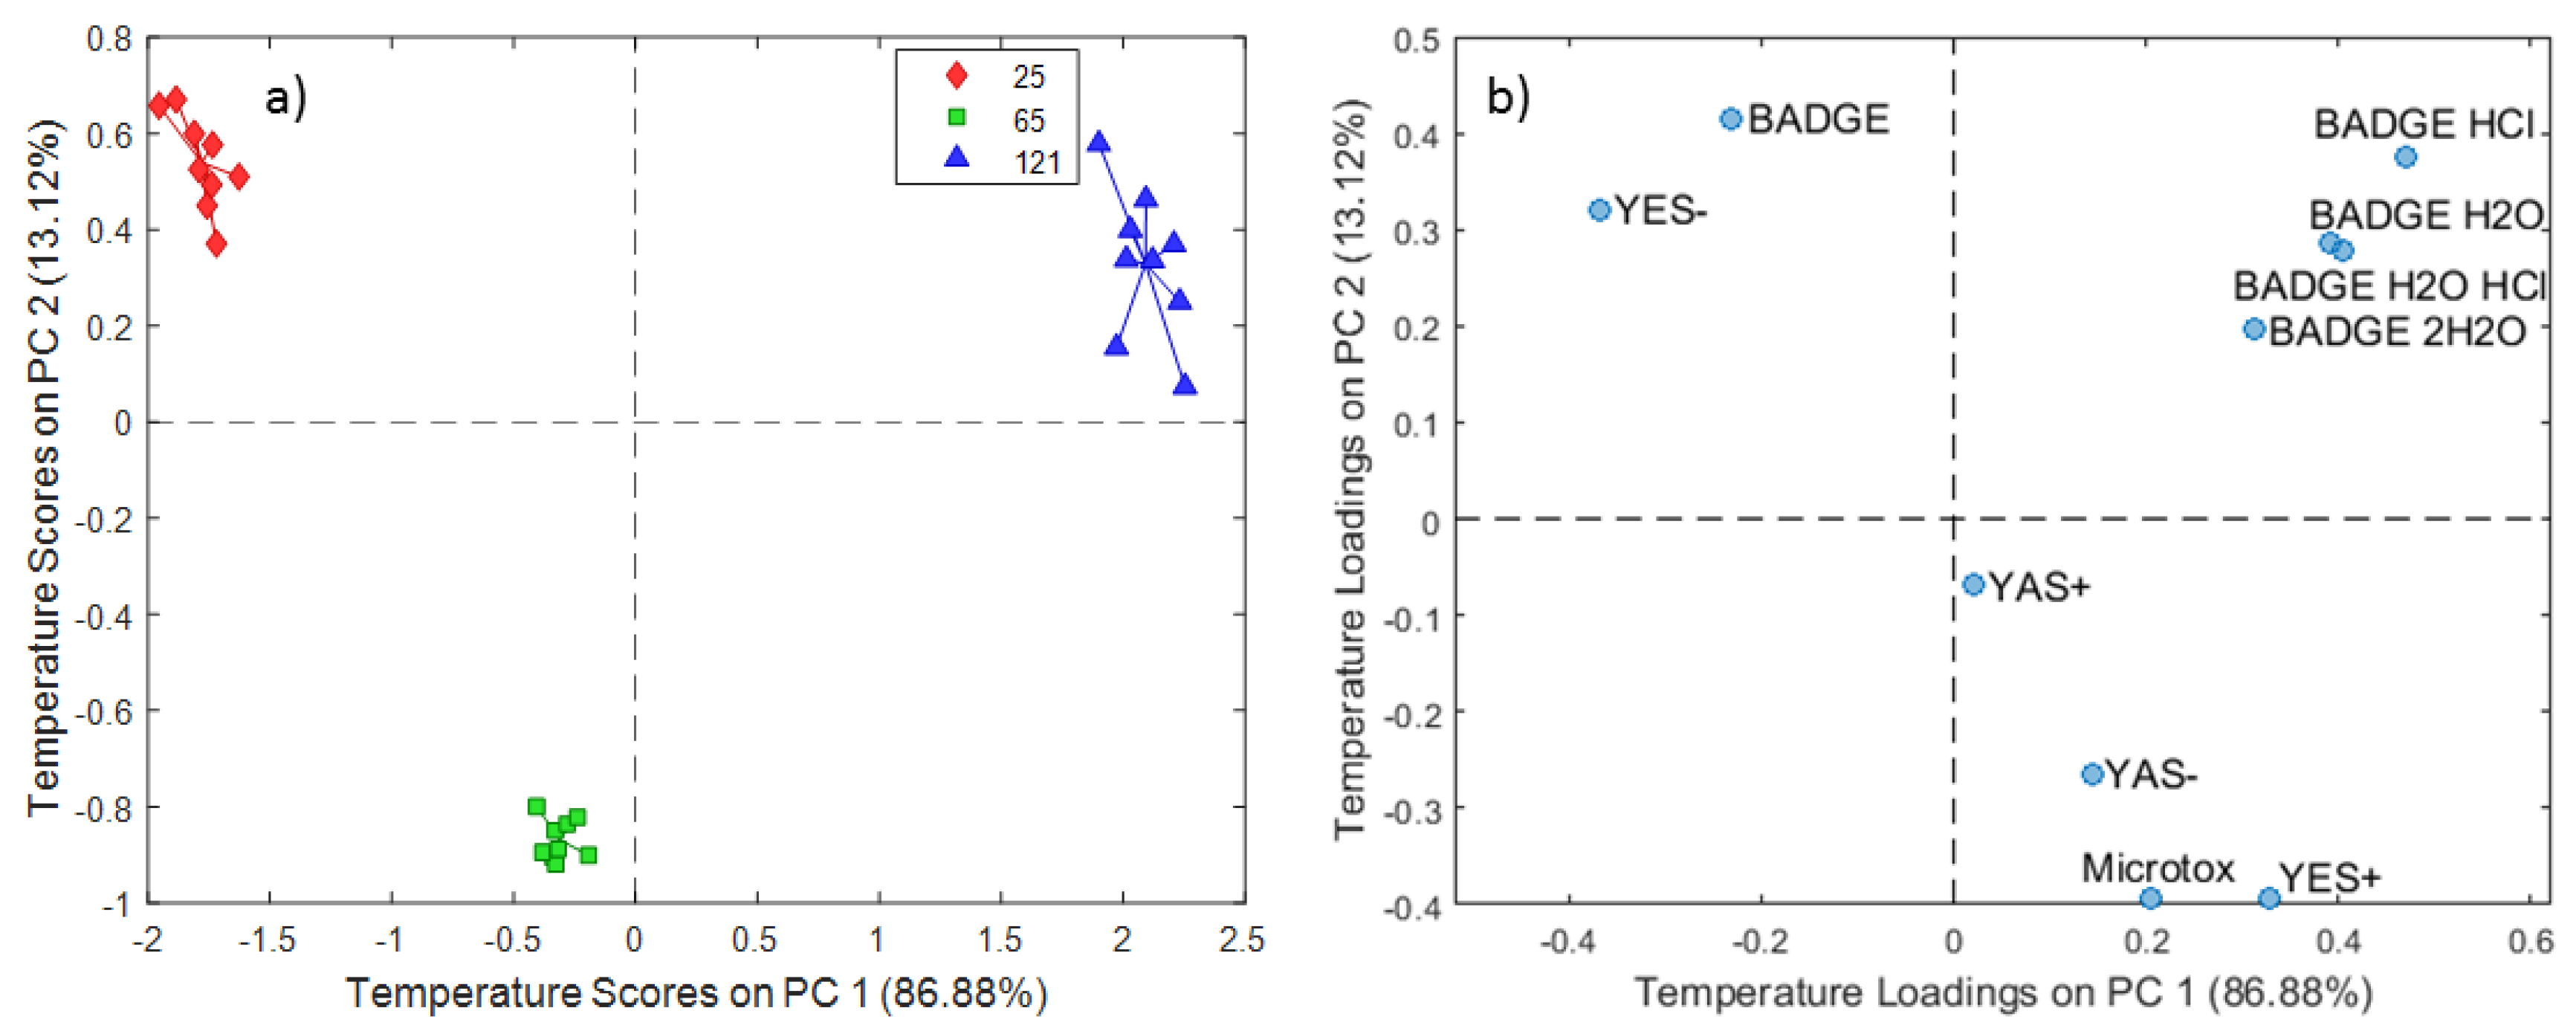
2.1. ASCA Modeling of Can Extracts
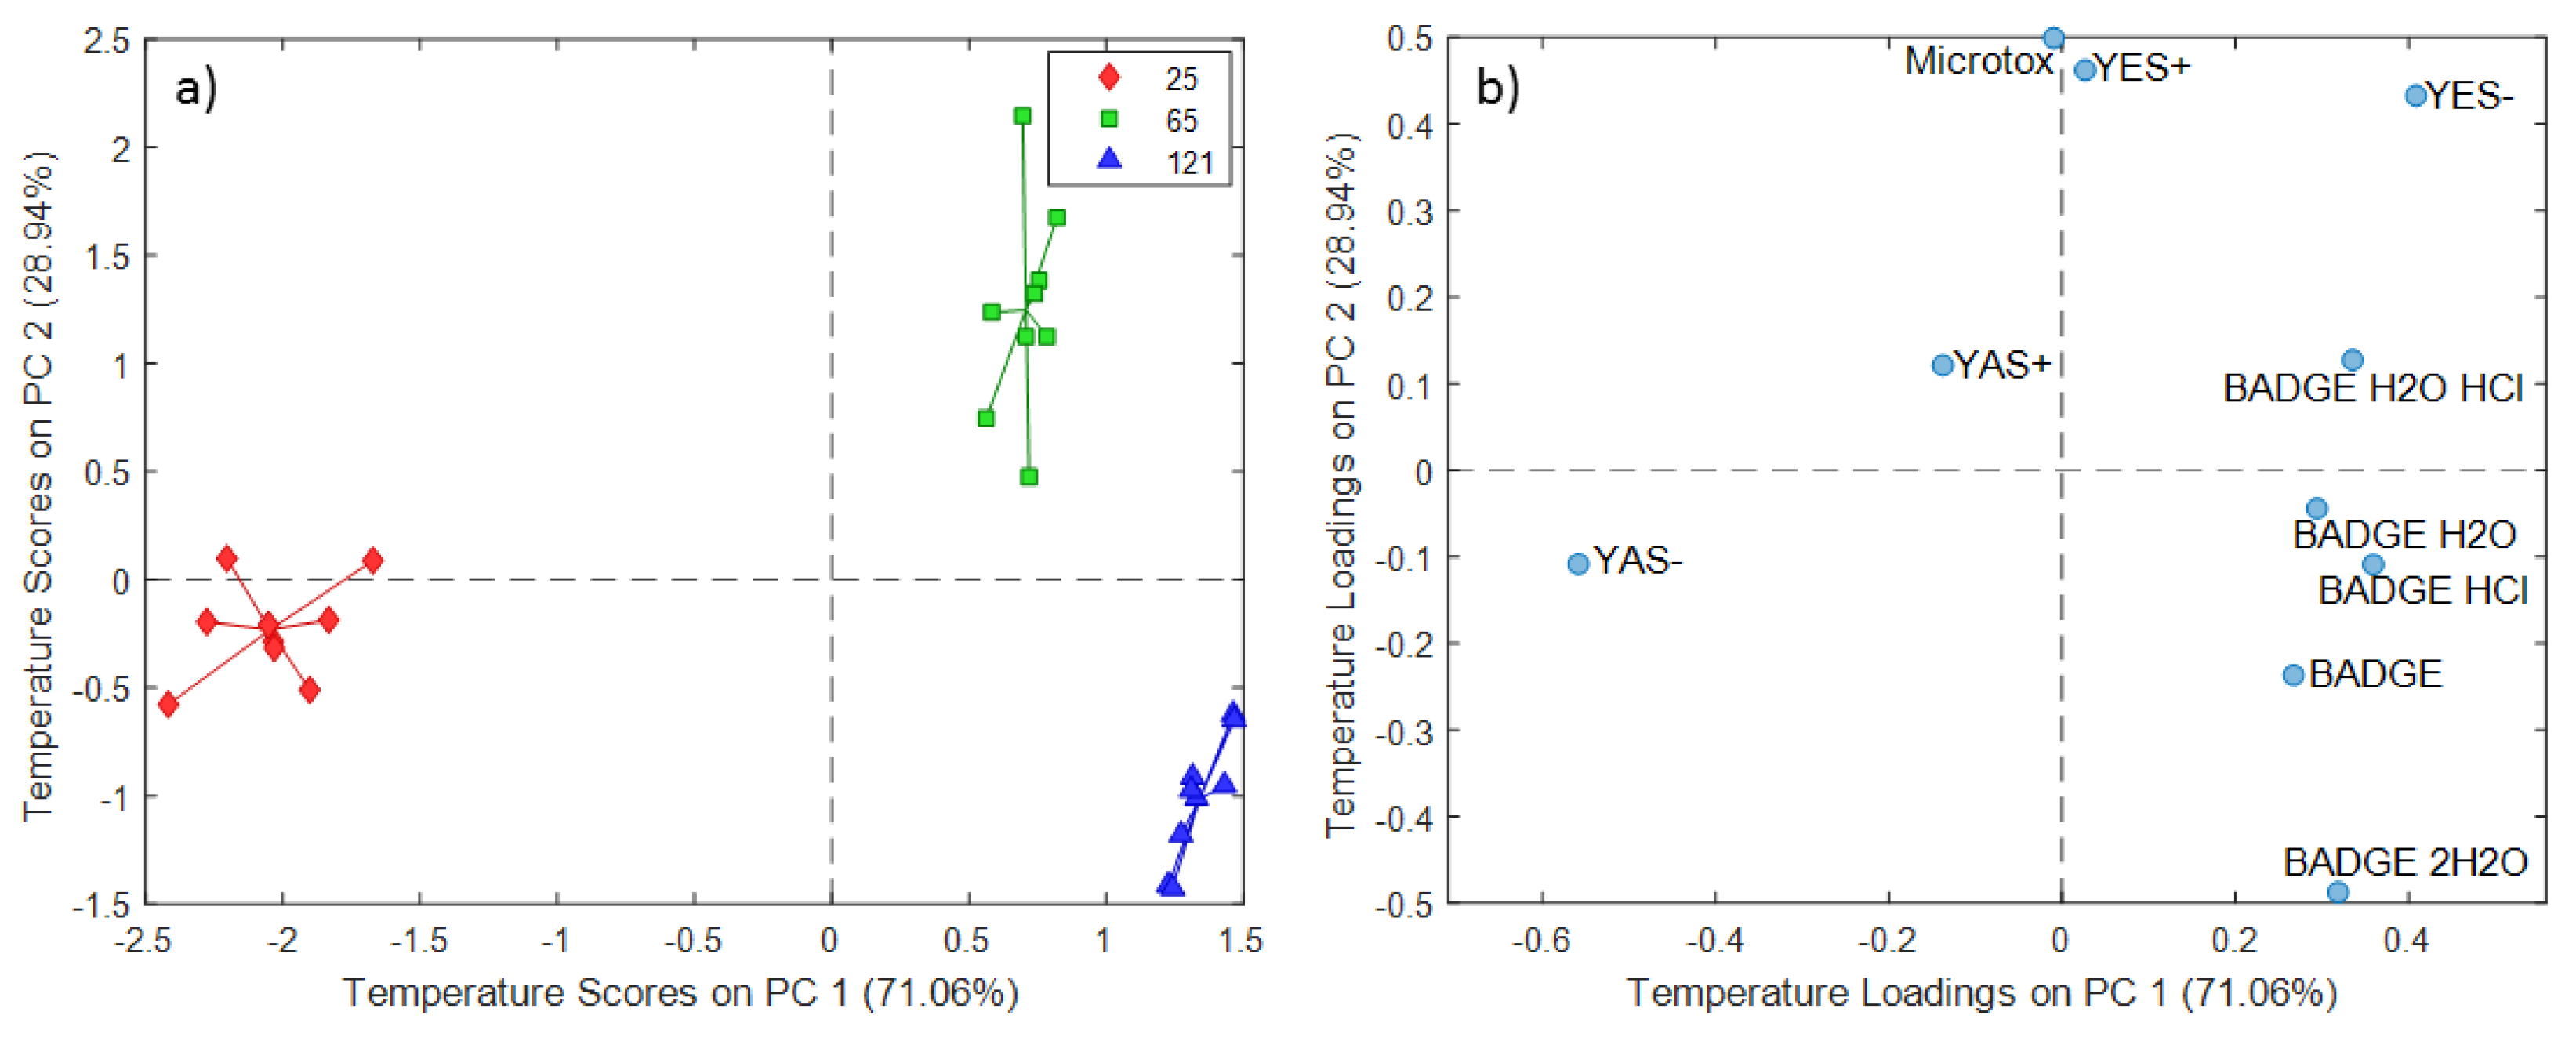
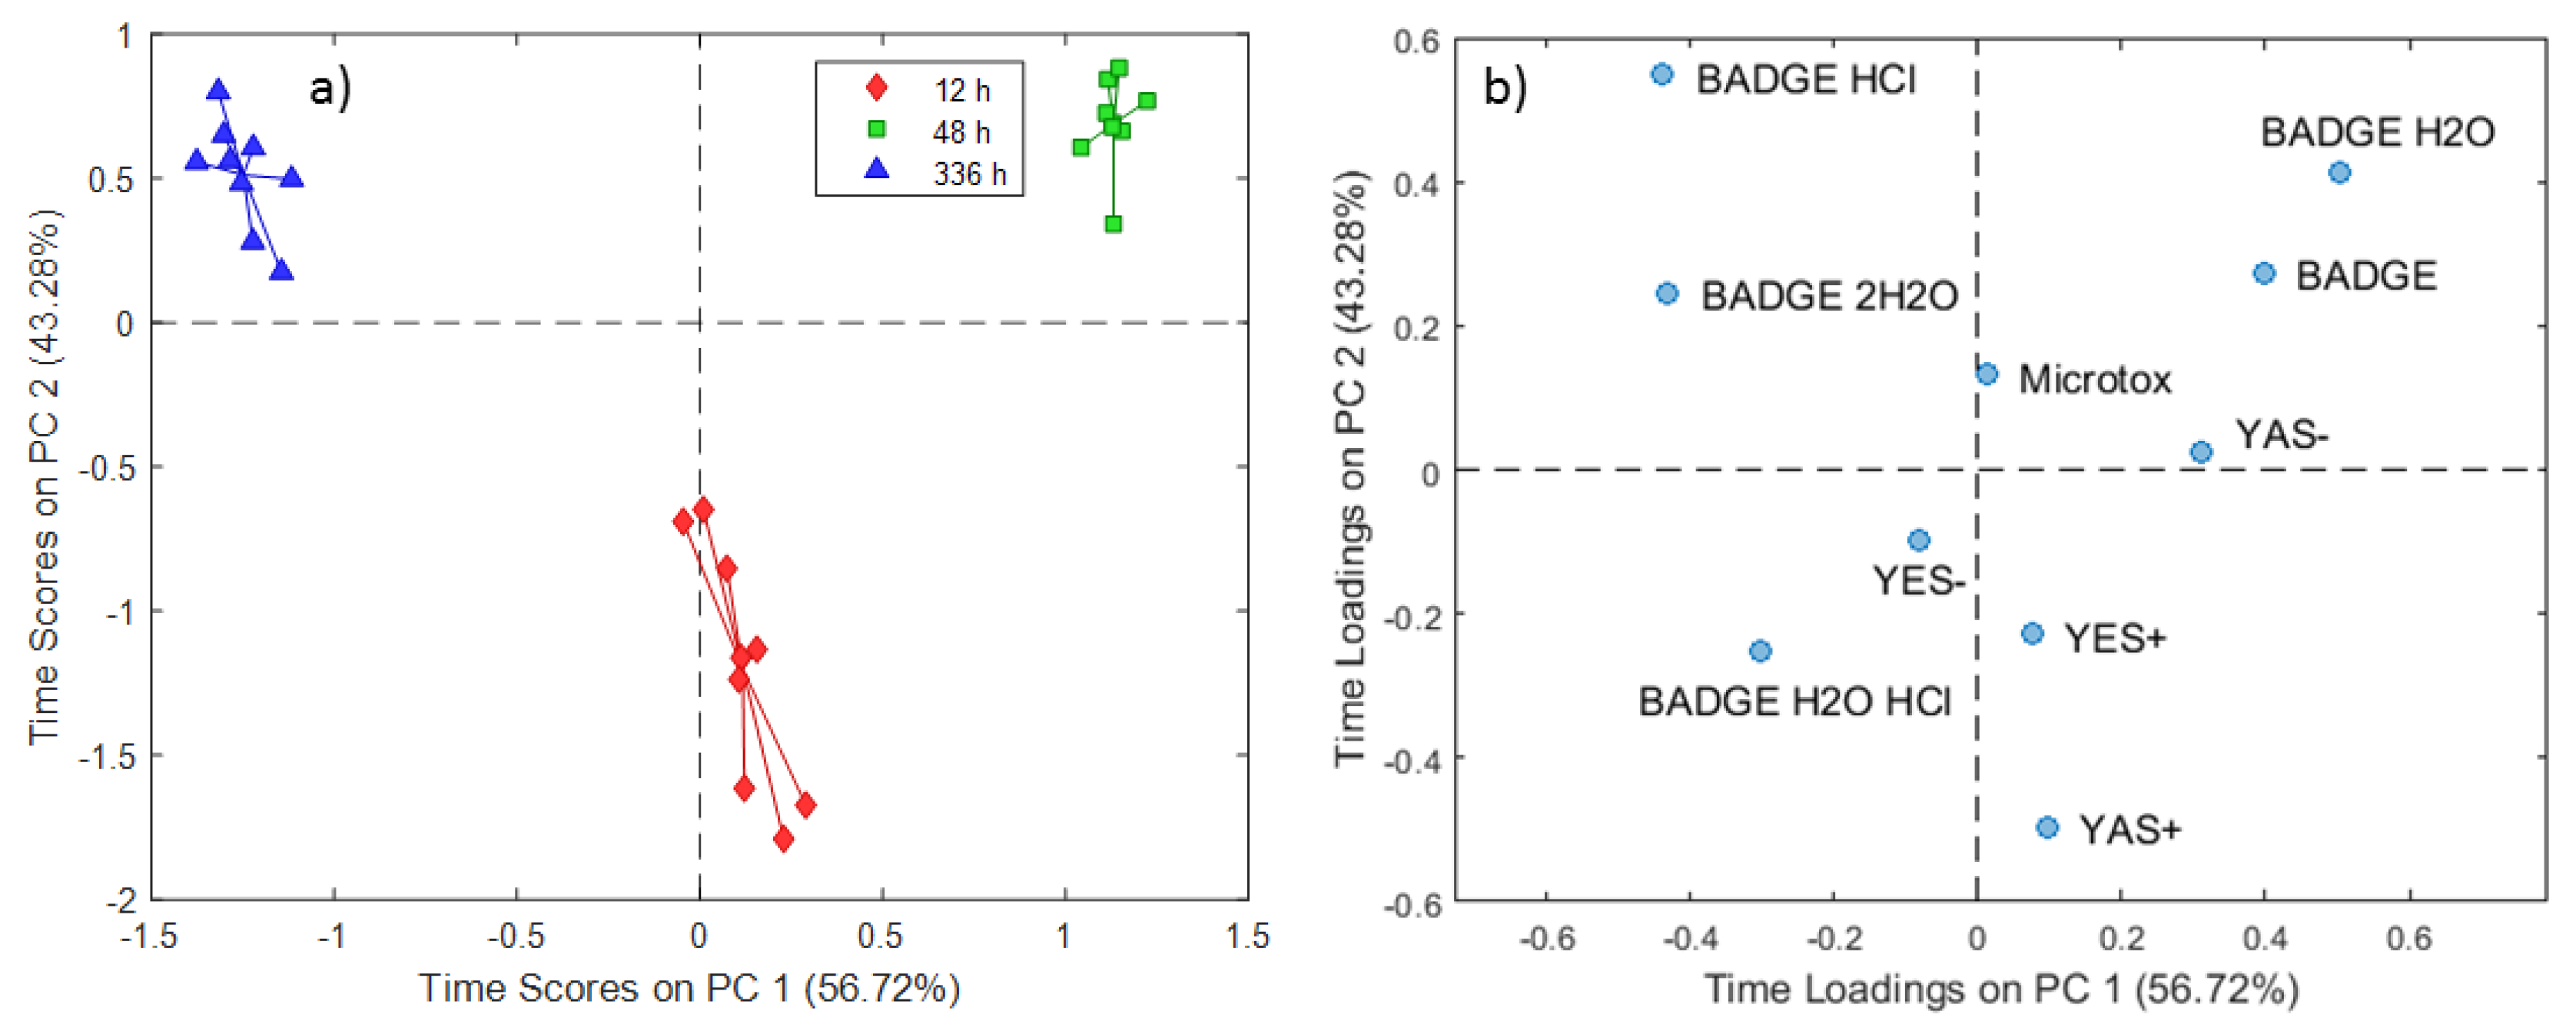
2.2. ASCA Modeling of Multi-Layered Composite Material Extracts
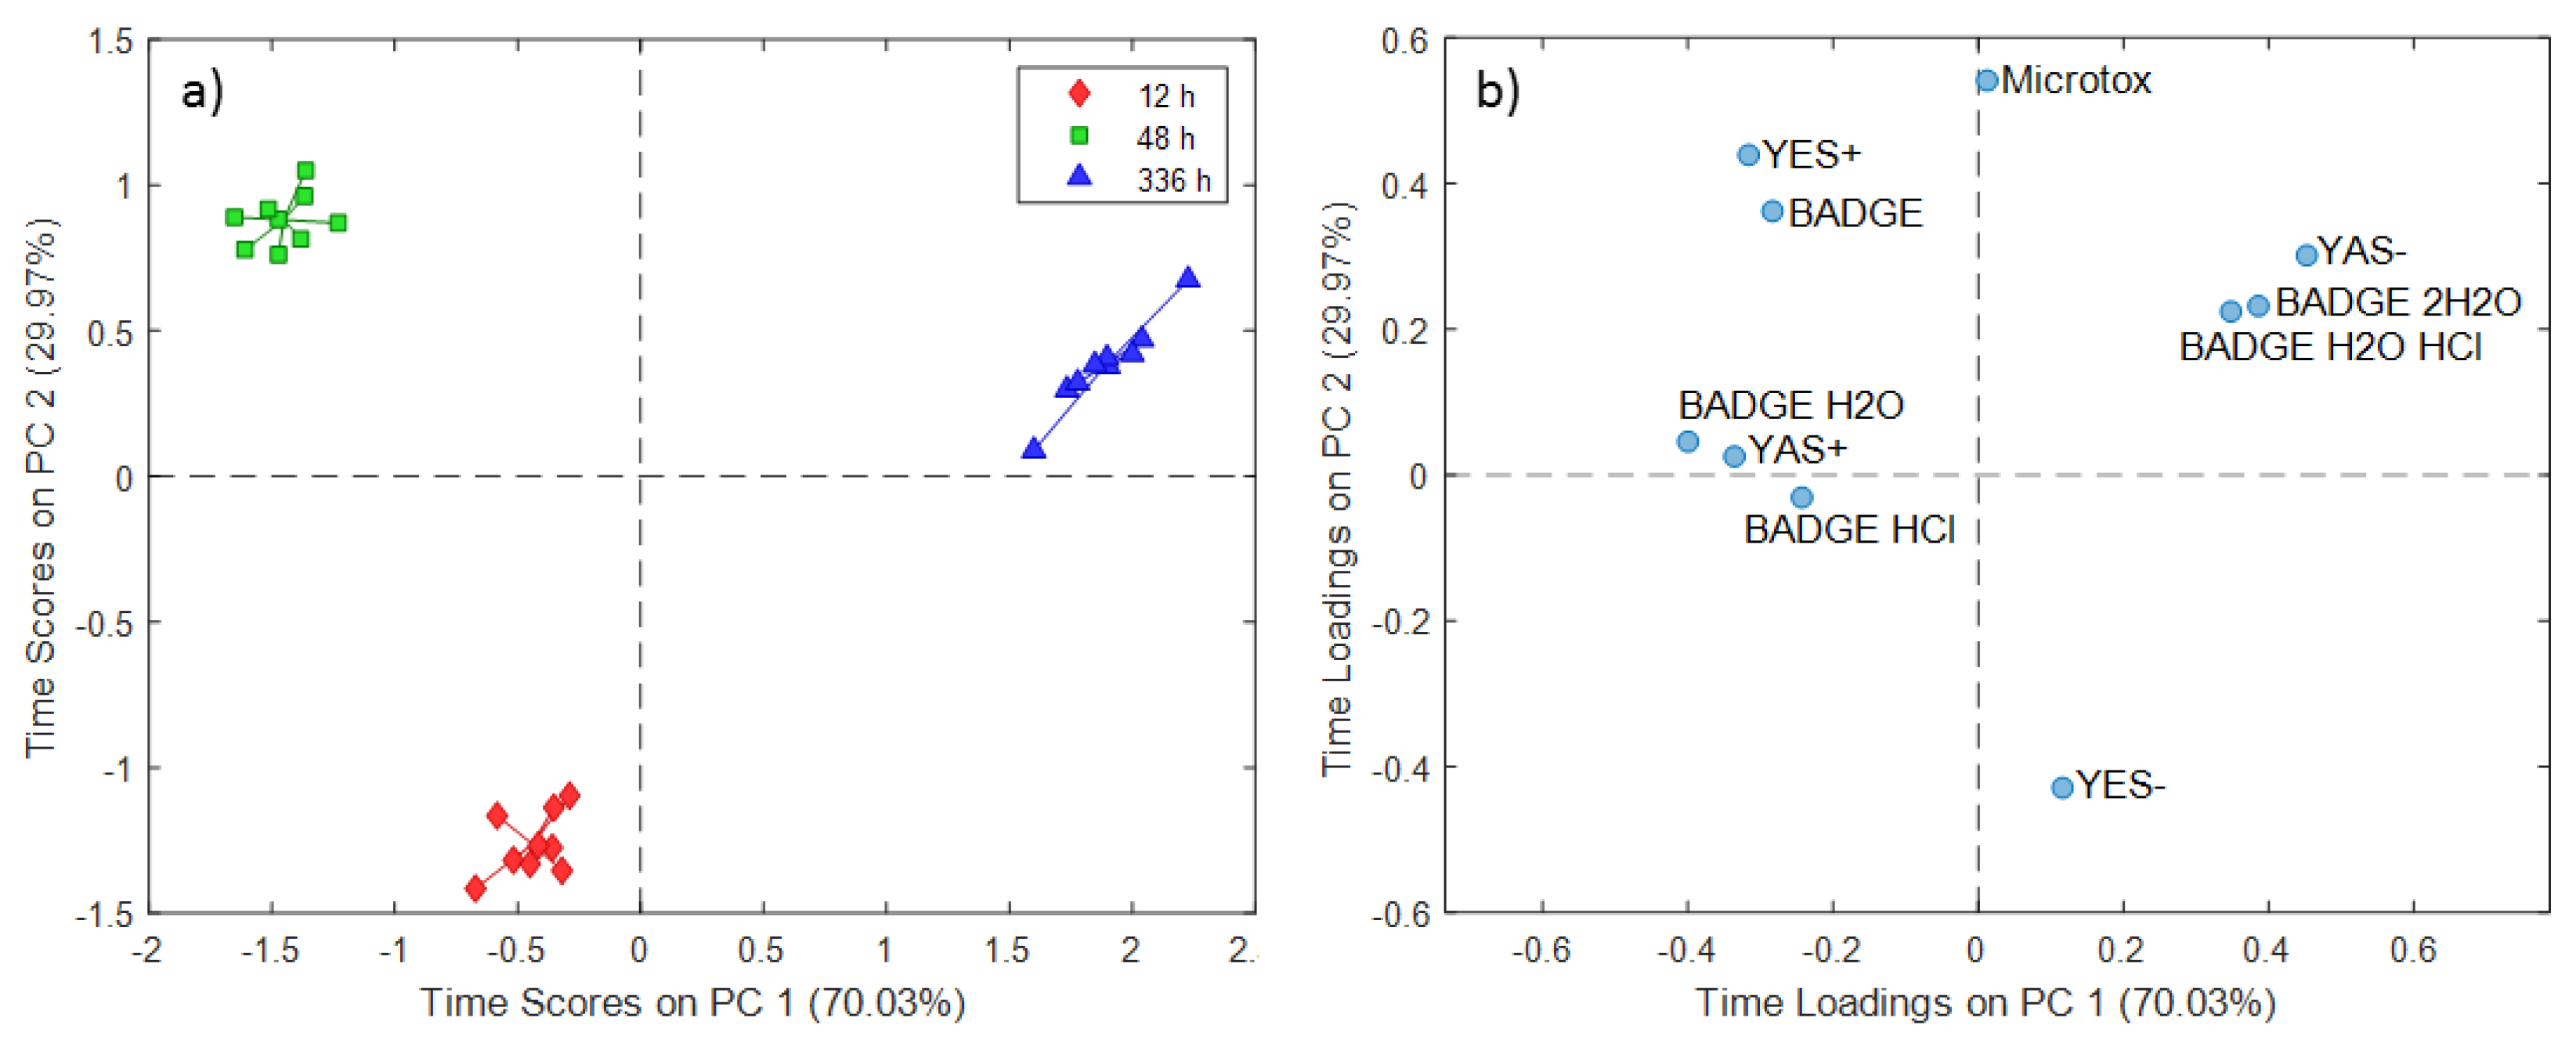
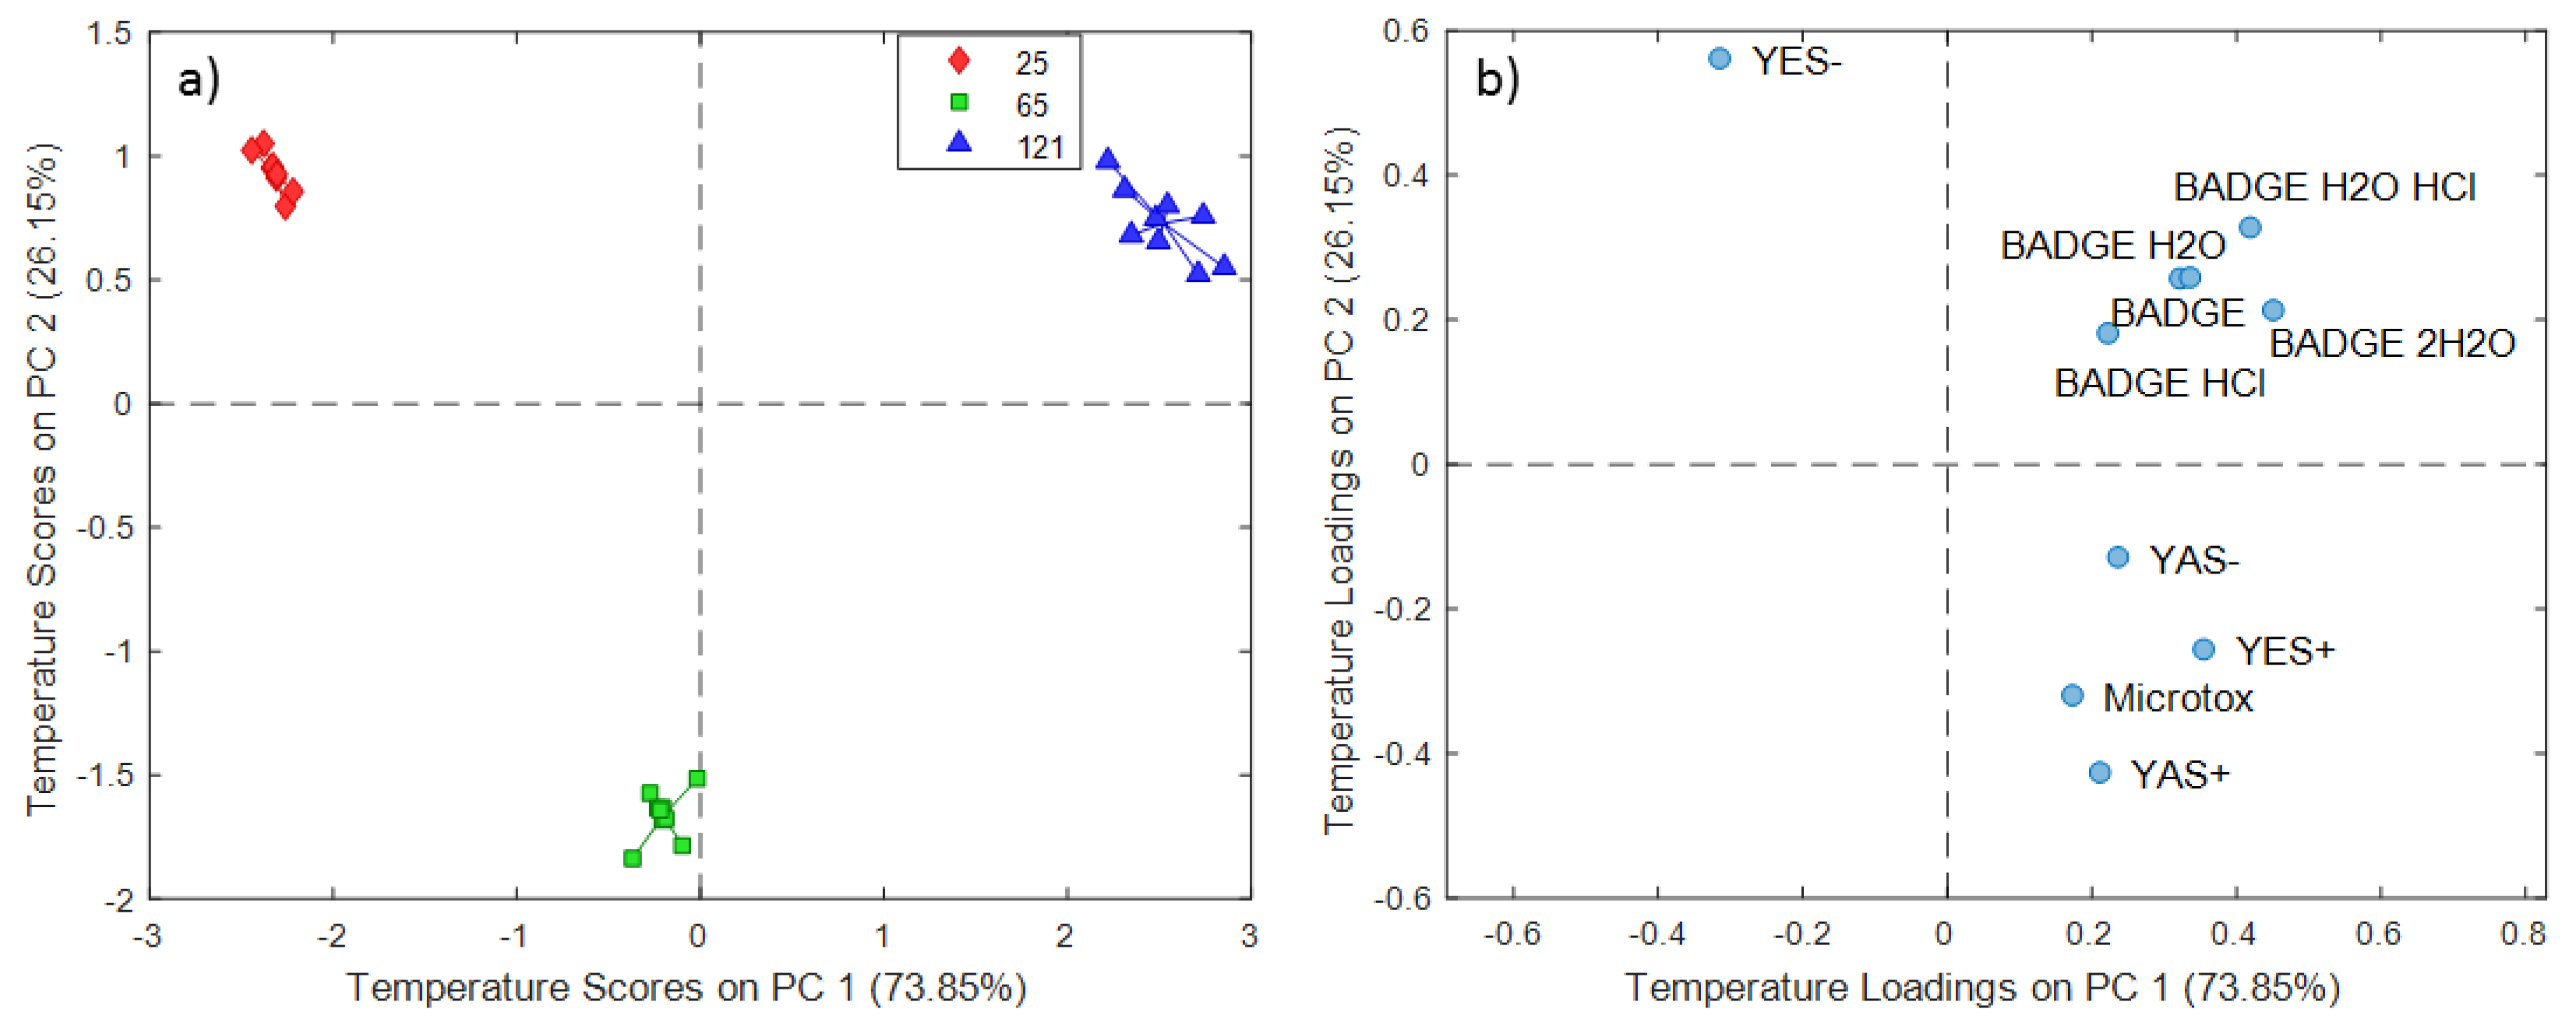
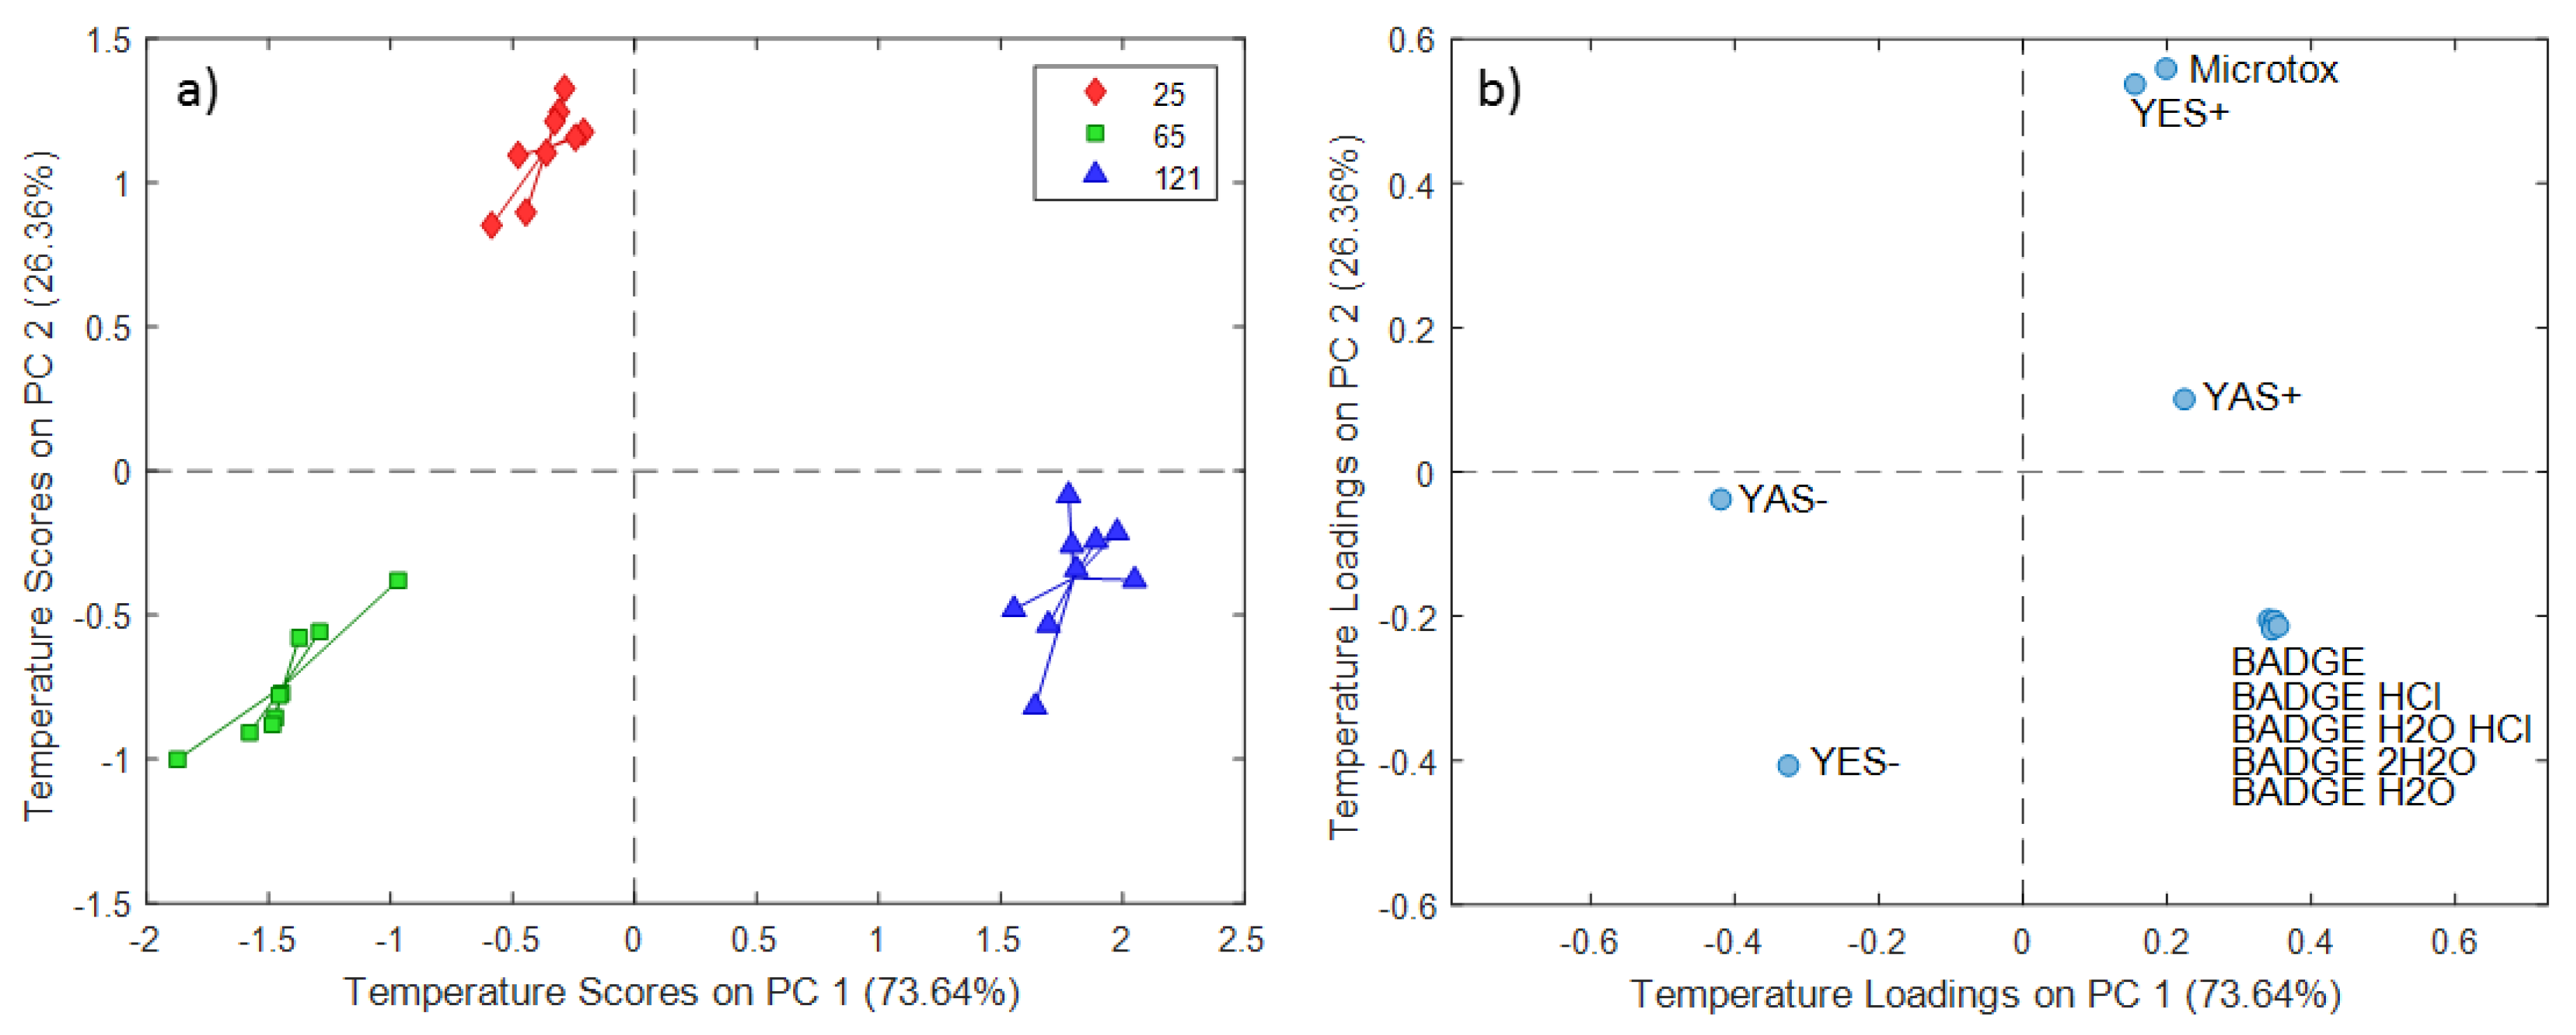
2.3. ASCA Modeling of Cup Extracts
3. Discussion
3.1. Discussion of ASCA Modeling of Can Extracts
3.2. Discussion of ASCA Modeling of Multi-Layered Composite Material Extracts
3.3. Discussion of ASCA Modeling of Cup Extracts
4. Materials and Methods
4.1. Chemicals
4.2. Instrumental and Biological Studies
4.3. Chemometric Data Analysis
5. Conclusions
Supplementary Materials
Author Contributions
Funding
Conflicts of Interest
References
- Ghaani, M.; Cozzolino, C.; Castelli, G.; Farris, S. An overview of the intelligent packaging technologies in the food sector. Trends Food Sci. Technol. 2016, 51, 1–11. [Google Scholar] [CrossRef]
- Hurme, E.; Wirtanen, G.; Axelson-Larsson, L.; Mattila-Sandholm, T.; Ahvenainer, R. Reliability of Destructive Leakage Detection Methods for Semirigid Retort Packages. Packag. Technol. Sci. 1996, 9, 203–213. [Google Scholar] [CrossRef]
- Pet, H.M.C.; Witvoet, H.J.; Warner, R. Mechanism of Microbiological Leaker Spoilage of Canned Foods: Biophysical Aspects. J. Food Prot. 1980, 43, 488–497. [Google Scholar] [CrossRef] [PubMed]
- Yokokawa, N.; Kikuchi-Uehara, E.; Sugiyama, H.; Hirao, M. Framework for analyzing the effects of packaging on food loss reduction by considering consumer behaviour. J. Clean. Prod. 2018, 174, 26–34. [Google Scholar] [CrossRef]
- Szczepańska, N.; Kudłak, B.; Namieśnik, J. Recent advances in assessing xenobiotics migrating from packaging material—A review. Anal. Chim. Acta. 2018, 1023, 1–21. [Google Scholar] [CrossRef] [PubMed]
- Bertoluci, G.; Leroy, Y.; Olsson, A. Exploring the environmental impacts of olive packaging solutions for the European food market. J. Clean. Prod. 2014, 64, 234–243. [Google Scholar] [CrossRef]
- Fedotova, A.V.; Snezhko, A.G.; Sdobnikova, O.A.; Samoilova, L.G.; Smurova, T.A.; Revina, A.A.; Khailova, E.B. Packaging Materials Manufactured from Natural Polymers Modified with Silver Nanoparticles. Int. Polym. Sci. Technol. 2018, 37, 59–64. [Google Scholar] [CrossRef]
- Chamorro-Garcia, R.; Kirchner, S.; Li, X.; Janesick, A.; Casey, S.C.; Chow, C.; Blumberg, B. Bisphenol A diglycidyl ether induces adipogenic differentiation of multipotent stromal stem cells through a peroxisome proliferator-activated receptor gamma-independent mechanism. Environ. Health Perspect. 2012, 120, 984–989. [Google Scholar] [CrossRef] [PubMed]
- DIN 53160-1:2010-10, Determination of the Colourfastness of Articles for Common Use—Part 1: Test with Artificial Saliva. Available online: https://www.beuth.de/en/standard/din-53160-1/133532232 (accessed on 28 November 2019).
- Fierens, T.; Servaes, K.; Van Holderbeke, M.; Geerts, L.; De Henauw, S.; Sioen, I.; Vanermen, G. Analysis of phthalates in food products and packaging materials sold on the Belgian market. Food Chem. Toxicol. 2012, 50, 2575–2583. [Google Scholar] [CrossRef] [PubMed]
- Szczepańska, N.; Kudłak, B.; Tsakovski, S.; Yotova, G.; Nedyalkova, M.; Simeonov, V.; Dołęga, A.; Namieśnik, J. Modeling and MANOVA studies on toxicity and endocrine potential of packaging materials exposed to different extraction schemes. Environ. Res. 2018, 165, 294–305. [Google Scholar] [CrossRef] [PubMed]
- Szczepańska, N.; Kubica, P.; Kudłak, B.; Namieśnik, J.; Wasik, A. Stabilities of bisphenol A diglycidyl ether, bisphenol F diglycidyl ether, and their derivatives under controlled conditions analyzed using liquid chromatography coupled with tandem mass spectrometry. Anal. Bioanal. Chem. 2019, 411, 6387–6398. [Google Scholar] [CrossRef] [PubMed]
- Jansen, J.J.; Hoefsloot, H.C.J.; van der Greef, J.; Timmerman, M.E.; Smilde, A.K. ASCA: Analysis of multivariate data obtained from an experimental design. J. Chemom. 2005, 19, 469–481. [Google Scholar] [CrossRef]
- Smilde, A.K.; Jansen, J.J.; Hoefsloot, H.C.J.; Lamers, R.A.N.; van der Greef, J.; Timmerman, M.E. ANOVA-simultaneous component analysis (ASCA): A new tool for analyzing designed metabolomics data. Bioinformatics 2005, 21, 3043–3048. [Google Scholar] [CrossRef]
- Timmerman, M.E.; Hoefsloot, H.C.J.; Smilde, A.K.; Ceulemans, E. Scaling in ANOVA-simultaneous component analysis. Metabolomics 2015, 11, 1265–1276. [Google Scholar] [CrossRef]
Sample Availability: Samples are available from the author after personal communication. |


| Solvent | Factor | Expl. Var. [%] | Significance (p-Value) |
|---|---|---|---|
| Distilled water | time | 14.7 | < 0.01 |
| temperature | 55.3 | < 0.01 | |
| time temperature | 27.1 | < 0.01 | |
| residuals | 2.8 | ||
| 5% ethanol | time | 17.4 | < 0.01 |
| temperature | 31.6 | < 0.01 | |
| time temperature | 44.9 | < 0.01 | |
| residuals | 6.1 | ||
| 3% acetic acid | time | 29.0 | < 0.01 |
| temperature | 30.4 | < 0.01 | |
| time temperature | 38.8 | < 0.01 | |
| residuals | 1.7 | ||
| 5% DMSO | time | 26.1 | < 0.01 |
| temperature | 25.5 | < 0.01 | |
| time temperature | 46.2 | < 0.01 | |
| residuals | 2.2 |
| Solvent | Factor | Expl. Var. (%) | Significance (p-Value) |
|---|---|---|---|
| Distilled water | time | 13.4 | < 0.01 |
| temperature | 26.4 | < 0.01 | |
| time temperature | 49.8 | < 0.01 | |
| residuals | 10.4 | ||
| 5% ethanol | time | 12.7 | < 0.01 |
| temperature | 48.0 | < 0.01 | |
| time temperature | 34.1 | < 0.01 | |
| residuals | 5.2 | ||
| 3% acetic acid | time | 27.6 | < 0.01 |
| temperature | 28.0 | < 0.01 | |
| time temperature | 41.6 | < 0.01 | |
| residuals | 2.8 | ||
| 5% DMSO | time | 17.0 | < 0.01 |
| temperature | 37.8 | < 0.01 | |
| time temperature | 42.2 | < 0.01 | |
| residuals | 3.0 |
| Solvent | Factor | Expl. Var. [%] | Significance (p-Value) |
|---|---|---|---|
| Distilled water | time | 26.1 | < 0.01 |
| temperature | 14.2 | < 0.01 | |
| time temperature | 54.2 | < 0.01 | |
| residuals | 5.5 | ||
| 5% ethanol | time | 23.9 | < 0.01 |
| temperature | 33.1 | < 0.01 | |
| time temperature | 36.0 | < 0.01 | |
| residuals | 7.0 | ||
| 3% acetic acid | time | 26.4 | < 0.01 |
| temperature | 21.9 | < 0.01 | |
| time temperature | 46.4 | < 0.01 | |
| residuals | 5.2 |
© 2019 by the authors. Licensee MDPI, Basel, Switzerland. This article is an open access article distributed under the terms and conditions of the Creative Commons Attribution (CC BY) license (http://creativecommons.org/licenses/by/4.0/).
Share and Cite
Kudłak, B.; Jatkowska, N.; Kubica, P.; Yotova, G.; Tsakovski, S. Influence of Storage Time and Temperature on the Toxicity, Endocrine Potential, and Migration of Epoxy Resin Precursors in Extracts of Food Packaging Materials. Molecules 2019, 24, 4396. https://doi.org/10.3390/molecules24234396
Kudłak B, Jatkowska N, Kubica P, Yotova G, Tsakovski S. Influence of Storage Time and Temperature on the Toxicity, Endocrine Potential, and Migration of Epoxy Resin Precursors in Extracts of Food Packaging Materials. Molecules. 2019; 24(23):4396. https://doi.org/10.3390/molecules24234396
Chicago/Turabian StyleKudłak, Błażej, Natalia Jatkowska, Paweł Kubica, Galina Yotova, and Stefan Tsakovski. 2019. "Influence of Storage Time and Temperature on the Toxicity, Endocrine Potential, and Migration of Epoxy Resin Precursors in Extracts of Food Packaging Materials" Molecules 24, no. 23: 4396. https://doi.org/10.3390/molecules24234396
APA StyleKudłak, B., Jatkowska, N., Kubica, P., Yotova, G., & Tsakovski, S. (2019). Influence of Storage Time and Temperature on the Toxicity, Endocrine Potential, and Migration of Epoxy Resin Precursors in Extracts of Food Packaging Materials. Molecules, 24(23), 4396. https://doi.org/10.3390/molecules24234396