Development of an Oriental Medicine Discrimination Method through Analysis of Steroidal Saponins in Dioscorea nipponica Makino and Their Anti-Osteosarcoma Effects

Abstract
1. Introduction
2. Results and Discussion
2.1. Optimization of Chromatographic Conditions
2.2. Assay Validation
2.2.1. Linearity
2.2.2. Precision and Accuracy
2.2.3. Limit of Detection (LOD) and Quantification (LOQ)
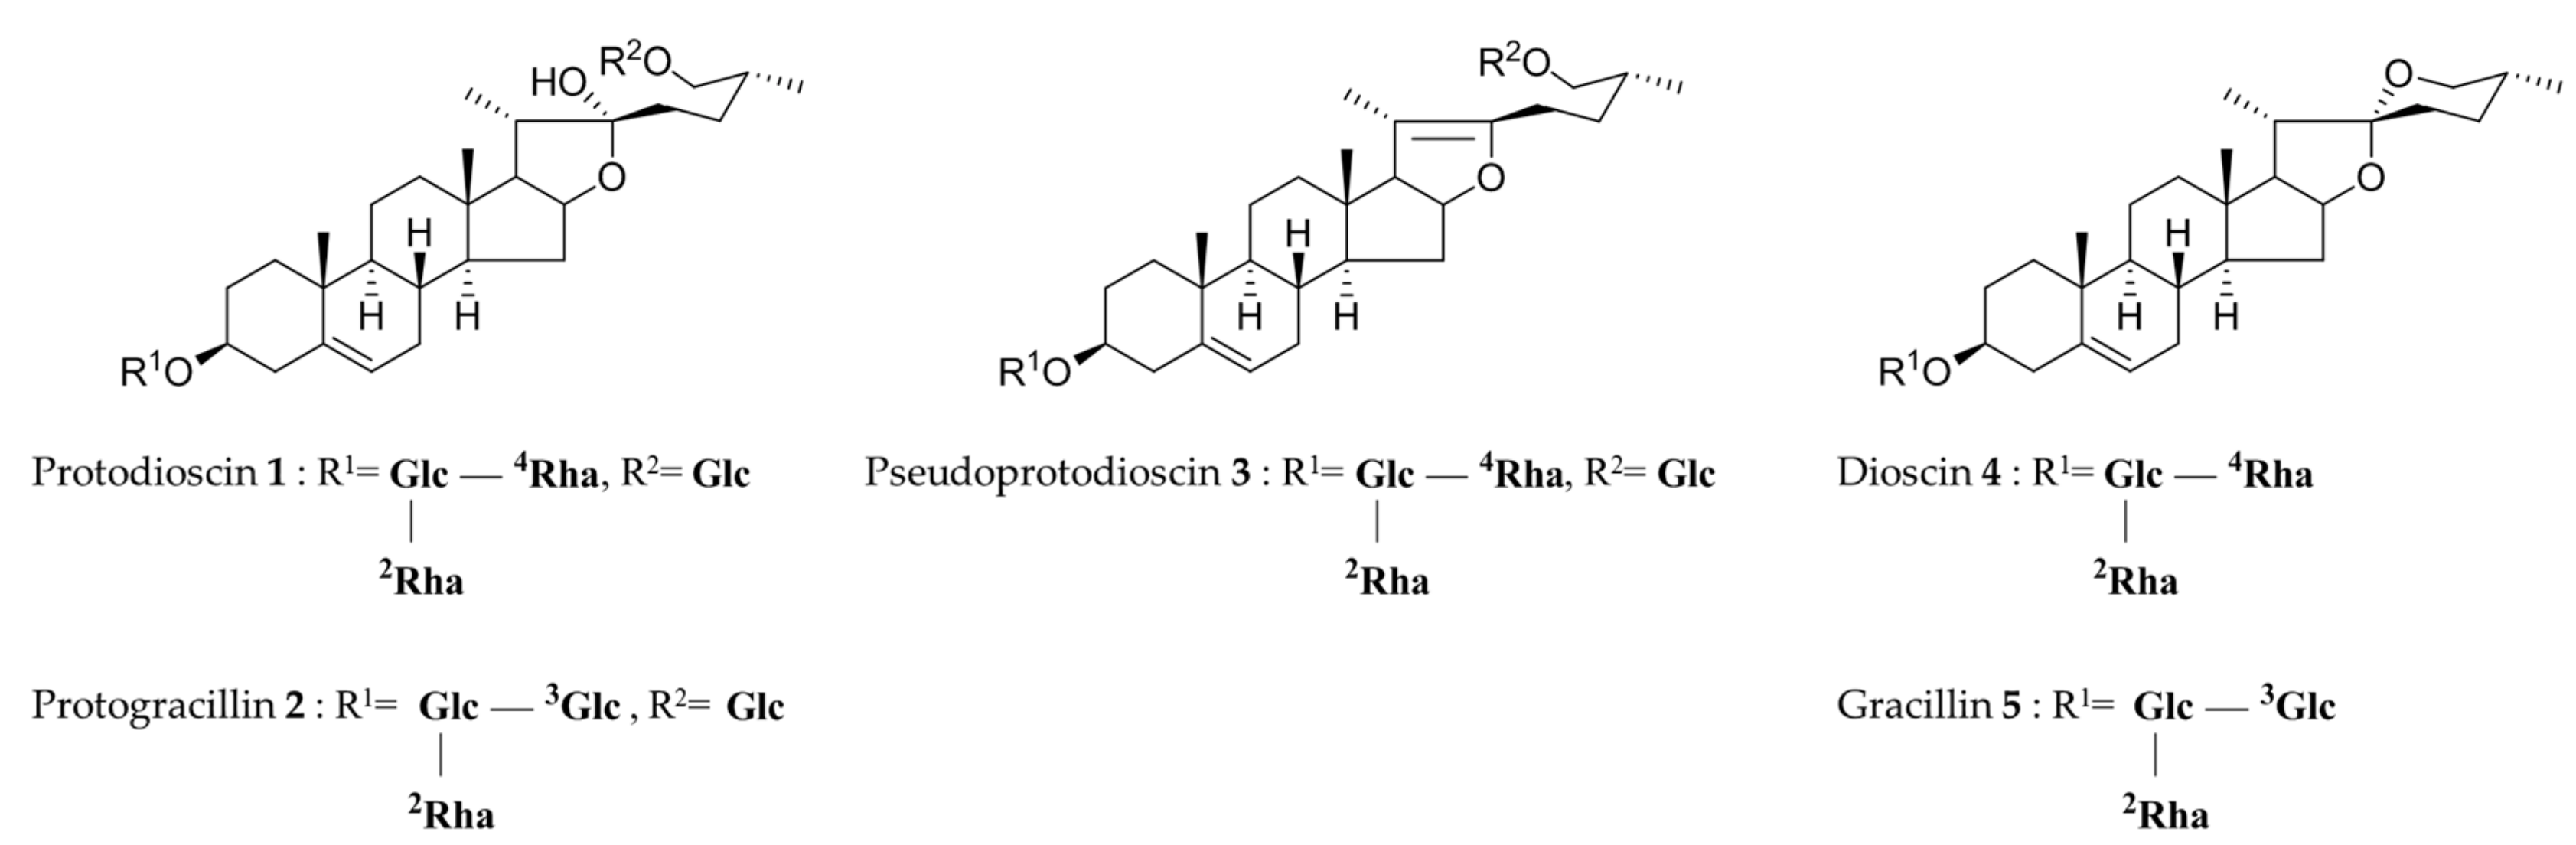
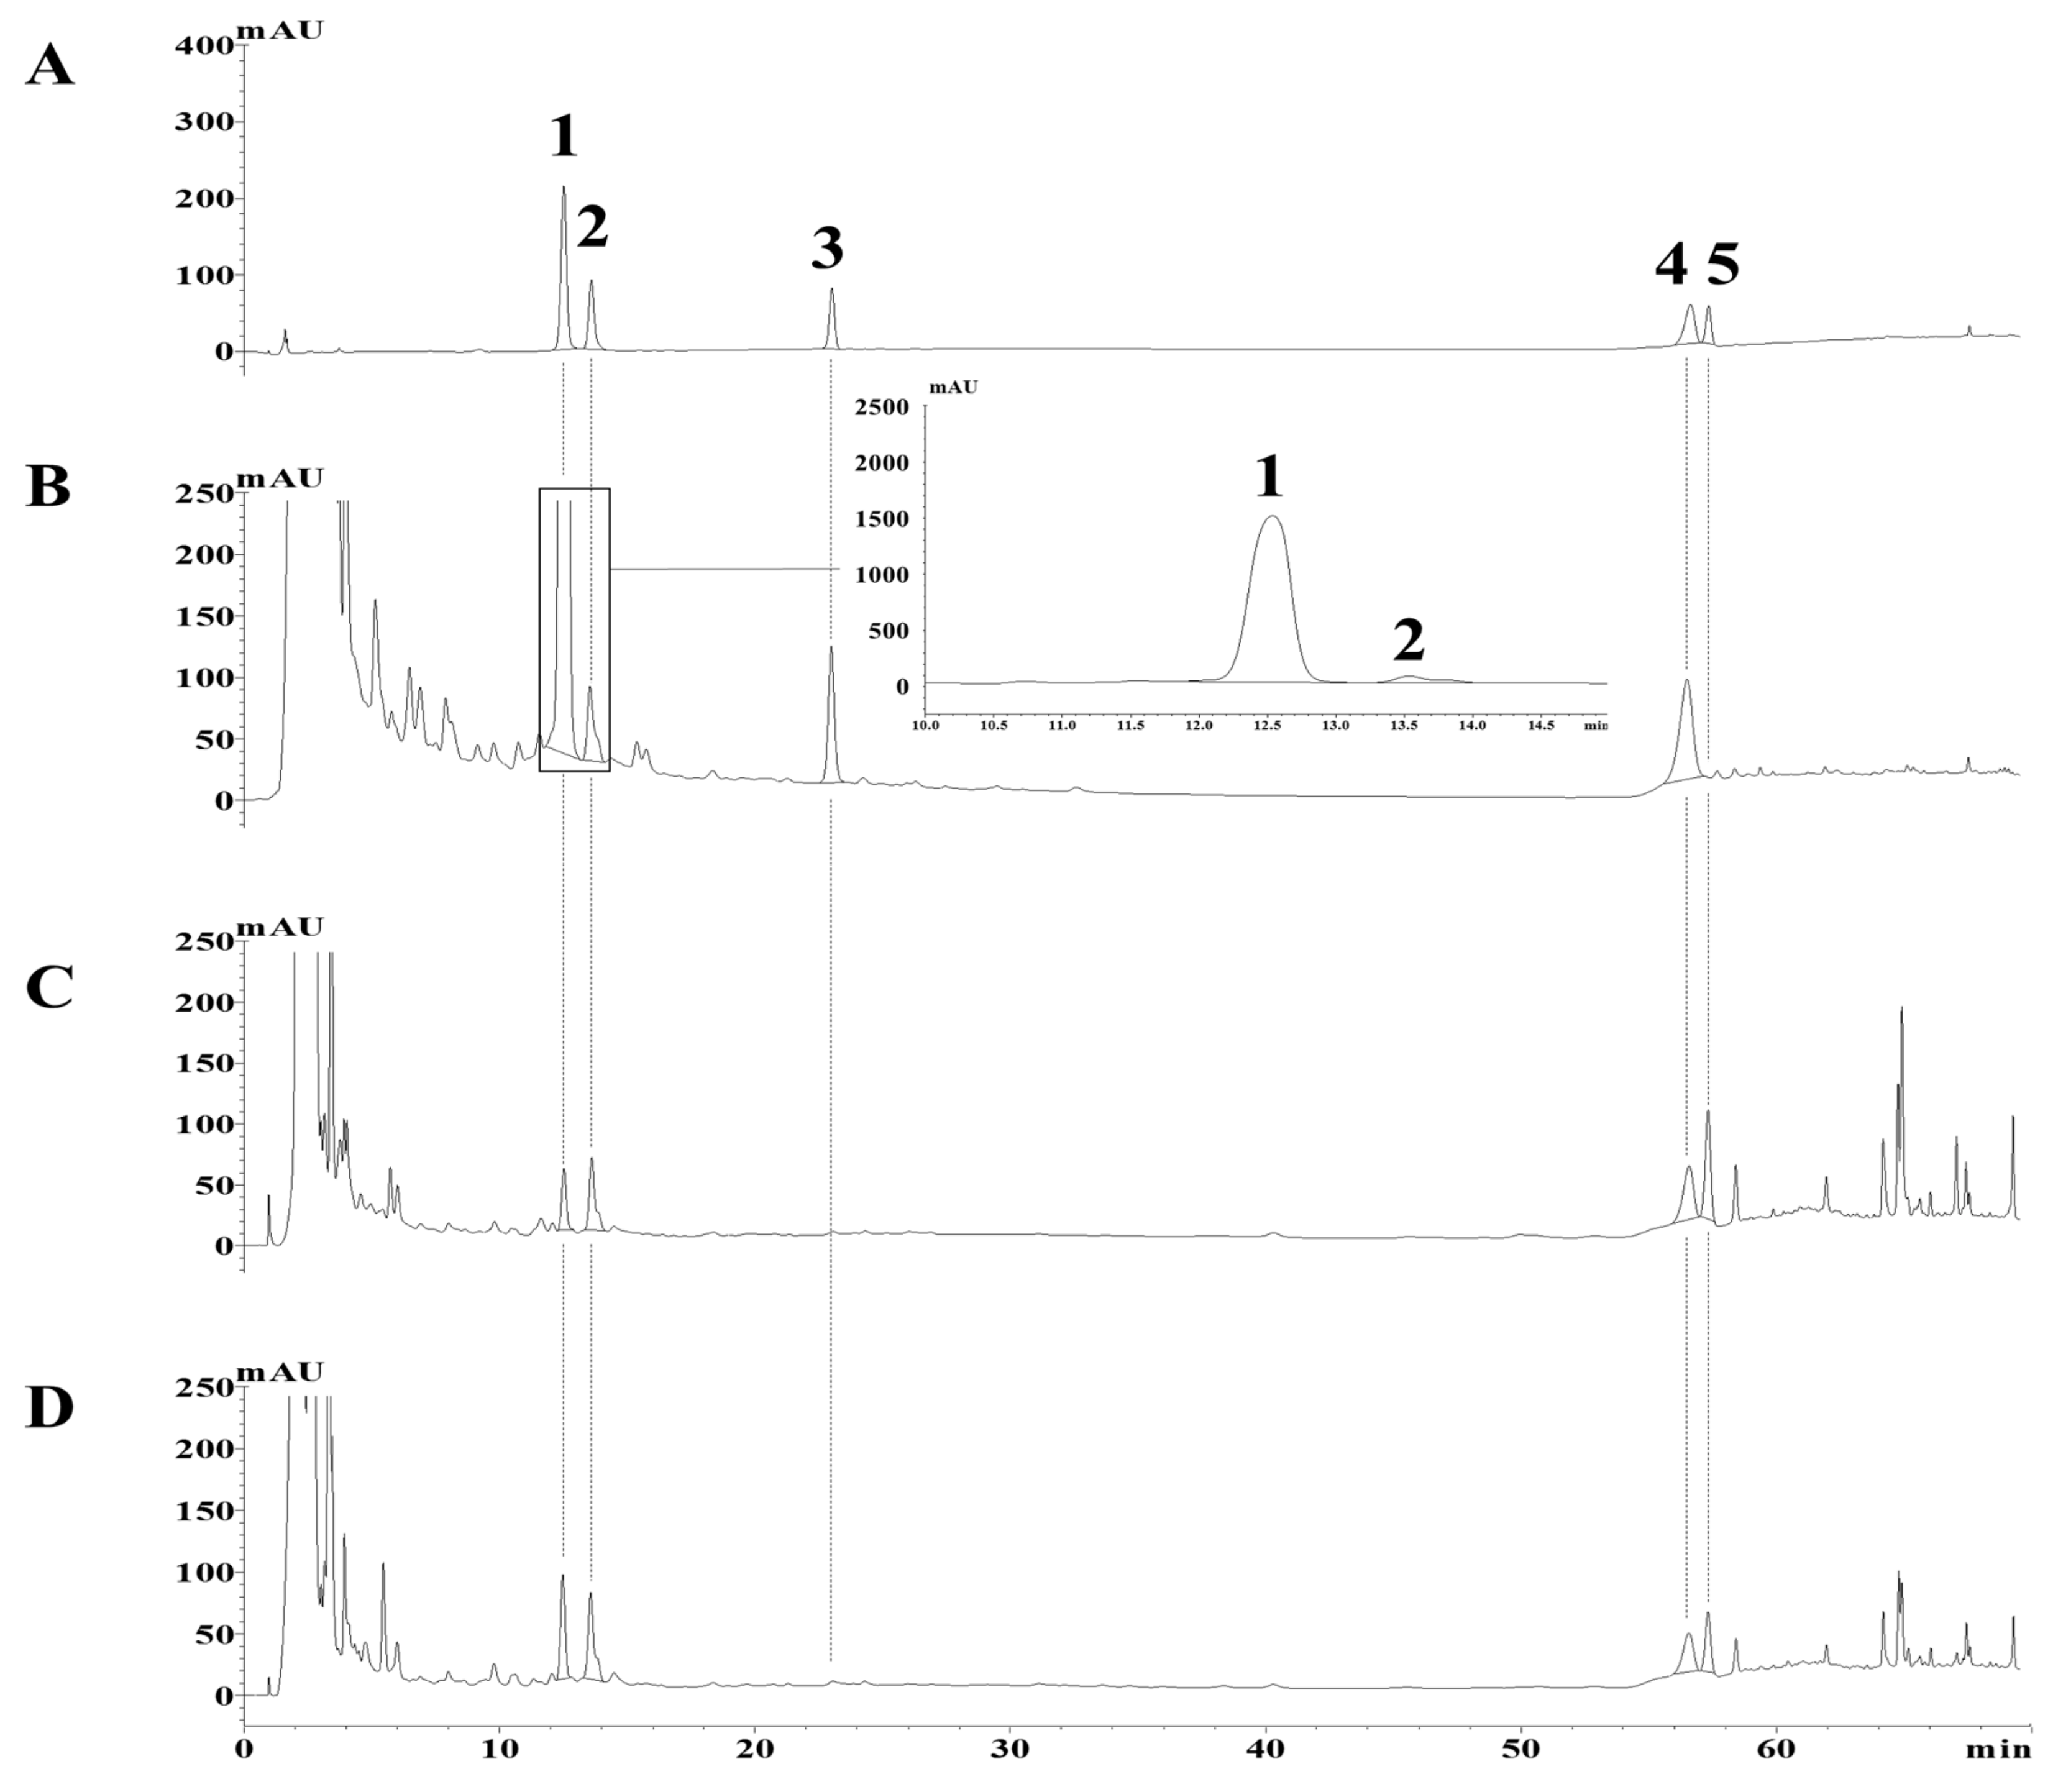
2.3. Quantitation of Compounds 1–5
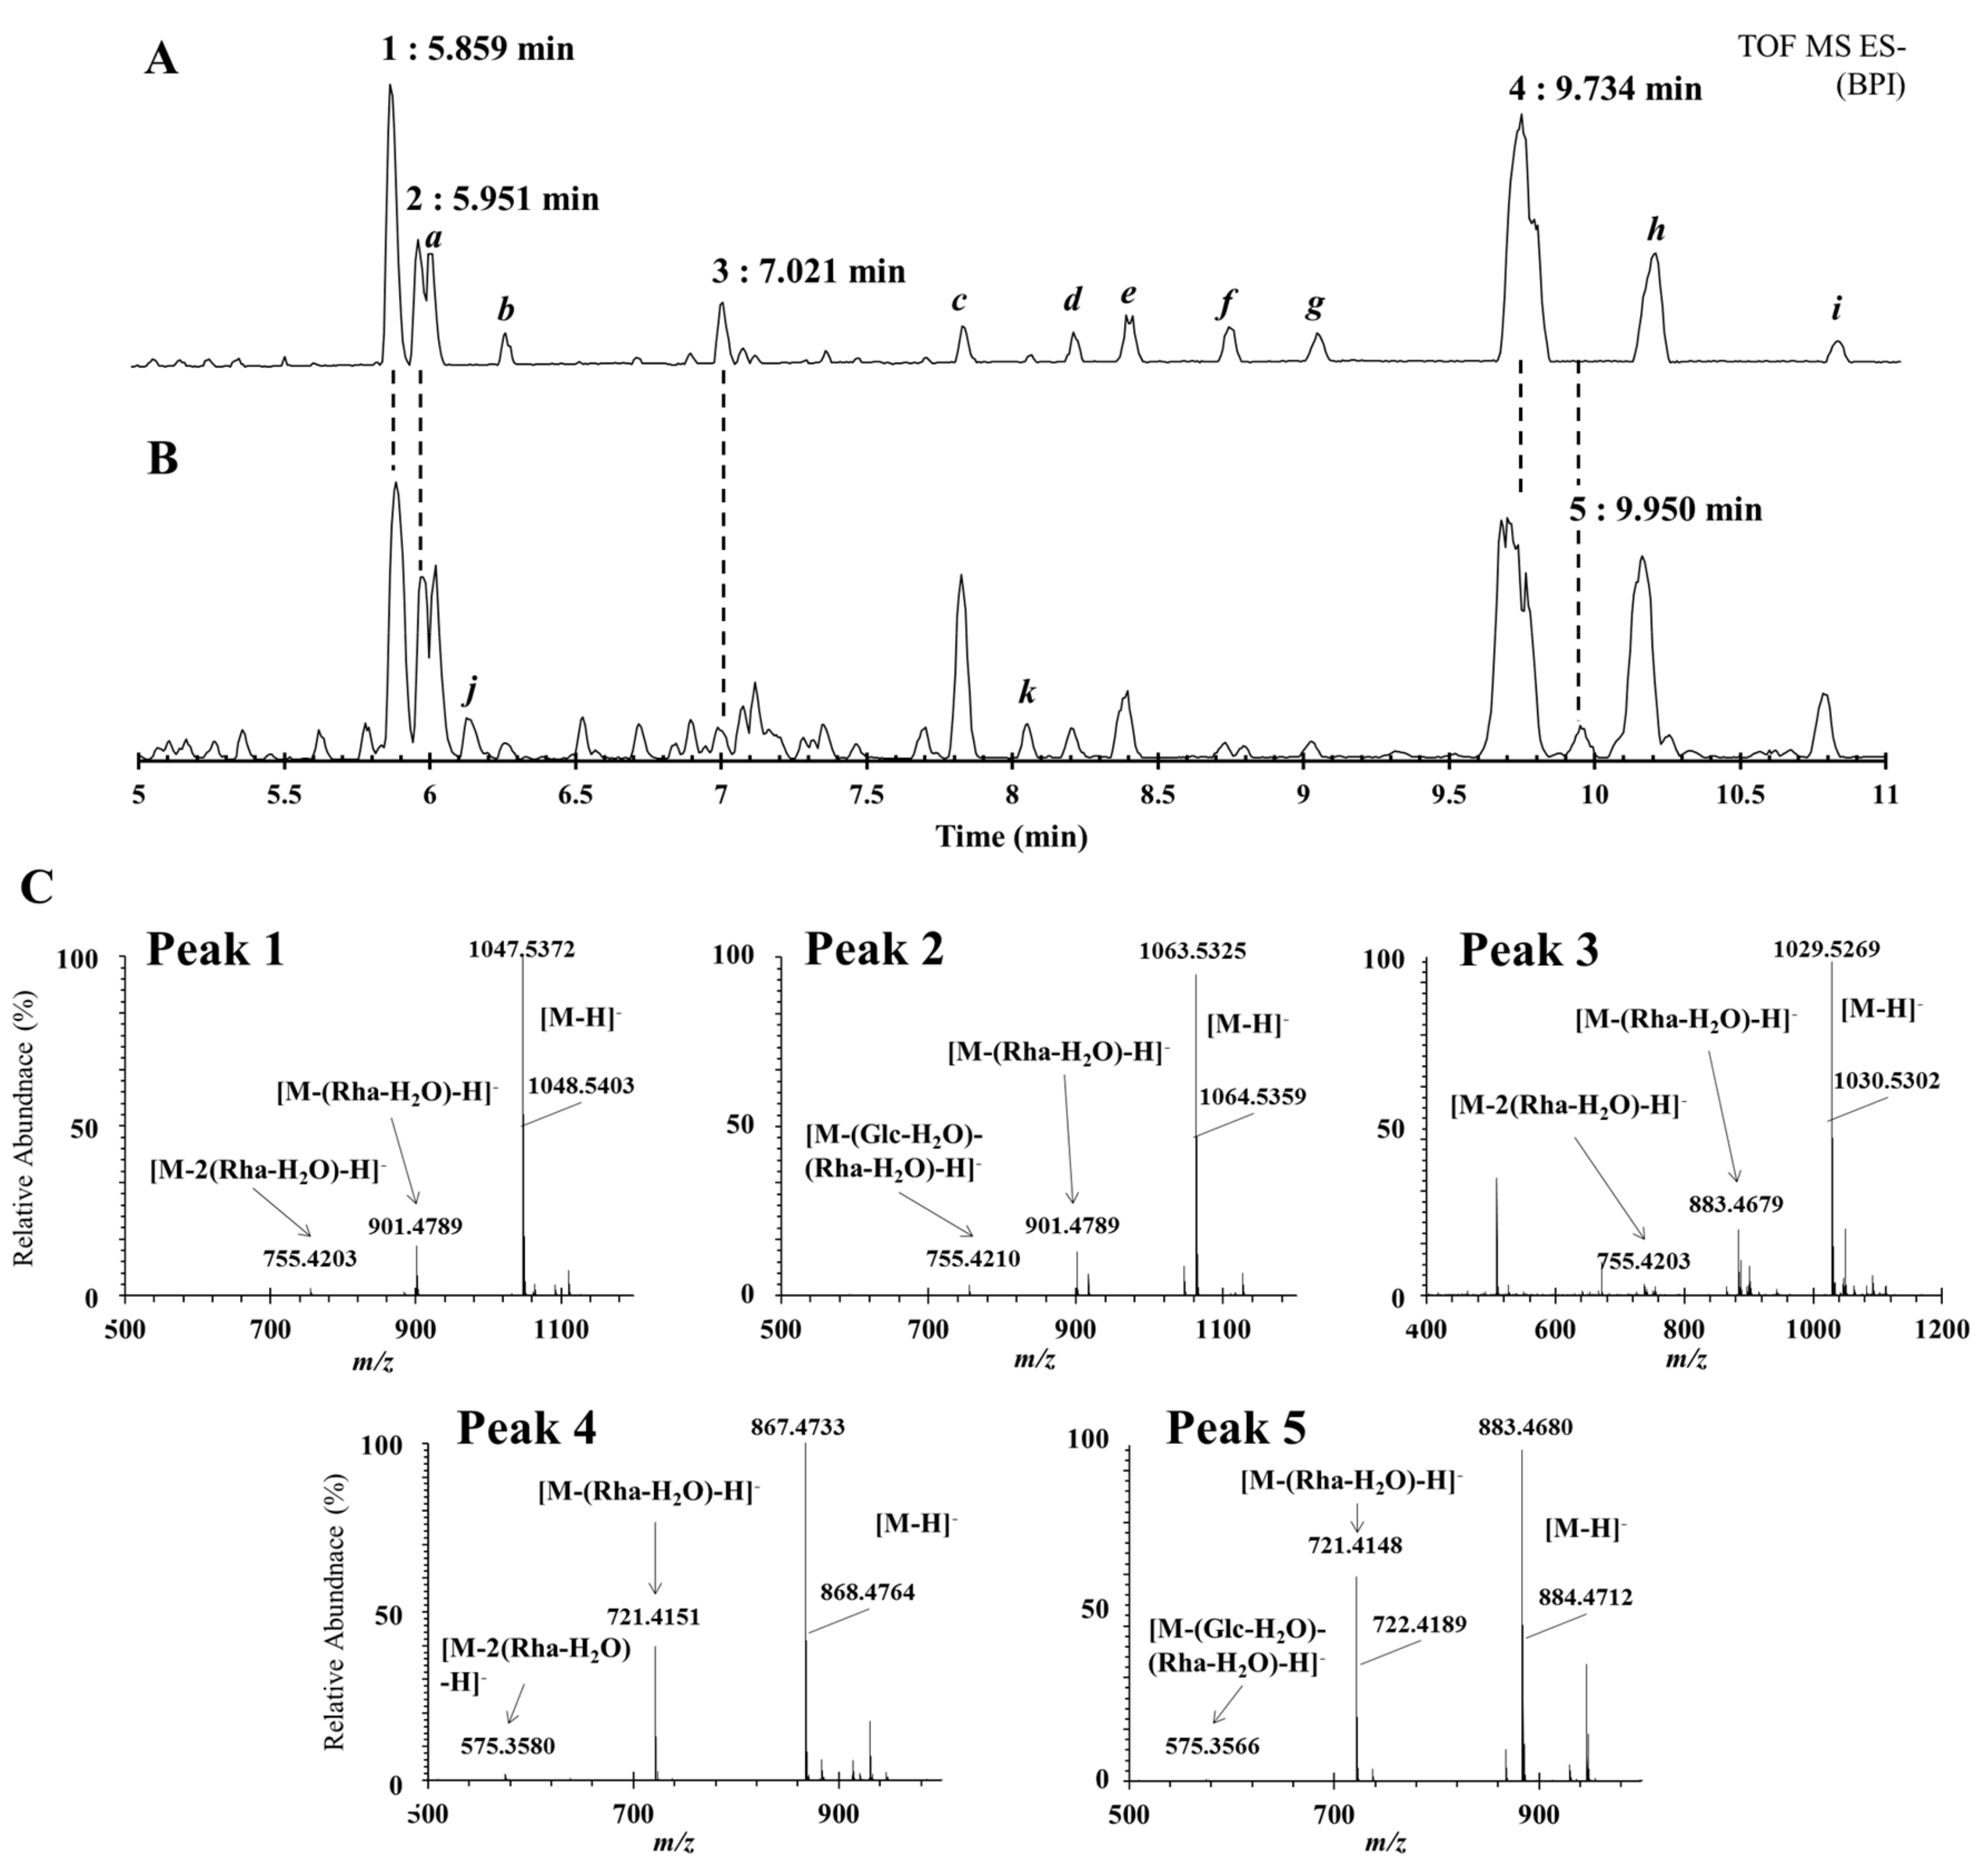
2.4. Identification of Compound 1–5 in DN and DQ Using UHPLC-QTOF/MS
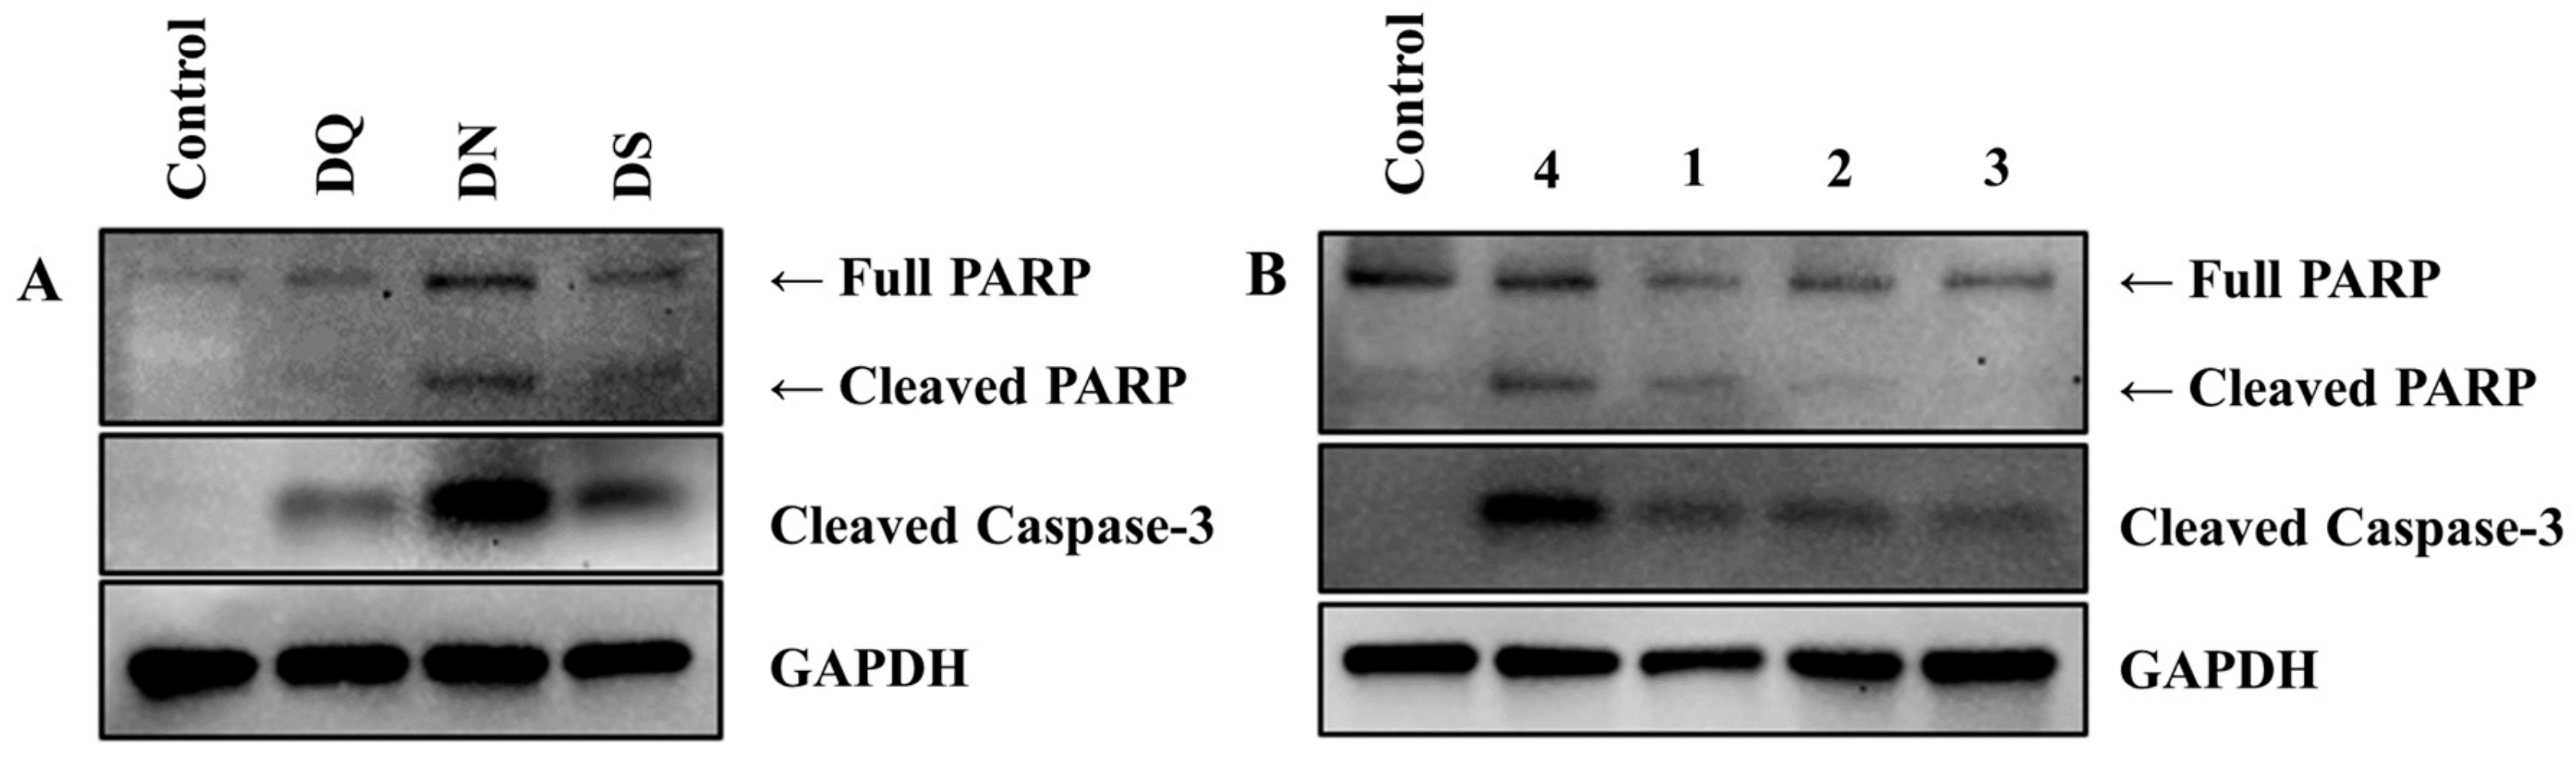
2.5. Anti-Osteosarcoma Effects of the Samples
3. Experimental
3.1. Reagents and Standards
3.2. Sample Preparation and Extraction
3.3. HPLC Conditions
3.4. Validation Method for HPLC
3.5. UHPLC-QTOF/MS Analysis
3.6. Cell Culture
3.7. Western Blot Analysis
3.8. Cell Viability Assay
4. Conclusions
Author Contributions
Funding
Conflicts of Interest
References
- The Pharmacopoeia of Democratic People’s Republic of Korea. Democratic People’s Republic of Korea Pharmacopoeia Commission, 7th ed.; Medical Science Publishing House: Pyeongyang, Democratic People’s Republic of Korea, 2011; p. 385. [Google Scholar]
- National Pharmacopoeia Commission. Chinese Pharmacopoeia, Pharmacopoeia of the People’s Republic of China 2010 ed.; China Medico Pharmaceutical Science & Technology Publishing House: Beijing, China, 2010; Volume I, p. 251. [Google Scholar]
- Tang, Y.; Yi, T.; Chen, H.; Zhao, Z.; Liang, Z.; Chen, H. Quantitative Comparison of Multiple Components in Dioscorea nipponica and D. panthaica by Ultra-High Performance Liquid Chromatography Coupled with Quadrupole Time-of-Flight Mass Spectrometry. Phytochem. Anal. 2013, 24, 413–422. [Google Scholar] [CrossRef] [PubMed]
- Kang, Y.; Choi, G.; Jin, W.; Kim, H.; Kim, D. Characterization of morphological and analytical keys in Dioscoreae nipponicae rhizoma (Dioscorea nipponica Makino) and Dioscoreae quinquelobatae rhizoma (Dioscorea quinquelobata Thunb.) as Korean herbal medicines. Korean Herb. Med. Inf. 2014, 2, 7–14. [Google Scholar]
- Ou-yang, S.; Jiang, T.; Zhu, L.; Yi, T. Dioscorea nipponica Makino: A systematic review on its ethnobotany, phytochemical and pharmacological profiles. Chem. Cent. J. 2018, 12, 57. [Google Scholar] [CrossRef] [PubMed]
- Kwon, C.; Sohn, H.Y.; Kim, S.H.; Kim, J.H.; Son, K.H.; Lee, J.S.; Lim, J.K.; Kim, J. Anti-obesity effect of Dioscorea nipponica Makino with lipase-inhibitory activity in rodents. Biosci. Biotechnol. Biochem. 2014, 67, 1451–1456. [Google Scholar] [CrossRef]
- Sarvin, B.; Fedorova, E.; Shpigun, O.; Titova, M.; Nikitin, M.; Kochkin, D.; Rodin, I.; Stavrianidi, A. LC-MS determination of steroidal glycosides from Dioscorea deltoidea Wall cell suspension culture: Optimization of pre-LC-MS procedure parameters by Latin Square design. J. Chromatogr. B. 2018, 1080, 64–70. [Google Scholar] [CrossRef]
- Lin, S.; Wang, D.; Yang, D.; Yao, J.; Tong, Y.; Chen, J. Characterization of steroidal saponins in crude extract from Dioscorea nipponica Makino by liquid chromatography tandem multi-stage mass spectrometry. Anal. Chim. Acta. 2007, 599, 98–106. [Google Scholar] [CrossRef]
- Kang, K.B.; Ryu, J.; Cho, Y.; Choi, S.; Son, M.; Sung, S.H. Combined Application of UHPLC-QTOF/MS, HPLC-ELSD and 1H–NMR Spectroscopy for Quality Assessment of DA-9801, A Standardised Dioscorea Extract. Phytochem. Anal. 2017, 28, 185–194. [Google Scholar] [CrossRef]
- Ko, B.; Lee, H.Y.; Kim, D.S.; Kang, S.; Ryuk, J.A. Supplementing with Opuntia ficus-indica Mill and Dioscorea nipponica Makino extracts synergistically attenuates menopausal symptoms in estrogen-deficient rats. J. Ethnopharmacol. 2014, 155, 267–276. [Google Scholar] [CrossRef]
- Kim, K.; Kang, M.; Kim, J.; Kim, G.; Choi, S. Physicochemical Composition and Antioxidant Activities of Korean Dioscorea Species. J. East Asian Soc. Diet. Life 2015, 25, 880–886. [Google Scholar] [CrossRef]
- Durfee, R.A.; Mohammed, M.; Luu, H.H. Review of Osteosarcoma and Current Management. Rheumatol. Ther. 2016, 3, 221–243. [Google Scholar] [CrossRef] [PubMed]
- Nie, Z.; Peng, H. Osteosarcoma in patients below 25 years of age: An observational study of incidence, metastasis, treatment and outcomes. Oncol. Lett. 2018, 16, 6502–6514. [Google Scholar] [CrossRef] [PubMed]
- Ferquson, A.S.; Goorin, A.M. Current treatment of osteosarcoma. Cancer Invest. 2001, 19, 292–315. [Google Scholar] [CrossRef] [PubMed]
- Wagner, E.R.; Luther, G.; Zhu, G.; Luo, Q.; Shi, Q.; Kim, S.H.; Gao, J.; Huang, E.; Gao, Y.; Yang, K.; et al. Defective Osteogenic Differentiation in the Development of Osteosarcoma. Sarcoma 2011, 2011, 12. [Google Scholar] [CrossRef] [PubMed]
- Jaffe, N.; Puri, A.; Gelderblom, H. Osteosarcoma: Evolution of Treatment Paradigms. Sarcoma 2013, 2013, 7. [Google Scholar] [CrossRef] [PubMed]
- Demain, A.; Vaishnav, P. Natural products for cancer chemotherapy. Microb Biotechnol. 2011, 4, 687–699. [Google Scholar] [CrossRef]
- Man, S.; Gao, W.; Zhang, Y.; Huang, L.; Liu, C. Chemical study and medical application of saponins as anti-cancer agents. Fitoterapia 2010, 81, 703–714. [Google Scholar] [CrossRef]
- Ma, B.; Zhu, J.; Zhang, J.; Wang, Y.; Zhang, L.; Zhang, Q. Raddeanin A, a natural triterpenoid saponin compound, exerts anticancer effect on human osteosarcoma via the ROS/JNK and NF-κB signal pathway. Toxicol. Appl. Pharm. 2018, 353, 87–101. [Google Scholar] [CrossRef]
- Cheng, G.; Gao, F.; Sun, X.; Bi, H.; Zhu, Y. Paris saponin VII suppresses osteosarcoma cell migration and invasion by inhibiting MMP-2/9 production via the p38 MAPK signaling pathway. Mol. Med. Rep. 2016, 14, 3199–3205. [Google Scholar] [CrossRef]
- Tenon, M.; Feuillère, N.; Roller, M.; Birtic’, S. Rapid, cost-effective and accurate quantification of Yucca schidigera Roezl. steroidal saponins using HPLC-ELSD method. Food Chem. 2017, 221, 1245–1252. [Google Scholar] [CrossRef]
- Mateos, R.; Baeza, G.; Martínez-López, S.; Sarriá, B.; Bravo, L. LC–MSn characterization of saponins in mate (Ilex paraguariens, St. Hil) and their quantification by HPLC-DAD. J. Food Compos. Anal. 2017, 63, 164–170. [Google Scholar] [CrossRef]
- Ahn, M.; Kim, J. Identification and Quantification of Steroidal Saponins in Polygonatum Species by HPLC/ESI/MS. Arch Pharm Res. 2005, 5, 592–597. [Google Scholar] [CrossRef] [PubMed]
- Bardarov, V.; Dinchev, D.; Bardarov, K. Study of the chromatographic behavior of protodioscin on a C8 CORE-SHELL 2.6 µm short (5 cm) column and its determination with UV/ELSD detection. J. Chem. Technol. Metall. 2013, 48, 4, 341–346. [Google Scholar]
- Yi, T.G.; Yeoung, Y.R.; Choi, I.; Park, N. Transcriptome analysis of Asparagus officinalis reveals genes involved in the biosynthesis of rutin and protodioscin. PLoS ONE 2019, 14. [Google Scholar] [CrossRef] [PubMed]
- Kwon, H.; Choi, S.; Yoo, C.; Choi, H.; Lee, S.; Park, Y. Development of an analytical method for yam saponins using HPLC with pulsed amperometric detection at different column temperatures. J. Sep. Sci. 2013, 36, 690–698. [Google Scholar] [CrossRef]
- Lee, E.J.; Yoo, K.S.; Patil, B.S. Development of a Rapid HPLC-UV Method for Simultaneous Quantification of Protodioscin and Rutin in White and Green Asparagus Spears. J. Food Sci. 2010, 75, 9. [Google Scholar] [CrossRef]
- Shishovska, M.; Arsova-Sarafinovska, Z.; Memeti, S. A Simple Method for Determination of Protodioscin in Tribulus Terrestris, L. and Pharmaceuticals by High-Performance Liquid Chromatography Using Diode-Array Detection. J. Chem. Eng. Res. Updates. 2015, 2, 12–21. [Google Scholar]
- Tada, A.; Shoji, J. Studies on the constituents of Ophiopogonis Tuber. II. on the structure of ophiopogonin B. Chem. Pharm. Bull. 1972, 20, 1729–1734. [Google Scholar] [CrossRef]
- Zhenzhen, L.; Kuang, W.; Xu, X.; Li, D.; Zhu, W.; Lan, Z.; Zhang, X. Putative identification of components in Zengye Decoction and their effects on glucose consumption and lipogenesis in insulin-induced insulin-resistant HepG2 cells. J. Chromatogr. B. 2018, 1073, 145–153. [Google Scholar]
- Teponno, R.T.; Tapondjou, A.L.; Djoukeng, D.; Abou-Mansour, E.; Tabacci, R.; Tane, P.; Lontsi, D.; Park, H. Isolation and NMR assignment of a pennogenin glycoside from Dioscorea bulbifera L. var sativa. Nat. Prod. Sci. 2006, 12, 62–66. [Google Scholar]
- Lu, D.; Liu, J.; Li, H.; Li, P. Phenanthrene derivatives from the stems and leaves of Dioscorea nipponica Makino. J. Asian. Nat. Prod. Res. 2010, 12, 1–6. [Google Scholar] [CrossRef] [PubMed]
- Wang, T.; Choi, R.C.Y.; Li, J.; Bi, C.W.C.; Ran, W.; Chen, X.; Dong, T.T.X.; Bi, K.; Tsim, K.W.K. Trillin, a steroidal saponin isolated from the rhizomes of Dioscorea nipponica, exerts protective effects against hyperlipidemia and oxidative stress. J. Ethnopharmacol. 2012, 139, 214–220. [Google Scholar] [CrossRef] [PubMed]
- Yang, J.; Zhu, L.; Zhao, Y.; Xu, Y.; Sun, Q.; Liu, S.; Liu, C.; Ma, B. Separation of furostanol saponins by supercritical fluidchromatography. J. Pharmaceut. Biomed. 2017, 145, 71–78. [Google Scholar] [CrossRef] [PubMed]
- Kim, K.H.; Kim, M.A.; Moon, E.; Kim, S.Y.; Choi, S.Z.; Son, M.W.; Lee, K.R. Furostanol saponins from the rhizomes of Dioscorea japonica and their effects on NGF induction. Bioorg. Med. Chem. Lett. 2011, 21, 2075–2078. [Google Scholar] [CrossRef] [PubMed]
- Kadkade, P.G.; Ramiréz, M.A.; Madrid, T.R. Studies on the steroidal sapogenins of the subcellular organelles of Dioscorea bernoulliana tubers. Biochem. Physiol. Pflanzen. 1979, 174, 357–362. [Google Scholar] [CrossRef]
- Ma, C.; Fan, M.; Tang, Y.; Li, Z.; Sun, Z.; Ye, G.; Huang, C. Identification of major alkaloids and steroidal saponins in rat serum by HPLC-diode array detection-MS/MS following oral administration of Huangbai-Zhimu herb-pair Extract. Biomed. Chromatogr. 2008, 22, 835–850. [Google Scholar] [CrossRef] [PubMed]
- Lin, H.; Zhu, H.; Tan, J.; Wang, H.; Wang, Z.; Li, P.; Zhao, C.; Liu, J. Comparative analysis of chemical constituents of Moringa oleifera leaves from China and India by ultra-performance liquid chromatography coupled with quadrupole-time-of-flight mass spectrometry. Molecules 2019, 24, 942. [Google Scholar] [CrossRef]
- Yu, H.; Zheng, L.; Yin, L.; Xu, L.; Qi, Y.; Han, X.; Xu, Y.; Liu, K.; Peng, J. Protective effects of the total saponins from Dioscorea nipponica Makino against carbon tetrachloride-induced liver injury in mice through suppression of apoptosis and inflammation. Int. Immunopharmcol. 2014, 19, 233–244. [Google Scholar] [CrossRef]
- Chien, M.J.; Ying, T.H.; Hsieh, Y.S.; Chang, Y.C.; Yeh, C.M.; Ko, J.L.; Lee, W.S.; Chang, J.H.; Yang, S.F. Dioscorea nipponica Makino inhibits migration and invasion of human oral cancer HSC-3 cells by transcriptional inhibition of matrix metalloproteinase-2 through modulation of CREB and AP-1 activity. Food. Chem. Toxicol. 2012, 50, 558–566. [Google Scholar] [CrossRef]
- Li, S.; Cheng, B.; Hou, L.; Huang, L.; Cui, Y.; Xu, D.; Shen, X.; Li, S. Dioscin inhibits colon cancer cells’ growth by reactive oxygen species-mediated mitochondrial dysfunction and p38 and JNK pathways. Anti-Cancer Drug. 2018, 29, 234–242. [Google Scholar] [CrossRef]
- Guo, X.; Ding, X. Dioscin suppresses the viability of ovarian cancer cells by regulating the VEGFR2 and PI3K/AKT/MAPK signaling pathways. Oncol. Lett. 2018, 15, 9537–9542. [Google Scholar] [CrossRef] [PubMed]
- Wei, Y.; Xu, Y.; Han, X.; Qi, Y.; Xu, L.; Xu, Y.; Yin, L.; Sun, H.; Liu, K.; Peng, J. Anti-cancer effects of dioscin on three kinds of human lung cancer cell lines through inducing DNA damage and activating mitochondrial signal pathway. Food Chem. Toxicol. 2013, 59, 118–128. [Google Scholar] [CrossRef] [PubMed]
Sample Availability: Samples of the compounds are available from the authors. |


| Compounds | tR (min) | Equation (Linear Model)a | Linear Range (mg/mL) | r2 b | LOD c (mg/mL) | LOQ d (mg/mL) |
|---|---|---|---|---|---|---|
| 1 | 12.4 | y = 3,442,356x − 8492 | 0.02–4 | 0.9992 | 0.0009 | 0.0026 |
| 2 | 13.5 | y = 1,353,127x + 13,963 | 0.02–4 | 0.9998 | 0.0022 | 0.0065 |
| 3 | 22.9 | y = 1,269,657x – 23,913 | 0.02–4 | 0.9995 | 0.0007 | 0.0020 |
| 4 | 56.3 | y = 1,528,845x + 2521 | 0.03–0.7 | 0.9990 | 0.0132 | 0.0400 |
| 5 | 57.2 | y = 1,462,227x – 826 | 0.01–0.3 | 0.9999 | 0.0027 | 0.0081 |
| Compound | Spiked Amount (mg/mL) | Content (mg/mL) | Recovery Test (%, n = 5) | Precision Test (n = 5) | ||
|---|---|---|---|---|---|---|
| Un-Spiked | Measured | Intra-Day RSDa(%) | Inter-Day RSD (%) | |||
| 1 | 0.03 | 3.229654 | 3.227270 | 92.1 | 0.05 | 0.01 |
| 0.1 | 3.299654 | 3.300564 | 100.9 | 0.03 | 0.01 | |
| 0.3 | 3.499654 | 3.502000 | 100.8 | 0.03 | 0.01 | |
| 2 | 0.03 | 0.115008 | 0.115157 | 100.5 | 0.22 | 0.31 |
| 0.1 | 0.185008 | 0.185613 | 100.6 | 0.17 | 0.23 | |
| 0.3 | 0.385008 | 0.384965 | 100.0 | 0.14 | 0.12 | |
| 3 | 0.03 | 0.306423 | 0.306506 | 100.3 | 0.04 | 0.10 |
| 0.1 | 0.376423 | 0.376691 | 100.3 | 0.08 | 0.06 | |
| 0.3 | 0.576423 | 0.576923 | 100.2 | 0.16 | 0.03 | |
| 4 | 0.03 | 0.489984 | 0.490762 | 102.6 | 0.20 | 0.15 |
| 0.1 | 0.559984 | 0.561044 | 101.1 | 0.14 | 1.48 | |
| 0.3 | 0.759984 | 0.760324 | 100.1 | 0.22 | 0.10 | |
| Compound | Spiked Amount (mg/mL) | Content (mg/mL) | Recovery Test (%, n = 5) | Precision Test (n = 5) | ||
|---|---|---|---|---|---|---|
| Un-Spiked | Measured | Intra-Day RSDa(%) | Inter-Day RSD (%) | |||
| 1 | 0.012 | 0.081910 | 0.0820287 | 101.0 | 0.24 | 0.55 |
| 0.04 | 0.109910 | 0.1073792 | 93.7 | 1.91 | 0.15 | |
| 0.12 | 0.189910 | 0.188932 | 99.2 | 0.62 | 0.28 | |
| 2 | 0.012 | 0.130902 | 0.1316462 | 106.2 | 0.31 | 0.73 |
| 0.04 | 0.158902 | 0.1582045 | 98.3 | 0.75 | 0.50 | |
| 0.12 | 0.238902 | 0.2368625 | 98.3 | 1.15 | 0.48 | |
| 4 | 0.012 | 0.212048 | 0.2116199 | 96.4 | 0.41 | 0.38 |
| 0.04 | 0.240048 | 0.2400817 | 100.1 | 0.44 | 0.75 | |
| 0.12 | 0.320048 | 0.3210118 | 100.8 | 0.26 | 0.52 | |
| 5 | 0.012 | 0.192213 | 0.1918098 | 96.6 | 0.27 | 0.29 |
| 0.04 | 0.220213 | 0.2220230 | 104.5 | 0.67 | 0.70 | |
| 0.12 | 0.300213 | 0.2928230 | 93.8 | 0.82 | 0.33 | |
| Compound | Content (n = 4) | ||
|---|---|---|---|
| DN | DQ | DS | |
| 1 | 159.983 ± 0.064 a | 3.496 ± 0.018 | 8.959 ± 0.014 |
| 2 | 4.250 ± 0.024 | 5.945 ± 0.020 | 9.902 ± 0.061 |
| 3 | 13.821 ± 0.037 | N.D. | N.D. |
| 4 | 22.999 ± 0.121 | 10.002 ± 0.051 | 9.822 ± 0.014 |
| 5 | N.D. | 9.011 ± 0.098 | 7.123 ± 0.031 |
| Sample | Peak | tR (min) | Observed (Neutral) | Observed (m/z) | Mass Error (ppm) | Tentative Identification |
|---|---|---|---|---|---|---|
| DN (A) | a | 6.03 | 854.4643 | 899.4625 [+HCOO] | −2.3 | Polyphyllin D |
| b | 6.25 | 740.4350 | 785.4332 [+HCOO] | 0.3 | Timosaponin AIII | |
| c | 7.85 | 330.2406 | 329.2334 [-H] | 0.1 | Sanleng acid | |
| d | 8.18 | 884.4736 | 929.4718 [+HCOO] | −3.6 | Spiroconazole A | |
| e | 8.39 | 492.1566 | 537.1548 [+HCOO] | −1.3 | 2,7,2’-Trihydroxy-4,4’,7’-trimethoxy-1,1’-biphenanthrene | |
| f | 8.73 | 372.2139 | 417.2121 [+HCOO] | −2.1 | Blumenol C glucoside | |
| g | 9.02 | 576.3642 | 621.3624 [+HCOO] | −3.2 | Trillin | |
| h | 10.06 | 722.4237 | 767.4219 [+HCOO, -H] | −0.5 | Ophiopogonin B | |
| i | 10.76 | 722.4236 | 767.4218 [+HCOO] | −0.7 | Prosapogenin A of dioscin | |
| DQ (B) | j | 6.14 | 1090.5550 | 1135.5530 [+HCOO, -H] | −1.2 | Mutongsaponin C or Akebia saponin F |
| k | 8.03 | 592.3596 | 637.3578 [+HCOO] | −2.4 | Neohecogenin-3-O-β-d-glucopyranoside |
© 2019 by the authors. Licensee MDPI, Basel, Switzerland. This article is an open access article distributed under the terms and conditions of the Creative Commons Attribution (CC BY) license (http://creativecommons.org/licenses/by/4.0/).
Share and Cite
Hwang, J.T.; Park, K.-S.; Ryuk, J.A.; Kim, H.J.; Ko, B.S. Development of an Oriental Medicine Discrimination Method through Analysis of Steroidal Saponins in Dioscorea nipponica Makino and Their Anti-Osteosarcoma Effects. Molecules 2019, 24, 4022. https://doi.org/10.3390/molecules24224022
Hwang JT, Park K-S, Ryuk JA, Kim HJ, Ko BS. Development of an Oriental Medicine Discrimination Method through Analysis of Steroidal Saponins in Dioscorea nipponica Makino and Their Anti-Osteosarcoma Effects. Molecules. 2019; 24(22):4022. https://doi.org/10.3390/molecules24224022
Chicago/Turabian StyleHwang, Joo Tae, Ki-Sun Park, Jin Ah Ryuk, Hye Jin Kim, and Byoung Seob Ko. 2019. "Development of an Oriental Medicine Discrimination Method through Analysis of Steroidal Saponins in Dioscorea nipponica Makino and Their Anti-Osteosarcoma Effects" Molecules 24, no. 22: 4022. https://doi.org/10.3390/molecules24224022
APA StyleHwang, J. T., Park, K.-S., Ryuk, J. A., Kim, H. J., & Ko, B. S. (2019). Development of an Oriental Medicine Discrimination Method through Analysis of Steroidal Saponins in Dioscorea nipponica Makino and Their Anti-Osteosarcoma Effects. Molecules, 24(22), 4022. https://doi.org/10.3390/molecules24224022