
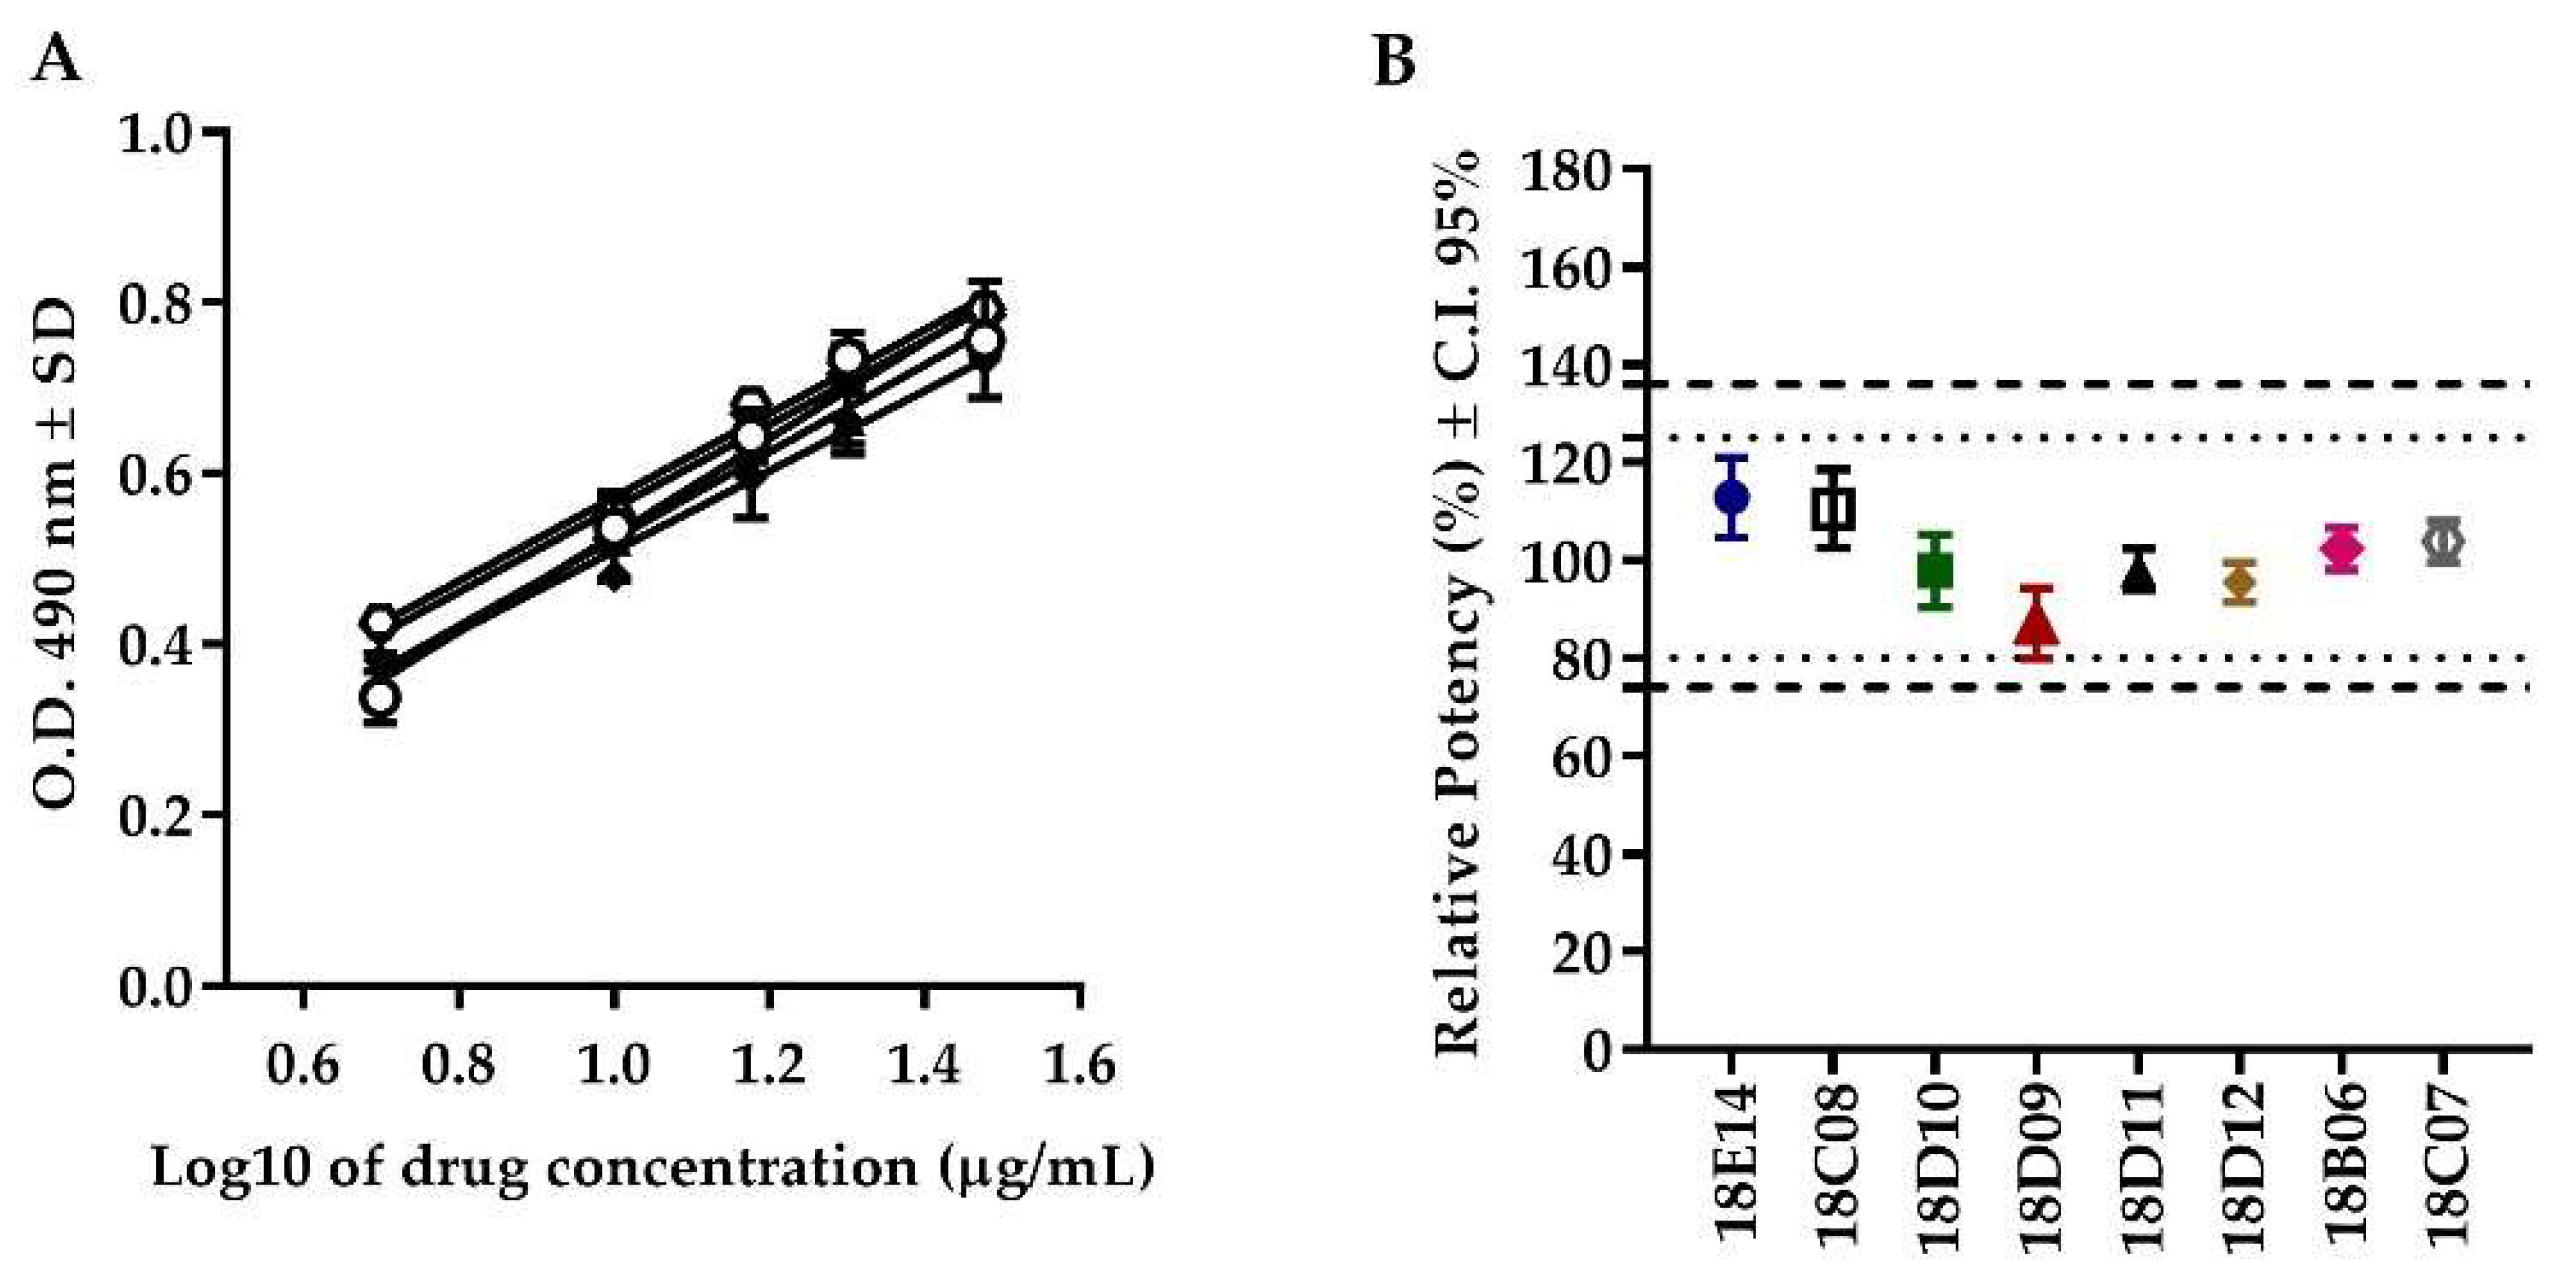
Validation of a Cell Proliferation Assay to Assess the Potency of a Dialyzable Leukocyte Extract Intended for Batch Release

 , , , ,
  ,
,  , , and
Abstract
:
1. Introduction
2. Results and Discussion
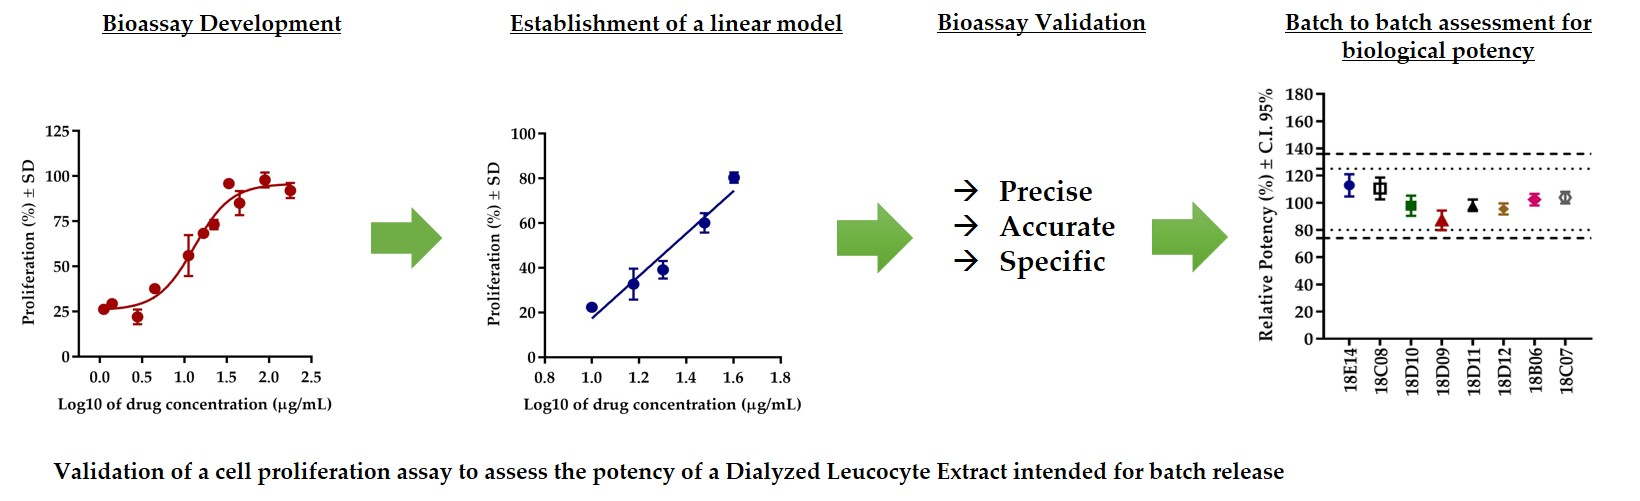
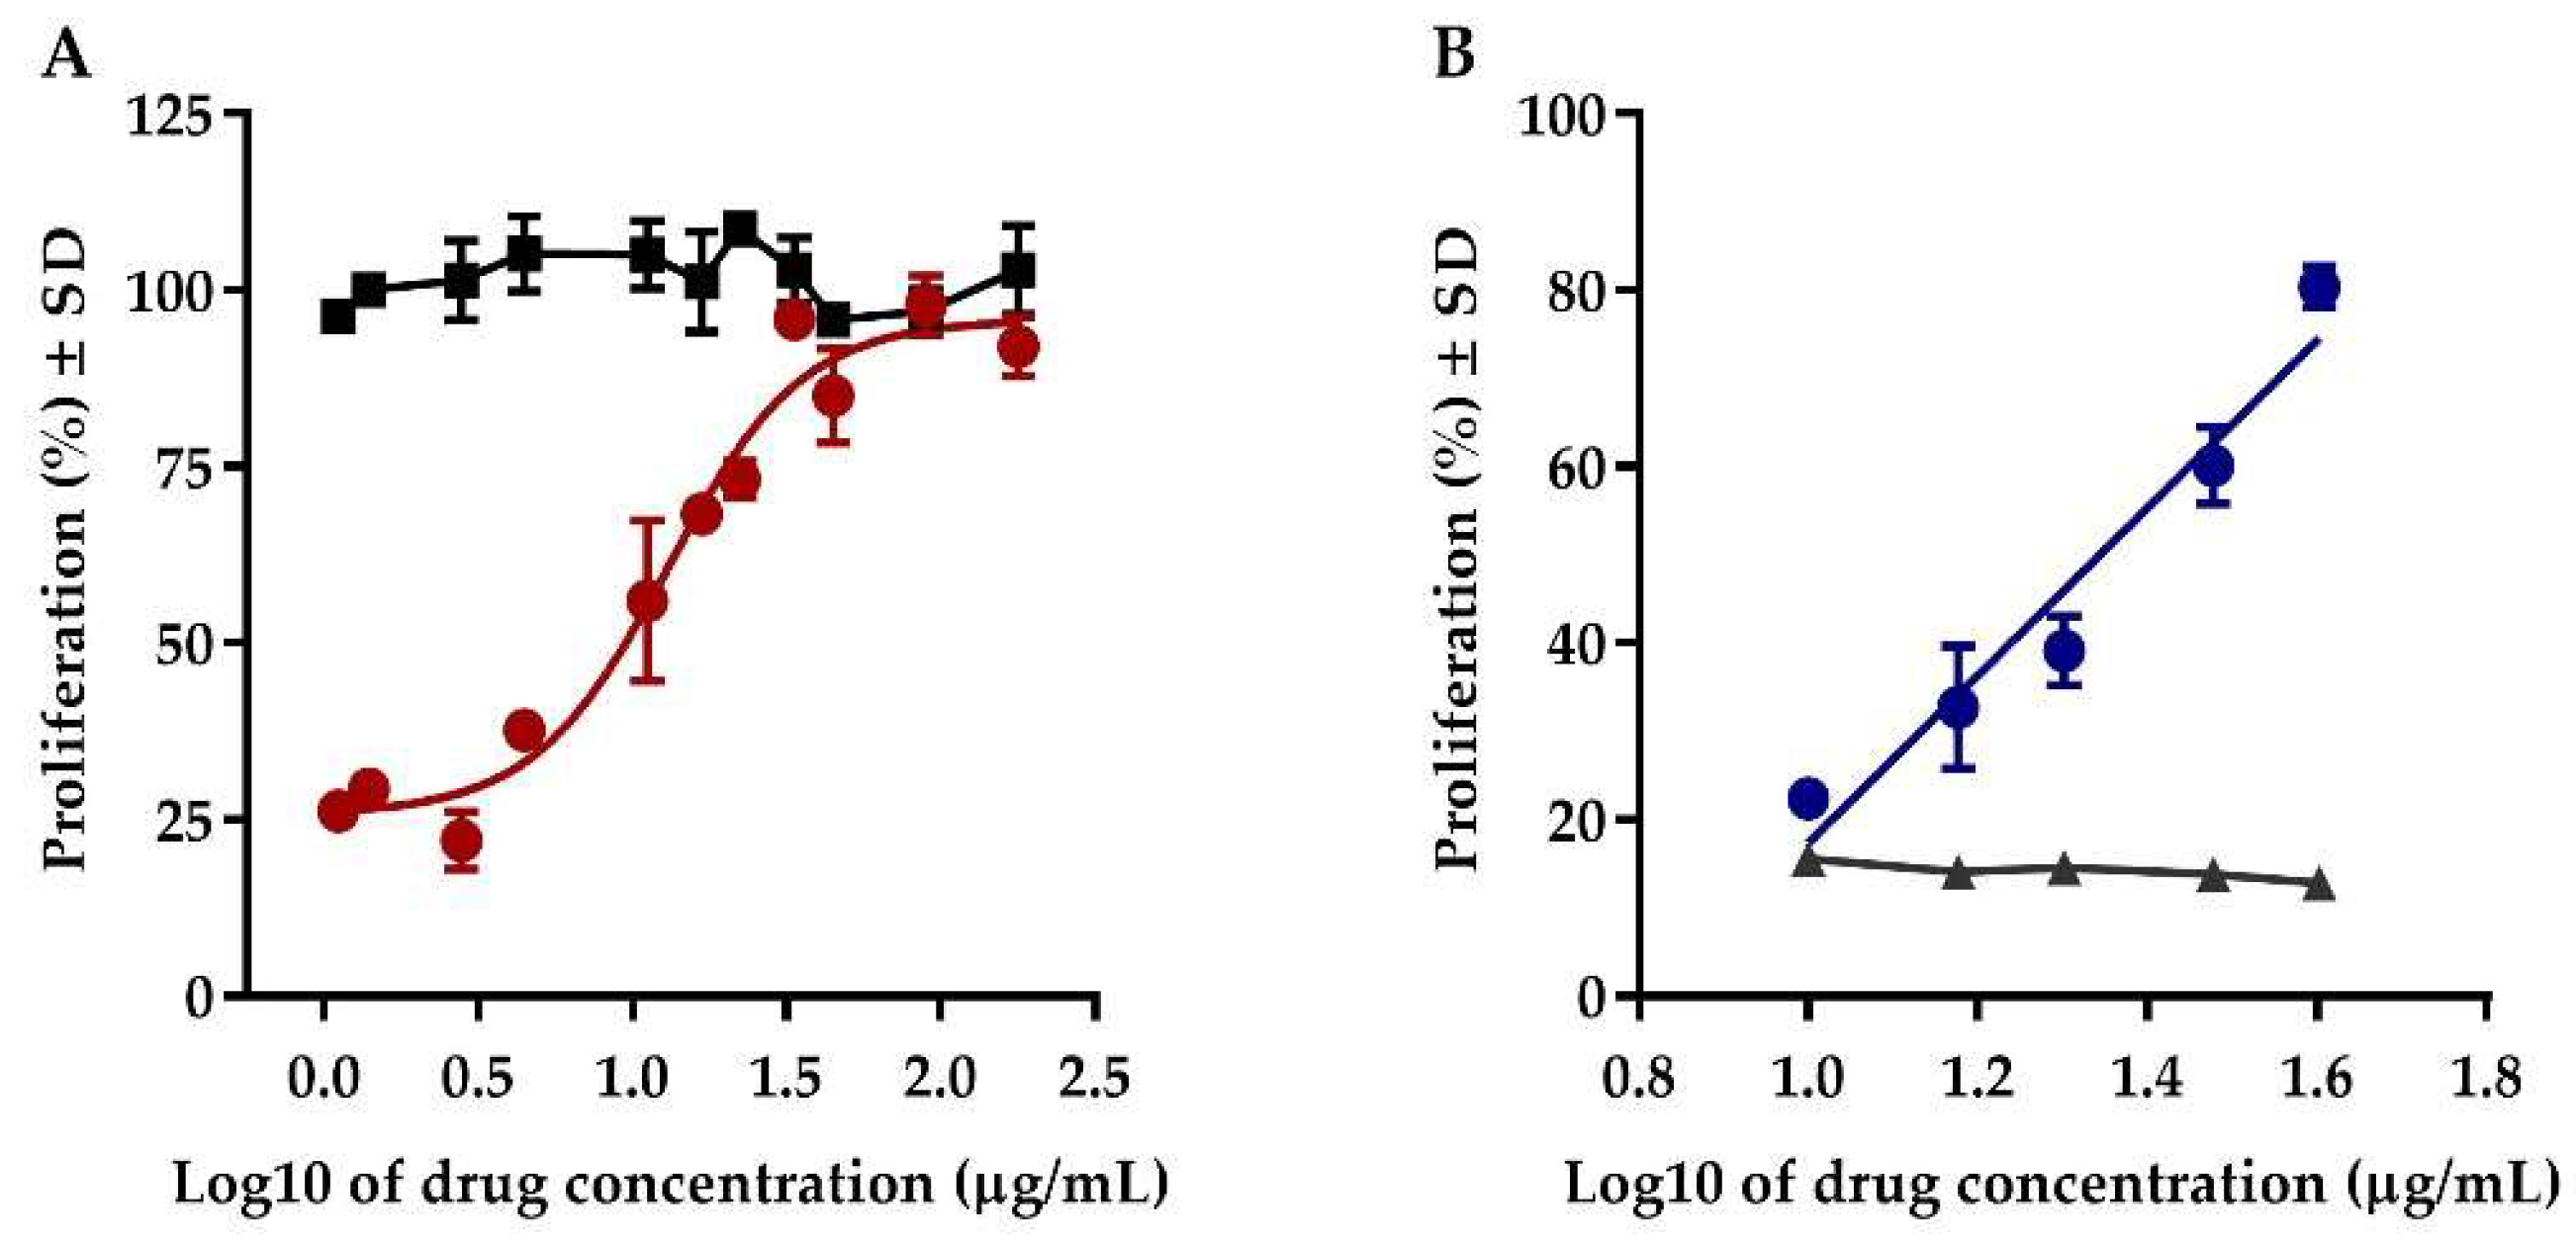
2.1. Method Development
2.2. Method Validation
2.2.1. Precision
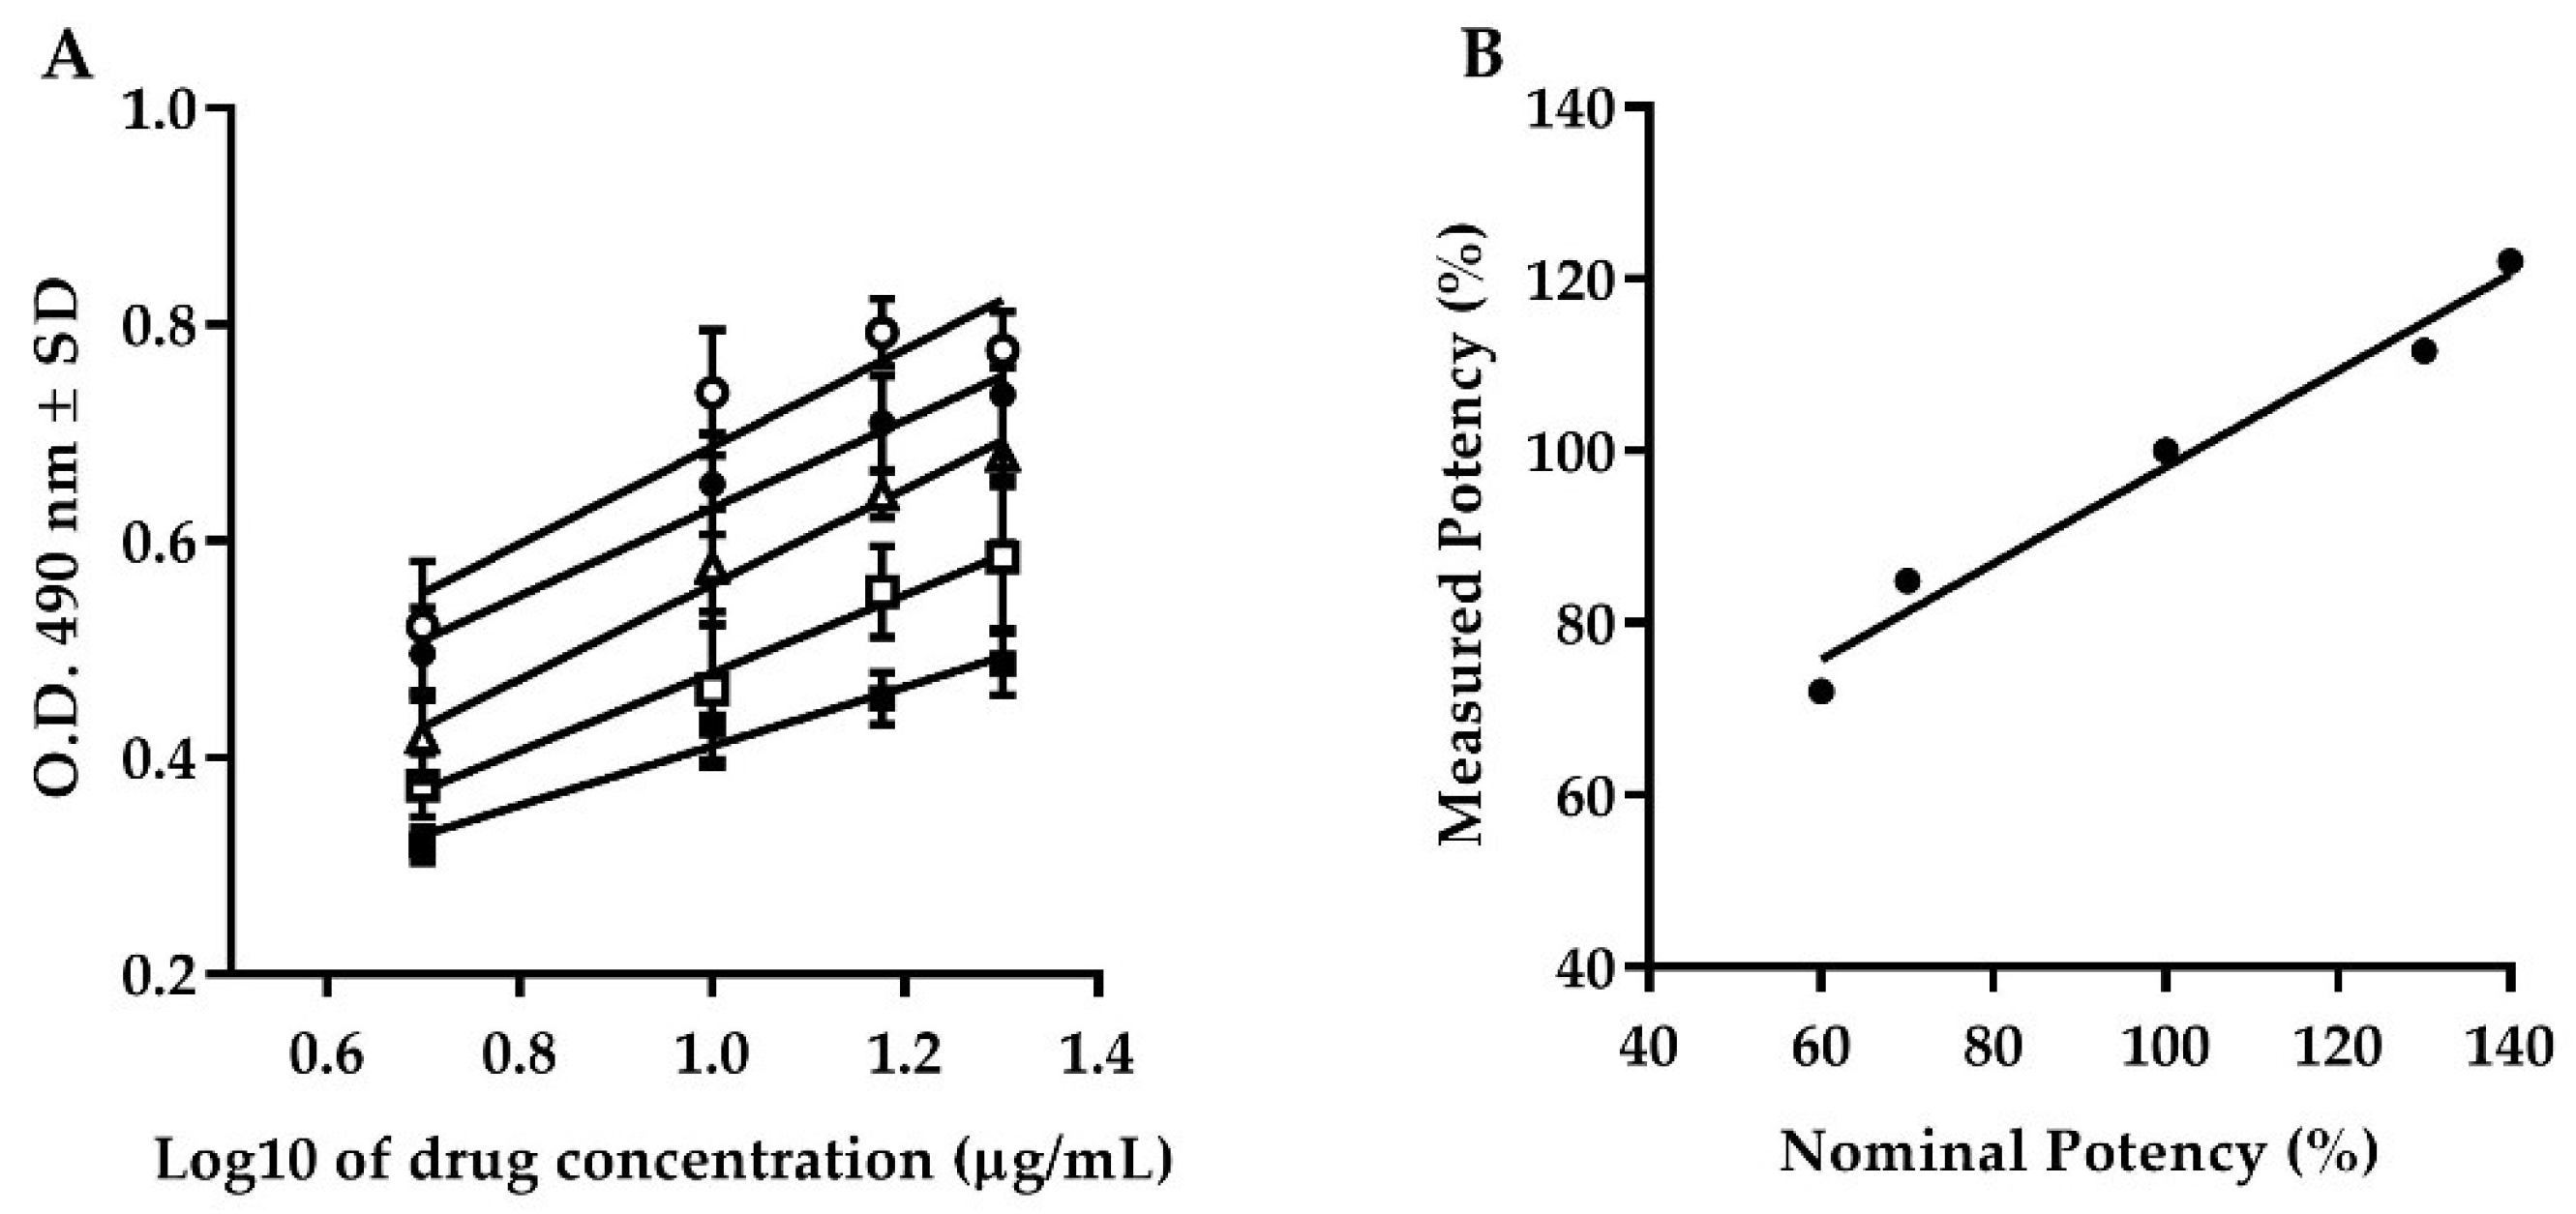
2.2.2. Accuracy
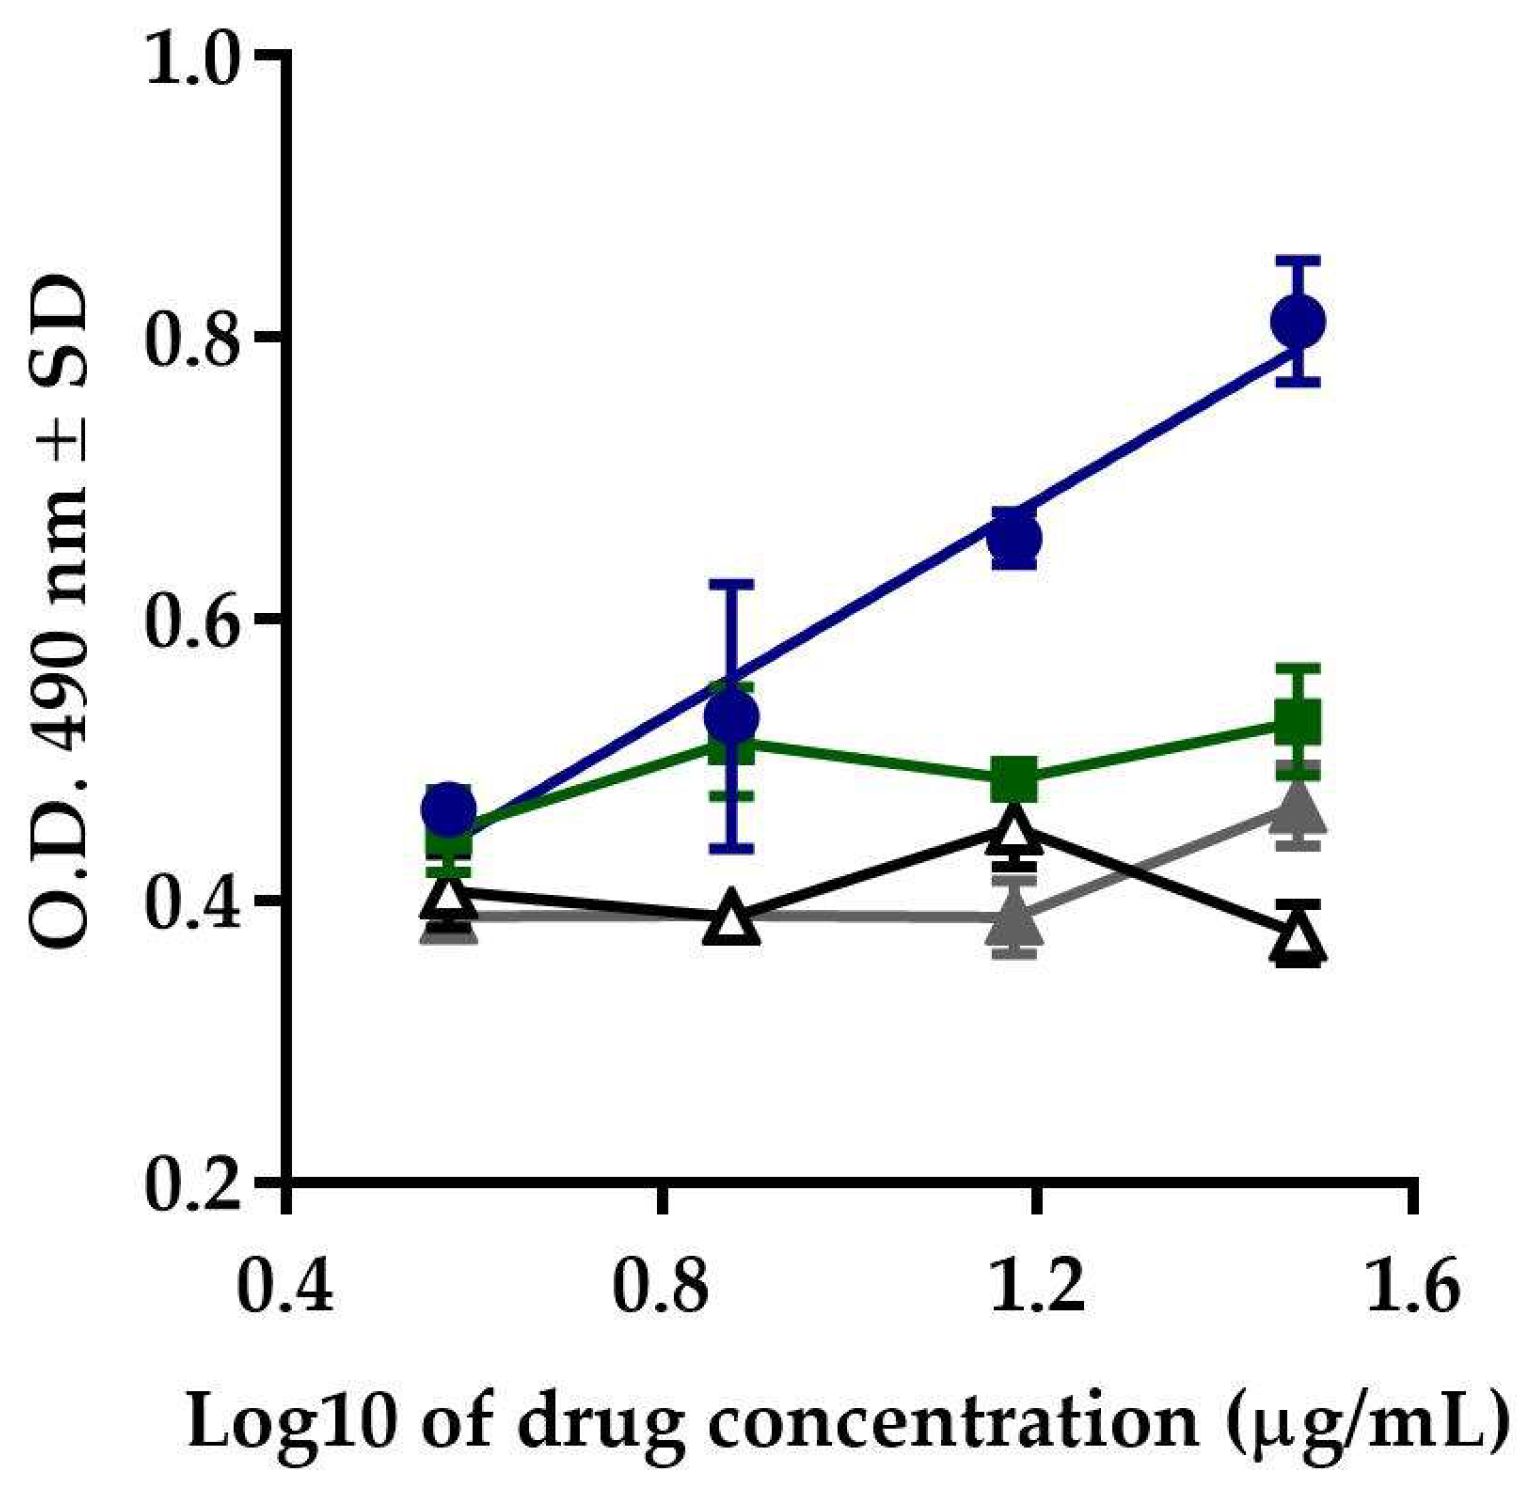
2.2.3. Specificity
2.2.4. System Suitability
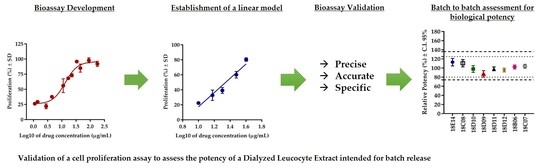
2.2.5. Batch Consistency
3. Materials and Methods
3.1. Materials
3.2. Cell Culture and In Vitro Cell-Based Assay
3.3. International Pharmaceutical Guidelines
3.4. Method Development
3.5. Method Validation
3.5.1. Precision
3.5.2. Accuracy
3.5.3. Specificity
3.5.4. System Suitability
3.6. Batch-to-Batch Consitency
3.7. Statistical Analysis
4. Conclusions
Supplementary Materials
Author Contributions
Funding
Acknowledgments
Conflicts of Interest
References
- Hernandez-Esquivel, M.A.; Perez-Torres, A.; Romero-Romero, L.; Reyes-Matute, A.; Loaiza, B.; Mellado-Sanchez, G.; Pavon, L.; Medina-Rivero, E.; Pestell, R.G.; Perez-Tapia, S.M.; et al. The dialyzable leukocyte extract Transferon (™) inhibits tumor growth and brain metastasis in a murine model of prostate cancer. Biomed. Pharmacother. 2018, 101, 938–944. [Google Scholar] [CrossRef] [PubMed]
- Jimenez-Uribe, A.P.; Valencia-Martinez, H.; Carballo-Uicab, G.; Vallejo-Castillo, L.; Medina-Rivero, E.; Chacon-Salinas, R.; Pavon, L.; Velasco-Velazquez, M.A.; Mellado-Sanchez, G.; Estrada-Parra, S.; et al. CD80 Expression Correlates with IL-6 Production in THP-1-Like Macrophages Costimulated with LPS and Dialyzable Leukocyte Extract (Transferon®). J. Immunol. Res. 2019, 2019, 2198508. [Google Scholar] [CrossRef] [PubMed]
- Medina-Rivero, E.; Merchand-Reyes, G.; Pavon, L.; Vazquez-Leyva, S.; Perez-Sanchez, G.; Salinas-Jazmin, N.; Estrada-Parra, S.; Velasco-Velazquez, M.; Perez-Tapia, S.M. Batch-to-batch reproducibility of Transferon. J. Pharm. Biomed. Anal. 2014, 88, 289–294. [Google Scholar] [CrossRef] [PubMed]
- Xiong, H.; Yu, L.X.; Qu, H. Batch-to-batch quality consistency evaluation of botanical drug products using multivariate statistical analysis of the chromatographic fingerprint. AAPS PharmSciTech 2013, 14, 802–810. [Google Scholar] [CrossRef] [PubMed]
- Guideline, I.H.T. Validation of Analytical Procedures: Text and methodology Q2 (R1) version 4. In Proceedings of the International Conference for Harmonization, Geneva, Switzerland, November 2005. [Google Scholar]
- WHO. Guidelines on Evaluation of Similar Bioterapeutic Products (SBPs); Annex 2; Technical Report Series No. 977; WHO: Geneva, Switzerland, 2009; pp. 64–65. [Google Scholar]
- Hussaarts, L.; Muhlebach, S.; Shah, V.P.; McNeil, S.; Borchard, G.; Fluhmann, B.; Weinstein, V.; Neervannan, S.; Griffiths, E.; Jiang, W.; et al. Equivalence of complex drug products: Advances in and challenges for current regulatory frameworks. Ann. N. Y. Acad. Sci. 2017, 1407, 39–49. [Google Scholar] [CrossRef] [PubMed]
- USP chapter <1032> Development and Design of Bioassays; USP 35-NF-30; USP Pharmacopeical Convention: Rockville, MD, USA, 2017.
- Lopez-Morales, C.A.; Vazquez-Leyva, S.; Vallejo-Castillo, L.; Carballo-Uicab, G.; Munoz-Garcia, L.; Herbert-Pucheta, J.E.; Zepeda-Vallejo, L.G.; Velasco-Velazquez, M.; Pavon, L.; Perez-Tapia, S.M.; et al. Determination of Peptide Profile Consistency and Safety of Collagen Hydrolysates as Quality Attributes. J. Food Sci. 2019, 84, 430–439. [Google Scholar] [CrossRef] [PubMed]
- Ramirez-Ramirez, D.; Vadillo, E.; Arriaga-Pizano, L.A.; Mayani, H.; Estrada-Parra, S.; Velasco-Velazquez, M.A.; Perez-Tapia, S.M.; Pelayo, R. Early Differentiation of Human CD11c(+)NK Cells with gammadelta T Cell Activation Properties Is Promoted by Dialyzable Leukocyte Extracts. J. Immunol. Res. 2016, 2016, 4097642. [Google Scholar] [CrossRef] [PubMed]
- Salinas-Jazmin, N.; Estrada-Parra, S.; Becerril-Garcia, M.A.; Limon-Flores, A.Y.; Vazquez-Leyva, S.; Medina-Rivero, E.; Pavon, L.; Velasco-Velazquez, M.A.; Perez-Tapia, S.M. Herpes murine model as a biological assay to test dialyzable leukocyte extracts activity. J. Immunol. Res. 2015, 2015, 146305. [Google Scholar] [CrossRef] [PubMed]
- Hernandez, M.E.; Mendieta, D.; Perez-Tapia, M.; Bojalil, R.; Estrada-Garcia, I.; Estrada-Parra, S.; Pavon, L. Effect of selective serotonin reuptake inhibitors and immunomodulator on cytokines levels: An alternative therapy for patients with major depressive disorder. Clin. Dev. Immunol. 2013, 2013, 267871. [Google Scholar] [CrossRef] [PubMed]
- Berron-Perez, R.; Chavez-Sanchez, R.; Estrada-Garcia, I.; Espinosa-Padilla, S.; Cortez-Gomez, R.; Serrano-Miranda, E.; Ondarza-Aguilera, R.; Perez-Tapia, M.; Olvera, B.P.; Mdel, C.J.-M.; et al. Indications, usage, and dosage of the transfer factor. Rev. Alerg. Mex. 2007, 54, 134–139. [Google Scholar] [PubMed]
- Castrejón-Vázquez, M.I.; Reséndiz-Albor, A.A.; Ynga-Durand, M.A.; Arciniega-Martínez, I.M.; Orellana-Villazon, V.I.; García-López, C.A.; Laue-Noguera, M.L.; Vargas-Camaño, M.E. Dialyzable Leukocyte Extract (Transferon) administration in Sepsis: Experience from a single referral pediatric intensive care unit. BioMed. Res. Int. 2019, in press. [Google Scholar]
- Estrada-Parra, S.; Nagaya, A.; Serrano, E.; Rodriguez, O.; Santamaria, V.; Ondarza, R.; Chavez, R.; Correa, B.; Monges, A.; Cabezas, R.; et al. Comparative study of transfer factor and acyclovir in the treatment of herpes zoster. Int. J. Immunopharmacol. 1998, 20, 521–535. [Google Scholar] [CrossRef]
- Cardoso, F.M.; Tomkova, M.; Petrovajova, D.; Bubanova, M.; Ragac, O.; Hornakova, T. New and cost effective cell-based assay for Dialyzed Leukocyte Extract (DLE)-induced Jurkat cells proliferation under azathioprine treatment. J. Pharm. Biomed. Anal. 2017, 138, 100–108. [Google Scholar] [CrossRef] [PubMed]
- Chapter 5.3, Statistical Analysis of Results of Biological Assays and Test. In European Pharmacopeia 6.0, 5th ed.; The Stationery Office: London, UK, 2005.
- USP Chapter <1034> Analysis of Biological Assays; USP 35-NF-30; USP Pharmacopeical Convention: Rockville, MD, USA, 2013.
- USP Chapter <1033> Biological Assay Validation; USP 35-NF-30; USP Pharmacopeical Convention: Rockville, MD, USA, 2017.
- Maltzman, J.S.; Koretzky, G.A. Azathioprine: Old drug, new actions. J. Clin. Investig. 2003, 111, 1122–1124. [Google Scholar] [CrossRef] [PubMed]
- Fleetwood, K.; Bursa, F.; Yellowlees, A. Parallelism in practice: Approaches to parallelism in bioassays. PDA J. Pharm. Sci. Technol. 2015, 69, 248–263. [Google Scholar] [CrossRef] [PubMed]
- Food Drug and Administration. Bioanalytical Method Validation. In Guidance for Industry; Biopharmaceutics, Ed.; Food Drug and Administration: White Oak, MD, USA, 2018; pp. 1–35. [Google Scholar]
Sample Availability: Samples of Transferon® are available from the authors. |


| Repeatability | Intermediate Precision | |||||||
|---|---|---|---|---|---|---|---|---|
| r2 | CV (%) | n | r2 | CV (%) | n | Equality Analysis | ||
| Slopes | Intercepts | |||||||
| Analyst 1 | 0.85 | 3.6–13.6 | 3 | 0.90 | 3.9–10.5 | 6 | F(1, 26) = 0.4851 p = 0.4923 | F(1, 27) = 0.3962 p = 0.5344 |
| Analyst 2 | 0.95 | 0.7–8.9 | 3 | |||||
| Microplate Reader 1 | 0.95 | 0.7–8.9 | 3 | 0.96 | 2.4–7.6 | 6 | F(1, 26) = 0.1471 p = 0.7040 | F(1, 27) = 0.2936 p = 0.5923 |
| Microplate reader 2 | 0.96 | 1.9–7.5 | 3 | |||||
| Run 1 | 0.82 | 7.3–22.6 | 3 | 0.83 | 8.4–16.6 | 6 | F(1, 26) = 0.3208 p = 0.5760 | F(1, 27) = 0.4033 p = 0.5308 |
| Run 2 | 0.85 | 0.6–12.6 | 3 | |||||
| Batch | Potency (80–125%) | C.I. 95% (74–136%) | Δ Response (≥2) | r2 (≥0.8) | CV (≤25%) |
|---|---|---|---|---|---|
| Results | Results | Results | Results | Results | |
| 18E13 | 100.0 | 100–100 | 2.9 | 0.96 | 0.7–8.9 |
| 18E14 | 112.8 | 104–121 | 3.5 | 0.94 | 14–22 |
| 18C08 | 110.5 | 102–118 | 3.5 | 0.92 | 3.0–16 |
| 18D10 | 97.8 | 90–105 | 2.9 | 0.96 | 3.7–14 |
| 18D09 | 87.0 | 79–94 | 2.5 | 0.95 | 3.3–13 |
| 18D11 | 98.2 | 94–102 | 3.0 | 0.98 | 4.5–9.1 |
| 18D12 | 95.5 | 91–99 | 2.9 | 0.98 | 1.2–7.9 |
| 18B06 | 102.3 | 98–106 | 3.2 | 0.97 | 0.5–2.7 |
| 18C07 | 103.9 | 99–108 | 3.1 | 0.98 | 0.7–4.7 |
© 2019 by the authors. Licensee MDPI, Basel, Switzerland. This article is an open access article distributed under the terms and conditions of the Creative Commons Attribution (CC BY) license (http://creativecommons.org/licenses/by/4.0/).
Share and Cite
Carballo-Uicab, G.; Linares-Trejo, J.E.; Mellado-Sánchez, G.; López-Morales, C.A.; Velasco-Velázquez, M.; Pavón, L.; Estrada-Parra, S.; Pérez-Tapia, S.M.; Medina-Rivero, E. Validation of a Cell Proliferation Assay to Assess the Potency of a Dialyzable Leukocyte Extract Intended for Batch Release. Molecules 2019, 24, 3426. https://doi.org/10.3390/molecules24193426
Carballo-Uicab G, Linares-Trejo JE, Mellado-Sánchez G, López-Morales CA, Velasco-Velázquez M, Pavón L, Estrada-Parra S, Pérez-Tapia SM, Medina-Rivero E. Validation of a Cell Proliferation Assay to Assess the Potency of a Dialyzable Leukocyte Extract Intended for Batch Release. Molecules. 2019; 24(19):3426. https://doi.org/10.3390/molecules24193426
Chicago/Turabian StyleCarballo-Uicab, Gregorio, José E. Linares-Trejo, Gabriela Mellado-Sánchez, Carlos A. López-Morales, Marco Velasco-Velázquez, Lenin Pavón, Sergio Estrada-Parra, Sonia Mayra Pérez-Tapia, and Emilio Medina-Rivero. 2019. "Validation of a Cell Proliferation Assay to Assess the Potency of a Dialyzable Leukocyte Extract Intended for Batch Release" Molecules 24, no. 19: 3426. https://doi.org/10.3390/molecules24193426
APA StyleCarballo-Uicab, G., Linares-Trejo, J. E., Mellado-Sánchez, G., López-Morales, C. A., Velasco-Velázquez, M., Pavón, L., Estrada-Parra, S., Pérez-Tapia, S. M., & Medina-Rivero, E. (2019). Validation of a Cell Proliferation Assay to Assess the Potency of a Dialyzable Leukocyte Extract Intended for Batch Release. Molecules, 24(19), 3426. https://doi.org/10.3390/molecules24193426