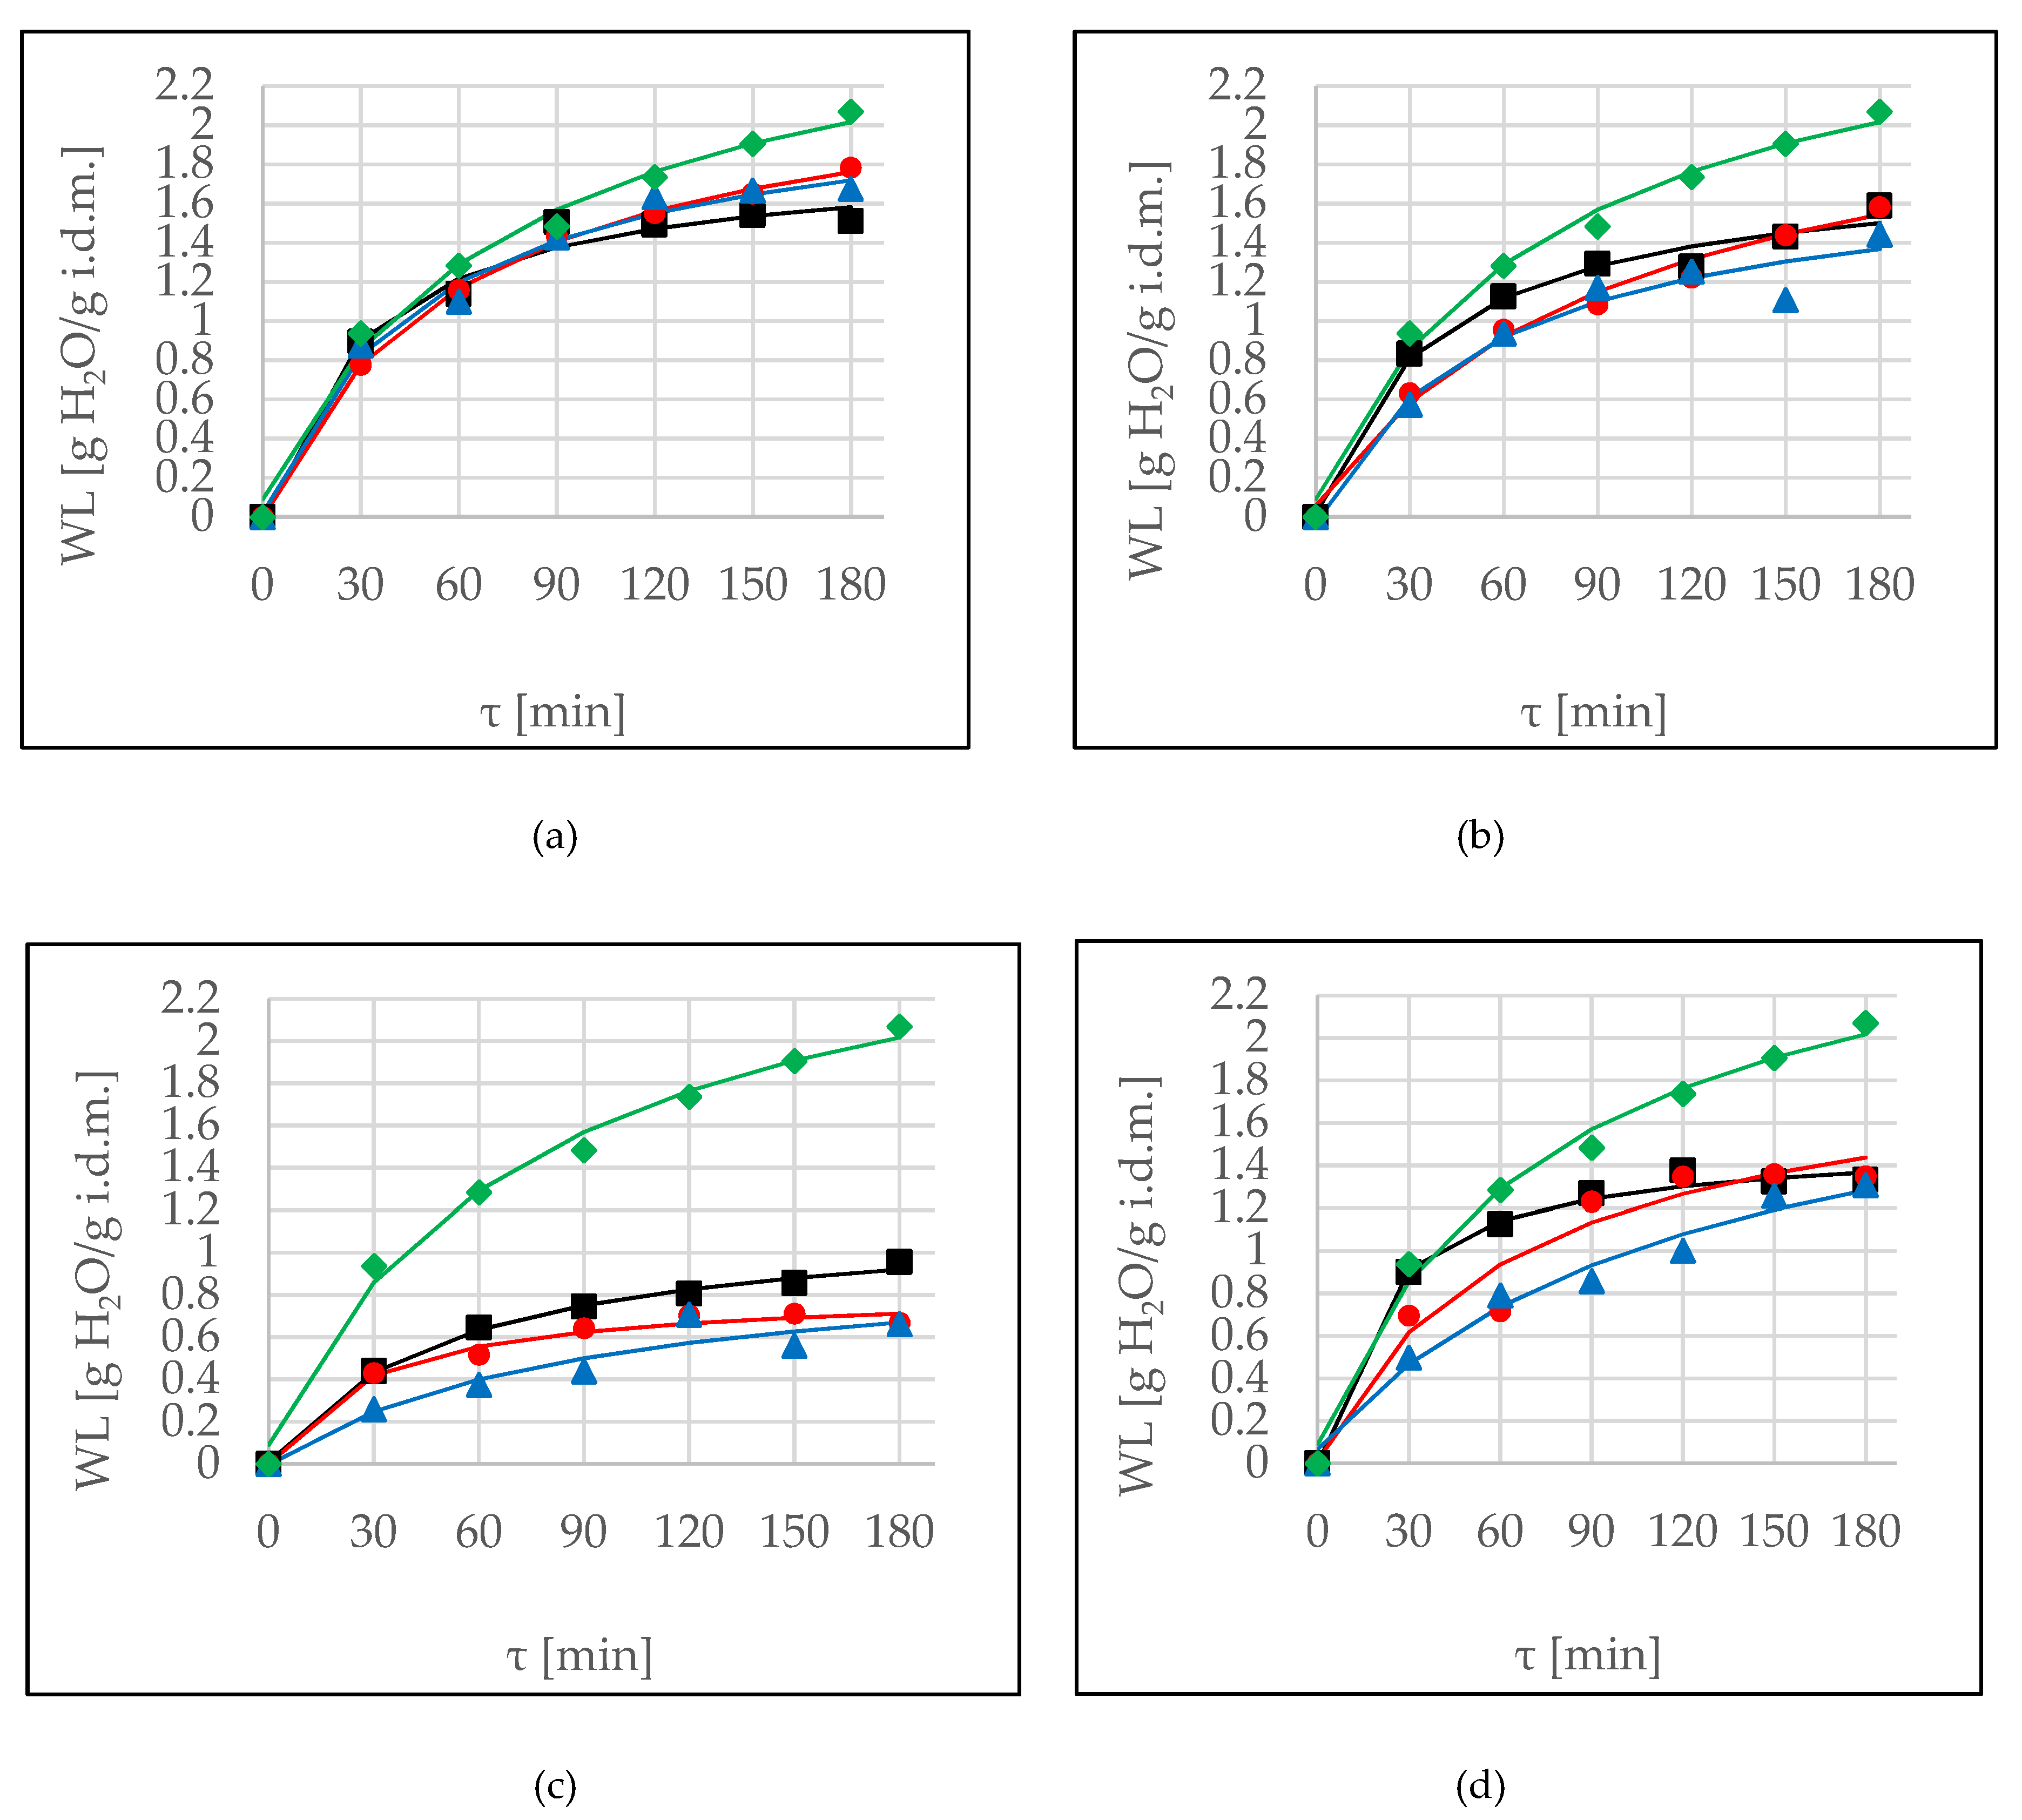
Figure 1.
Water loss (WL) kinetics at several conditions (OD (■), OD+US (●), OD+USi (▲)) at 40 °C, in different solutions: (a) erythritol, (b) xylitol, (c) maltitol, (d) DHA. Lines are the Peleg’s model. The green line (♦) is the kinetic reference (sucrose).
Figure 1.
Water loss (WL) kinetics at several conditions (OD (■), OD+US (●), OD+USi (▲)) at 40 °C, in different solutions: (a) erythritol, (b) xylitol, (c) maltitol, (d) DHA. Lines are the Peleg’s model. The green line (♦) is the kinetic reference (sucrose).
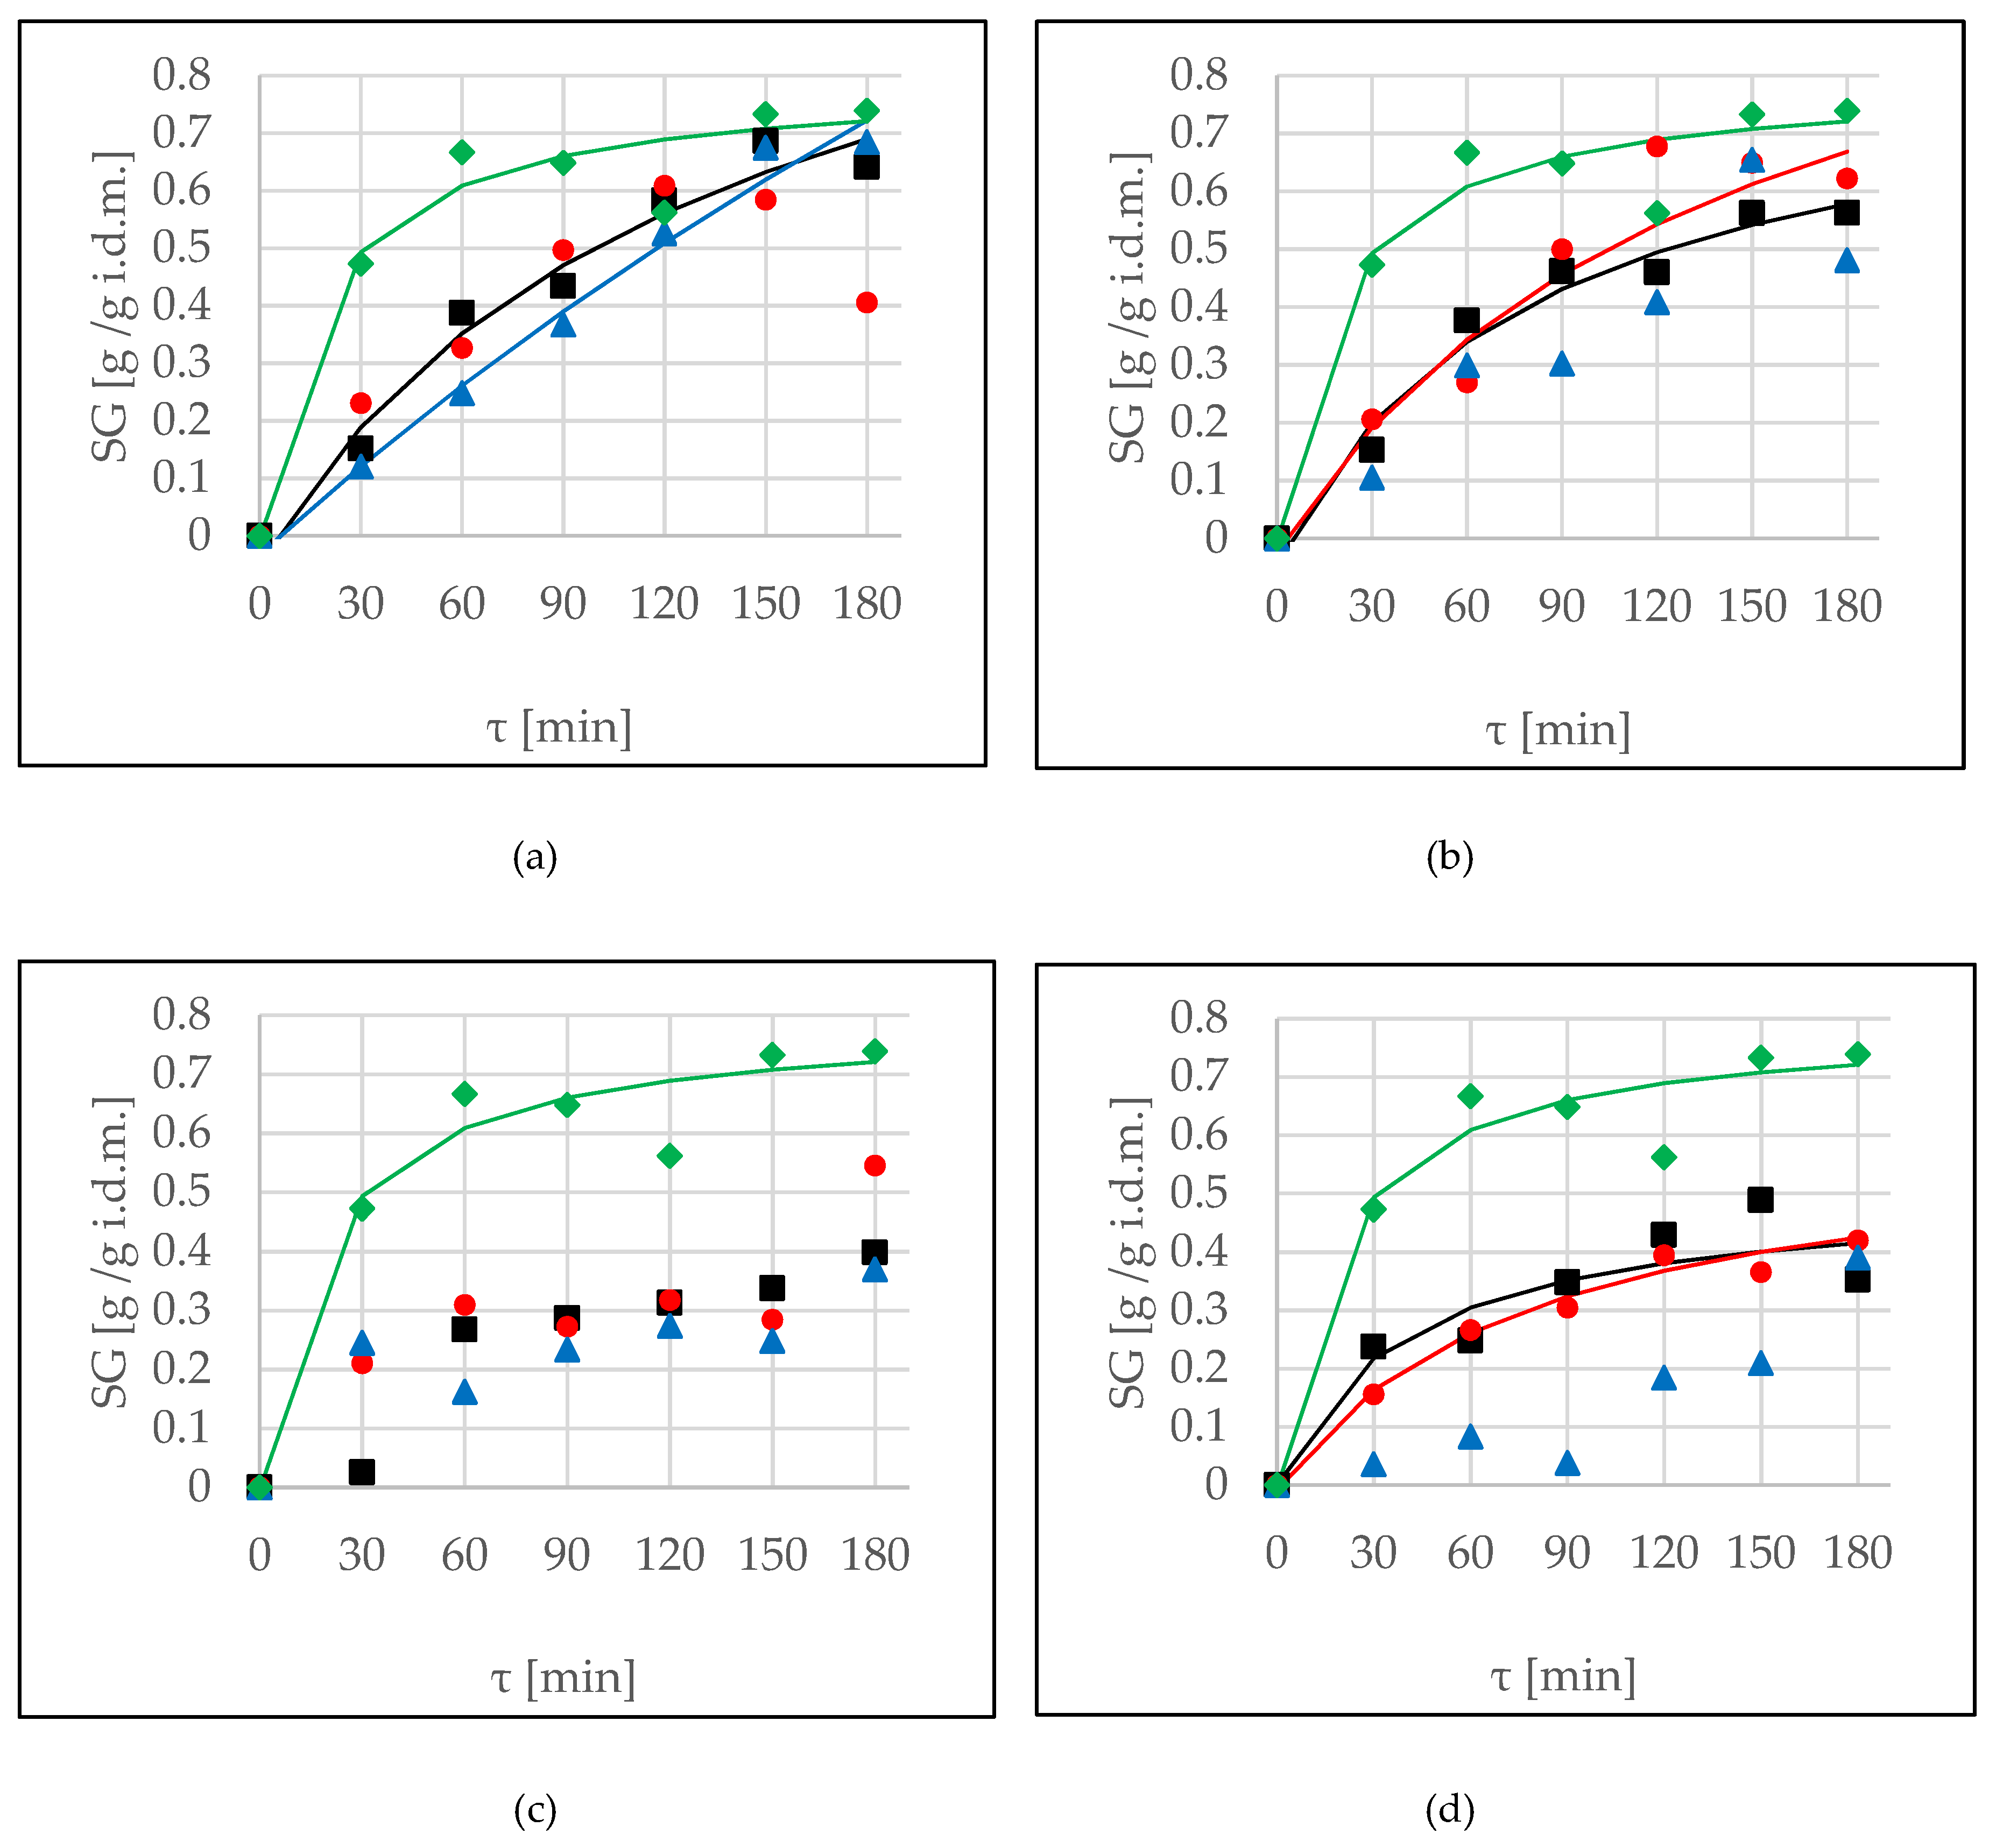
Figure 2.
Solid gain (SG) kinetics at several conditions, (OD (■), OD+US (●), OD+USi (▲)) at 40 °C, in different solutions: (a) erythritol, (b) xylitol, (c) maltitol, (d) DHA. Lines represent the Peleg’s model. The green line (♦) is the kinetic reference (sucrose).
Figure 2.
Solid gain (SG) kinetics at several conditions, (OD (■), OD+US (●), OD+USi (▲)) at 40 °C, in different solutions: (a) erythritol, (b) xylitol, (c) maltitol, (d) DHA. Lines represent the Peleg’s model. The green line (♦) is the kinetic reference (sucrose).
Figure 3.
True water loss (WLT) kinetics in several conditions (OD (■), OD+US (●), OD+USi (▲)) at 40 °C in different solutions: (a) erythritol, (b) xylitol, (c) maltitol, (d) DHA. Lines are the Peleg’s model. The green line (♦) is the kinetic reference (sucrose).
Figure 3.
True water loss (WLT) kinetics in several conditions (OD (■), OD+US (●), OD+USi (▲)) at 40 °C in different solutions: (a) erythritol, (b) xylitol, (c) maltitol, (d) DHA. Lines are the Peleg’s model. The green line (♦) is the kinetic reference (sucrose).
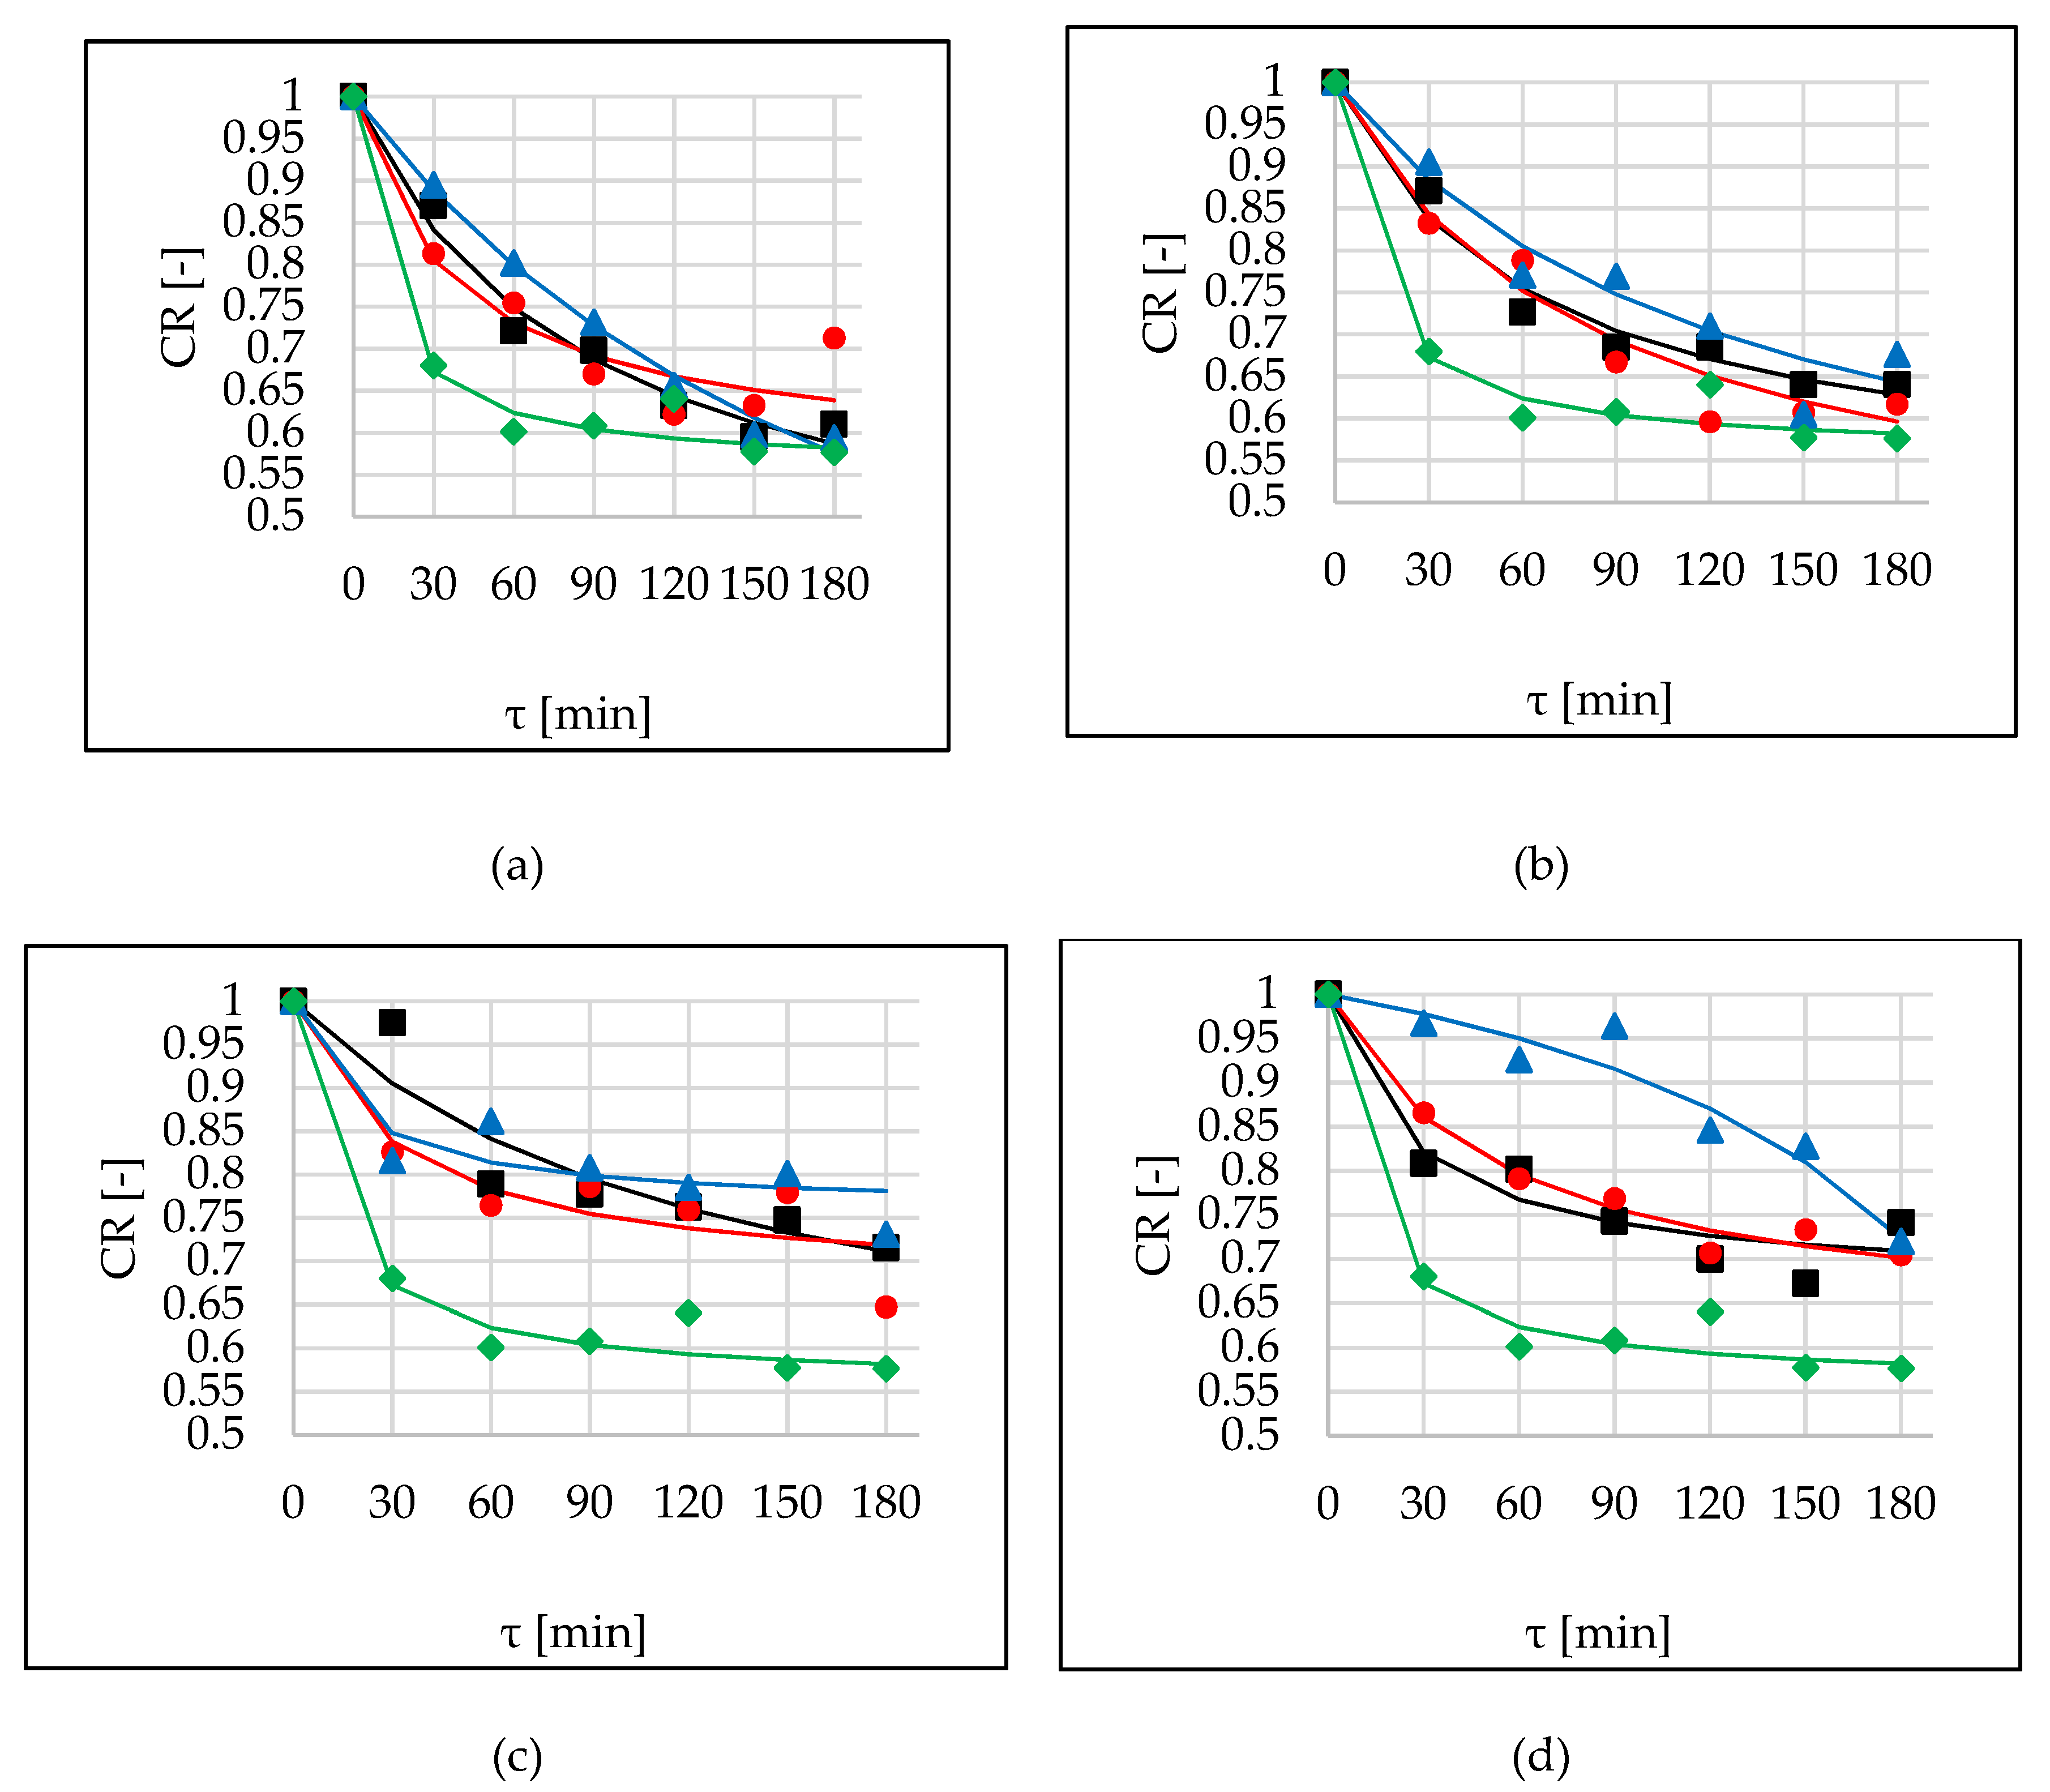
Figure 4.
The Cichowska et al. ratio (CR) kinetics in several conditions (OD (■), OD+US (●), OD+USi (▲)) at 40 °C, in different solutions: (a) erythritol, (b) xylitol, (c) maltitol, (d) DHA. Lines are the Peleg’s model. The green line (♦) is the kinetic reference (sucrose).
Figure 4.
The Cichowska et al. ratio (CR) kinetics in several conditions (OD (■), OD+US (●), OD+USi (▲)) at 40 °C, in different solutions: (a) erythritol, (b) xylitol, (c) maltitol, (d) DHA. Lines are the Peleg’s model. The green line (♦) is the kinetic reference (sucrose).
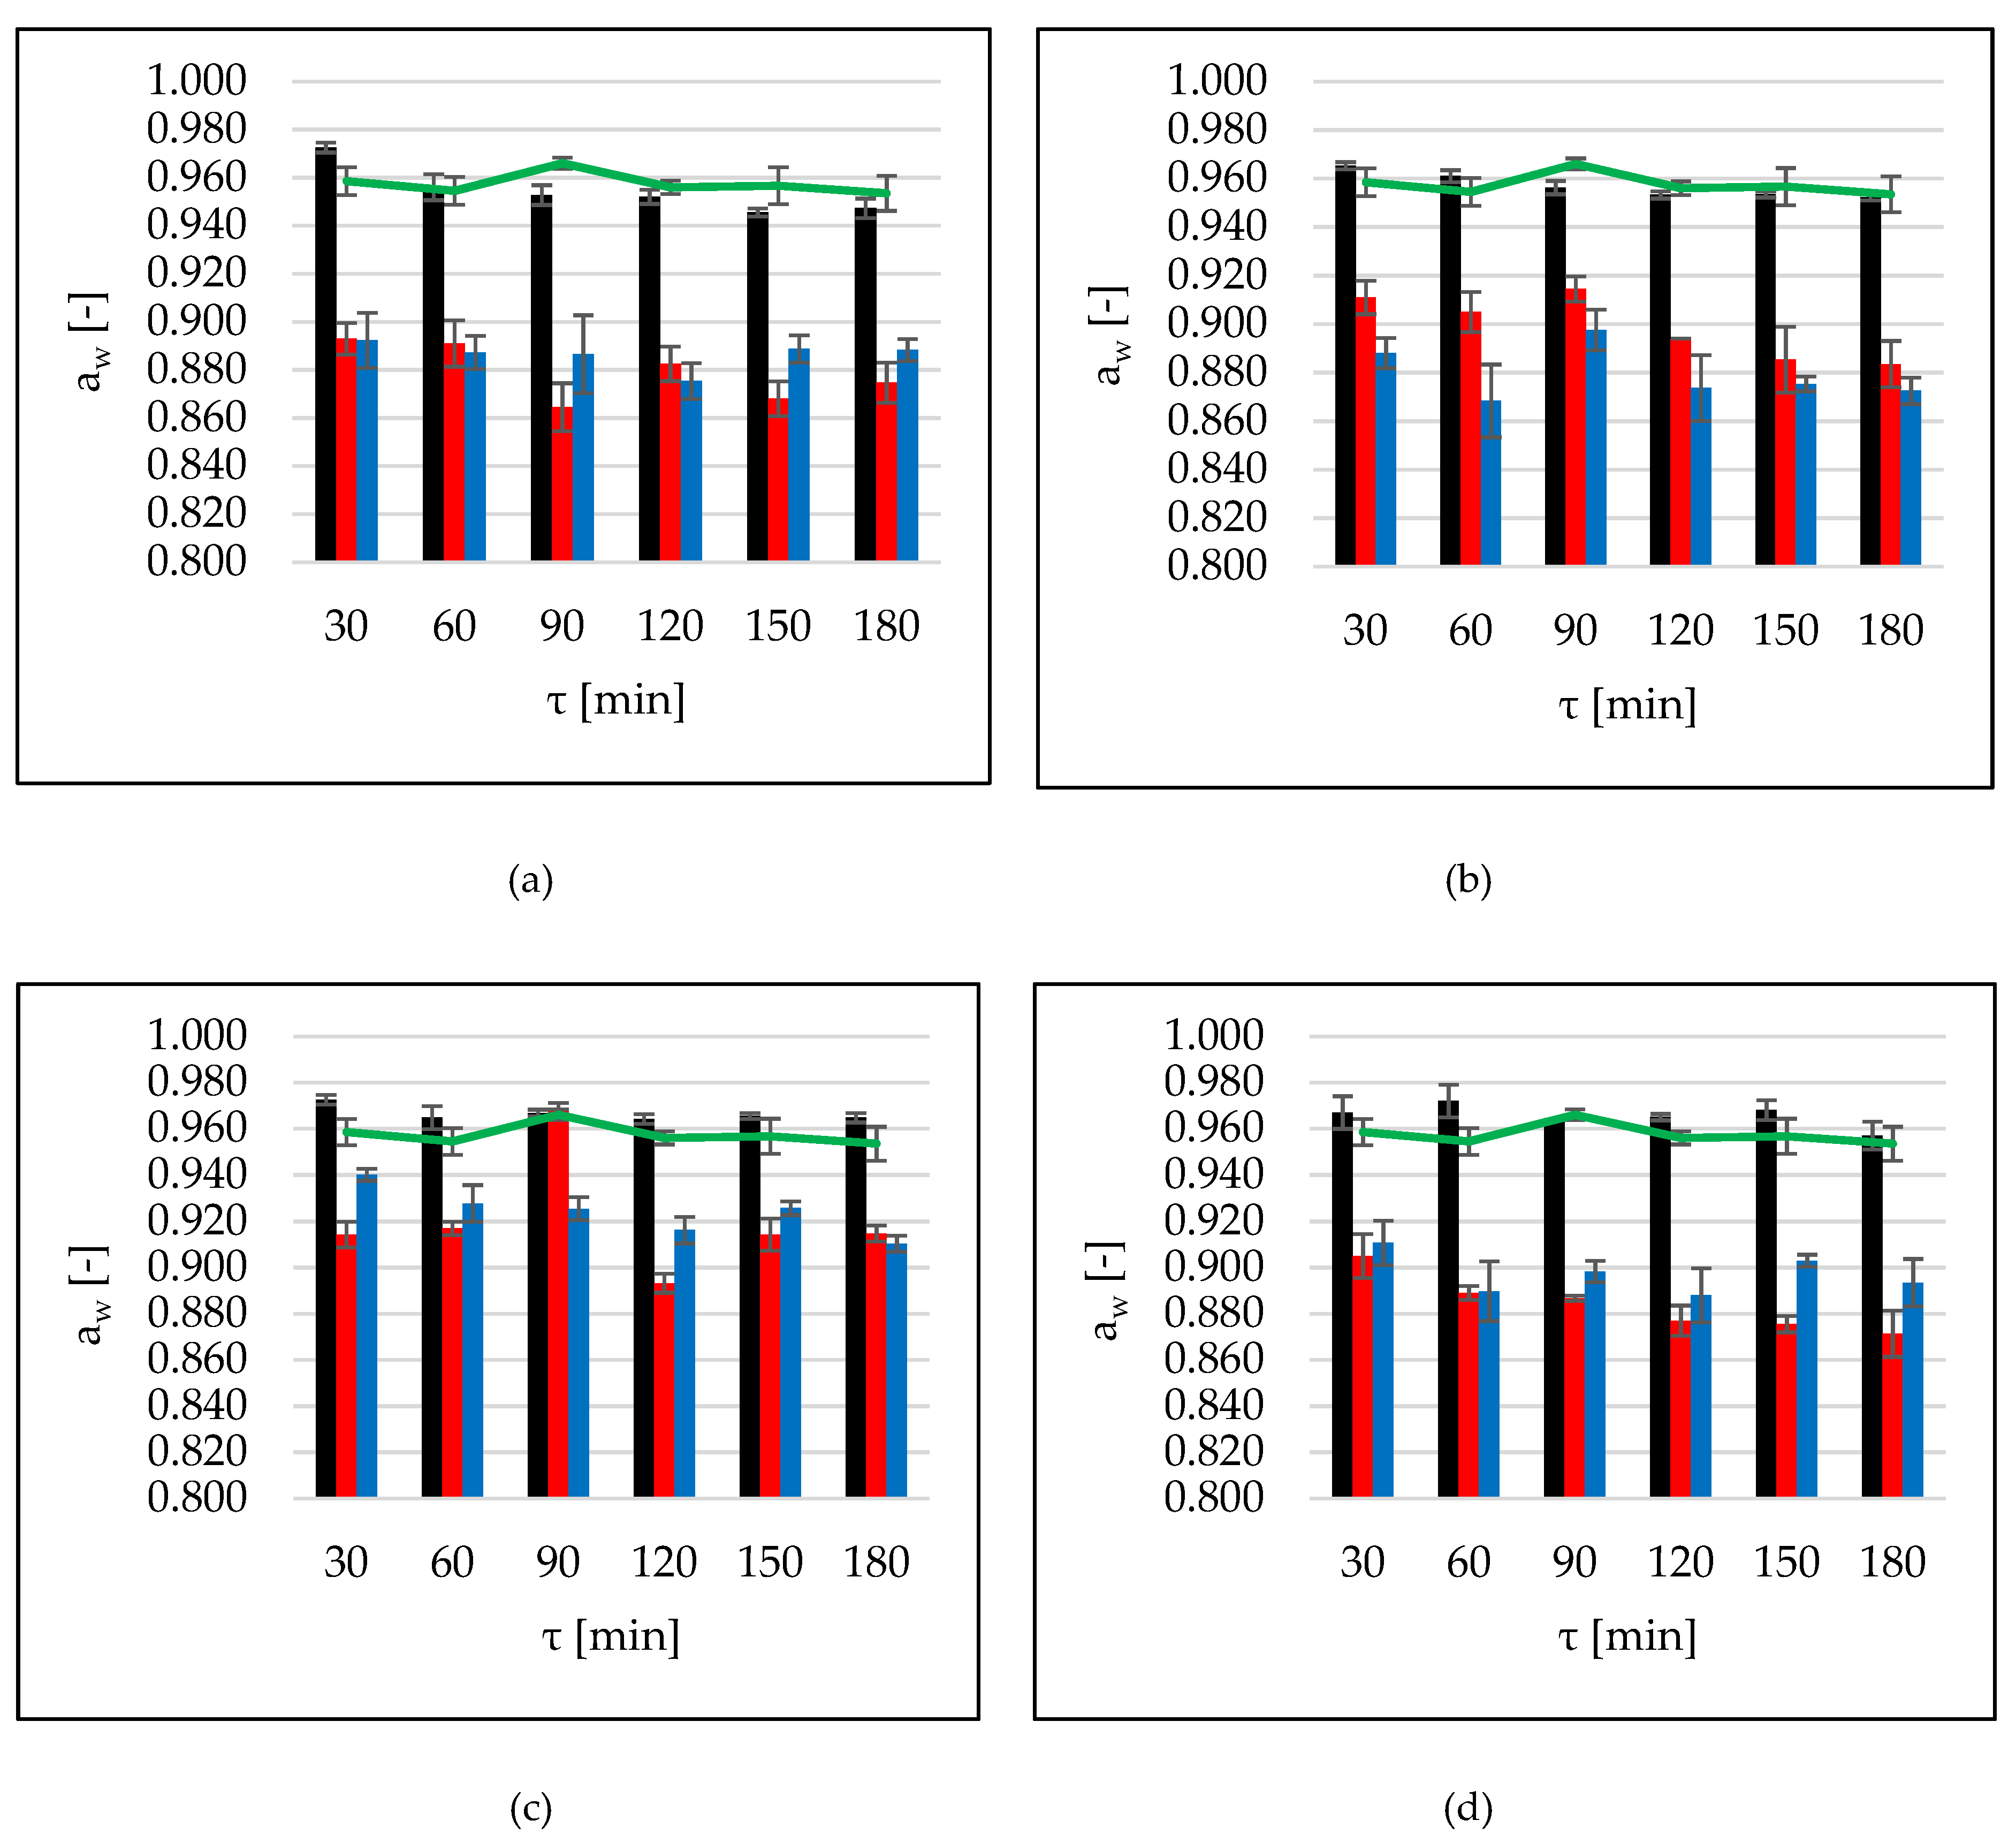
Figure 5.
Water activity, aw, at several conditions (OD (black bars), OD+US (red bars), OD+USi (blue bars)) at 40 °C, using different solutions: (a) erythritol, (b) xylitol, (c) maltitol, (d) DHA. The green lines are values for the reference (sucrose).
Figure 5.
Water activity, aw, at several conditions (OD (black bars), OD+US (red bars), OD+USi (blue bars)) at 40 °C, using different solutions: (a) erythritol, (b) xylitol, (c) maltitol, (d) DHA. The green lines are values for the reference (sucrose).
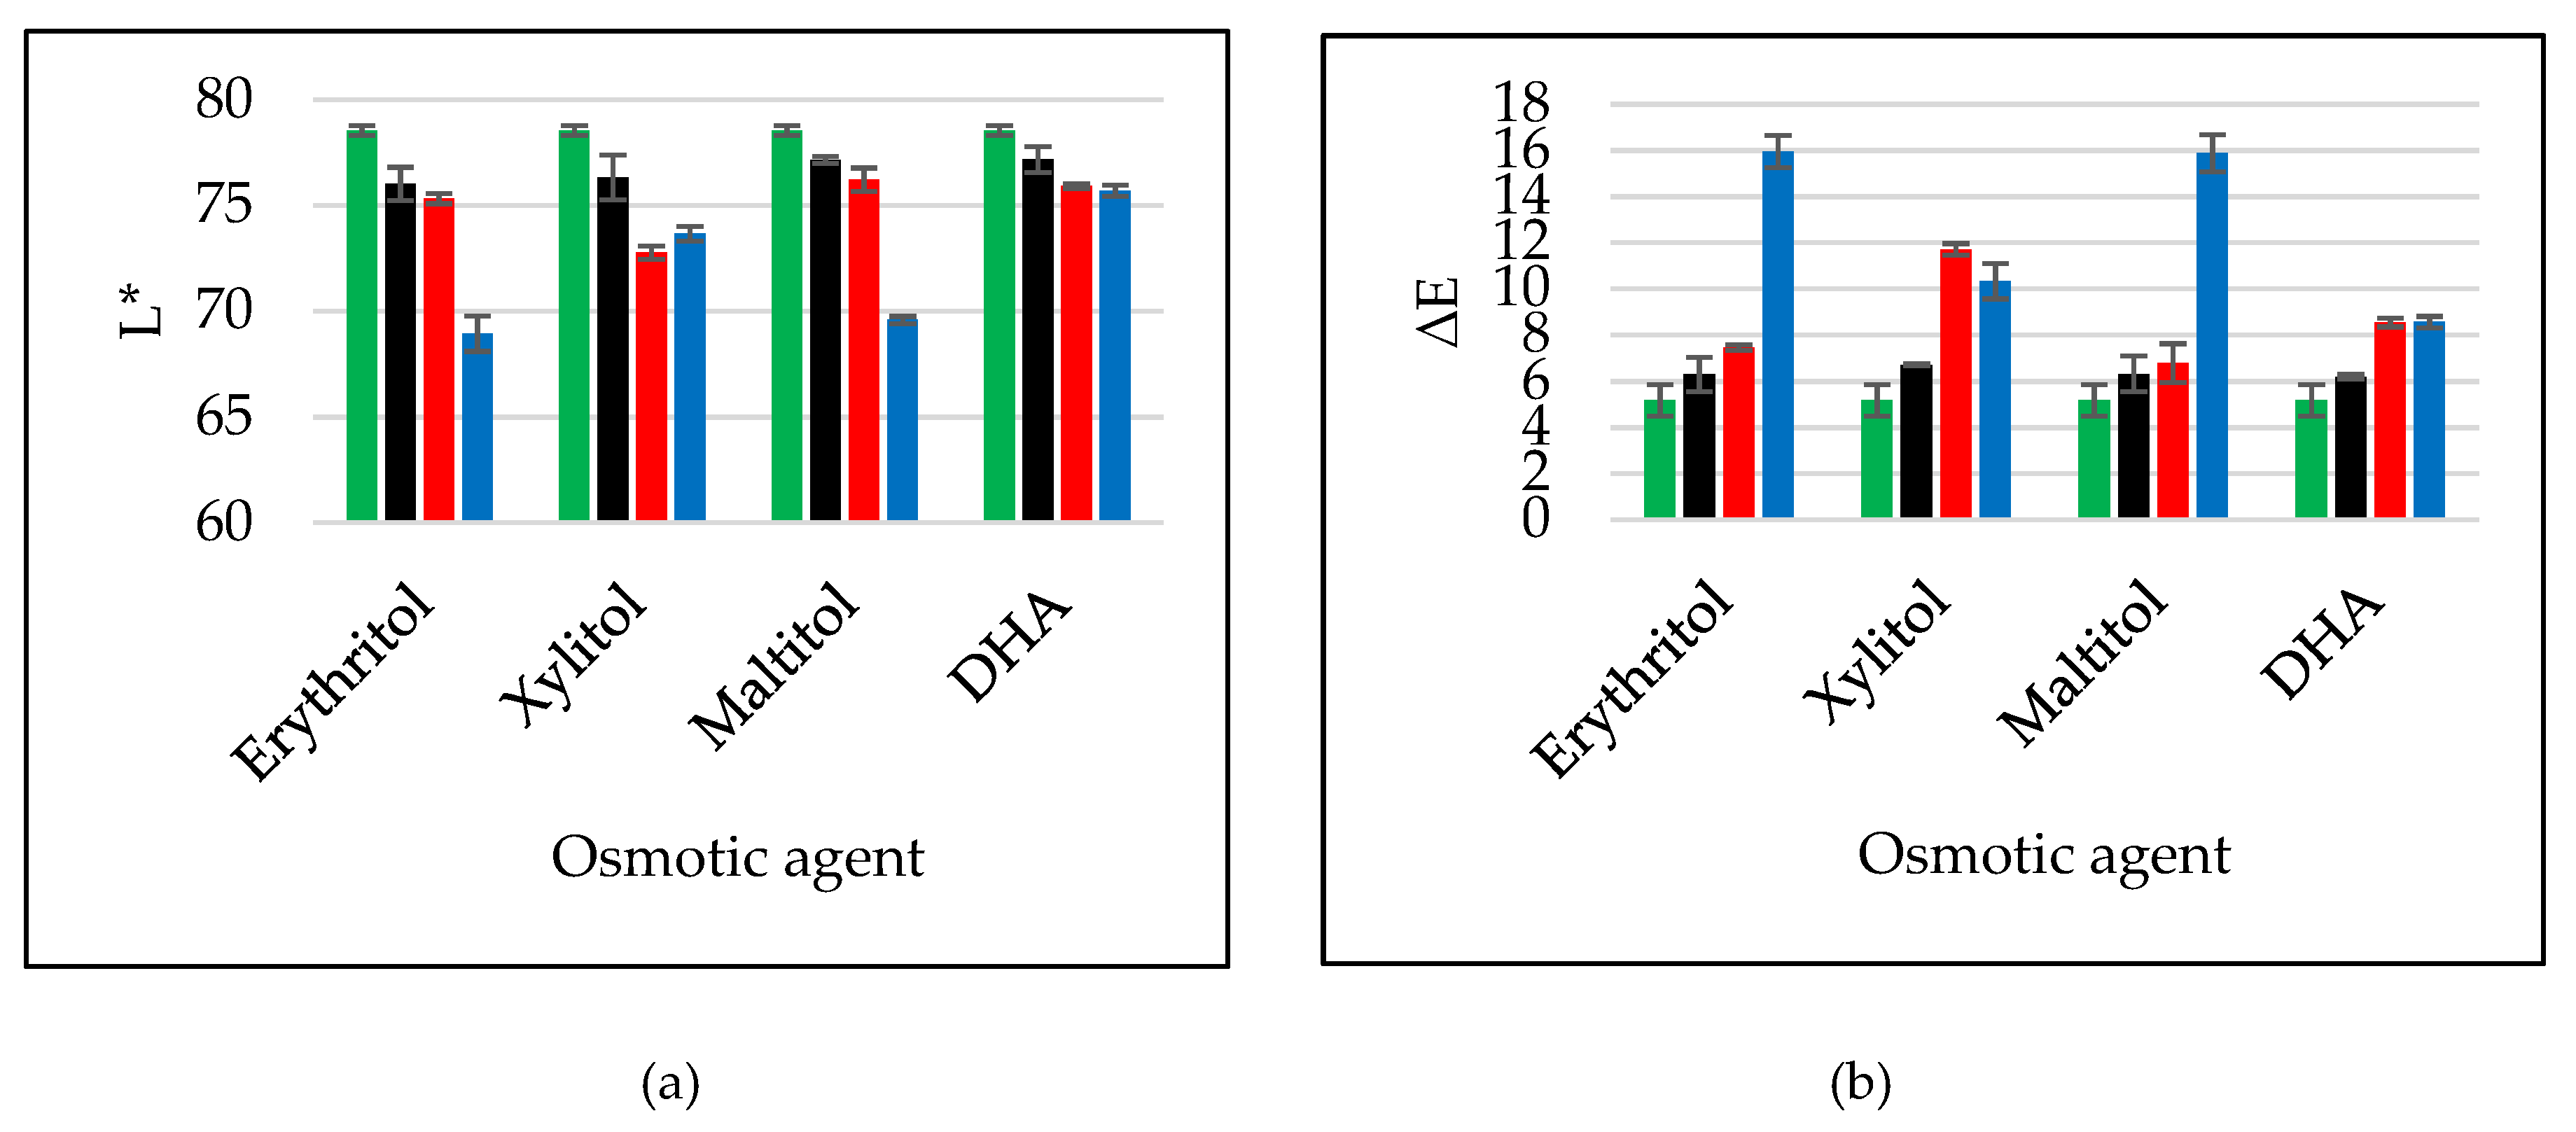
Figure 6.
Colour changes after 120 min OD of apples: values of parameter L* (a), values of absolute colour difference (b) in several conditions (OD (black bars), OD+US (red bars), OD+USi (blue bars)) at 40 °C using different solutions. The green bars are values for reference (sucrose).
Figure 6.
Colour changes after 120 min OD of apples: values of parameter L* (a), values of absolute colour difference (b) in several conditions (OD (black bars), OD+US (red bars), OD+USi (blue bars)) at 40 °C using different solutions. The green bars are values for reference (sucrose).
Table 1.
Water content (g H2O/g dry matter) in apples during OD in different solutions. OD: osmotic dehydration, US: continuous sonication, USi: interval sonication; DHA: dihydroxyacetone.
Table 1.
Water content (g H2O/g dry matter) in apples during OD in different solutions. OD: osmotic dehydration, US: continuous sonication, USi: interval sonication; DHA: dihydroxyacetone.
| Time [min] | Solution/Application | Sucrose | Erythritol | Xylitol | Maltitol | DHA |
|---|
| 0 | | 5.69 ± 0.2 |
| 30 | OD | 3.23 ± 0.2 | 4.16 ± 0.2 | 4.22 ± 0.4 | 5.11 ± 0.2 | 3.86 ± 0.1 |
| OD+US | 3.52 ± 0.2 | 3.99 ± 0.1 | 4.20 ± 0.3 | 4.34 ± 0.1 | 4.31 ± 0.1 |
| OD+USi | 3.82 ± 0.2 | 4.30 ± 0.3 | 4.62 ± 0.2 | 4.44 ± 0.2 | 5.01 ± 0.3 |
| 60 | OD | 2.64 ± 0.1 | 3.27 ± 0.0 | 3.31 ± 0.1 | 3.97 ± 0.1 | 3.65 ± 0.1 |
| OD+US | 2.54 ± 0.2 | 3.41 ± 0.1 | 3.72 ± 0.2 | 3.95 ± 0.2 | 3.92 ± 0.2 |
| OD+USi | 3.09 ± 0.5 | 3.67 ± 0.1 | 3.66 ± 0.2 | 4.57 ± 0.2 | 4.53 ± 0.3 |
| 90 | OD | 2.55 ± 0.2 | 2.91 ± 0.1 | 3.00 ± 0.1 | 3.83 ± 0.1 | 3.28 ± 0.2 |
| OD+US | 2.96 ± 0.1 | 2.84 ± 0.2 | 3.06 ± 0.1 | 3.96 ± 0.1 | 3.42 ± 0.3 |
| OD+USi | 2.81 ± 0.2 | 3.11 ± 0.1 | 3.47 ± 0.2 | 4.23 ± 0.2 | 4.65 ± 0.1 |
| 120 | OD | 2.52 ± 0.0 | 2.64 ± 0.0 | 3.02 ± 0.0 | 3.71 ± 0.1 | 3.01 ± 0.0 |
| OD+US | 2.32 ± 0.1 | 2.57 ± 0.0 | 2.58 ± 0.2 | 3.78 ± 0.1 | 3.02 ± 0.1 |
| OD+USi | 2.68 ± 0.2 | 2.65 ± 0.1 | 3.14 ± 0.0 | 3.91 ± 0.2 | 3.96 ± 0.2 |
| 150 | OD | 2.18 ± 0.1 | 2.46 ± 0.1 | 2.72 ± 0.1 | 3.60 ± 0.0 | 2.93 ± 0.1 |
| OD+US | 2.42 ± 0.2 | 2.55 ± 0.2 | 2.58 ± 0.2 | 3.87 ± 0.1 | 3.17 ± 0.2 |
| OD+USi | 2.94 ± 0.3 | 2.40 ± 0.1 | 2.76 ± 0.1 | 4.10 ± 0.1 | 3.66 ± 0.2 |
| 180 | OD | 2.08 ± 0.1 | 2.54 ± 0.2 | 2.62 ± 0.1 | 3.38 ± 0.1 | 3.22 ± 0.2 |
| OD+US | 1.79 ± 0.2 | 2.78 ± 0.2 | 2.53 ± 0.1 | 3.24 ± 0.0 | 3.05 ± 0.1 |
| OD+USi | 2.15 ± 0.2 | 2.38 ± 0.0 | 2.87 ± 0.2 | 3.67 ± 0.2 | 3.15 ± 0.1 |
Table 2.
The influence of osmotic agents and pre-treatment time on water content in fruit.
Table 2.
The influence of osmotic agents and pre-treatment time on water content in fruit.
| Factor | p-Value | Contrast | +/– Limits | Difference |
|---|
| Type of osmotic substance | erythritol b | 0.000 * | erythritol–xylitol | 0.1300 | –0.2106 * |
| xylitol c | erythritol–sucrose | 0.1311 | 0.3703 * |
| maltitol e | xylitol–maltitol | 0.1305 | –0.7410 * |
| DHA d | xylitol–sucrose | 0.1335 | 0.5809 * |
| sucrose a | DHA–erythritol | 0.1385 | 0.6672 * |
| Time (min) | 30 e | 0.000 * | 30–60 | 0.1497 | 0.6378 * |
| 60 d | 60–90 | 0.1504 | 0.2674 * |
| 90 c | 90–120 | 0.1549 | 0.2734 * |
| 120 b | 120–150 | 0.1577 | 0.0955 |
| 150 b | 120–180 | 0.1548 | 0.3013 * |
| 180 a | 150–180 | 0.1549 | 0.2059 * |
| Type of sonication | OD a | 0.000 * | OD–US | 0.0902 | –0.0117 |
| OD+US a | OD–USi | 0.0881 | –0.3300 * |
| OD+USi b | US–USi | 0.0889 | –0.3183 * |
Table 3.
The influence of osmotic agents and pre-treatment time on water loss during OD.
Table 3.
The influence of osmotic agents and pre-treatment time on water loss during OD.
| Factor | p-Value | Contrast | +/– Limits | Difference |
|---|
| Type of osmotic substance | erythritol d | 0.000 * | erythritol–xylitol | 0.0764 | 0.2053 * |
| xylitol c | erythritol–sucrose | 0.0770 | –0.2390 * |
| maltitol a | xylitol–maltitol | 0.0767 | 0.5534 * |
| DHA b | xylitol–sucrose | 0.0784 | –0.4443 * |
| sucrose e | DHA–erythritol | 0.0814 | –0.2918 * |
| Time (min) | 30 a | 0.000 * | 30–60 | 0.0879 | –0.2963 * |
| 60 b | 60–90 | 0.0888 | –0.2109 * |
| 90 c | 90–120 | 0.0910 | –0.1247 * |
| 120 d | 120–150 | 0.0927 | –0.0552 |
| 150 d | 120–180 | 0.0910 | –0.1745 * |
| 180 e | 150–180 | 0.0910 | –0.1193 * |
| Type of sonication | OD b | 0.000 * | OD–US | 0.0530 | –0.0034 |
| OD+US b | OD–USi | 0.0514 | 0.1406 * |
| OD+USi a | US–USi | 0.0522 | 0.1439 * |
Table 4.
Values of k1, k2, R2, χ2, coefficient of residual variation (CRV), and RMSE of modelling WL using Peleg’s model. RMSE: root mean square error.
Table 4.
Values of k1, k2, R2, χ2, coefficient of residual variation (CRV), and RMSE of modelling WL using Peleg’s model. RMSE: root mean square error.
| Solution | Application | k1 (kg/kg·min) | k2 (kg/kg) | R2 | χ2 | CRV (%) | RMSE |
|---|
| Erythritol | OD | 16.714 | 0.534 | 0.862 | 0.006 | 5.85 | 0.064 |
| OD+US | 25.757 | 0.424 | 0.982 | 0.000 | 1.59 | 0.018 |
| OD+USi | 23.446 | 0.459 | 0.967 | 0.004 | 4.96 | 0.056 |
| Xylitol | OD | 21.117 | 0.558 | 0.942 | 0.004 | 5.26 | 0.054 |
| OD+US | 43.499 | 0.431 | 0.959 | 0.004 | 5.94 | 0.005 |
| OD+USi | 30.449 | 0.547 | 0.920 | 0.011 | 10.03 | 0.087 |
| Maltitol | OD | 45.191 | 0.846 | 0.910 | 0.000 | 3.18 | 0.019 |
| OD+US | 35.390 | 1.210 | 0.906 | 0.001 | 5.63 | 0.028 |
| OD+USi | 89.974 | 0.985 | 0.818 | 0.005 | 15.24 | 0.062 |
| DHA | OD | 13.019 | 0.658 | 0.976 | 0.002 | 3.51 | 0.034 |
| OD+US | 34.449 | 0.512 | 0.884 | 0.016 | 11.89 | 0.106 |
| OD+USi | 60.139 | 0.487 | 0.954 | 0.005 | 7.73 | 0.059 |
| Sucrose | OD | 28.202 | 0.362 | 0.974 | 0.005 | 4.88 | 0.060 |
Table 5.
The influence of osmotic agents and pre-treatment time on solid gain during OD.
Table 5.
The influence of osmotic agents and pre-treatment time on solid gain during OD.
| Factor | p-Value | Contrast | +/– Limits | Difference |
|---|
| Type of osmotic substance | erythritol b | 0.000 * | erythritol–xylitol | 0.0479 | 0.0327 |
| xylitol b | erythritol–sucrose | 0.0483 | –0.0906 * |
| maltitol a | xylitol–maltitol | 0.0481 | 0.1408 * |
| DHA a | xylitol–sucrose | 0.0492 | –0.1233 * |
| sucrose c | DHA–erythritol | 0.0511 | –0.1875 * |
| Time (min) | 30 a | 0.000 * | 30–60 | 0.0552 | –0.1396 * |
| 60 b | 60–90 | 0.0555 | –0.3507 |
| 90 b | 90–120 | 0.0571 | –0.0801 * |
| 120 c | 120–150 | 0.0582 | –0.0378 |
| 150 cd | 120–180 | 0.0571 | –0.0915 * |
| 180 d | 150–180 | 0.0571 | –0.0538 |
| Type of sonication | OD b | 0.000 * | OD–US | 0.0333 | 0.0164 |
| OD+US b | OD–USi | 0.0325 | 0.0872 * |
| OD+USi a | US–USi | 0.0328 | 0.0708 * |
Table 6.
Values of k1, k2, R2, χ2, CRV, and RMSE of modelling SG using Peleg’s model.
Table 6.
Values of k1, k2, R2, χ2, CRV, and RMSE of modelling SG using Peleg’s model.
| Solution | Application | k1 (kg/kg·min) | k2 (kg/kg) | R2 | χ2 | CRV (%) | RMSE |
|---|
| Erythritol | OD | 103.136 | 0.782 | 0.906 | 0.002 | 10.65 | 0.041 |
| OD+US | 66.307 | 1.302 | 0.699 | 0.009 | 22.11 | 0.079 |
| OD+USi | 187.963 | 0.282 | 0.962 | 0.001 | 8.62 | 0.030 |
| Xylitol | OD | 89.979 | 1.108 | 0.899 | 0.002 | 9.88 | 0.034 |
| OD+US | 114.672 | 0.806 | 0.869 | 0.006 | 17.48 | 0.065 |
| OD+USi | 158.859 | 0.822 | 0.801 | 0.007 | 24.26 | 0.071 |
| Maltitol | OD | 138.805 | 1.398 | 0.849 | 0.004 | 23.47 | 0.052 |
| OD+US | 7432.023 | 38.048 | 0.719 | 0.013 | 35.55 | 0.095 |
| OD+USi | 186.212 | 3.007 | 0.484 | 0.004 | 25.93 | 0.053 |
| DHA | OD | 79.275 | 1.975 | 0.757 | 0.003 | 18.20 | 0.050 |
| OD+US | 126.674 | 1.606 | 0.869 | 0.000 | 7.36 | 0.019 |
| OD+USi | 1796.065 | –7.29 | 0.854 | 0.001 | 22.53 | 0.029 |
| Sucrose | OD | 22.821 | 1.254 | 0.802 | 0.004 | 10.63 | 0.055 |
Table 7.
The influence of osmotic agents and pre-treatment time on true water loss during OD.
Table 7.
The influence of osmotic agents and pre-treatment time on true water loss during OD.
| Factor | p-Value | Contrast | +/– Limits | Difference |
|---|
| Type of osmotic substance | erythritol c | 0.000 * | erythritol–xylitol | 0.0554 | 0.1245 * |
| xylitol b | erythritol–sucrose | 0.0558 | –0.1033 * |
| maltitol a | xylitol–maltitol | 0.0556 | 0.3357 * |
| DHA b | xylitol–sucrose | 0.0568 | –0.2278 * |
| sucrose d | DHA–erythritol | 0.0590 | –0.0943 * |
| Time (min) | 30 a | 0.000 * | 30–60 | 0.0637 | –0.1525 * |
| 60 b | 60–90 | 0.0640 | –0.1351 * |
| 90 c | 90–120 | 0.0659 | –0.0353 |
| 120 cd | 120–150 | 0.0672 | –0.0162 |
| 150 cd | 120–180 | 0.0659 | –0.0602 |
| 180 d | 150–180 | 0.0660 | –0.0440 |
| Type of sonication | OD b | 0.000 * | OD–US | 0.0384 | –0.0106 |
| OD+US b | OD–USi | 0.0375 | 0.0563 * |
| OD+USi a | US–USi | 0.0379 | 0.0669 * |
Table 8.
Values of k1, k2, R2, χ2, CRV, and RMSE of modelling WLT using Peleg’s model.
Table 8.
Values of k1, k2, R2, χ2, CRV, and RMSE of modelling WLT using Peleg’s model.
| Solution | Application | k1 (kg/kg·min) | k2 (kg/kg) | R2 | χ2 | CRV (%) | RMSE |
|---|
| Erythritol | OD | 8.734 | 0.993 | 0.723 | 0.005 | 7.94 | 0.058 |
| OD+US | 27.541 | 0.743 | 0.932 | 0.006 | 8.39 | 0.064 |
| OD+USi | 10.986 | 0.900 | 0.934 | 0.003 | 5.74 | 0.044 |
| Xylitol | OD | 13.276 | 0.982 | 0.899 | 0.001 | 4.62 | 0.033 |
| OD+US | 30.771 | 0.932 | 0.897 | 0.005 | 9.85 | 0.061 |
| OD+USi | 24.939 | 0.947 | 0.817 | 0.012 | 15.01 | 0.095 |
| Maltitol | OD | 34.796 | 1.338 | 0.860 | 0.000 | 3.23 | 0.015 |
| OD+US | 31.860 | 1.763 | 0.791 | 0.003 | 11.70 | 0.044 |
| OD+USi | 95.468 | 1.349 | 0.836 | 0.003 | 14.91 | 0.047 |
| DHA | OD | 10.983 | 0.966 | 0.958 | 0.002 | 4.67 | 0.033 |
| OD+US | 33.461 | 0.823 | 0.864 | 0.011 | 13.08 | 0.087 |
| OD+USi | 34.938 | 0.818 | 0.955 | 0.003 | 6.91 | 0.045 |
| Sucrose | OD | 36.246 | 0.696 | 0.959 | 0.003 | 6.50 | 0.049 |
Table 9.
The influence of osmotic agents and pre-treatment time on CR during OD.
Table 9.
The influence of osmotic agents and pre-treatment time on CR during OD.
| Factor | p-Value | Contrast | +/– Limits | Difference |
|---|
| Type of osmotic substance | erythritol b | 0.000 * | erythritol–xylitol | 0.0254 | –0.0144 |
| xylitol b | erythritol–sucrose | 0.0256 | 0.0470 * |
| maltitol c | xylitol–maltitol | 0.0255 | –0.0721 * |
| DHA c | xylitol–sucrose | 0.0260 | 0.0614 * |
| sucrose a | DHA–erythritol | 0.0270 | 0.1009 * |
| Time (min) | 30 d | 0.000 * | 30–60 | 0.0292 | 0.0854 * |
| 60 c | 60–90 | 0.0293 | 0.0233 |
| 90 c | 90–120 | 0.0302 | 0.0429 * |
| 120 b | 120–150 | 0.0308 | 0.0130 |
| 150 ab | 120–180 | 0.0302 | 0.0415 * |
| 180 a | 150–180 | 0.0302 | 0.0285 |
| Type of sonication | OD a | 0.000 * | OD–US | 0.0176 | –0.0034 |
| OD+US a | OD–USi | 0.0172 | –0.0482 * |
| OD+USi b | US–USi | 0.0174 | –0.0447 * |
Table 10.
Values of k1, k2, R2, χ2, CRV, and RMSE of modelling CR using Peleg’s model.
Table 10.
Values of k1, k2, R2, χ2, CRV, and RMSE of modelling CR using Peleg’s model.
| Solution | Application | k1 (kg/kg·min) | k2 (kg/kg) | R2 | χ2 | CRV (%) | RMSE |
|---|
| Erythritol | OD | 139.433 | 1.645 | 0.959 | 0.001 | 3.28 | 0.019 |
| OD+US | 85.026 | 2.295 | 0.794 | 0.002 | 5.92 | 0.036 |
| OD+USi | 235.305 | 1.046 | 0.960 | 0.000 | 1.92 | 0.012 |
| Xylitol | OD | 124.570 | 1.997 | 0.942 | 0.000 | 3.23 | 0.020 |
| OD+US | 137.717 | 1.700 | 0.889 | 0.001 | 4.75 | 0.028 |
| OD+USi | 209.326 | 1.637 | 0.858 | 0.001 | 5.14 | 0.033 |
| Maltitol | OD | 255.096 | 2.046 | 0.877 | 0.002 | 5.05 | 0.034 |
| OD+US | 94.274 | 3.031 | 0.664 | 0.002 | 5.75 | 0.037 |
| OD+USi | 72.079 | 4.168 | 0.565 | 0.001 | 4.33 | 0.030 |
| DHA | OD | 77.326 | 3.007 | 0.893 | 0.001 | 4.15 | 0.027 |
| OD+US | 138.372 | 2.578 | 0.903 | 0.000 | 1.97 | 0.013 |
| OD+USi | 1479.120 | –4.603 | 0.824 | 0.001 | 3.21 | 0.024 |
| Sucrose | OD | 23.758 | 2.260 | 0.967 | 0.001 | 3.83 | 0.020 |
Table 11.
The influence of osmotic agents and pre-treatment time on water activity during OD.
Table 11.
The influence of osmotic agents and pre-treatment time on water activity during OD.
| Factor | p-Value | Contrast | +/– Limits | Difference |
|---|
| Type of osmotic substance | erythritol a | 0.000 * | erythritol–xylitol | 0.0067 | –0.0052 |
| xylitol ab | erythritol–sucrose | 0.0062 | –0.0050 |
| maltitol c | xylitol–maltitol | 0.0062 | –0.0246 * |
| DHA b | xylitol–sucrose | 0.0063 | 0.0002 |
| sucrose ab | DHA–erythritol | 0.0066 | 0.0083 * |
| Time (min) | 30 d | 0.000 * | 30–60 | 0.0071 | 0.0080 * |
| 60 bc | 60–90 | 0.0071 | –0.0035 |
| 90 cd | 90–120 | 0.0074 | 0.0123 * |
| 120 a | 120–150 | 0.0075 | –0.0037 |
| 150 ab | 120–180 | 0.0074 | –0.0009 |
| 180 a | 150–180 | 0.0074 | 0.0028 |
| Type of sonication | OD c | 0.000 * | OD–US | 0.0043 | 0.0682 * |
| OD+US a | OD–USi | 0.0042 | 0.0606 * |
| OD+USi b | US–USi | 0.0042 | –0.0075 * |
Table 12.
Values of the browning index (BI) parameter during OD in different solutions. OD: osmotic dehydration; US: continuous sonication; USi: interval sonication.
Table 12.
Values of the browning index (BI) parameter during OD in different solutions. OD: osmotic dehydration; US: continuous sonication; USi: interval sonication.
| Time (min) | Solution/Application | Sucrose | Erythritol | Xylitol | Maltitol | DHA |
|---|
| 0 | | 20.67 ± 2.12 |
| 30 | OD | 14.4 ± 1.3 | 16.6 ± 1.5 | 13.8 ± 0.2 | 14.3 ± 1.2 | 21.2 ± 4.5 |
| OD+US | 25.3 ± 0.4 | 25.0 ± 0.5 | 31.2 ± 2.6 | 28.2 ± 1.4 | 24.3 ± 0.0 |
| OD+USi | 27.6 ± 3.8 | 48.3 ± 0.9 | 39.6 ± 1.0 | 43.9 ± 3.0 | 30.0 ± 1.8 |
| 60 | OD | 17.6 ± 3.8 | 23.7 ± 0.7 | 24.6 ± 1.8 | 22.4 ± 3.0 | 22.0 ± 3.5 |
| OD+US | 23.9 ± 1.7 | 26.8 ± 0.4 | 29.7 ± 0.6 | 31.1 ± 4.7 | 33.3 ± 3.0 |
| OD+USi | 29.1 ± 1.6 | 48.2 ± 1.7 | 45.7 ± 0.0 | 41.8 ± 2.1 | 32.7 ± 1.7 |
| 90 | OD | 16.2 ± 3.1 | 22.1 ± 1.7 | 20.4 ± 4.2 | 20.9 ± 0.2 | 19.4 ± 2.9 |
| OD+US | 24.9 ± 1.5 | 30.7 ± 2.8 | 28.9 ± 0.8 | 30.2 ± 0.8 | 28.7 ± 0.7 |
| OD+USi | 29.5 ± 1.2 | 44.1 ± 0.5 | 29.1 ± 1.8 | 52.3 ± 5.7 | 36.6 ± 2.2 |
| 120 | OD | 16.9 ± 1.5 | 21.1 ± 1.2 | 19.4 ± 3.9 | 19.4 ± 2.6 | 23.1 ± 7.2 |
| OD+US | 23.1 ± 0.2 | 27.7 ± 0.1 | 36.9 ± 1.5 | 26.7 ± 1.4 | 31.7 ± 0.1 |
| OD+USi | 28.4 ± 0.0 | 45.5 ± 0.6 | 33.3 ± 1.6 | 46.8 ± 3.6 | 32.0 ± 1.0 |
| 150 | OD | 16.7 ± 2.8 | 19.7 ± 0.1 | 20.7 ± 4.8 | 21.5 ± 0.9 | 22.9 ± 2.0 |
| OD+US | 24.3 ± 2.3 | 28.8 ± 0.9 | 32.3 ± 1.2 | 25.7 ± 0.1 | 24.5 ± 0.2 |
| OD+USi | 28.4 ± 0.0 | 49.0 ± 5.3 | 30.7 ± 0.1 | 31.3 ± 0.4 | 43.3 ± 0.4 |
| 180 | OD | 15.0 ± 0.5 | 19.8 ± 1.7 | 19.8 ± 2.6 | 22.8 ± 1.5 | 22.4 ± 6.4 |
| OD+US | 19.8 ± 0.1 | 26.5 ± 2.4 | 28.4 ± 2.5 | 33.8 ± 0.2 | 26.7 ± 0.2 |
| OD+USi | 32.4 ± 1.5 | 48.0 ± 1.7 | 33.9 ± 0.3 | 33.5 ± 1.8 | 45.0 ± 1.0 |
Table 13.
The influence of osmotic agents and pre-treatment time on the BI parameter during OD.
Table 13.
The influence of osmotic agents and pre-treatment time on the BI parameter during OD.
| Factor | p-Value | Contrast | +/– Limits | Difference |
|---|
| Type of osmotic substance | erythritol c | 0.000 * | erythritol–xylitol | 3.0435 | 3.1333 * |
| xylitol b | erythritol–sucrose | 3.0435 | 8.4874 * |
| maltitol bc | xylitol–maltitol | 3.0435 | –1.6702 |
| DHA bc | xylitol–sucrose | 3.0435 | 5.3541 * |
| sucrose a | DHA–erythritol | 3.0435 | –2.9343 |
| Time (min) | 30 a | 0.130 | 30–60 | 3.4854 | –3.2889 |
| 60 a | 60–90 | 3.4854 | 1.3982 |
| 90 a | 90–120 | 3.4854 | –0.0402 |
| 120 a | 120–150 | 3.4854 | 0.9655 |
| 150 a | 120–180 | 3.4854 | –0.2985 |
| 180 a | 150–180 | 3.4854 | –1.2640 |
| Type of sonication | OD a | 0.000 * | OD–US | 2.0206 | –8.5294 * |
| OD+US b | OD–USi | 2.0206 | –18.3389 * |
| OD+USi c | US–USi | 2.0206 | –9.8096 * |
Table 14.
Values of absolute colour difference (∆E) during OD in different solutions. OD: osmotic dehydration; US: continuous sonication; USi: interval sonication.
Table 14.
Values of absolute colour difference (∆E) during OD in different solutions. OD: osmotic dehydration; US: continuous sonication; USi: interval sonication.
| Time (min) | Solution/Application | Sucrose | Erythritol | Xylitol | Maltitol | DHA |
|---|
| 30 | OD | 6.6 ± 1.1 | 5.7 ± 0.3 | 7.5 ± 0.3 | 7.0 ± 0.8 | 5.1 ± 1.3 |
| OD+US | 5.1 ± 0.3 | 4.4 ± 0.1 | 8.6 ± 0.6 | 6.1 ± 0.5 | 4.4 ± 0.2 |
| OD+USi | 5.9 ± 1.7 | 15.3 ± 0.1 | 12.5 ± 0.6 | 12.5 ± 1.0 | 6.4 ± 1.1 |
| 60 | OD | 6.2 ± 0.1 | 6.8 ± 0.7 | 7.4 ± 1.0 | 6.1 ± 0.8 | 5.9 ± 1.6 |
| OD+US | 5.1 ± 1.0 | 7.4 ± 0.6 | 9.0 ± 0.7 | 8.9 ± 1.8 | 8.6 ± 1.4 |
| OD+USi | 6.5 ± 0.9 | 16.2 ± 0.4 | 15.3 ± 0.2 | 15.3 ± 0.8 | 7.8 ± 0.9 |
| 90 | OD | 5.6 ± 0.6 | 7.2 ± 0.1 | 6.2 ± 0.7 | 5.5 ± 0.0 | 5.3 ± 2.4 |
| OD+US | 5.0 ± 0.3 | 7.8 ± 1.4 | 8.5 ± 0.4 | 8.8 ± 0.4 | 7.5 ± 0.5 |
| OD+USi | 7.0 ± 0.5 | 14.5 ± 0.0 | 7.9 ± 1.0 | 7.9 ± 1.8 | 10.4 ± 0.9 |
| 120 | OD | 5.2 ± 0.7 | 6.3 ± 0.7 | 6.7 ± 0.0 | 6.3 ± 0.8 | 6.2 ± 0.1 |
| OD+US | 4.2 ± 0.0 | 7.5 ± 0.1 | 11.7 ± 0.3 | 6.8 ± 0.8 | 8.5 ± 0.2 |
| OD+USi | 6.1 ± 0.6 | 15.9 ± 0.7 | 10.3 ± 0.8 | 10.3 ± 0.8 | 8.6 ± 0.2 |
| 150 | OD | 5.3 ± 0.4 | 6.3 ± 0.3 | 6.7 ± 0.5 | 4.8 ± 0.2 | 5.2 ± 0.1 |
| OD+US | 4.3 ± 1.2 | 8.7 ± 0.0 | 10.4 ± 0.7 | 7.2 ± 0.3 | 6.4 ± 0.2 |
| OD+USi | 6.7 ± 0.2 | 17.3 ± 1.3 | 9.0 ± 0.3 | 9.0 ± 0.0 | 14.5 ± 0.5 |
| 180 | OD | 5.7 ± 0.2 | 6.8 ± 0.4 | 6.1 ± 0.8 | 5.7 ± 0.4 | 5.9 ± 0.4 |
| OD+US | 5.4 ± 0.4 | 6.5 ± 0.9 | 9.0 ± 1.1 | 10.2 ± 0.3 | 6.8 ± 0.9 |
| OD+USi | 8.9 ± 0.5 | 15.8 ± 0.8 | 11.0 ± 0.0 | 11.0 ± 0.8 | 14.8 ± 0.4 |
Table 15.
The influence of osmotic agents and pre-treatment time on absolute colour difference during OD.
Table 15.
The influence of osmotic agents and pre-treatment time on absolute colour difference during OD.
| Factor | P-Value | Contrast | +/– Limits | Difference |
|---|
| Type of osmotic substance | erythritol c | 0.000 * | erythritol–xylitol | 1.4168 | 0.6972 |
| xylitol c | erythritol–sucrose | 1.4168 | 3.9778 * |
| maltitol bc | xylitol–maltitol | 1.4168 | 0.1278 |
| DHA b | xylitol–sucrose | 1.4168 | 3.2806 * |
| sucrose a | DHA–erythritol | 1.4168 | –2.1333 * |
| Time (min) | 30 a | 0.468 | 30–60 | 1.6225 | –1.0933 |
| 60 a | 60–90 | 1.6225 | 0.4500 |
| 90 a | 90–120 | 1.6225 | –0.0833 |
| 120 a | 120–150 | 1.6225 | 0.2033 |
| 150 a | 120–180 | 1.6225 | –0.2233 |
| 180 a | 150–180 | 1.6225 | -0.4267 |
| Type of sonication | OD a | 0.000 * | OD–US | 0.9406 | –1.1800 * |
| OD+US b | OD–USi | 0.9406 | –5.3083 * |
| OD+USi c | US–USi | 0.9406 | –4.1283 * |


