
Understanding the Effects of Lactose Hydrolysis Modeling on the Main Oligosaccharides in Goat Milk Whey Permeate

 , , , and
Abstract
:
1. Introduction
2. Results and Discussion
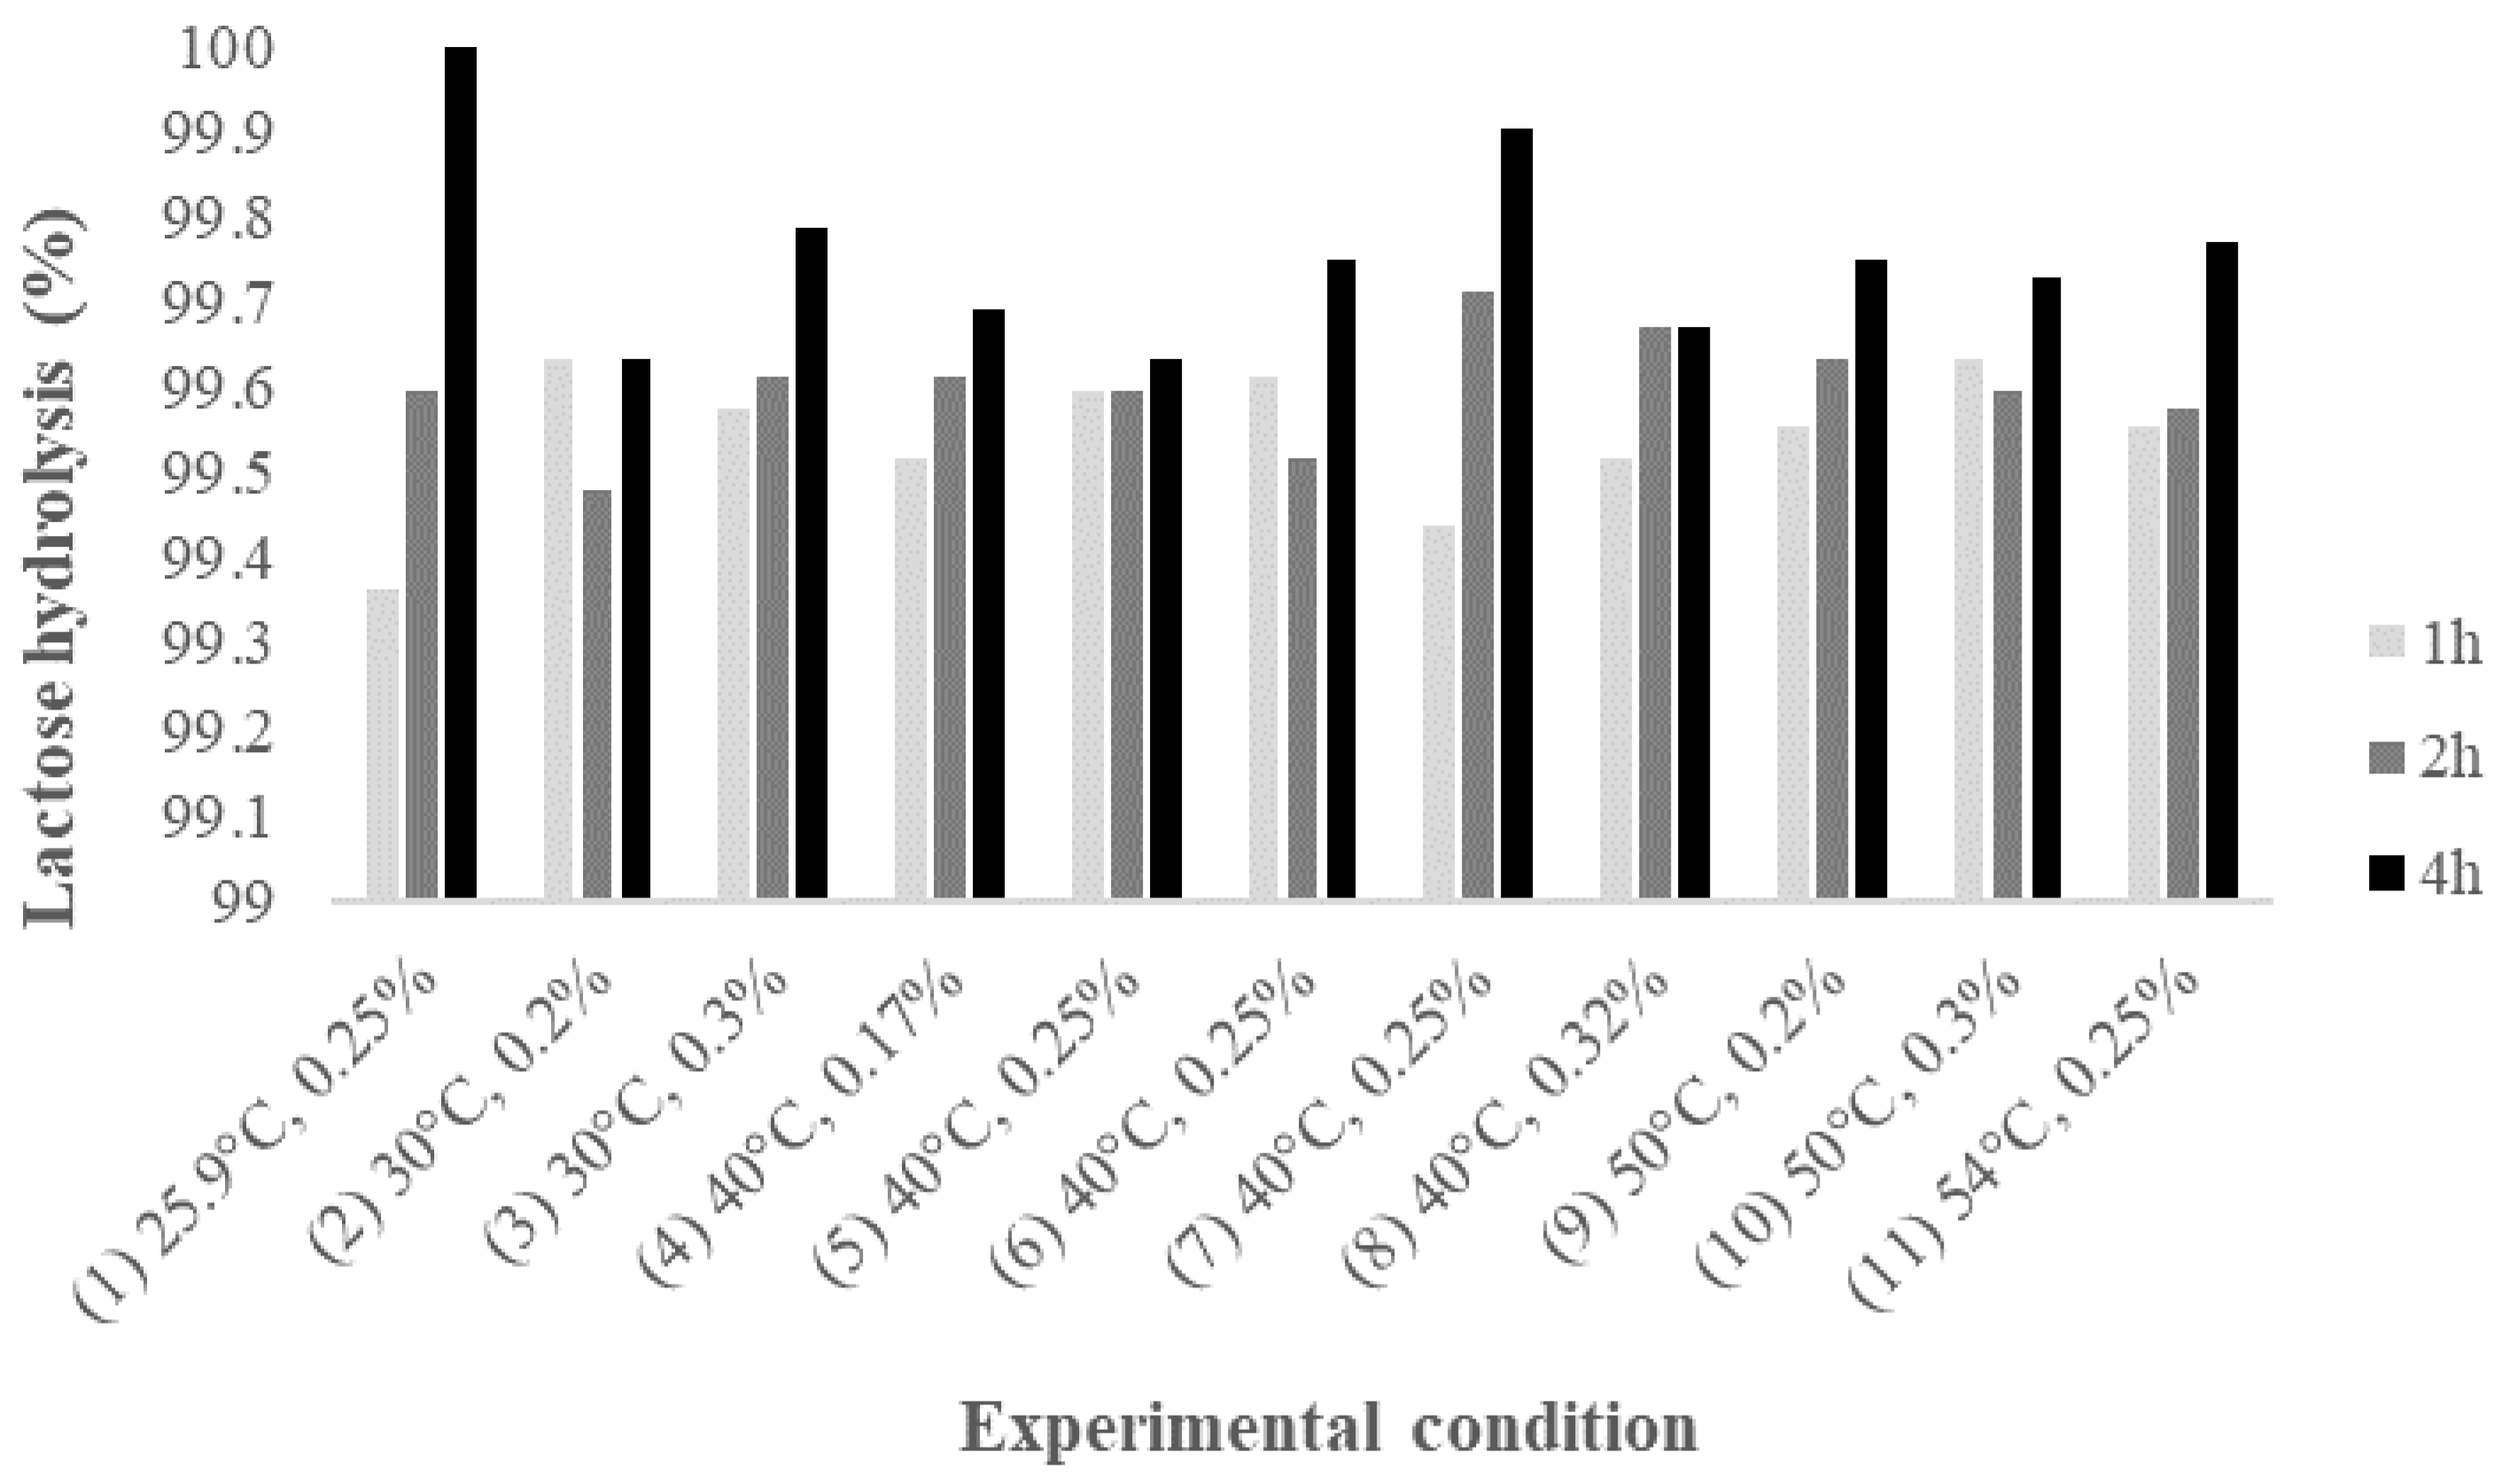
2.1. Lactose Hydrolysis Optimization by β-Galactosidase
2.2. Effect of β-Galactosidase on Caprine Milk Oligosaccharides
3. Materials and Methods
3.1. Goat Milk Source and Whey Production
3.2. β-Galactosidase Treatment of Goat Whey
3.3. Experimental Design and Statistical Analysis
3.4. Quantification of Lactose, Glucose, and Galactose in Goat Whey
3.5. Profile and Relative Quantification of Major Goat Whey Oligosaccharides
Supplementary Materials
Author Contributions
Funding
Acknowledgments
Conflicts of Interest
References
- Zivkovic, A.M.; German, J.B.; Lebrilla, C.B.; Mills, D.A. Human milk glycobiome and its impact on the infant gastrointestinal microbiota. Proc. Natl. Acad. Sci. USA 2011, 108, 4653–4658. [Google Scholar] [CrossRef] [PubMed]
- Newburg, D.S. Neonatal protection by an innate immune system of human milk consisting of oligosaccharides and glycans. J. Anim. Sci. 2009, 87, 26–34. [Google Scholar] [CrossRef] [PubMed]
- Newburg, D.S.; Ruiz-Palacios, G.M.; Morrow, A.L. Human milk glycans protect infants against enteric pathogens. Annu. Rev. Nutr. 2005, 25, 37–58. [Google Scholar] [CrossRef] [PubMed]
- Scholz-Ahrens, K.E.; Ade, P.; Marten, B.; Weber, P.; Timm, W.; Acil, Y.; Gluer, C.C.; Schrezenmeir, J. Prebiotics, probiotics, and synbiotics affect mineral absorption, bone mineral content, and bone structure. J. Nutr. 2007, 137, 838S–846S. [Google Scholar] [CrossRef] [PubMed]
- Laitinen, K.; Poussa, T.; Isolauri, E. Probiotics and dietary counselling contribute to glucose regulation during and after pregnancy: A randomised controlled trial. Br. J. Nutr. 2009, 101, 1679–1687. [Google Scholar] [CrossRef] [PubMed]
- Urashima, T.; Saito, T.; Nakamura, T.; Messer, M. Oligosaccharides of milk and colostrum in non-human mammals. Glycoconj. J. 2001, 18, 357–371. [Google Scholar] [CrossRef] [PubMed]
- Oliveira, D.L.; Wilbey, R.A.; Grandison, A.S.; Duarte, L.C.; Roseiro, L.B. Separation of Oligosaccharides from caprine milk whey, prior to prebiotic evaluation. Int. Dairy J. 2012, 24, 102–106. [Google Scholar] [CrossRef]
- Thum, C.; Cookson, A.; McNabb, W.; Roy, C.N.; Otter, D. Composition and enrichment of caprine milk oligosaccharides from New Zealand Saneen goat cheese whey. J. Food Compos. Anal. 2015, 42, 30–37. [Google Scholar] [CrossRef]
- De Moura Bell, J.M.; Cohen, J.L.; de Aquino, L.F.; Lee, H.; de Melo Silva, V.L.; Liu, Y.; Domizio, P.; Barile, D. An integrated bioprocess to recover bovine milk oligosaccharides from colostrum whey permeate. J. Food Eng. 2018, 216, 27–35. [Google Scholar] [CrossRef] [PubMed]
- Aquino, L.F.; de Moura Bell, J.M.; Cohen, J.L.; Liu, Y.; Lee, H.; de Melo Silva, V.L.; Domizio, P.; Junior, C.A.C.; Barile, D. Purification of caprine oligosaccharides at pilot-scale. J. Food Eng. 2017, 214, 226–235. [Google Scholar] [CrossRef] [PubMed]
- Sarney, D.B.; Hale, C.; Frankel, G.; Vulfson, E.N. A novel approach to the recovery of biologically active oligosaccharides from milk using a combination of enzymatic treatment and nanofiltration. Biotechnol. Bioeng. 2000, 69, 461–467. [Google Scholar] [CrossRef]
- De Moura Bell, J.M.; Aquino, L.F.; Liu, Y.; Cohen, J.L.; Lee, H.; de Melo Silva, V.L.; Rodrigues, M.I.; Barile, D. Modeling lactose hydrolysis for efficiency and selectivity: Toward the preservation of sialyloligosaccharides in bovine colostrum whey permeate. J. Dairy Sci. 2016, 99, 6157–6163. [Google Scholar] [CrossRef] [PubMed]
- Neri, D.F.; Balcão, V.M.; Costa, R.S.; Rocha, I.C.; Ferreira, E.M.; Torres, D.P.; Rodrigues, L.R.; Carvalho, L.B., Jr.; Teixeira, J.A. Galacto-oligosaccharides production during lactose hydrolysis by free Aspergillus oryzae β-galactosidase and immobilized on magnetic polysiloxane-polyvinyl alcohol. Food Chem. 2009, 115, 92–99. [Google Scholar] [CrossRef]
- Vera, C.; Guerrero, C.; Illanes, A. Determination of the transgalactosylation activity of Aspergillus oryzae β-galactosidase: Effect of pH, temperature, and galactose and glucose concentrations. Carbohydr. Res. 2011, 346, 745–752. [Google Scholar] [CrossRef] [PubMed]
- Rodriguez-Colinas, B.; Fernandez-Arrojo, L.; Ballesteros, A.O.; Plou, F.J. Galactooligosaccharides formation during enzymatic hydrolysis of lactose: Towards a prebiotic-enriched milk. Food Chem. 2014, 145, 388–394. [Google Scholar] [CrossRef] [PubMed] [Green Version]
- Vera, C.; Guerrero, C.; Conejeros, R.; Illanes, A. Synthesis of galacto-oligosaccharides by β-galactosidase from Aspergillus oryzae using partially dissolved and supersaturated solution of lactose. Enzyme Microb. Technol. 2012, 50, 188–194. [Google Scholar] [CrossRef] [PubMed]
- Ansari, S.A.; Satar, R.; Kashif Zaidi, S.; Ahmad, A. Immobilization of Aspergillus oryzae β-galactosidase on cellulose acetate-polymethylmethacrylate membrane and its application in hydrolysis of lactose from milk and whey. Int. Sch. Res. Notices 2014, 2014, 163987. [Google Scholar] [PubMed]
- Sela, D.A.; Li, Y.; Lerno, L.; Wu, S.; Marcobal, A.M.; German, J.B.; Chen, X.; Lebrilla, C.B.; Mills, D.A. An infant-associated bacterial commensal utilizes breast milk sialyloligosaccharides. J. Biol. Chem. 2011, 286, 11909–11918. [Google Scholar] [CrossRef] [PubMed]
- Hatzinikolaou, D.G.; Katsifas, E.; Mamma, D.; Karagouni, A.D.; Christakopoulos, P.; Kekos, D. Modeling of the simultaneous hydrolysis–ultrafiltration of whey permeate by a thermostable β-galactosidase from Aspergillus niger. Biochem. Eng. J. 2005, 24, 161–172. [Google Scholar] [CrossRef]
- Rodrigues, M.I.; Iemma, A.F. Experimental Design and Process Optimization; CRC Press: Boca Raton, FL, USA, 2014. [Google Scholar]
- Dallas, D.C.; Weinborn, V.; de Moura Bell, J.M.; Wang, M.; Parker, E.A.; Guerrero, A.; Hettinga, K.A.; Lebrilla, C.B.; German, J.B.; Barile, D. Comprehensive peptidomic and glycomic evaluation reveals that sweet whey permeate from colostrum is a source of milk protein-derived peptides and oligosaccharides. Food Res. Int. 2014, 63, 203–209. [Google Scholar] [CrossRef] [PubMed] [Green Version]
Sample Availability: Not available. |


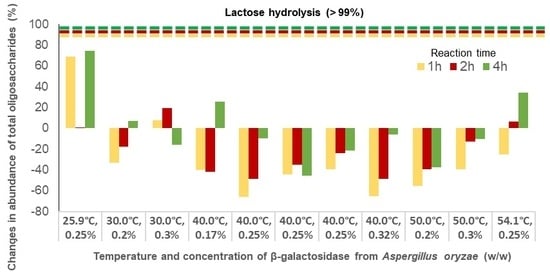
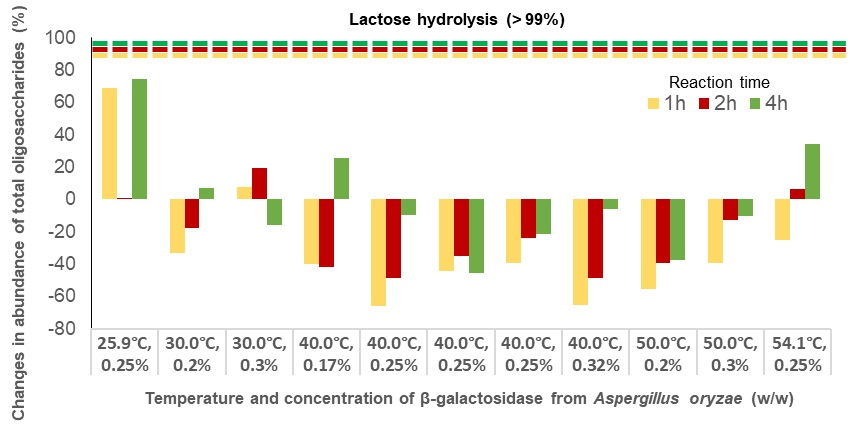
| Experimental Conditions | Neutral (%) | Acidic (%) | Total (%) | ||||||
|---|---|---|---|---|---|---|---|---|---|
| 1 h | 2 h | 4 h | 1 h | 2 h | 4 h | 1 h | 2 h | 4 h | |
| (1) 25.9 °C, 0.25% | 92 | −45 | −5 | 40 | 57 | 173 | 69 | 1 | 75 |
| (2) 30.0 °C, 0.2% | −49 | −39 | −60 | −13 | 8 | 91 | −33 | −18 | 7 |
| (3) 30.0 °C, 0.3% | −14 | −27 | −83 | 34 | 77 | 68 | 8 | 19 | −16 |
| (4) 40.0 °C, 0.17% | −72 | −92 | −87 | −1 | 21 | 166 | −40 | −42 | 26 |
| (5) 40.0 °C, 0.25% | −92 | −93 | −88 | −34 | 7 | 87 | −66 | −48 | −10 |
| (6) 40.0 °C, 0.25% | −81 | −89 | −93 | 2 | 31 | 13 | −44 | −35 | −46 |
| (7) 40.0 °C, 0.25% | −78 | −89 | −99 | 8 | 57 | 75 | −39 | −24 | −21 |
| (8) 40.0 °C, 0.32% | −95 | −94 | −92 | −28 | 8 | 101 | −65 | −48 | −6 |
| (9) 50.0 °C, 0.2% | −92 | −99 | −95 | −11 | 35 | 34 | −56 | −39 | −38 |
| (10) 50.0 °C, 0.3% | −93 | −94 | −86 | 27 | 88 | 84 | −39 | −13 | −10 |
| (11) 54.1 °C, 0.25% | −92 | −91 | −90 | 58 | 127 | 189 | −25 | 6 | 34 |
| Experimental Conditions | 2 Hex 1 NeuAc (634.2189) | 2 Hex 1 NeuGc (650.2139) | 1 Hex 1 HexNAc 1 NeuAc (675.2455) | 3 Hex 1 NeuAc (796.2718) | 2 Hex 1 HexNAc 1 NeuAc (837.2983) | 3 Hex 1 NeuGc (812.2667) | ||||||||||||
|---|---|---|---|---|---|---|---|---|---|---|---|---|---|---|---|---|---|---|
| 1 h | 2 h | 4 h | 1 h | 2 h | 4 h | 1 h | 2 h | 4 h | 1 h | 2 h | 4 h | 1 h | 2 h | 4 h | 1 h | 2 h | 4 h | |
| (1) 25.9 °C, 0.25% | 43 | 96 | 213 | 58 | 101 | 202 | −16 | −100 | 53 | 54 | −100 | −100 | 65 | −100 | 105 | −100 | −100 | −100 |
| (2) 30.0 °C, 0.2% | 1 | 29 | 118 | 6 | 32 | 126 | −100 | −100 | 29 | −100 | −100 | −100 | −33 | −4 | −100 | 33 | −100 | −100 |
| (3) 30.0 °C, 0.3% | 58 | 116 | 95 | 60 | 109 | 97 | −100 | −100 | −10 | −100 | −100 | −100 | 32 | 67 | −100 | 3 | −100 | 47 |
| (4) 40.0 °C, 0.17% | 26 | 50 | 220 | 21 | 39 | 213 | −100 | −100 | 19 | −100 | −100 | −100 | −100 | −2 | −100 | −37 | −100 | −100 |
| (5) 40.0 °C, 0.25% | −17 | 35 | 122 | −16 | 31 | 120 | −100 | −100 | −3 | −100 | −100 | −100 | −100 | −100 | −100 | −100 | −35 | −100 |
| (6) 40.0 °C, 0.25% | 26 | 52 | 38 | 27 | 58 | 50 | −100 | −25 | −100 | −100 | −100 | −100 | −100 | −100 | −100 | 12 | −100 | −100 |
| (7) 40.0 °C, 0.25% | 22 | 82 | 102 | 23 | 81 | 109 | −33 | 13 | 0 | −100 | −100 | −100 | −26 | −100 | −100 | −100 | −100 | −23 |
| (8) 40.0 °C, 0.32% | −20 | 38 | 141 | −21 | 32 | 131 | −28 | −100 | 3 | −100 | −100 | −100 | −100 | −100 | −100 | −100 | −35 | −100 |
| (9) 50.0 °C, 0.2% | 13 | 67 | 68 | 10 | 58 | 68 | −100 | −100 | −100 | −100 | −100 | −100 | −100 | 8 | −100 | −100 | −100 | −100 |
| (10) 50.0 °C, 0.3% | 64 | 141 | 121 | 53 | 131 | 118 | −100 | −100 | −15 | −100 | −100 | −100 | −100 | −100 | −100 | −100 | −100 | −100 |
| (11) 54.1 °C, 0.25% | 87 | 202 | 274 | 71 | 160 | 249 | −25 | −100 | −100 | −100 | −100 | −100 | 12 | −100 | −100 | −100 | −100 | −100 |
| Experimental Conditions | 3 Hex (505.1764) | 2 Hex 1 HexNAc (546.2029) | 3 Hex 1 HexNAc (708.2558) | 2 Hex 2 HexNAc (749.2823) | ||||||||
|---|---|---|---|---|---|---|---|---|---|---|---|---|
| 1 h | 2 h | 4 h | 1 h | 2 h | 4 h | 1 h | 2 h | 4 h | 1 h | 2 h | 4 h | |
| (1) 25.9 °C, 0.25% | 43 | −17 | −31 | −83 | −100 | −100 | 209 | −50 | 34 | −10 | −1 | 81 |
| (2) 30.0 °C, 0.2% | −36 | −44 | −51 | −100 | −100 | −100 | −42 | −10 | −70 | −59 | −33 | 34 |
| (3) 30.0 °C, 0.3% | −31 | −45 | −88 | −100 | −100 | −100 | 30 | 6 | −100 | −11 | −1 | 71 |
| (4) 40.0 °C, 0.17% | −59 | −88 | −100 | −100 | −100 | −100 | −69 | −100 | −100 | −62 | −44 | 40 |
| (5) 40.0 °C, 0.25% | −81 | −94 | −100 | −100 | −100 | −90 | −100 | −100 | −100 | −49 | −40 | −2 |
| (6) 40.0 °C, 0.25% | −79 | −91 | −100 | −100 | −100 | −100 | −83 | −100 | −100 | −43 | −3 | −35 |
| (7) 40.0 °C, 0.25% | −80 | −91 | −100 | −100 | −100 | −100 | −68 | −100 | −100 | −47 | −5 | −100 |
| (8) 40.0 °C, 0.32% | −93 | −100 | −100 | −100 | −100 | −92 | −100 | −100 | −90 | −63 | −40 | −100 |
| (9) 50.0 °C, 0.2% | −86 | −100 | −100 | −100 | −100 | −100 | −100 | −100 | −90 | −44 | −100 | −100 |
| (10) 50.0 °C, 0.3% | −95 | −100 | −100 | −100 | −100 | −81 | −100 | −90 | −85 | −38 | −100 | −100 |
| (11) 54.1 °C, 0.25% | −94 | −100 | −100 | −100 | −100 | −100 | −100 | −100 | −82 | −34 | −5 | −100 |
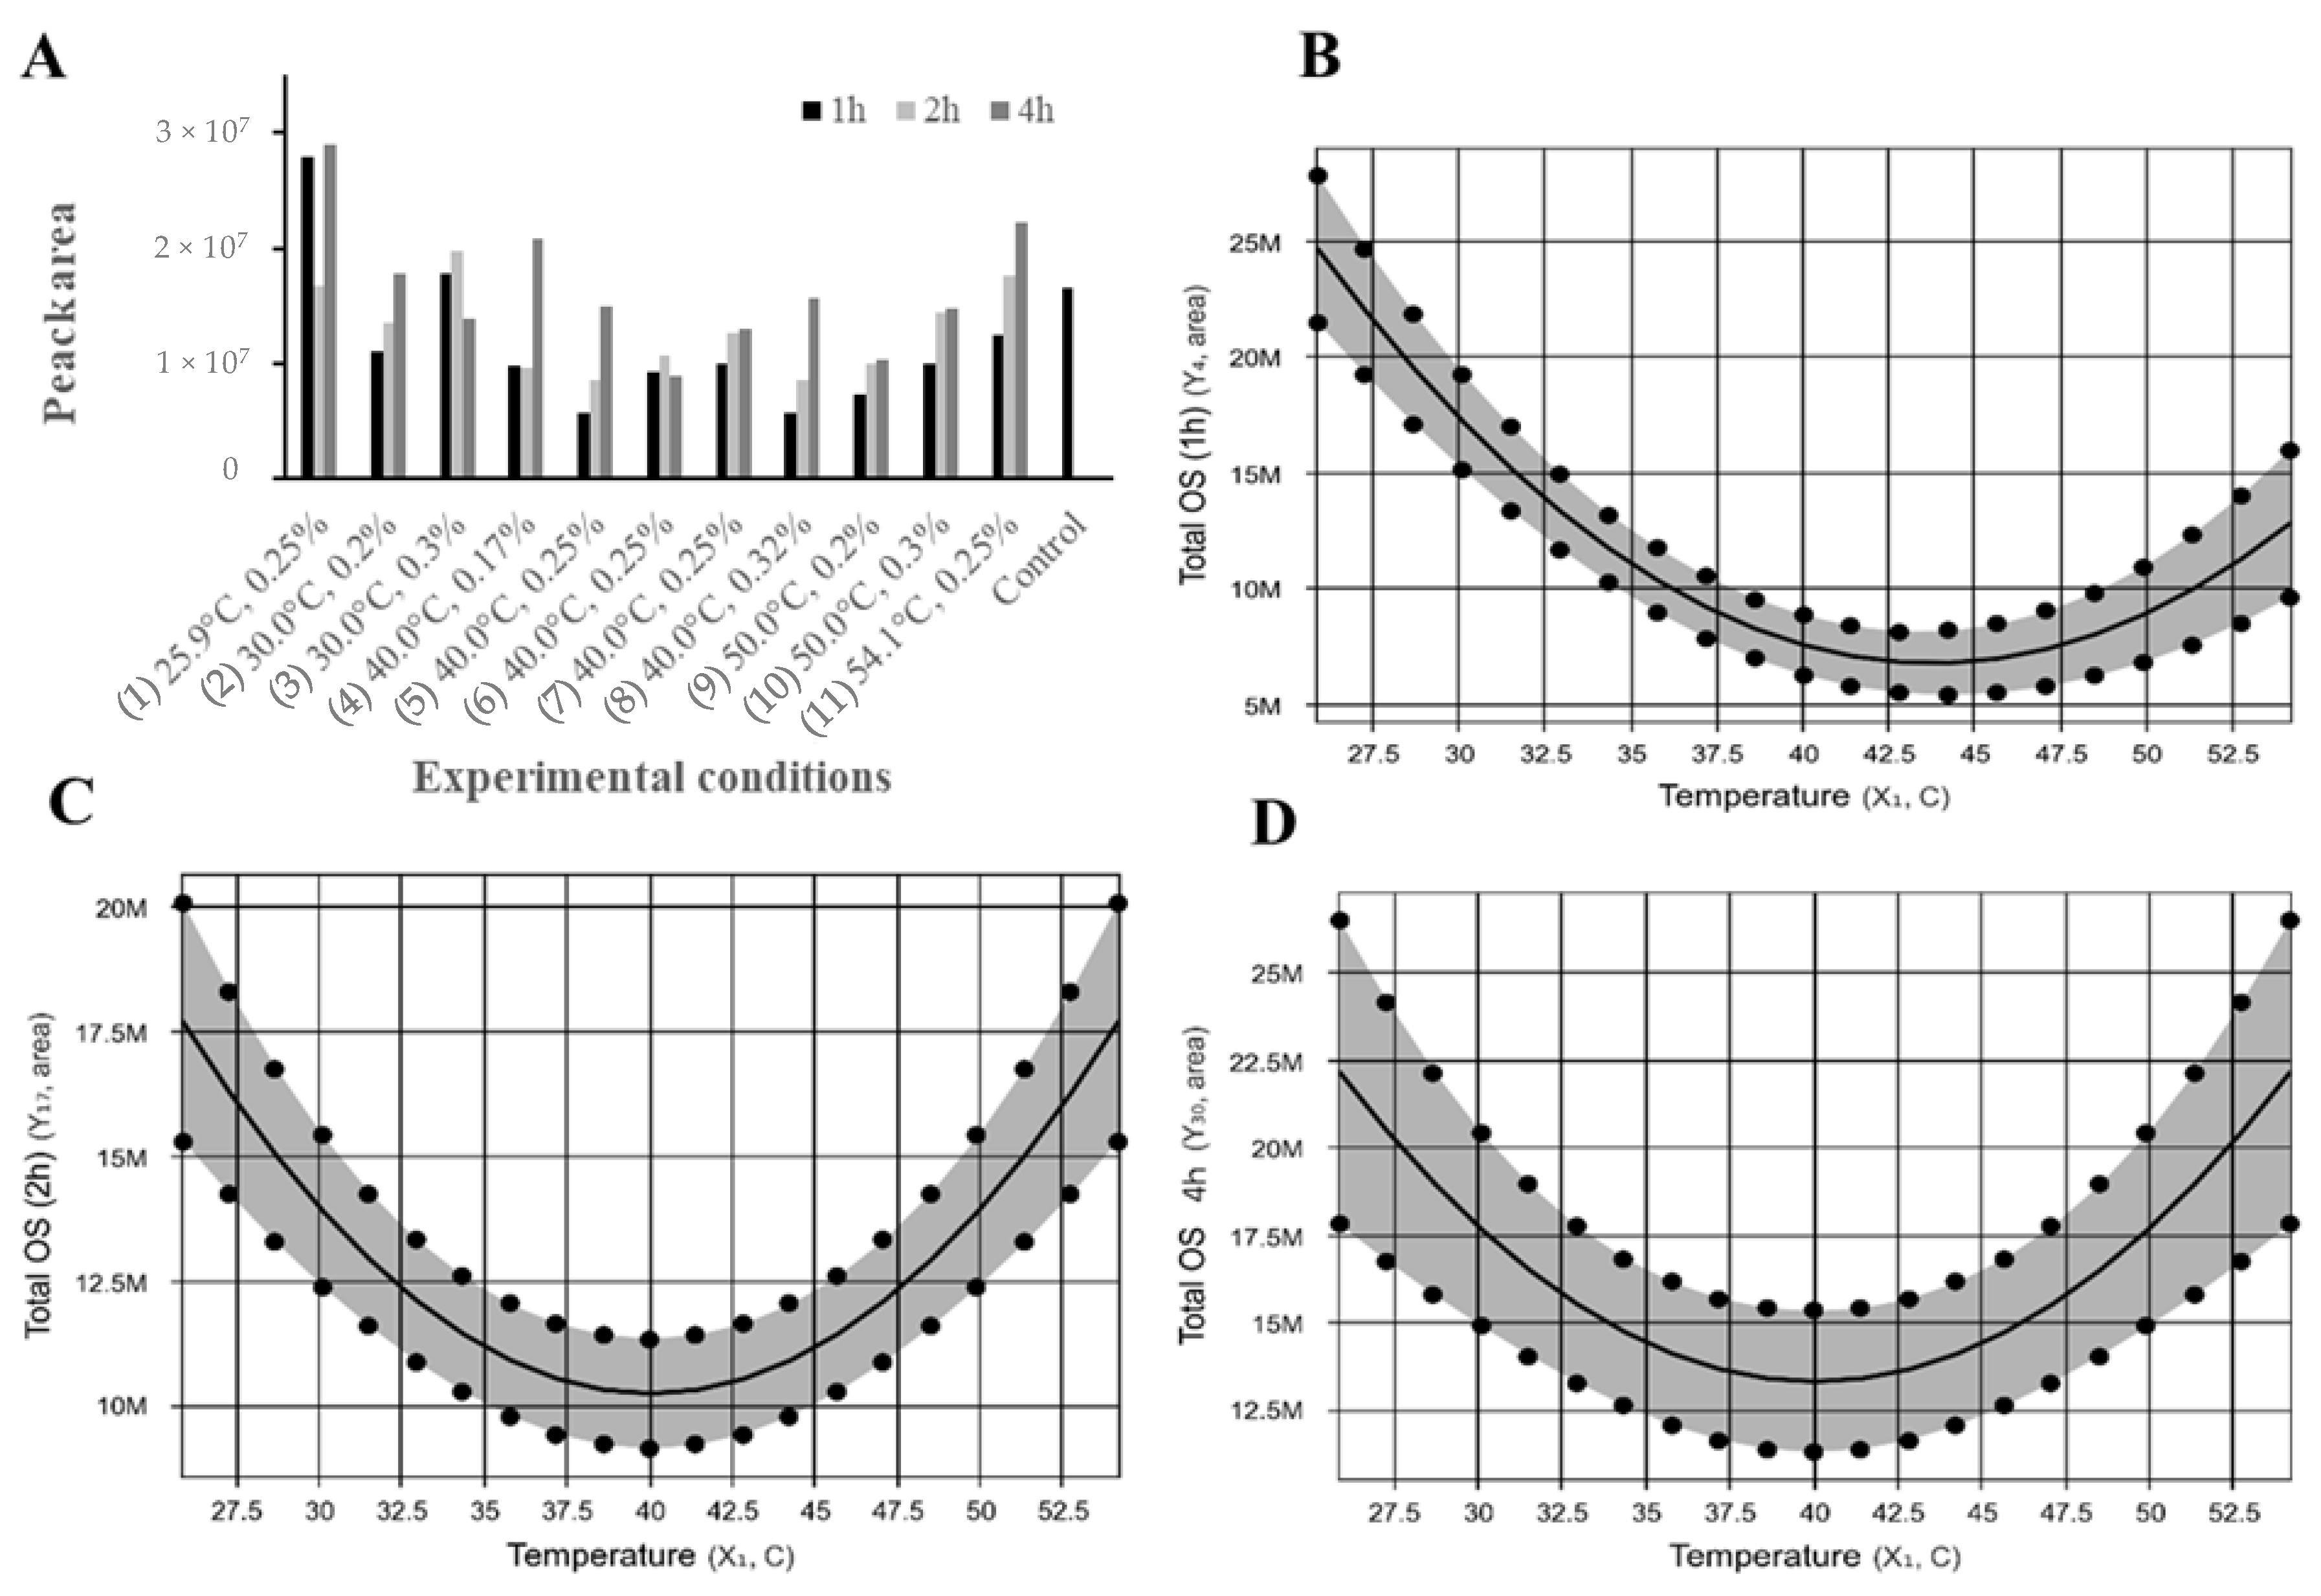
| Oligosaccharides | Reaction Time (h) | Estimated Regression Model (X1 and X2)* | R2 | Fcal | Ftab |
|---|---|---|---|---|---|
| Total OS | 1 | Y = 7507678.98 − 4194600.74X1 + 5592810.56X1² | 82 | 17.8 | 4.46 |
| 2 | Y = 10222162.09 + 3729337.17X1² | 58 | 12.4 | 5.12 | |
| 4 | Y = 13284143.04 + 4422143.16X1² | 37 | 5.2 | 5.12 | |
| 3 Hex (505.1764) | 1 | Y = 389925.19 − 782063.92X1 + 502451.91X1² | 91 | 38.3 | 4.46 |
| 2 | Y = 162313 − 580744.02X1 + 361604.84 X1² | 99 | 293.3 | 4.46 | |
| 4 | Y = −9339.04 − 405112.37X1 + 345042.31X1² | 85 | 22.8 | 4.46 | |
| 2 Hex 1 HexNAc (546.2029) | 1 | Y = −26531.65 − 79733.01X1 + 92860.76X1² | 56 | 5.12 | 4.46 |
| 4 | Y = 90116 + 103487.67X₂ + 129100.25X1X₂ | 52 | 4.4 | 3.11+ | |
| 2 Hex 1 NeuAc (634.2189) | 1 | Y = 3953983.94 + 1058216.71X1² | 45 | 7.4 | 5.12 |
| 2 | Y = 5495767.29 + 978961.02X1 + 1727382.22X1² | 68 | 8.5 | 4.46 | |
| 2 Hex 1 NeuGc (650.2139) | 1 | Y = 2291139.71 + 614660.53X1² | 52 | 9.6 | 5.12 |
| 2 | Y = 3167139 + 866256.25X1²; | 50 | 8.9 | 5.12 | |
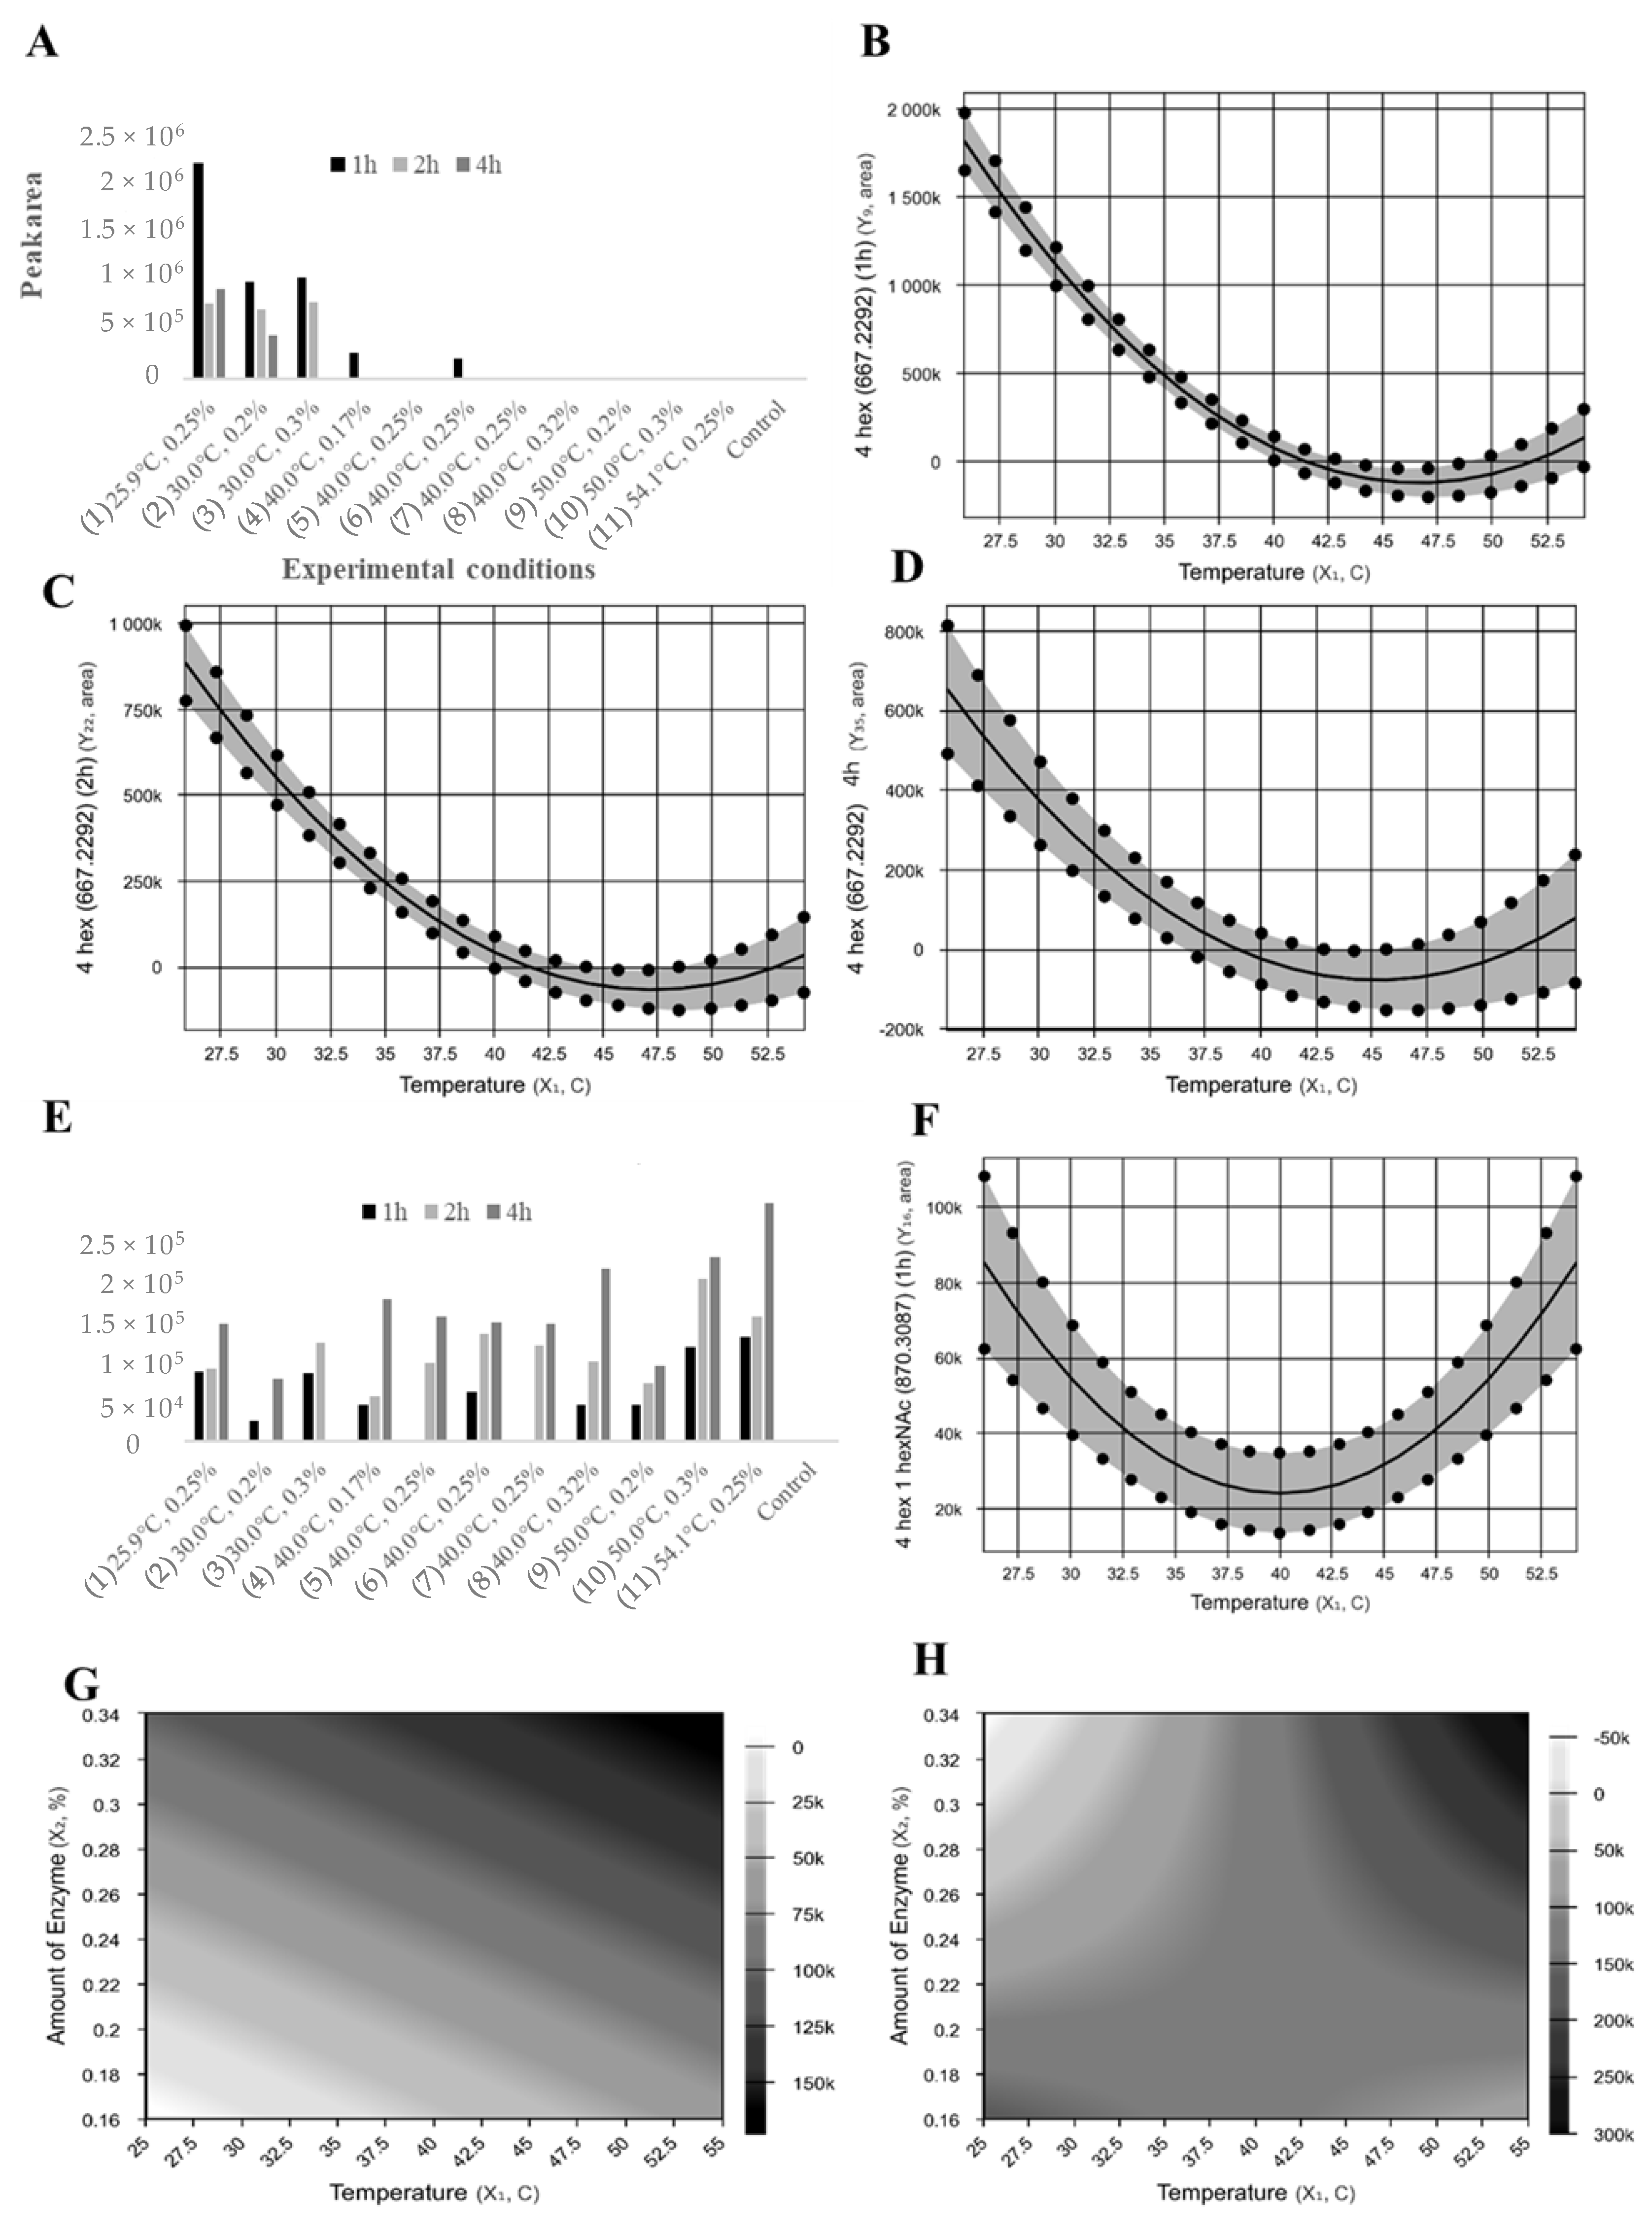
| 4 Hex (667.2292) | 1 | Y = 69029.23 − 594727.41X1 + 449716.12X1² | 95 | 81.5 | 4.46 |
| 2 | Y = 40340.74 − 300599.11X1 + 208263.86X1² | 92 | 43.7 | 4.46 | |
| 4 | Y = −26116.87 − 203058.25X1 + 194607.65X1² | 74 | 11.6 | 4.46 | |
| 1 Hex 1 HexNAc 1 NeuAc (675.2455) | 2 | Y = 553569.46 − 276784.73X1² − 276784.73X₂² | 56 | 5.2 | 4.46 |
| 4 | Y = 702795.01 − 384992.53X1; | 51 | 9.4 | 5.12 | |
| 3 Hex 1 HexNAc (708.2558) | 1 | Y = 261151.22 − 2900998.59X1 + 2320426.11X1² | 83 | 19.6 | 4.46 |
| 2 | Y = 863638.95 − 1191641.43X1 | 52 | 9.6 | 5.12 | |
| 4 | Y = −148493.60 − 787036.48X1 + 1216793.56X1² | 66 | 7.8 | 4.46 | |
| 2 Hex 2 HexNAc (749.2823) | 1 | Y = 357971.42 + 117458.93X1² | 44 | 7.2 | 5.12 |
| 4 | Y = 546409.06 − 534343.98X1 | 70 | 20.3 | 5.12 | |
| 3 Hex 1 NeuAc (796.2718) | 1 | Y = −17284.95 − 51944.80X1 + 60497.33X1² | 56 | 5.2 | 4.46 |
| 2 Hex 1 HexNAc 1 NeuAc (837.2983) | 1 | Y = 30908.84 − 125782.48X1 + 210815.71X1² | 74 | 11.7 | 4.46 |
| 4 | Y = −44484.83 − 133685.98X1 + 155696.90X1² | 56 | 5.2 | 4.46 | |
| 4 Hex 1 HexNAc (870.3087) | 1 | Y = 23873.33 + 30604X1² | 50 | 9.1 | 5.12 |
| 2 | Y = 82307.54 + 23892.27X1 + 30933.57X₂ | 70 | 9.3 | 4.46 | |
| 4 | Y = 120775.07 + 45106.01X1 + 41941.77X1X₂ | 60 | 5.9 | 4.46 |
© 2019 by the authors. Licensee MDPI, Basel, Switzerland. This article is an open access article distributed under the terms and conditions of the Creative Commons Attribution (CC BY) license (http://creativecommons.org/licenses/by/4.0/).
Share and Cite
Thum, C.; Weinborn, V.; Barile, D.; C McNabb, W.; C Roy, N.; Maria Leite Nobrega de Moura Bell, J. Understanding the Effects of Lactose Hydrolysis Modeling on the Main Oligosaccharides in Goat Milk Whey Permeate. Molecules 2019, 24, 3294. https://doi.org/10.3390/molecules24183294
Thum C, Weinborn V, Barile D, C McNabb W, C Roy N, Maria Leite Nobrega de Moura Bell J. Understanding the Effects of Lactose Hydrolysis Modeling on the Main Oligosaccharides in Goat Milk Whey Permeate. Molecules. 2019; 24(18):3294. https://doi.org/10.3390/molecules24183294
Chicago/Turabian StyleThum, Caroline, Valerie Weinborn, Daniela Barile, Warren C McNabb, Nicole C Roy, and Juliana Maria Leite Nobrega de Moura Bell. 2019. "Understanding the Effects of Lactose Hydrolysis Modeling on the Main Oligosaccharides in Goat Milk Whey Permeate" Molecules 24, no. 18: 3294. https://doi.org/10.3390/molecules24183294