
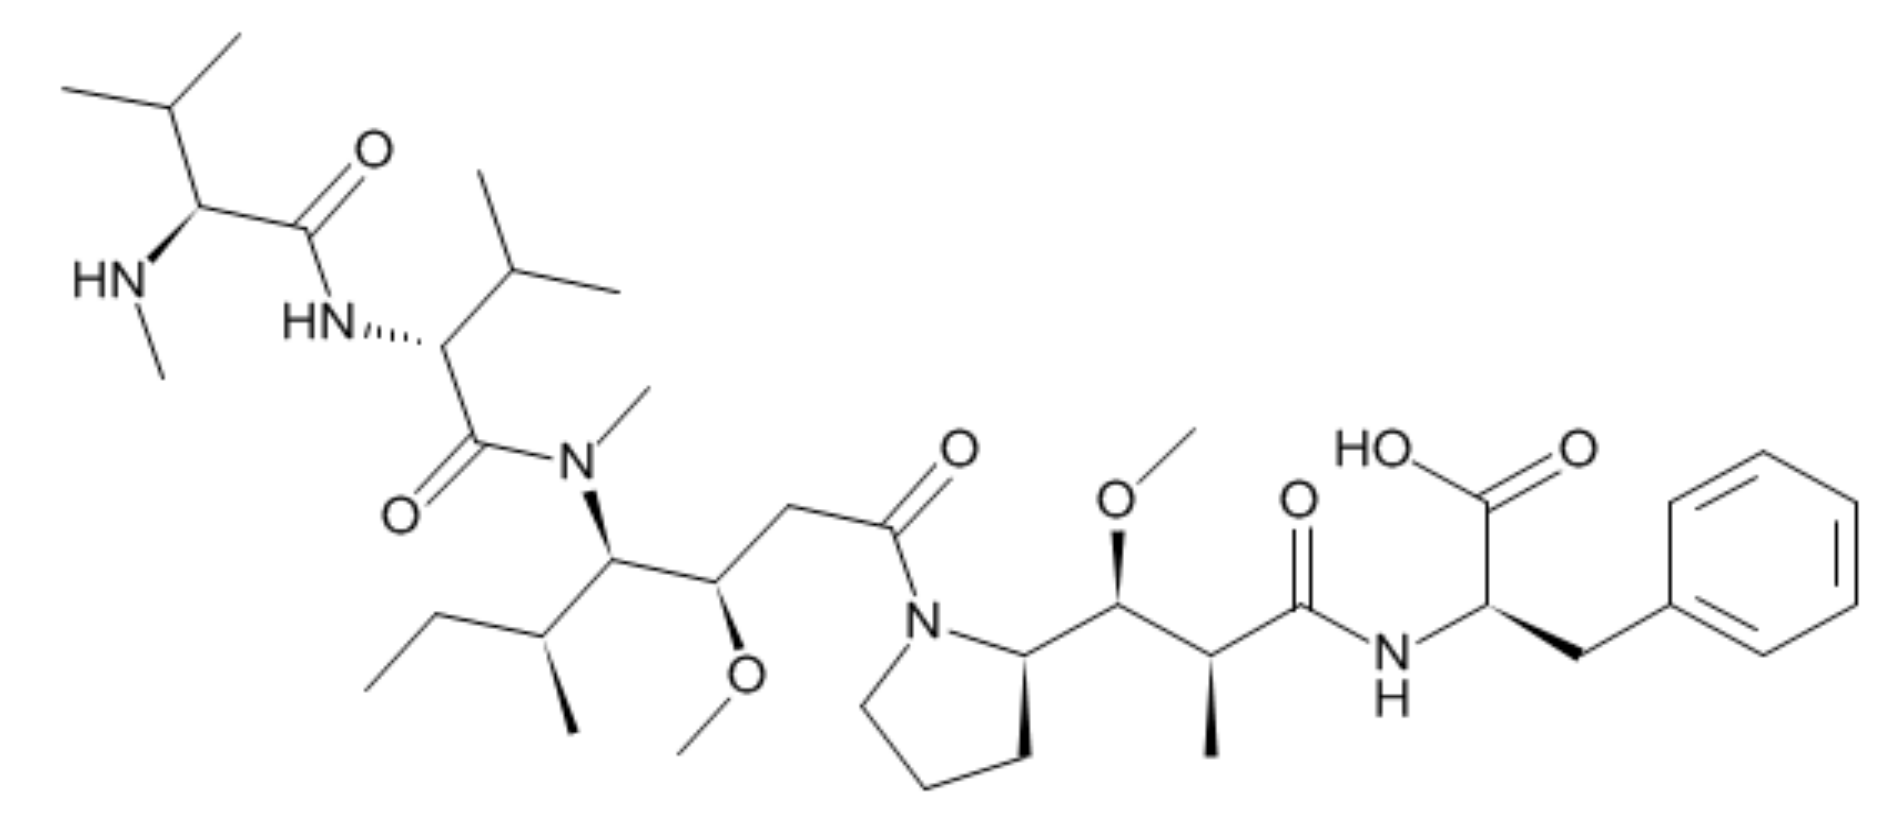
Pharmacokinetic and Metabolism Studies of Monomethyl Auristatin F via Liquid Chromatography-Quadrupole-Time-of-Flight Mass Spectrometry


Abstract
1. Introduction
2. Materials and Methods
2.1. Materials
2.2. Preparation of Stock Solution, Calibration Standard (STD), and Quality Control (QC) Samples
2.3. Sample Preparation (Plasma Sample)
2.4. LC-TOF-MS/MS Conditions
2.5. Method Qualification
2.6. Software
2.7. Application for a Pharmacokinetic Study in Rat
2.8. Sample Preparation—In Vitro/In Vivo Metabolite Identification (Met ID)
3. Results and Discussion
3.1. Method Development and Qualification
3.1.1. Sample Preparation and Optimization of LC-TOF-MS/MS Parameters
3.1.2. Method Qualification
3.2. Application for Pharmacokinetic Study
3.3. In Vitro and In Vivo Metabolite Profiling for MMAF
4. Conclusions
Author Contributions
Funding
Conflicts of Interest
References
- Zolot, R.S.; Basu, S.; Million, R.P. Antibody-drug conjugates. Nat. Rev. Drug. Discov. 2013, 12, 259–260. [Google Scholar] [CrossRef] [PubMed]
- Beck, A.; Reichert, J.M. Antibody-drug conjugates: Present and future. MAbs 2014, 6, 15–17. [Google Scholar] [CrossRef] [PubMed]
- Martin, C.; Kizlik-Masson, C.; Pelegrin, A.; Watier, H.; Viaud-Massuard, M.C.; Joubert, N. Antibody-drug conjugates: Design and development for therapy and imaging in and beyond cancer, LabEx MAbImprove industrial workshop, July 27-28, 2017, Tours, France. MAbs 2017, 1–12. [Google Scholar] [CrossRef] [PubMed]
- Casi, G.; Neri, D. Antibody-drug conjugates: Basic concepts, examples and future perspectives. J. Control Rel. 2012, 161, 422–428. [Google Scholar] [CrossRef] [PubMed]
- Lewis Phillips, G.D.; Li, G.; Dugger, D.L.; Crocker, L.M.; Parsons, K.L.; Mai, E.; Blattler, W.A.; Lambert, J.M.; Chari, R.V.; Lutz, R.J.; et al. Targeting HER2-positive breast cancer with trastuzumab-DM1, an antibody-cytotoxic drug conjugate. Cancer Res. 2008, 68, 9280–9290. [Google Scholar] [CrossRef] [PubMed]
- DiJoseph, J.F.; Goad, M.E.; Dougher, M.M.; Boghaert, E.R.; Kunz, A.; Hamann, P.R.; Damle, N.K. Potent and specific antitumor efficacy of CMC-544, a CD22-targeted immunoconjugate of calicheamicin, against systemically disseminated B-cell lymphoma. Clin. Cancer Res. 2004, 10, 8620–8629. [Google Scholar] [CrossRef] [PubMed]
- Wahl, A.F.; Klussman, K.; Thompson, J.D.; Chen, J.H.; Francisco, L.V.; Risdon, G.; Chace, D.F.; Siegall, C.B.; Francisco, J.A. The anti-CD30 monoclonal antibody SGN-30 promotes growth arrest and DNA fragmentation in vitro and affects antitumor activity in models of Hodgkin’s disease. Cancer Res. 2002, 62, 3736–3742. [Google Scholar]
- Ojima, I.; Geng, X.D.; Wu, X.Y.; Qu, C.X.; Borella, C.P.; Xie, H.S.; Wilhelm, S.D.; Leece, B.A.; Bartle, L.M.; Goldmacher, V.S.; et al. Tumor-specific novel taxoid-monoclonal antibody conjugates. J. Med. Chem. 2002, 45, 5620–5623. [Google Scholar] [CrossRef]
- Bai, R.L.; Pettit, G.R.; Hamel, E. Structure-activity studies with chiral isomers and with segments of the antimitotic marine peptide dolastatin 10. Biochem. Pharmacol. 1990, 40, 1859–1864. [Google Scholar] [CrossRef]
- Brase, S.; Glaser, F.; Kramer, C.S.; Lindner, S.; Linsenmeier, A.M.; Masters, K.S.; Meister, A.C.; Ruff, B.M.; Zhong, S. Progress in the chemistry of organic natural products. The chemistry of mycotoxins. Prog. Chem. Org. Nat. Prod. 2013, 97, 1–300. [Google Scholar]
- Dosio, F.; Brusa, P.; Cattel, L. Immunotoxins and anticancer drug conjugate assemblies: the role of the linkage between components. Toxins 2011, 3, 848–883. [Google Scholar] [CrossRef]
- Fennell, B.J.; Carolan, S.; Pettit, G.R.; Bell, A. Effects of the antimitotic natural product dolastatin 10, and related peptides, on the human malarial parasite Plasmodium falciparum. J. Antimicrob. Chemother. 2003, 51, 833–841. [Google Scholar] [CrossRef]
- Pettit, R.K.; Pettit, G.R.; Hazen, K.C. Specific activities of dolastatin 10 and peptide derivatives against Cryptococcus neoformans. Antimicrob. Agents Chemother. 1998, 42, 2961–2965. [Google Scholar] [CrossRef]
- Doronina, S.O.; Toki, B.E.; Torgov, M.Y.; Mendelsohn, B.A.; Cerveny, C.G.; Chace, D.F.; DeBlanc, R.L.; Gearing, R.P.; Bovee, T.D.; Siegall, C.B.; et al. Development of potent monoclonal antibody auristatin conjugates for cancer therapy. Nat. Biotechnol. 2003, 21, 778–784. [Google Scholar] [CrossRef]
- Li, F.; Emmerton, K.K.; Jonas, M.; Zhang, X.Q.; Miyamoto, J.B.; Setter, J.R.; Nicholas, N.D.; Okeley, N.M.; Lyon, R.P.; Benjamin, D.R.; et al. Intracellular Released Payload Influences Potency and Bystander-Killing Effects of Antibody-Drug Conjugates in Preclinical Models. Cancer Res. 2016, 76, 2710–2719. [Google Scholar] [CrossRef]
- Wang, Y.J.; Li, Y.Y.; Liu, X.Y.; Lu, X.L.; Cao, X.; Jiao, B.H. Marine Antibody-Drug Conjugates: Design Strategies and Research Progress. Mar Drugs 2017, 15. [Google Scholar] [CrossRef]
- Doronina, S.O.; Mendelsohn, B.A.; Bovee, T.D.; Cerveny, C.G.; Alley, S.C.; Meyer, D.L.; Oflazoglu, E.; Toki, B.E.; Sanderson, R.J.; Zabinski, R.F.; et al. Enhanced activity of monomethylauristatin F through monoclonal antibody delivery: Effects of linker technology on efficacy and toxicity. Bioconjugate Chem. 2006, 17, 114–124. [Google Scholar] [CrossRef]
- Sedlik, C.; Heitzmann, A.; Viel, S.; Sarkouh, R.A.; Batisse, C.; Schmidt, F.; De la Rochere, P.; Amzallag, N.; Osinaga, E.; Oppezzo, P.; et al. Effective antitumor therapy based on a novel antibody-drug conjugate targeting the Tn carbohydrate antigen. Oncoimmunology 2016, 5. [Google Scholar] [CrossRef]
- Walker, D.K. The use of pharmacokinetic and pharmacodynamic data in the assessment of drug safety in early drug development. Brit. J. Clin. Pharmacol. 2004, 58, 601–608. [Google Scholar] [CrossRef]
- Setchell, K.D.R.; Brown, N.M.; Desai, P.; Zimmer-Nechemias, L.; Wolfe, B.E.; Brashear, W.T.; Kirschner, A.S.; Cassidy, A.; Heubi, J.E. Bioavailability of pure isoflavones in healthy humans and analysis of commercial soy isoflavone supplements. J. Nutr. 2001, 131, 1362s–1375s. [Google Scholar] [CrossRef]
- O’Connor, O.A.; Lue, J.K.; Sawas, A.; Amengual, J.E.; Deng, C.C.; Kalac, M.; Falchi, L.; Marchi, E.; Turenne, I.; Lichtenstein, R.; et al. Brentuximab vedotin plus bendamustine in relapsed or refractory Hodgkin’s lymphoma: an international, multicentre, single-arm, phase 1-2 trial. Lancet Oncol. 2018, 19, 257–266. [Google Scholar] [CrossRef]
- Cole, P.D.; Metzger, M.; Drachtman, R.A.; Horton, T.M.; Liu, X.W.; Ahern, C.H.; Minard, C.; Fox, E.; Blaney, S.; Weigel, B.; et al. Phase 1 trial of brentuximab vedotin in combination with gemcitabine for pediatric and young adult patients with relapsed or refractory Hodgkin lymphoma, a Children’s Oncology Group report. J. Clin. Oncol. 2015, 33. [Google Scholar] [CrossRef]
- Akaiwa, M.; Martin, T.; Mendelsohn, B.A. Synthesis and Evaluation of Linear and Macrocyclic Dolastatin 10 Analogues Containing Pyrrolidine Ring Modifications. ACS Omega 2018, 3, 5212–5221. [Google Scholar] [CrossRef]
- Luesch, H.; Moore, R.E.; Paul, V.J.; Mooberry, S.L.; Corbett, T.H. Isolation of dolastatin 10 from the marine cyanobacterium Symploca species VP642 and total stereochemistry and biological evaluation of its analogue symplostatin 1. J. Nat. Prod. 2001, 64, 907–910. [Google Scholar] [CrossRef]
- Garteiz, D.A.; Madden, T.; Beck, D.E.; Huie, W.R.; McManus, K.T.; Abbruzzese, J.L.; Chen, W.; Newman, R.A. Quantitation of dolastatin-10 using HPLC/electrospray ionization mass spectrometry: application in a phase I clinical trial. Cancer Chemother. Pharm. 1998, 41, 299–306. [Google Scholar] [CrossRef]
- Zhang, X.; Yao, Y.; Lou, Y.; Jiang, H.; Wang, X.; Chai, X.; Zeng, S. Metabolism of ebracteolata compound B studied in vitro with human liver microsomes, HepG2 cells, and recombinant human enzymes. Drug Metab. Dispos. 2010, 38, 2157–2165. [Google Scholar] [CrossRef]
- Vikingsson, S.; Wohlfarth, A.; Andersson, M.; Green, H.; Roman, M.; Josefsson, M.; Kugelberg, F.C.; Kronstrand, R. Identifying Metabolites of Meclonazepam by High-Resolution Mass Spectrometry Using Human Liver Microsomes, Hepatocytes, a Mouse Model, and Authentic Urine Samples. AAPS J. 2017, 19, 736–742. [Google Scholar] [CrossRef]
- Watanabe, S.; Vikingsson, S.; Roman, M.; Green, H.; Kronstrand, R.; Wohlfarth, A. In Vitro and In Vivo Metabolite Identification Studies for the New Synthetic Opioids Acetylfentanyl, Acrylfentanyl, Furanylfentanyl, and 4-Fluoro-Isobutyrylfentanyl. AAPS J. 2017, 19, 1102–1122. [Google Scholar] [CrossRef]
- Wu, X.L.; Wu, M.J.; Chen, X.Z.; Ma, H.L.; Ding, L.Q.; Qiu, F.; Pan, Q.; Zhang, D.Q. Metabolic profiling of nuciferine in rat urine, plasma, bile and feces after oral administration using ultra-high performance liquid chromatography-diode array detection-quadrupole time-of-flight mass spectrometry. J. Pharm. Biomed. 2017, 140, 71–80. [Google Scholar] [CrossRef]
- Erickson, H.K.; Lambert, J.M. ADME of antibody-maytansinoid conjugates. AAPS J. 2012, 14, 799–805. [Google Scholar] [CrossRef]
- Hop, C.E.; Wang, Z.; Chen, Q.; Kwei, G. Plasma-pooling methods to increase throughput for in vivo pharmacokinetic screening. J. Pharm. Sci. 1998, 87, 901–903. [Google Scholar] [CrossRef]
- Hamilton, R.A.; Garnett, W.R.; Kline, B.J. Determination of mean valproic acid serum level by assay of a single pooled sample. Clin. Pharmacol. Ther. 1981, 29, 408–413. [Google Scholar] [CrossRef]
- Ramagiri, S.; Garofolo, F. Large molecule bioanalysis using Q-TOF without predigestion and its data processing challenges. Bioanalysis 2012, 529–540. [Google Scholar] [CrossRef]
- Shin, S.H.; Park, M.H.; Byeon, J.J.; Lee, B.I.; Park, Y.; Kim, N.; Choi, J.; Shin, Y.G. Analysis of Vipadenant and Its In Vitro and In Vivo Metabolites via Liquid Chromatography-Quadrupole-Time-of-Flight Mass Spectrometry. Pharmaceutics 2018, 10. [Google Scholar] [CrossRef]
- Lee, B.I.; Park, M.H.; Heo, S.C.; Park, Y.; Shin, S.H.; Byeon, J.J.; Kim, J.H.; Shin, Y.G. Quantification and application of a liquid chromatography-tandem mass spectrometric method for the determination of WKYMVm peptide in rat using solid-phase extraction. Biomed. Chromatogr. 2018, 32. [Google Scholar] [CrossRef]
- Lee, B.I.; Park, M.H.; Shin, S.H.; Byeon, J.J.; Park, Y.; Kim, N.; Choi, J.; Shin, Y.G. Quantitative Analysis of Tozadenant Using Liquid Chromatography-Mass Spectrometric Method in Rat Plasma and Its Human Pharmacokinetics Prediction Using Physiologically Based Pharmacokinetic Modeling. Molecules 2019, 24. [Google Scholar] [CrossRef]
- Park, M.H.; Lee, Y.Y.; Cho, K.H.; La, S.; Lee, H.J.; Yim, D.S.; Ban, S.; Park, M.Y.; Kim, Y.C.; Kim, Y.G.; et al. Validation of a liquid chromatography-triple quadrupole mass spectrometric method for the determination of 5-nitro-5’-hydroxy-indirubin-3’-oxime (AGM-130) in human plasma and its application to microdose clinical trial. Biomed. Chromatogr. 2016, 30, 323–329. [Google Scholar] [CrossRef]
- Ren, L.J.; Wu, H.J.; Sun, L.H.; Xu, X.; Mo, L.Y.; Zhang, L.; Zhang, J.Y.; Wu, C.Y. A sensitive LC-MS/MS method for simultaneous determination of cabozantinib and its metabolite cabozantinib N-oxide in rat plasma and its application in a pharmacokinetic study. Biomed. Chromatogr. 2018, 32, e4227. [Google Scholar] [CrossRef]
- Zhang, M.; Eismin, R.; Kenttamaa, H.; Xiong, H.; Wu, Y.; Burdette, D.; Urbanek, R. Identification of 2-aminothiazolobenzazepine metabolites in human, rat, dog, and monkey microsomes by ion-molecule reactions in linear quadrupole ion trap mass spectrometry. Drug Metab. Dispos. 2015, 43, 358–366. [Google Scholar] [CrossRef]
- Amer, S.M.; Kadi, A.A.; Darwish, H.W.; Attwa, M.W. Identification and characterization of in vitro phase I and reactive metabolites of masitinib using a LC-MS/MS method: bioactivation pathway elucidation. RSC Adv. 2017, 7, 4479–4491. [Google Scholar] [CrossRef]


| Quantification of MMAF | |
|---|---|
| Time (min) | Mobile phase B (%) |
| 0 | 10 |
| 0.5 | 10 |
| 1.3 | 95 |
| 1.9 | 95 |
| 2.0 | 10 |
| 3.5 | 10 |
| Metabolite profiling of MMAF | |
| Time (min) | Mobile phase B (%) |
| 0 | 5 |
| 2 | 5 |
| 28 | 33 |
| 29 | 33 |
| 34 | 95 |
| 38 | 95 |
| 38.1 | 5 |
| 45 | 5 |
| Low QC (165.46 ng/mL) | High QC (1820 ng/mL) | |
|---|---|---|
| Mean concentration (ng/mL) | 163.94 | 1832.78 |
| Accuracy % | 99.08 | 100.70 |
| % CV | 2.52 | 2.83 |
| n | 10 | 10 |
| Low QC (165.46 ng/mL) | |||||
|---|---|---|---|---|---|
| Species | Mouse | Rat | Dog | Monkey | Human |
| Mean concentration (ng/mL) | 184.60 | 155.72 | 171.41 | 171.36 | 164.36 |
| Accuracy % | 111.57 | 94.11 | 103.60 | 103.57 | 99.34 |
| % CV | 6.36 | 4.03 | 2.97 | 6.59 | 7.16 |
| n | 3 | 3 | 3 | 3 | 3 |
| HighQC (1820 ng/mL) | |||||
| Species | Mouse | Rat | Dog | Monkey | Human |
| Mean concentration (ng/mL) | 1651.07 | 1792.99 | 1796.06 | 1667.92 | 1873.39 |
| Accuracy % | 90.72 | 98.52 | 98.69 | 91.64 | 102.93 |
| %CV | 7.51 | 6.08 | 3.52 | 6.14 | 2 |
| n | 3 | 3 | 3 | 3 | 3 |
| MMAF | QC |
|---|---|
| Mean concentration of the post-extraction spiked QC (ng/mL) | 198.84 |
| Mean concentration of the extracted QC samples (ng/mL) | 163.94 |
| Extraction recovery (%) | 82.45 |
| % CV | 2.12 |
| n | 3 |
| MMAF | Dilution QC (9100 ng/mL) |
| Mean concentration (ng/mL) | 8091.72 |
| Accuracy % | 88.92 |
| % CV | 9.02 |
| n | 3 |
| (a) Short-term stability (RT, 4 h) | Low QC (165.46 ng/mL) | High QC (1820 ng/mL) | ||||
| Incubation time (hr) | 0 (Control) | 4 | 0 (Control) | 4 | ||
| Mean Concentration (ng/mL) | 169.87 | 149.90 | 1970.02 | 1884.23 | ||
| Accuracy % | 102.67 | 90.60 | 108.24 | 103.53 | ||
| % CV | 2.08 | 3.05 | 5.20 | 3.27 | ||
| n | 3 | 3 | 3 | 3 | ||
| (b) Long-term stability (−80 °C, 4 weeks) | Low QC (165.46 ng/mL) | High QC (1820 ng/mL) | ||||
| Mean concentration (ng/mL) | 157.95 | 1657.96 | ||||
| Accuracy % | 95.46 | 91.10 | ||||
| % CV | 8.32 | 11.93 | ||||
| n | 3 | 3 | ||||
| (c) Freeze-thaw stability (−80 °C, three cycles) | Low QC (165.46 ng/mL) | High QC (1820 ng/mL) | ||||
| Mean concentration (ng/mL) | 157.95 | 1657.96 | ||||
| Accuracy % | 95.46 | 91.10 | ||||
| % CV | 8.32 | 11.93 | ||||
| n | 3 | 3 | ||||
| (d) Post-preparative stability (10 °C, 12 h) | Area ratio of 1st injection | Area ratio of 10th injection (after 12hr) | Change (%) | % CV | ||
| Low QC | 0.62 | 0.61 | 97.93 | 2.67 | ||
| High QC | 7.43 | 7.43 | 99.98 | 0.43 | ||
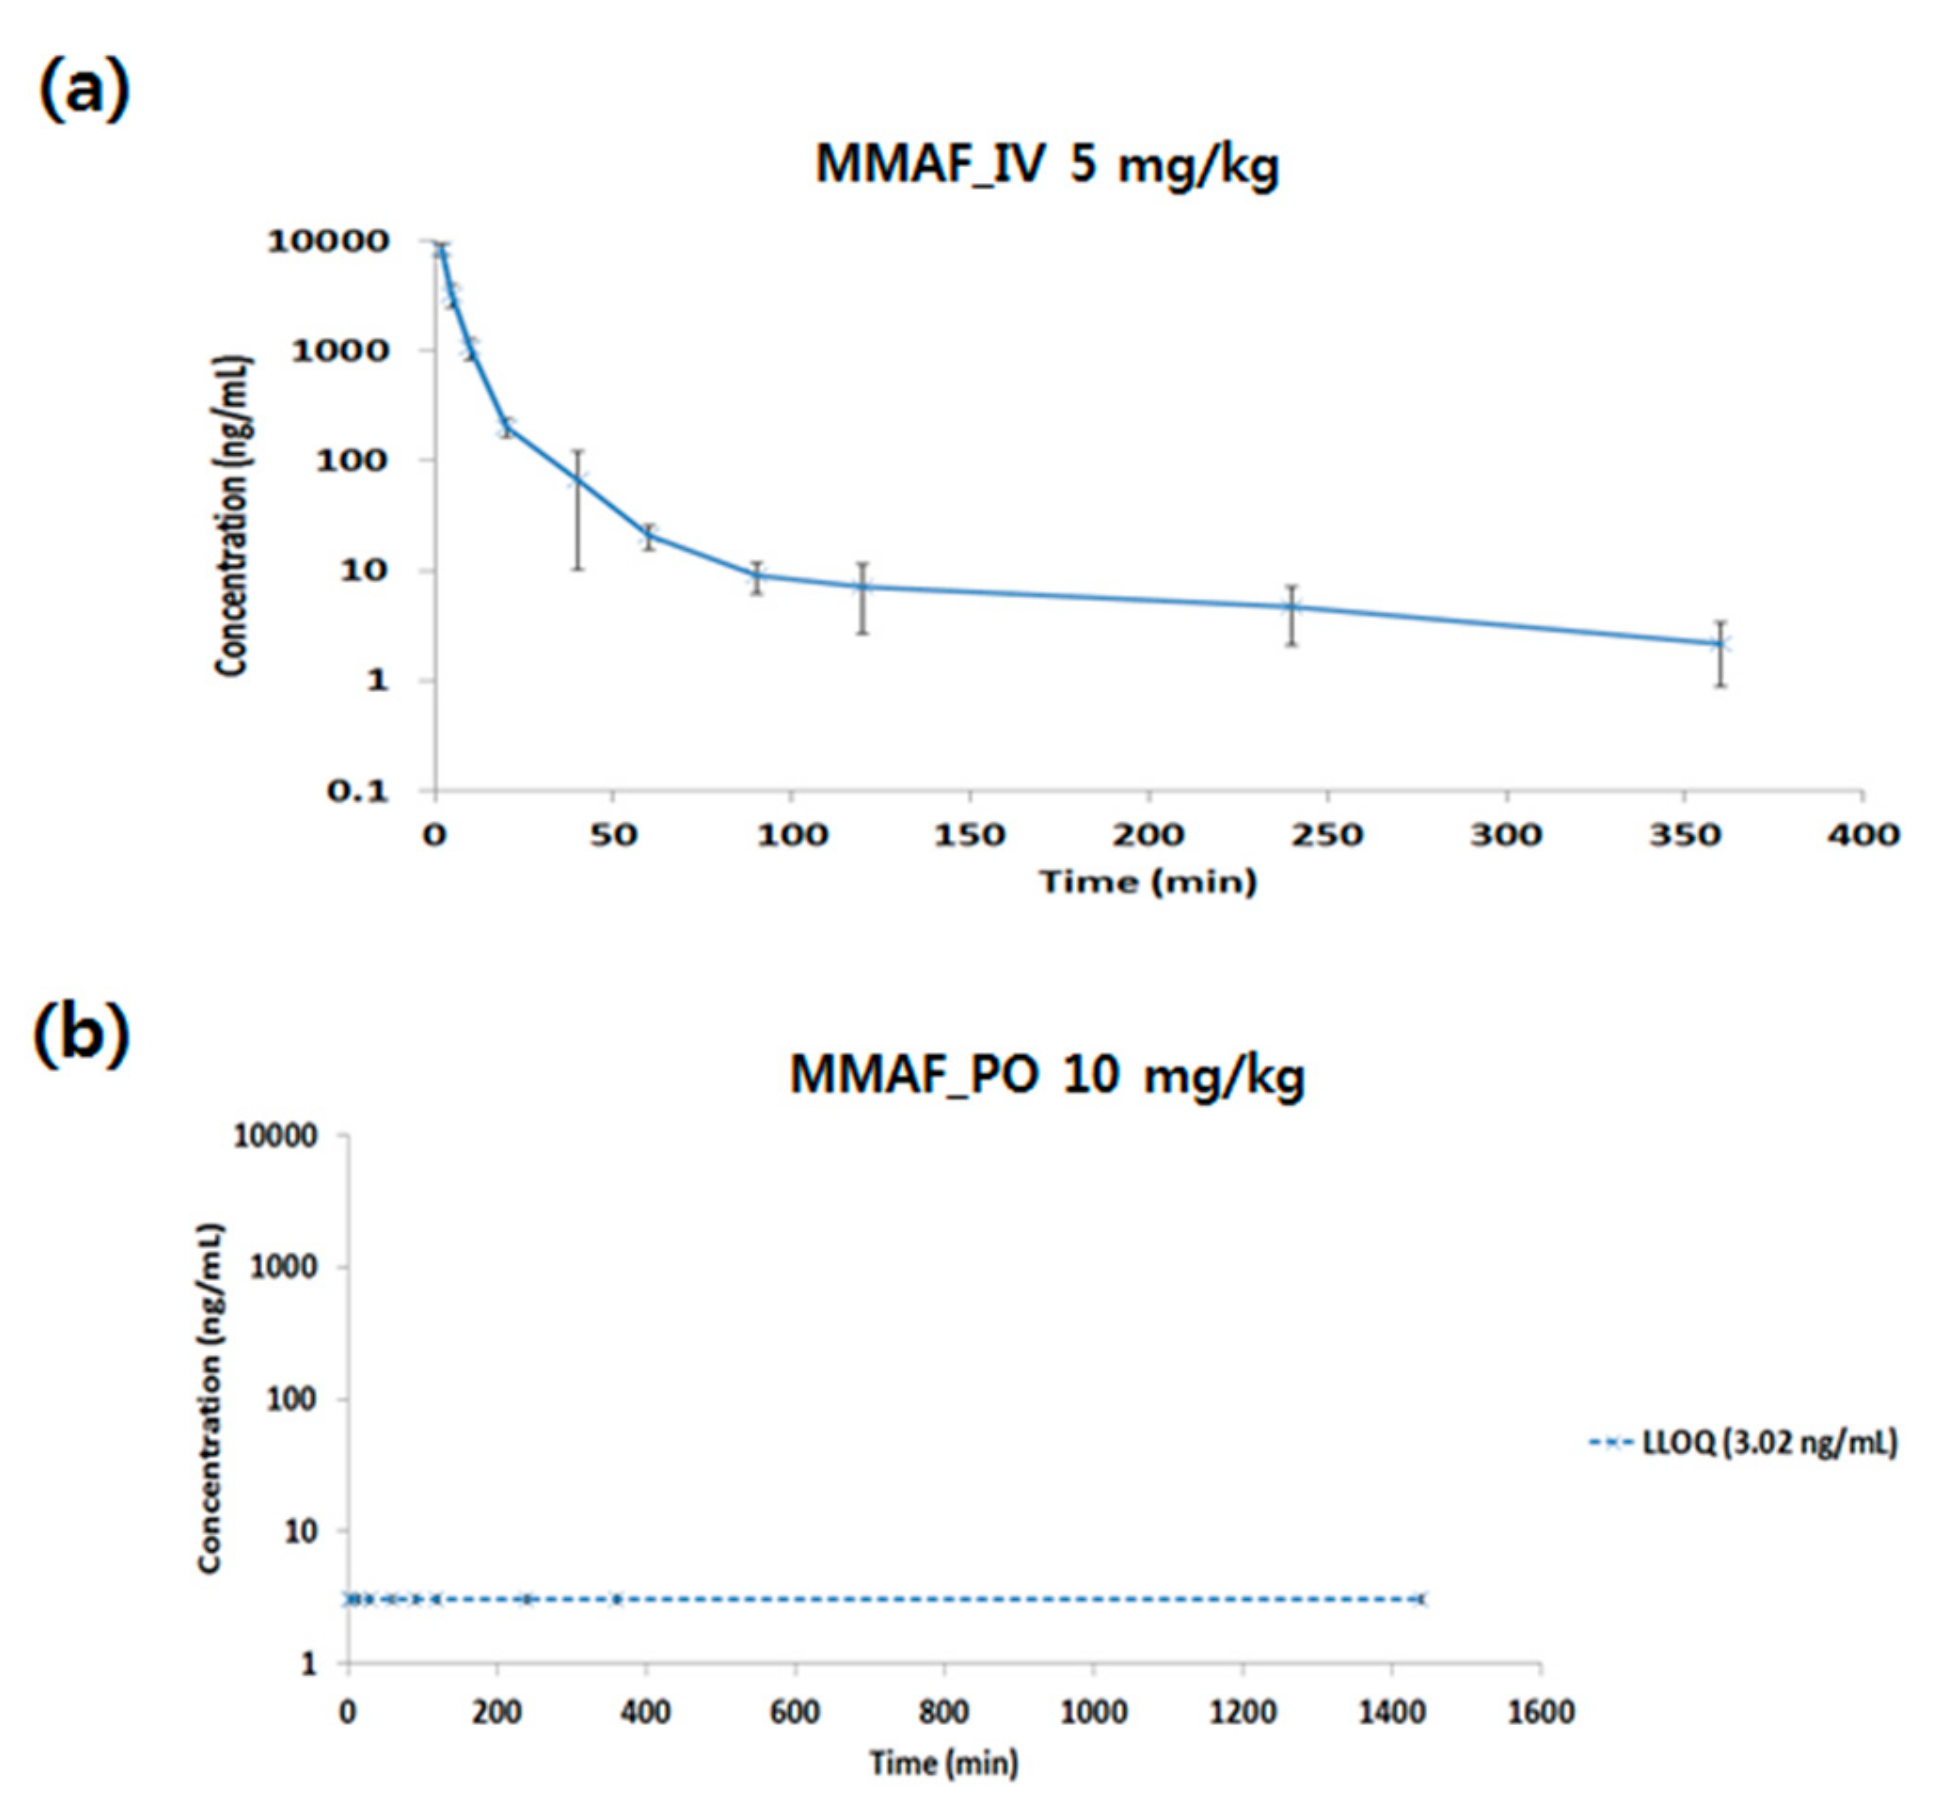
| Subject | Dose (mg/kg) | Cmax (ng/mL) | AUClast (min*ng/mL) | Clearance (CL) (mL/min/kg) | Vss (mL/kg) | Bioavailability (%) |
|---|---|---|---|---|---|---|
| MMAF IV (5 mg/kg) | 5 | 8276.76 | 65661.30 | 77.33 | 1057.13 | |
| MMAF PO (10 mg/kg) | 10 | N/D | N/D | 0 |
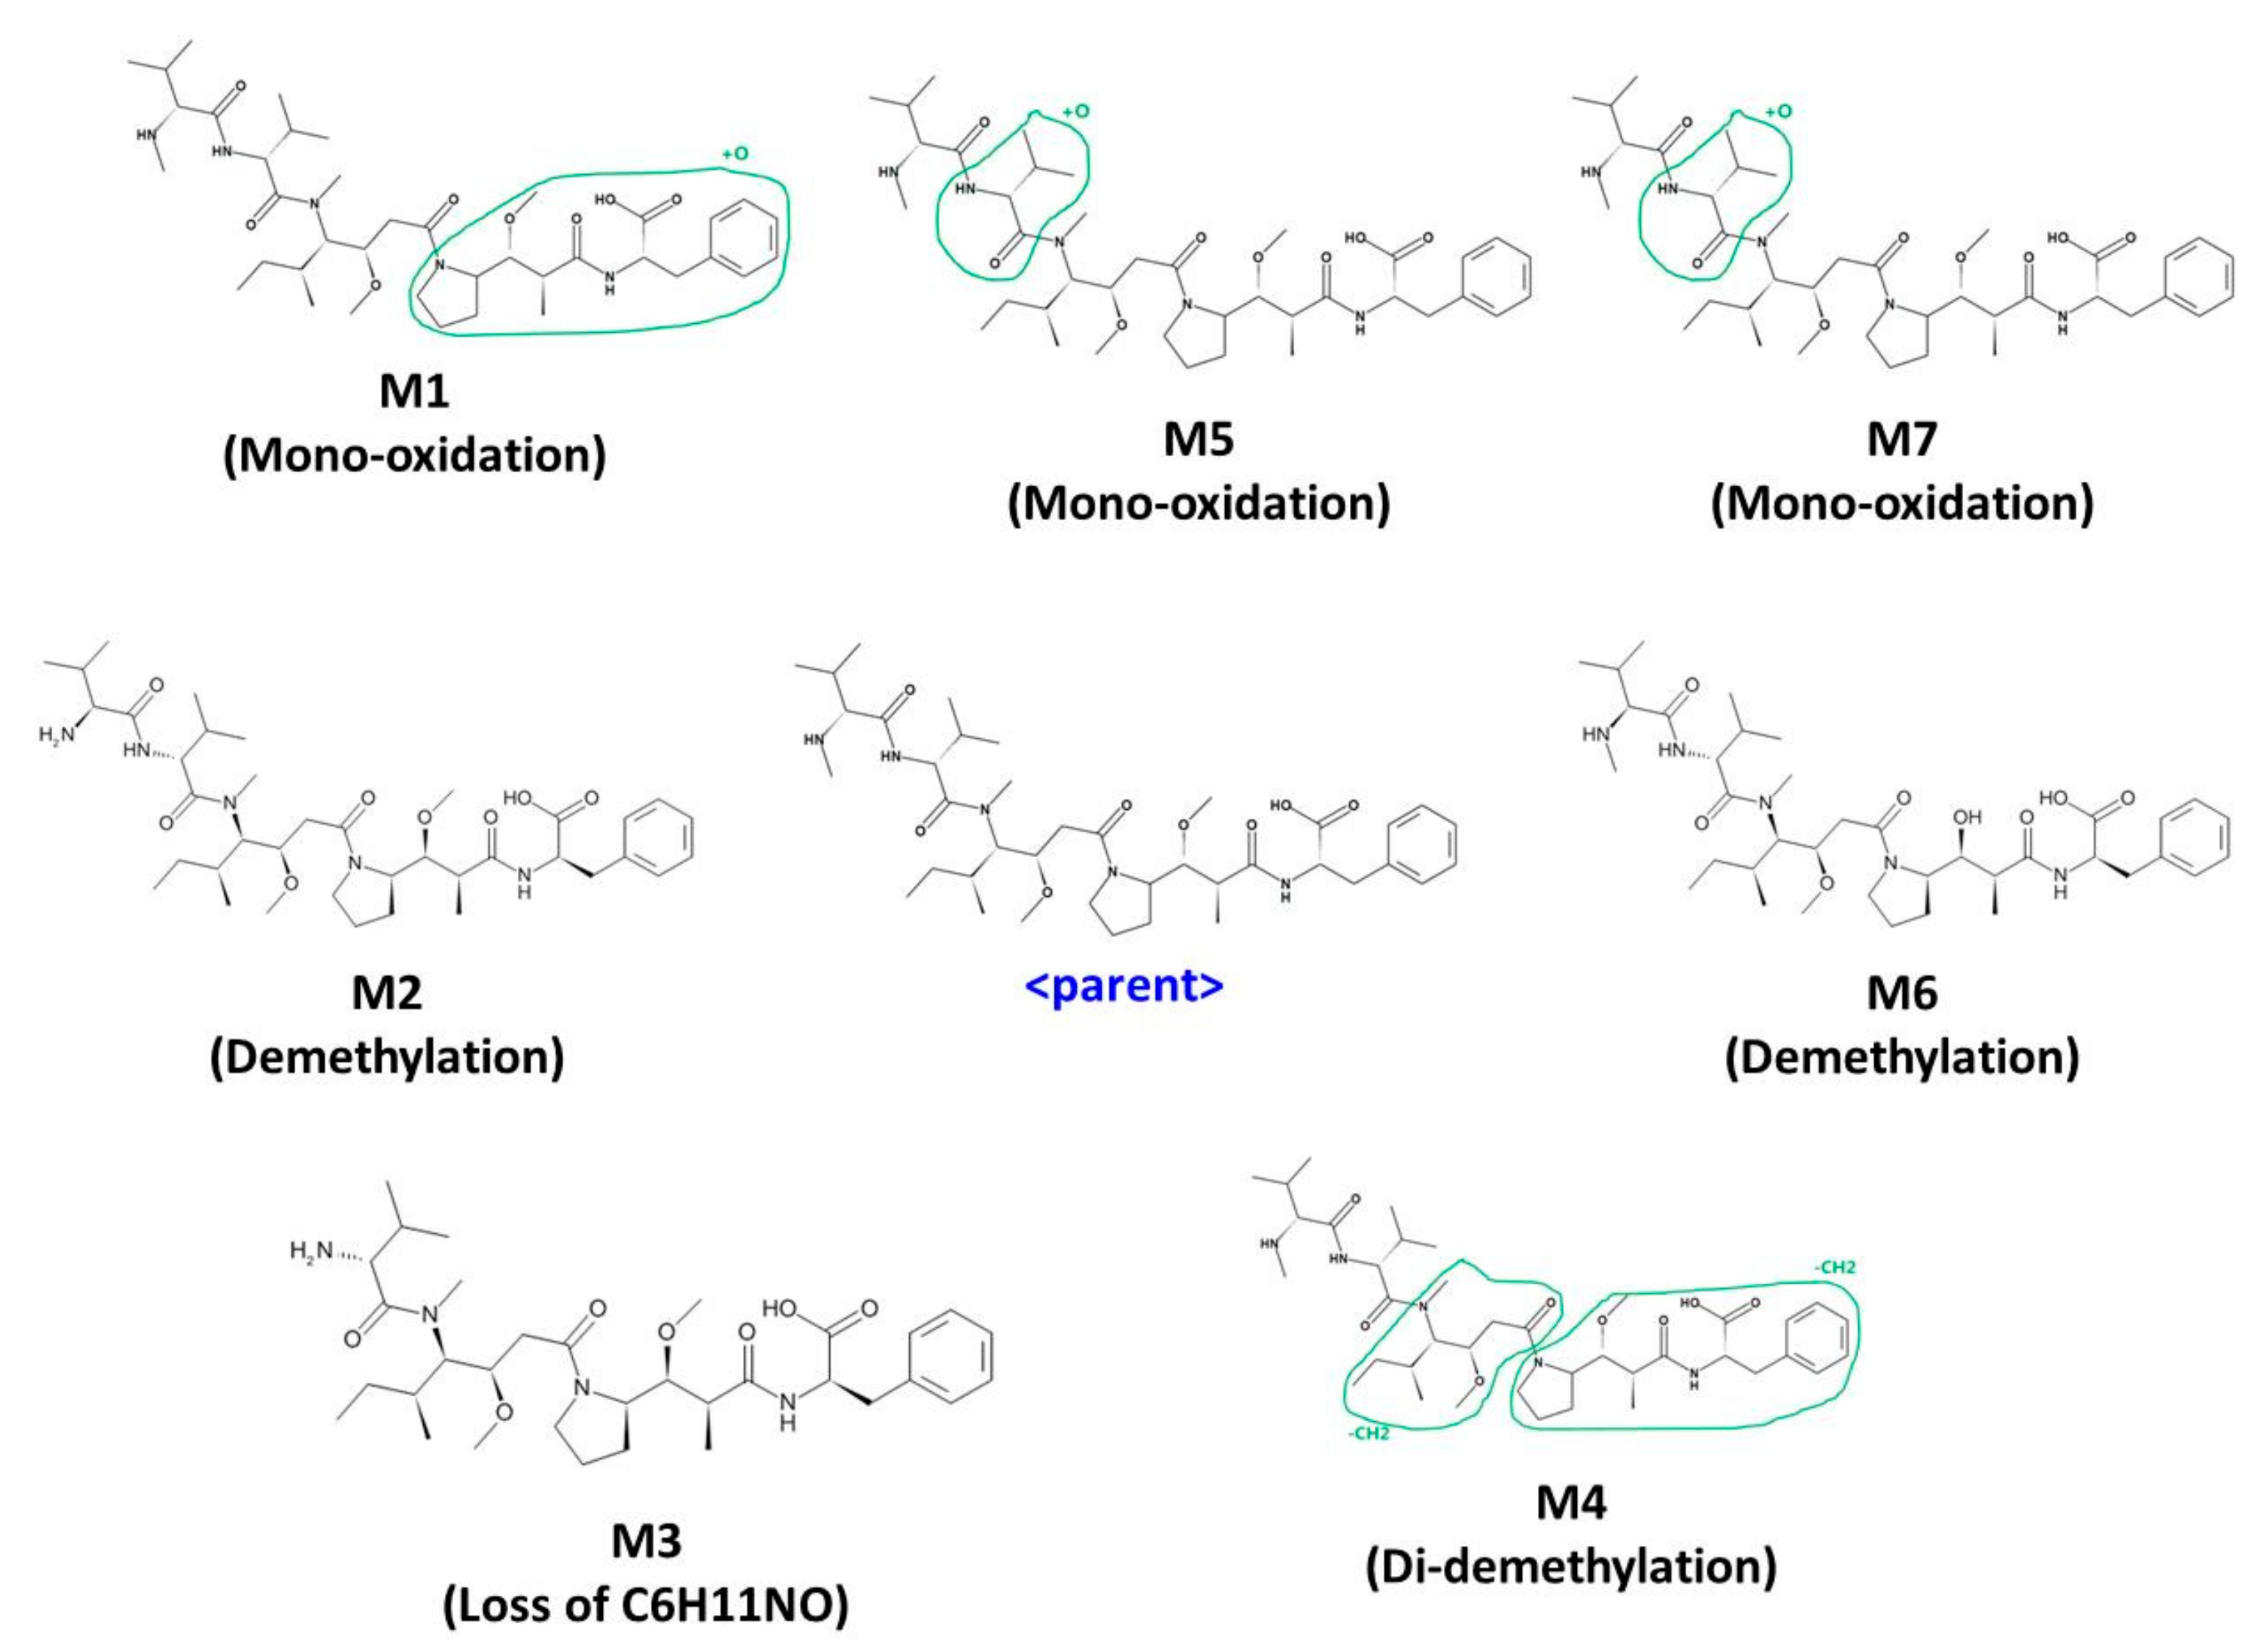
| Symbol | Metabolite | m/z | Retention Time (min) | Rat Liver Microsome | Human Liver Microsome | Pooled Rat Plasma (IV) | Pooled Rat Plasma (PO) |
|---|---|---|---|---|---|---|---|
| M1 | Oxidation-1 | 748.4624 | 21.50 | 0 | N/D | N/D | |
| M2 | Demethylation-1 | 718.4519 | 22.40 | 0 | 0 | N/D | N/D |
| M3 | Di-demethylation | 704.4362 | 22.96 | 0 | N/D | N/D | |
| M4 | Loss of C6H11NO | 619.3813 | 23.17 | 0 | 0 | N/D | N/D |
| M5 | Oxidation-2 | 748.4624 | 24.01 | 0 | N/D | N/D | |
| M6 | Demethylation-2 | 718.4519 | 24.55 | 0 | 0 | N/D | N/D |
| Parent | Parent | 732.4911 | 25.10 | 0 | 0 | 0 | 0 |
| M7 | Oxidation-3 | 748.4624 | 32.16 | 0 | 0 | N/D | N/D |
© 2019 by the authors. Licensee MDPI, Basel, Switzerland. This article is an open access article distributed under the terms and conditions of the Creative Commons Attribution (CC BY) license (http://creativecommons.org/licenses/by/4.0/).
Share and Cite
Park, M.-H.; Lee, B.i.; Byeon, J.-J.; Shin, S.-H.; Choi, J.; Park, Y.; Shin, Y.G. Pharmacokinetic and Metabolism Studies of Monomethyl Auristatin F via Liquid Chromatography-Quadrupole-Time-of-Flight Mass Spectrometry. Molecules 2019, 24, 2754. https://doi.org/10.3390/molecules24152754
Park M-H, Lee Bi, Byeon J-J, Shin S-H, Choi J, Park Y, Shin YG. Pharmacokinetic and Metabolism Studies of Monomethyl Auristatin F via Liquid Chromatography-Quadrupole-Time-of-Flight Mass Spectrometry. Molecules. 2019; 24(15):2754. https://doi.org/10.3390/molecules24152754
Chicago/Turabian StylePark, Min-Ho, Byeong ill Lee, Jin-Ju Byeon, Seok-Ho Shin, Jangmi Choi, Yuri Park, and Young G. Shin. 2019. "Pharmacokinetic and Metabolism Studies of Monomethyl Auristatin F via Liquid Chromatography-Quadrupole-Time-of-Flight Mass Spectrometry" Molecules 24, no. 15: 2754. https://doi.org/10.3390/molecules24152754
APA StylePark, M.-H., Lee, B. i., Byeon, J.-J., Shin, S.-H., Choi, J., Park, Y., & Shin, Y. G. (2019). Pharmacokinetic and Metabolism Studies of Monomethyl Auristatin F via Liquid Chromatography-Quadrupole-Time-of-Flight Mass Spectrometry. Molecules, 24(15), 2754. https://doi.org/10.3390/molecules24152754