Article

Dendrobium officinale Polysaccharides Inhibit 1-Methyl-2-Nitro-1-Nitrosoguanidine Induced Precancerous Lesions of Gastric Cancer in Rats through Regulating Wnt/β-Catenin Pathway and Altering Serum Endogenous Metabolites

1
Research Center for Differentiation and Development of Basic Theory of Traditional Chinese Medicine, Jiangxi University of Traditional Chinese Medicine, Nanchang 330004, China
2
Jiangxi Province Key Laboratory of TCM Etiopathogenisis, Nanchang 330004, China
*
Authors to whom correspondence should be addressed.
Molecules 2019, 24(14), 2660; https://doi.org/10.3390/molecules24142660
Submission received: 3 June 2019 / Revised: 17 July 2019 / Accepted: 19 July 2019 / Published: 23 July 2019
(This article belongs to the Special Issue Natural Products for Cancer Chemoprevention)

Abstract

:
Dendrobium officinale is a herb in traditional Chinese medicine where D. officinale polysaccharides (DOP) are the main active ingredient. This study aimed at evaluating DOP efficiency at inhibiting 1-Methyl-2-nitro-1-nitrosoguanidine (MNNG) induced precancerous lesions of gastric cancer (PLGC) in rats through the Wnt/b-catenin pathway and analyzing the variations of serum endogenous metabolites. PLGC was established in male Sprague-Dawley (SD) rats by administering 150 μg/mL MNNG in drinking water for 7 months and giving 0.1 mL of 10% NaCl once weekly during the initial 20 weeks. Treatment with DOP inhibited the progress of PLGC through decreasing the expression of β-catenin by immunohistochemical analysis. The futher study indicated DOP downregulated gene expression of Wnt2β, Gsk3β, PCNA, CyclinD1, and β-catenin, as well as protein expression of Wnt2β, PCNA, and β-catenin. On the other hand, there were nine endogenous metabolites identified after the DOP treatment. Among these, the most significant one is betaine because of its strong antioxidant activity, leading to an anti-tumor effect. DOP can inhibit MNNG-induced PLGC models via regulating Wnt/β-catenin pathway and by changing endogenous metabolites.

Graphical Abstract

1. Introduction

Gastric cancer is a common malignant digestive tract tumor, with the latest report showing that its incidence at 5.7% and its mortality at 8.2% in the world [1]. Precancerous lesions of gastric cancer (PLGC) is the most important phase in the progression of gastric cancer, in that it presents the best opportunity for inhibiting tumor progression [2,3]. The Wnt pathway is one of the most important signaling pathways involved in gastric carcinogenesis. It is well documented that the Wnt pathway is constitutively activated and beta-catenin accumulation is changed in the progression of the gastric tumorigenesis. Therefore, the Wnt pathway is recognized as a useful pathway to examine the relationship between gastric tumorigenesis and drug effects, as well as to explain the mechanism of its preventive effect [4,5].
A metabolomics approach is carried out to estimate the effects of treatment and differences among groups and subsequently to know the cause of such differences. The differences are mainly presented by the changes of endogenous small metabolite molecules, which are characterized metabolic pathways of biological systems. It is usually combined with pattern recognition technology, such as structural mass spectrometry (MS) [6,7]. At present, metabolomics is commonly used in pathology, pharmacology, and toxicology, and it is helpful for finding biomarkers and exploring metabolic networks of the drug [8]. Partial least-squares-discriminant analysis (PLS-DA) is a popular multivariate statistical analysis tool, which can be applied to these complex spectral data to express the characterization of changes related to the drug effect or disease [9].
Dendrobium officinale Kimura & Migo (D. officinale) (“Tie pi Shi hu”) is a useful traditional Chinese medicine (TCM) believed, for thousands of years, to reinforce stomach function and generate body fluid. The National Health Commission of the People’s Republic of China characterizes it as a herb and a health food. We also conducted the urine metabolomics analysis of D. officinale extraction on gastric precancerous lesion [10,11], and the result indicated melatonin was one of the important endogenous metabolites related to the growth inhibition of gastric cancer [12]. D. officinale polysaccharides (DOP) is the main effective component in D. officinale. Our previous studies showed that DOP could inhibit the progression of gastric carcinogenesis, and the suppression are associated with the reduction of 8-OHdG levels, as well as the activation of the NRF2 pathway and its related antioxidant enzymes, HO-1 and NQO-1 [13]. However, the process of its inhibitive effects through regulating the Wnt/β-catenin pathway and endogenous metabolites remain unclear. In this study, we further explored the mechanism of DOP inhibition on PLGC progress focusing on the activation of the Wnt/β-catenin pathway and the alteration of endogenous metabolites in serum.

2. Result

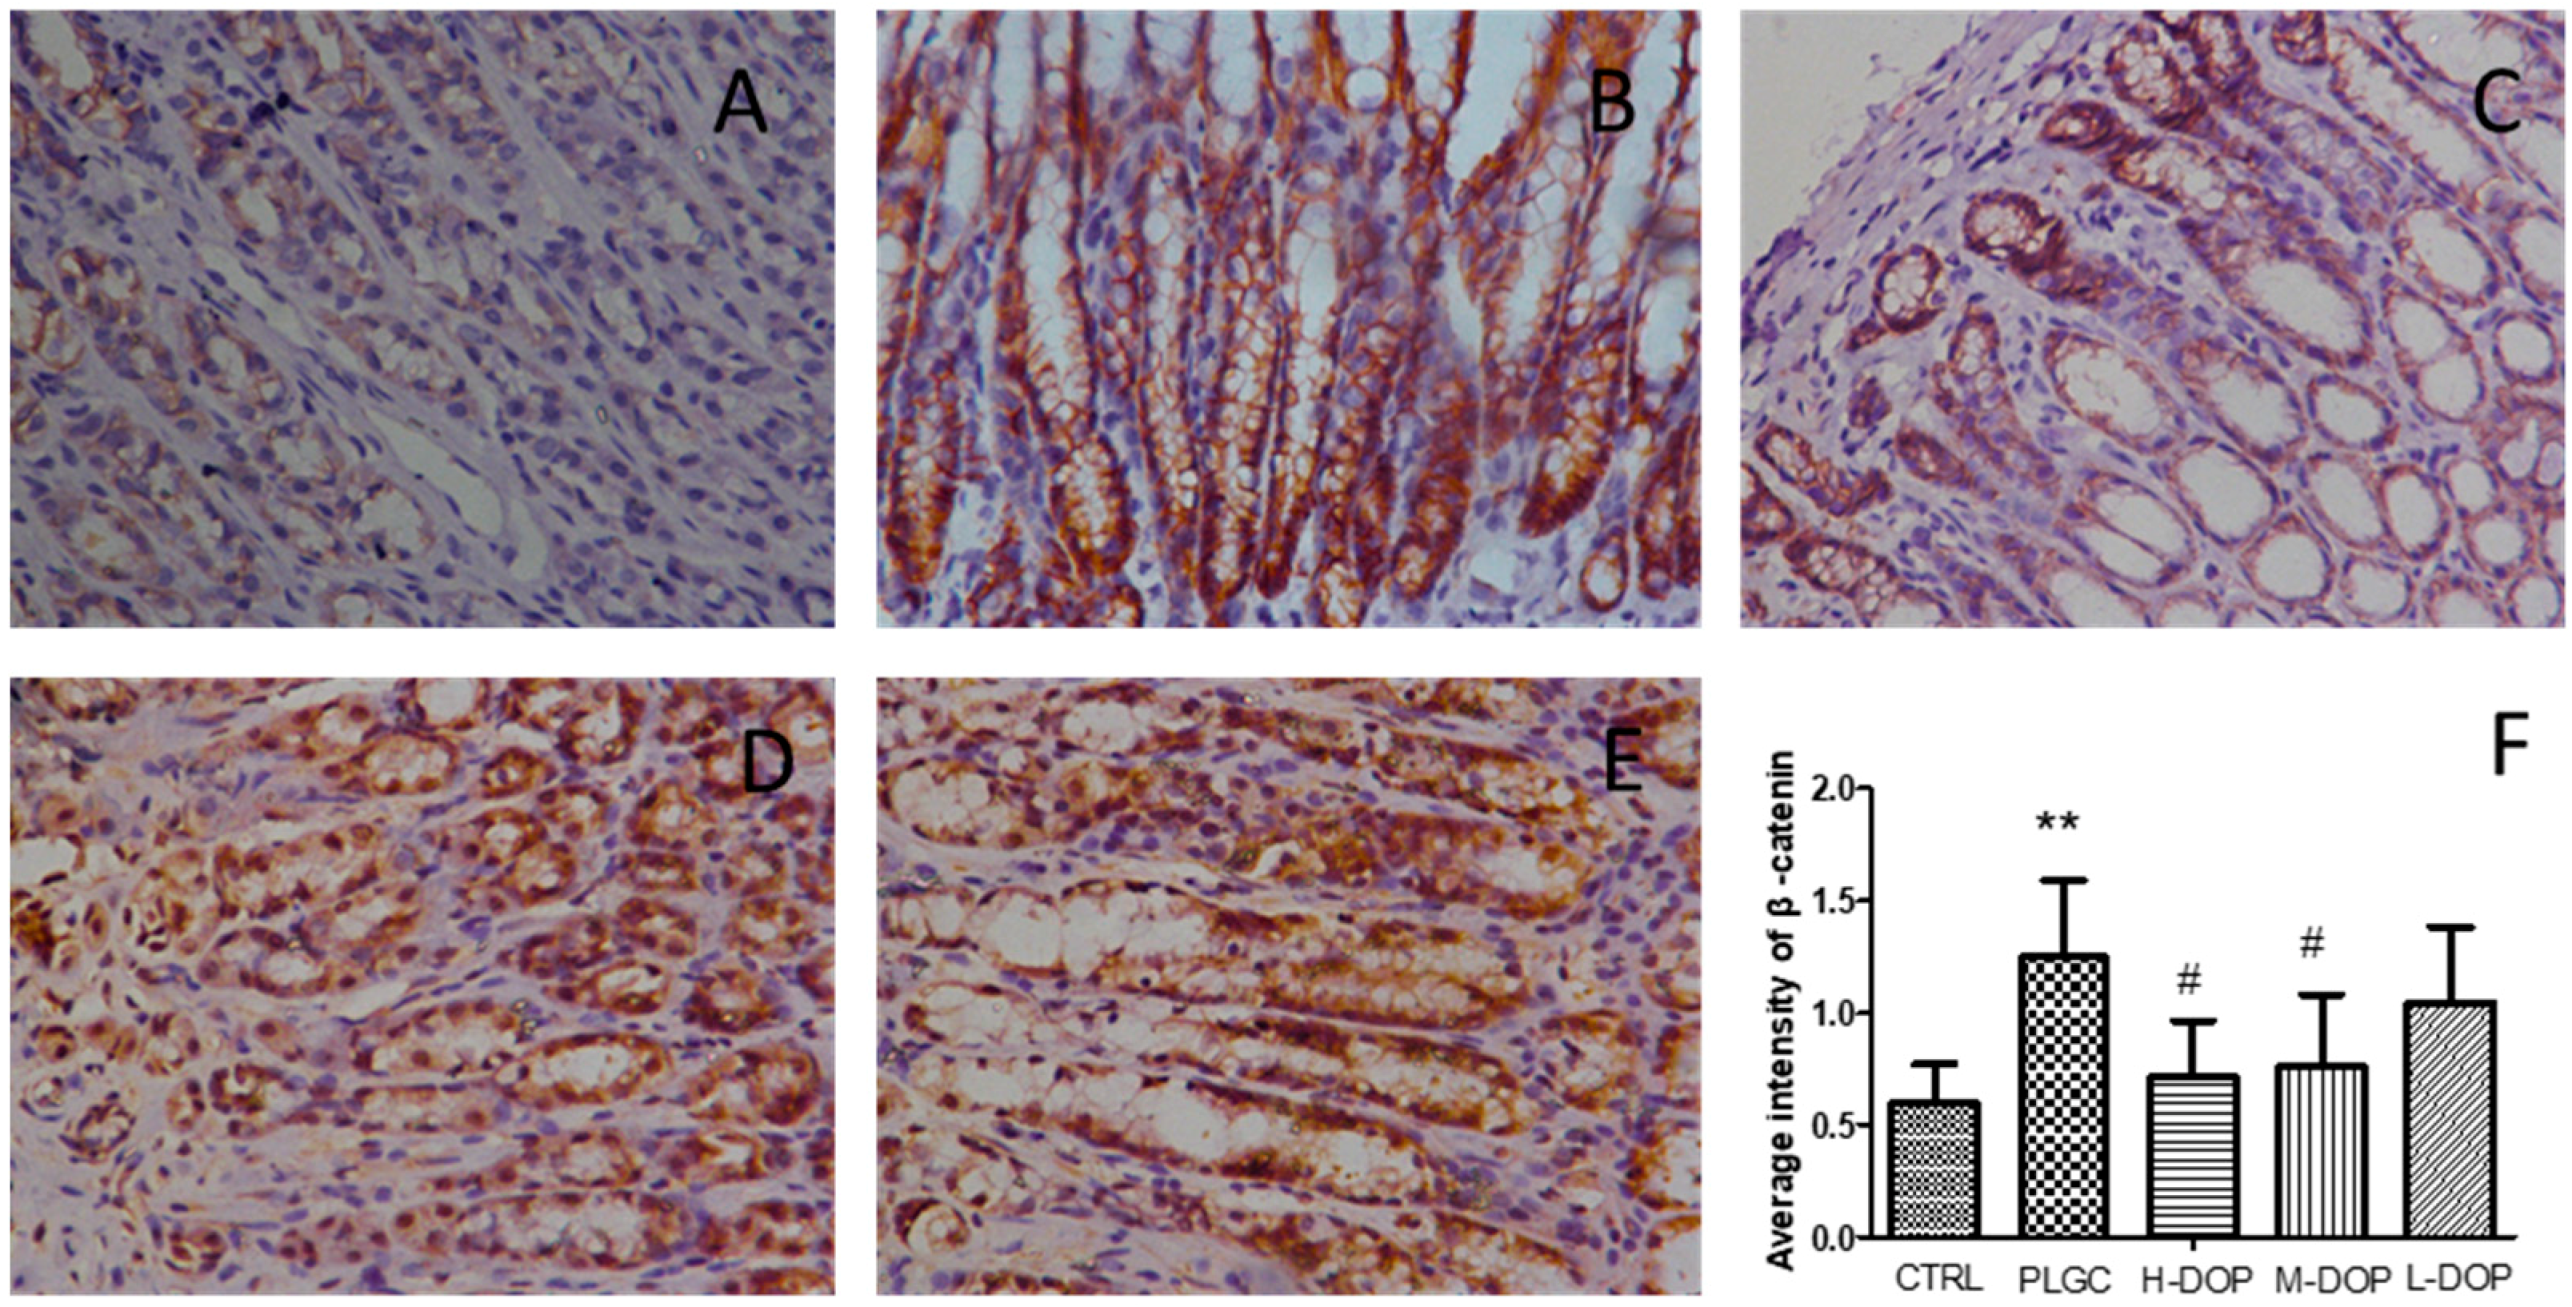
2.1. Immunohistochemical Analysis of β-Catenin

The protein expression of β-catenin was significantly increased in the PLGC group and the average density was significantly higher than that of the normal group (Figure 1B,F). After DOP administration, the high and medium doses could notably decrease the expression of β-catenin and both had a significant difference compared to the CTRL group (all p < 0.05) (Figure 1C,D,F).

2.2. RT-PCR Analysis of Gene related to Wnt/β-Catenin Pathway

In the current experiment, RT-PCR analysis showed the expression of Wnt2β, Gsk3β, PCNA, and β-catenin mRNA strongly increased in the PLGC model (all p < 0.05). After treatment with all the different doses of DOP, the four genes were all significantly decreased and had the statistical differences when compared with the PLGC model group, but the expression of CyclinD1 only had a downward trend (Figure 2).

2.3. Western Blot Analysis of Wnt2β, PCNA, and β-Catenin Protein Expression

As shown in Figure 3A–D, the protein expression of Wnt2β, PCNA, and β-catenin were significantly increased in the PLGC group compared to the CTRL group (all p < 0.05), and these expression levels were attenuated by three doses of DOP, especially in PCNA and β-catenin expression. But CyclinD1 protein expression had no remarkable change (Figure 3E).

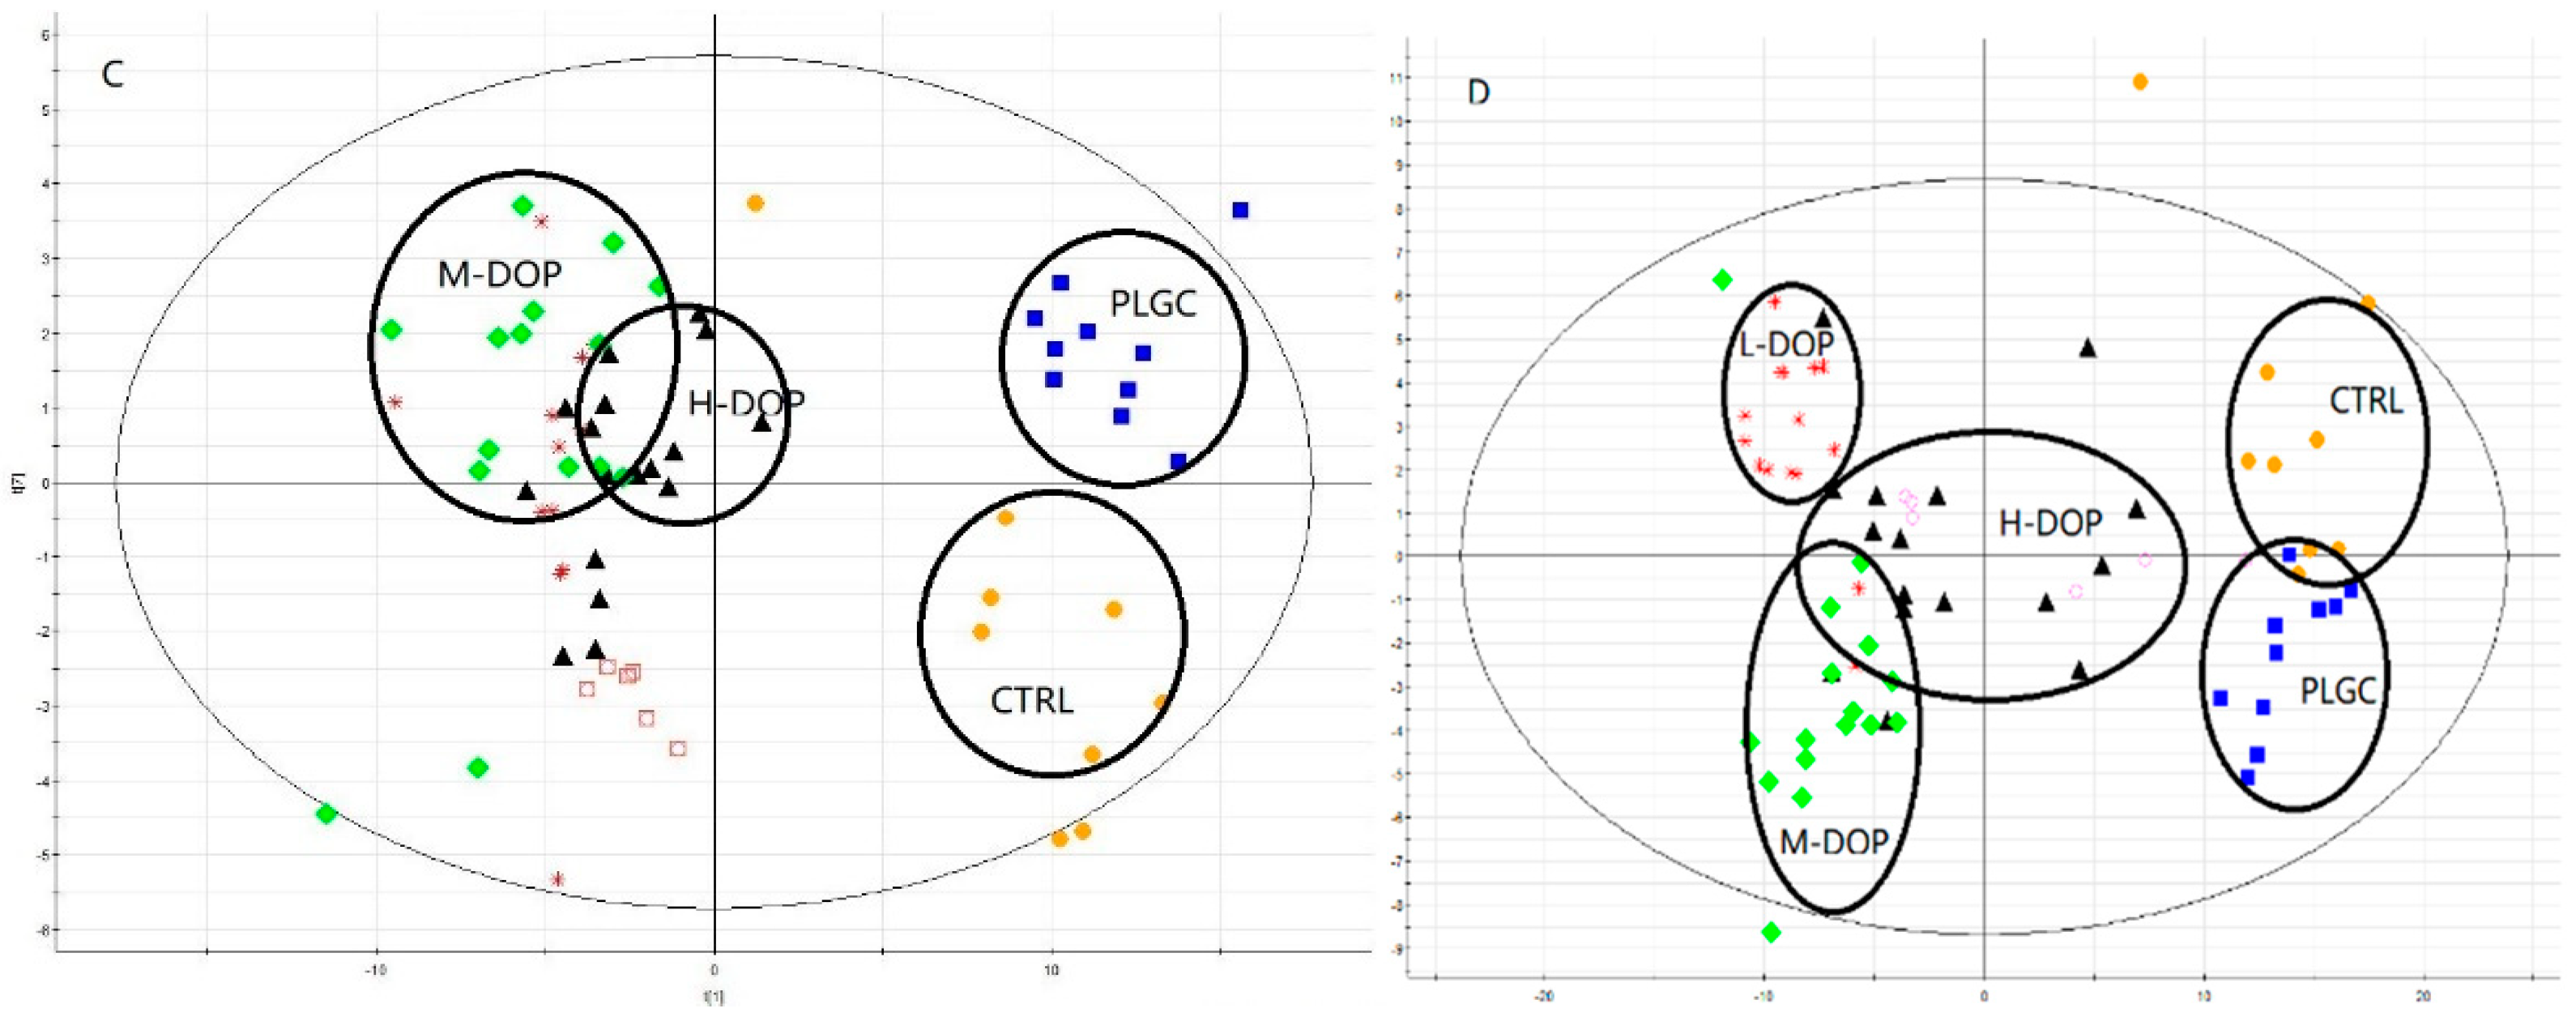
2.4. Metabolites Profiles in the Serum

According to the PLS-DA score plot in Figure 4A,B, the analyzed result shown that R2X = 0.768, R2Y = 0.781, Q2 = 0.653 in the negative (Figure 4A) and R2X = 0.541, R2Y = 0.864, Q2 = 0.817 in the positive model (Figure 4B), that means the PLS-DA score plot provided an intuitive summary of the sample clustering patterns. The different circle in the figure indicated that the PLGC model group were gathered together and distributed differently from the CTRL group, which means the metabolic profiles of PLGC rats were far from those of CTRL group. After treatment with DOP, the data show that R2X = 0.727, R2Y = 0.782, and Q2 = 0.608 are in the negative, while R2X = 0.713, R2Y = 0.772, and Q2 = 0.637 are in the positive model; all the R2 values were high which indicated a high predictive accuracy. The results indicated that the DOP treated group were far from the model group, and demonstrated that the PLS-DA analysis was the optimal discriminant mode for these groups.

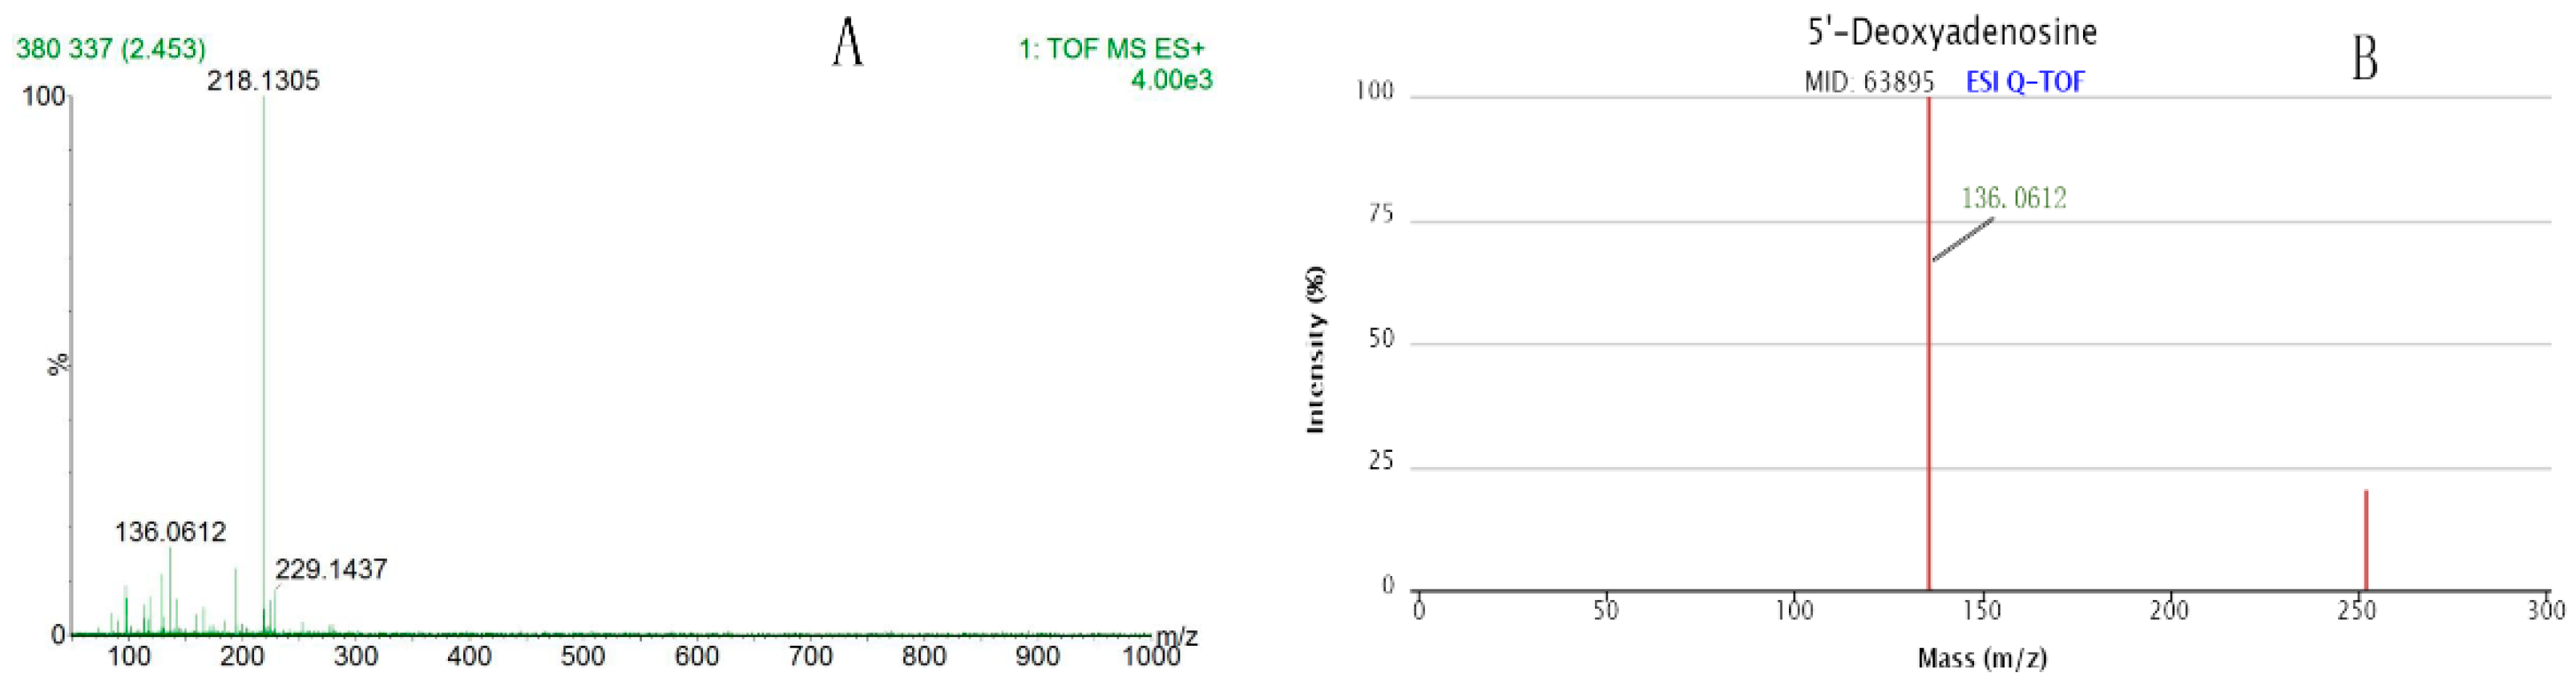
2.5. Potential Endogenous Metabolites Identification

The VIP value and Student’s t-test of the p-value were used to reflect the importance of the metabolites. Variables with VIP > 1.0 and p < 0.05 were selected as potential biomarkers for further statistical analysis. Nine endogenous metabolites were identified, they were Betaine, 5′-Deoxyadenosine, Enterolactone, Metanephrine, Proline betaine, Imidazolelactic acid, l-leucyl-l-proline, 15,16-DiHODE, Alpha-CEHC (Table 1), then compared the value of highlight between different groups (Figure 5).

2.6. Determination of Endogenous Metabolites

The secondary mass spectrometry was identified by the HMDB and METLIN databases. Taking the metabolite of m/z 252.1095 in a positive ion mode as an example, the m/z value of second mass spectrum is 136.0612 (Figure 6A), which matches the database, and then the substance is determined to be m/z 252.1095 (Figure 6B). Another eight metabolites were determined in the same way.

2.7. Enrichment Analysis of Differential Endogenous Metabolites

Using MetaboAnalyst 3.0 for metabolite enrichment analysis, metabolites were mainly concentrated in the four pathways, they were betaine metabolism, methionine metabolism, glycine, serine, and threonine metabolism, and tyrosine metabolism. Among them, betaine metabolism is the most significant pathway (Table 2, Figure 7).

3. Discussion

The Wnt signaling pathway is implicated in many hereditary diseases and tumorigenesis, including colorectal cancer, hepatocellular carcinoma, and gastric cancer [14]. It is reported that Helicobacter pylori could activate oncogenic c-Met and epidermal growth factor receptor (EGFR), inhibit tumor suppressor Runx3 and Trefoil factor 1 (TFF1), then stimulate the Wnt/β-catenin pathway [15]. The Wnt/β-catenin pathway also has a high expression in the MUN-induced gastric cancer mice model. WNT2 is one of the proto-oncogenes with the potential to activate the WNT-β-catenin-TCF signaling pathway; it promotes cell migration and invasion on the progression of gastric cancer [16]. The accumulation of β-catenin in the nucleus could promote the transcription of many oncogenes, such as c-Myc and CyclinD-1, and it is also found in the MNNG-induced glandular stomach adenocarcinomas [17]. Cyclin D1 is overexpression in MNNG-induced rat gastric adenocarcinomas [18]. In our experiment, the gene and protein expression of Wnt2β, β-catenin, and PCNA were strongly enhanced in the PLGC group, this result matched the report. After treatment with DOP, all of them were declined and had statistical differences compared to the PLGC group. The result showed the DOP could inactivate the Wnt/β-catenin pathway to inhibit the progression of gastric cancer in rats.
Metabolomics has been widely used in tumors and was mainly focused on the discovery of tumor biomarkers, clinical diagnosis of tumors, and evaluation of treatment methods [19]. In gastric cancer, a large number of related studies on metabolomics have been carried out. Corona [20] investigated serum metabolomic profiles to find additional biomarkers that could be integrated with serum PGs and G17 to improve the diagnosis of GC and the selection of first-degree relatives (FDR) at a higher risk of GC development; the result showed that the predictive risk algorithm composed of the C16, SM (OH) 22:1 and PG-II serum levels could be used to stratify FDR at a high risk of GC development. Gu [21] performed an NMR-based metabolomics analysis of a rat model of gastric carcinogenesis, the result showed two activated pathways (glycolysis; glycine, serine, and threonine metabolism) substantially contributed to the metabolic alterations at the GC different stage. In our results, after using MetaboAnalyst 3.0 for metabolite enrichment analysis, the metabolites were mainly concentrated in four pathways: betaine metabolism, methionine metabolism; glycine, serine and threonine metabolism, and tyrosine metabolism. All of which are in agreement with existing research.
In these nine endogenous metabolites, the most interesting one is betaine, which is an important methyl group donor, participating in methionine recycling and phosphatidylcholine synthesis [22]. Recently the report showed that betaine can alleviate inflammation by lowering interleukin (IL)-1beta secretion and improve intestinal function by enhancing digestive enzymes, ameliorating intestinal morphology, and enriching intestinal microbiota of high-salt stressed rats [23,24]. In our research, after treatment with DOP, medium and low doses of DOP significantly increased the level of betaine, which was statistically significant compared with the model group (p < 0.01). We found that the PLGC model rats had a side effect on liver function which increased the ALT level (p < 0.001); high, medium, and low doses of DOP significantly decreased the level of ALT, which was statistically significant compared with the model group (p < 0.01). The results indicate that DOP has a protective effect on liver function [13], which may be related with the upregulation of betaine by DOP, although further research is required. In another way, the report indicated betaine could attenuate DEN-induced hepatocarcinogenesis through the down-regulation of P16 and inhibiting the up-regulation of c-Myc, which cued the betaine could has the inhibition on gastric carcinogenesis [25].
Alpha-CEHC (α-CEHC) is a water-soluble metabolite of vitamin E, which circulates in the blood and is excreted with the urine. The report had concluded that alpha-CEHC is a molecule with good antioxidant activity [26]. Alpha- and γ-tocopherol, as well as their final metabolites α- and γ-CEHC, suppressed cyclin D1 expression and inhibited PC-3 prostate cancer cell proliferation [27]. In our experiment, the PLGC group can downregulate the expression of α-CEHC and after administering DOP, it upregulated, this result indicated the strong anti-oxidant capacity of DOP, and it was the same as the report [28]. In our previous study, we had certified that DOP could promote NRF2 into the nucleus and increase downstream anti-oxidant enzyme capacity [13].
Enterolactone is a bioactive phenolic metabolite known as a mammalian lignan derived from dietary lignans. It has been reported that enterolactone exhibited anti-cancer properties against breast cancer [29], ovarian cancer [30], prostate cancer [31], and lung cancer [32]. It also had a clear role in preventing cancer progression at different stages, reducing risk, decreasing the mortality rate and improving overall survival [33]. The data showed that the height value of Enterolactone was decreased in the PLGC model, and increased after administering DOP, this result indicated the inhibition of DOP on the PLGC model maybe due to its prevention of cancer progression.
Other endogenous metabolites that have no relationship with cancer, gastric cancer, and polysaccharides, were imidazolelactic acid, 5′-Deoxyadenosine, Methoxytyramine, Proline betaine, l-leucyl-l-proline. Imidazolelactic acid is the component of normal human urine, histidine loading causes an increase in the excretion of imidazolelactic acid. Urinary excretion of imidazolelactic acid is also an indication for folic acid and vitamin B12 deficiency. Histidine deficiency attenuates cell viability in rat intestinal epithelial cells by apoptosis via mitochondrial dysfunction [34]. In our experiment, the level of imidazolelactic acid was increased in the PLGC group, which was probably related to the high level of histidine. The 5′-Deoxyadenosine (5′-dAdo), which is a substrate for 5′-methylthioadenosine phosphorylase, was rapidly cleaved to adenine by cell-free, had been shown to have a number of biochemical effects on Ehrlich ascites cells [35]. Methoxytyramine, one of the O-methylated metabolites of catecholamines, was used to discriminate different hereditary forms of pheochromocytoma, which indicated that patients with MEN2 and NF1 genes presented with tumors characterized by increased plasma concentrations of metanephrine [36,37]. Proline betaine is known to act as an osmoprotectant in citrus fruit, alfalfa sprouts, molluscs, and bacteria. Proline betaine concentrations were reported to be higher in plasma and urine after orange juice consumption so it was regarded as a putative biomarker of citrus consumption [38]. l-leucyl-l-proline, also named Leucylproline, is a proteolytic breakdown product of larger proteins. It belongs to the family of Peptides [39]. 15,16-DiHODE is an oxygenated lipid found in human blood, which belongs to the main class of octadecanoids and the sub class of other octadecanoids [40]. These metabolites had no relationship with our experiment.

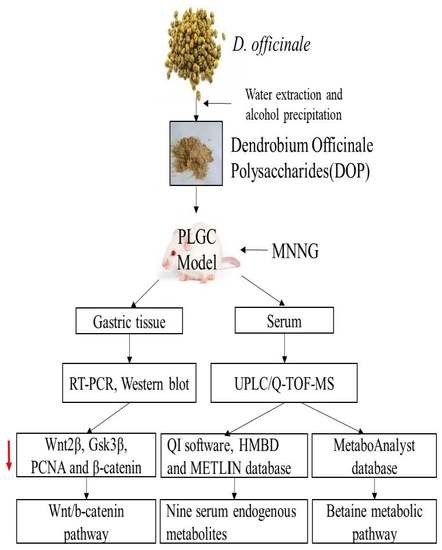
4. Material and Methods

4.1. Animals

Male Wistar rat (70 to 90 g) were purchased from Beijing Vital River Laboratory Animal Technology Co., Ltd. (Certificate No. SCXK 2015-0002, Beijing, China). The rats were fed in the standard experimental conditions (room temperature 23 ± 1 °C, relative humidity 55 ± 5%) with a 12 h light/dark cycle and received food and water. Before the experiment, the rats were adapted to the experimental environment for 1 week. The protocol for these experiments was approved by international ethical guidelines and the Institutional Animal Care and the Animal Ethics Committee of Jiangxi University of Traditional Chinese Medicine.

4.2. Drugs and Reagents

Dendrobium officinale extraction (DOE) was purchased from Zhejiang Shou Xian Valley Medical Limited by Share Ltd. (Jinhua, Zhejiang, China), the fresh D. officinale added 20 fold volume of water and extracted 2 h one time, after filtration then evaporated. This process was repeated three times. In the end, formed the water extraction (DOE) [41]. The DOE was added 5 times 95% alcohol and mixed, after keeping 24 h, the mixture was centrifuged at 4000 rpm for 15 min and the supernatant was removed. This process was repeated twice. The precipitate was then washed sequentially with ethanol and acetone then fully dissolved with 80% ethanol. In the end, the precipitate was dried to dry powder and formed crude DOP. The polysaccharide content is 83%, which was determined by phenol-sulfuric acid; the molecular weight, which was detected by High-Performance Gel-Permeation Chromatography (HPGPC), was 3500 and 1,000,000. This protocol of preparation and content of DOP was reported before [13]. The gel chromatography column used (TSK-gel, G4000PWXL, 7.8 mm × 300 mm) was obtained from TOSOH (TOSOH, Tokyo, Japan). Total RNA Extraction Kit and Reverse Transcription PCR kits were the products of the Promega Corporation (Promega, WI, USA). Fast Start Essential DNA Green Master was the product of Roche (Roche, Basel, Switzerland). Anti-Wnt2βantibody, Anti-CyclinD1, Anti-β-Catenin, Anti-PCNA antibody, and Anti-β-Actin were all purchased from Abcam Company (Abcam, Cambridge, Britain).

4.3. Inhibition Effects of DOP on PLGC in Rats

Sixty male rats were randomly divided into five groups: A, the CTRL group (the normal rats were administered with free water and diet); B, the PLGC model group (PLGC) (The rats were given 150 μg/mL MNNG in drinking water for 7 months and given 0.1 mL of 10% NaCl once weekly during the initial 20 weeks, which regarded as PLGC model [42,43]); C–E, the PLGC model were administered with 9.6, 4.8, 2.4 g/kg mg/kg/day DOP, respectively (L-DOP, M-DOP and H-DOP), and they were administered DOP 2 weeks earlier before starting the PLGC model (Figure 8). The body weight of the rats were recorded every week. After seven months, all animals were sacrificed by intraperitoneal injection of Thiopental. The serum from the inferior vena cava was collected in a tube and centrifuged at 3000 rpm at 4 °C for 10 min. The stomach was opened along the greater curvature on ice, then divided into three parts for histological study, RT-PCR, and Western Blot Analysis.

4.4. Immunohistochemistry

4-μm thick sections were dewaxed with xylene and hydrated using sequential ethanol (100, 95, 85, and 75%) and distilled water. Antigen retrieval was performed by heating sections in 0.01 M sodium citrate buffer (pH 6.0). Tissue slides were incubated overnight with β-catenin antibody (dilution 1:1000) at 4 °C, and then immunostained with secondary antibodies. Sections were incubated with 3, 3′-diaminobenzidine (DAB) to produce a brown product and counterstained with hematoxylin. The positive staining was evaluated. Five fields of view were randomly selected for each slice under a 400-fold microscope (Nikon, Tokyo, Japan). Image Pro Plus 6.0 software (Media Cybernetics, Rockville, MD, USA) was used to mean density analysis.

4.5. Total RNA Extraction and Quantitative Real-Time RT-PCR

The total RNA samples were obtained from stomach tissues using Eastep® Super Total RNA Extraction Kit (Promege) following the manufacturer’s protocol. The purity of the extracted RNA was quantified by Nanodrop 2000 (Thermo Scientific, Waltham, MA, USA), and then the RNA samples were transcribed into cDNA using GoScript™ Reverse Transcription System (Promege) following the manufacturer’s instructions. The sequences of the primers (Sangon Biotech, Shanghai, China) are shown in Table S1. β-actin was used as a reference standard. Subsequently, RT-P CR were done by using Fast Start Essential DNA Green Master (Roche, Switzerland). The conditions for RT-PCR were 95 °C (10 min; preheating), 40 cycles of thermal cycle (95 °C, 10 s; 55 °C–60 °C, 30 s; 72 °C, 10 s), melt curve (95 °C, 10 s; 65 °C, 60 s). The relative expression for a particular gene was calculated using the Ct method, a comparative 2−ΔΔCT method. The mean value of individual animals was calculated and changed in the number of folds in comparison to veh/veh was noted.

4.6. Western Blot Analysis

The total protein samples from stomach tissues were extracted following standard protocols according to the manufacturer’s protocol (Beyotime Biotechnology, shanghai, China) and the protein content was determined using the BCA protein assay kit (cwbiotech, Beijing, China). Proteins were subjected to SDS-PAGE (10–15%) and then were transferred to PVDF membranes (Millipore, Burlington, MA, USA). After blocking nonspecific binding sites with 5% dried skim milk, the membranes were incubated overnight at 4 °C with primary antibodies. The blots were incubated with horseradish peroxidase-conjugated antibodies for 2 h at room temperature and detection and imaging were performed using an enhanced chemiluminescence system and a ChemiDoc™ XRS Imaging System (Bio-Rad Laboratories, Hercules, CA, USA). Intensity values expressed as the relative protein expression were normalized to β-actin.

4.7. Preparation of Plasm and UPLC/Q-TOF-MS Analysis

200 μL serum was mixed with 800 μL methanol and acetonitrile with the ratio of 1:9 and vortexed 2 min, then placed 3 h in 4 °C. After centrifugation at 13,000 rpm in 4 °C for 10 min, the supernatant was dried with nitrogen and reconstituted in 400 μL 15% methanol, vortexed 1 min again and centrifugation at 13,000 rpm in 4 °C for 10 min. Chromatographic separation was performed on an Acquity BEH C18 UPLC column (1.7 μM, 2.1 × 100 mm; Waters, Milford, MA, USA) at 40 °C with a flowrate of 0.3 mL·min−1, and the sample chamber temperature was 10 °C. The mobile phase was composed of acetonitrile (A) and water containing 0.1 % formic acid (Sigma-Aldrich, MO, USA) (B), The optimized UPLC elution conditions were 1–4.5 min, 1–56% B; 4.5–10 min, 56–100% B; 10–12 min, 100% B; 12–20 min, 100–90%, 20–22 min, 90–1%. The injection volume was 1 μL.
The mass spectra were acquired in both negative and positive modes by using A SYNAPY G2 high-definition mass spectrometer (Waters, Manchester, USA), and under the following conditions: capillary voltage, 2.8–3.0 kV; sample cone voltage, 40 V; extraction cone voltage, 80 V; scan time was set to 0–13 min; data were collected from m/z 50–1000 Da. The nitrogen gas desolation rate was set to 800 L/h at 400 °C; the cone gas rate was 50 L/h; and the source temperature was 100 °C. In order to ensure accuracy and repeatability, the standard curve was established by using sodium formate, Leucine-enkephalin (Waters, Manchester, USA) was used as the lock mass generating [M + H]+ (m/z 556.2771) to ensure accuracy during MS analysis and dynamic range enhancement was applied. The tandem mass spectrometer with a low collision energy was 4 eV and a high collision energy was 20 to 40 eV. Data acquisition and processing were performed using Mass Lynx v.4.1 (Waters, Milford, MA, USA).

4.8. Metabolomics Data Analysis

The data extracted from the metabolite information includes retention time, exact mass and abundance, and then was imported into QI software for data processing. The ion peaks were aligned using retention time and accurate mass, and the retention time deviation was ±0.1 min and the mass deviation was ±5 ppm. After the component identification was completed, the identified data was imported into the Ezinfo software for partial least squares-discriminant analysis (PLS-DA) analysis, and the components with VIP greater than 1.0 were filtered out. Endogenous metabolites were initially identified from the Human Metabolome Database. The METLIN Metabolomics Database was used to analyze the secondary fragment map of the component. Student’s t-test was used for SPSS 20.0 (Chicago, IL, USA) to evaluate the significant differences of potential biomarkers. The MetaboAnalyst 3.0 (http://www.metaboanalyst.ca/) database was used for metabolic pathway analysis.

5. Conclusions

The present results show that DOP could effectively inhibit the Wnt/β-catenin pathway. Meanwhile, DOP could notably regulate the nine endogenous metabolites in the PLGC rat model and the most significant one is betaine because of its strong antioxidant activity, which leads to an anti-tumor effect.

Supplementary Materials

The following are available online, Figure S1. The total serum ion map in positive and negative mode. Table S1. RT-PCR primer sequences. Figure S2. The Western blot analysis of other two samples.

Author Contributions

Y.Z. and H.L. designed the study. Y.Z. drafted the manuscript. B.L. did the UPLC/Q-TOF-MS analysis; G.W., S.G. and X.L. performed the experiments. G.X. commented and revised the manuscript.

Funding

This study was supported by grants from the National Natural Science Foundation of China (81860777), Chinese Medicine Science and Technology Project of Jiangxi Provincial Department of Health (2018A339) and JiangXi Provincial First-Class Discipline (JXSYLXK-ZHYAO113). We appreciate staff scientist Tong Rui Liu from Winship Cancer Institute of Emory University, for her English language proofreading to improve the content of the manuscript.

Conflicts of Interest

The authors declare that there is no conflict of interest.

Abbreviations

PLGCPrecancerous lesions of gastric cancer
TCMTraditional Chinese medicine
DOPDendrobium officinale polysaccharides
MNNG1-Methyl-2-nitro-1-nitrosoguanidine
HPGPCHigh-Performance Gel-Permeation Chromatography
UPLC/Q-TOF-MSUltra-performance liquid chromatography-quadrupole-time-of-flight-mass spectrometry
PLS-DAPartial least squares discriminant analysis
Wnt2βWnt Family Member 2B
Gsk3βGlycogen Synthase Kinase 3 Beta
PCNAProliferating Cell Nuclear Antigen
β-cateninCatenin beta 1
CyclinD1G1/S-Specific Cyclin D1
DAB3,3′-diaminobenzidine

References

  1. Bray, F.; Ferlay, J.; Soerjomataram, I.; Siegel, R.L.; Torre, L.A.; Jemal, A. Global cancer statistics 2018: GLOBOCAN estimates of incidence and mortality worldwide for 36 cancers in 185 countries. CA Cancer J. Clin. 2018, 68, 394–424. [Google Scholar] [CrossRef] [PubMed] [Green Version]
  2. Leung, W.K.; Sung, J.J. Review article: Intestinal metaplasia and gastric carcinogenesis. Aliment Pharmacol Ther. 2002, 16, 1209–1216. [Google Scholar] [CrossRef] [PubMed]
  3. Malik, T.H.; Sayahan, M.Y.; Al, A.H.; Hong, X. Gastric Intestinal Metaplasia: An Intermediate Precancerous Lesion in the Cascade of Gastric Carcinogenesis. J. Coll. Physicians Surg. Pak. 2017, 27, 166–172. [Google Scholar] [PubMed]
  4. Heo, S.H.; Jeong, E.S.; Lee, K.S.; Seo, J.H.; Jeong, D.G.; Won, Y.S.; Kwon, H.J.; Kim, H.C.; Kim, D.Y.; Choi, Y.K. Canonical Wnt signaling pathway plays an essential role in N-methyl-N-nitrosurea induced gastric tumorigenesis of mice. J. Vet. Med. Sci. 2013, 75, 299–307. [Google Scholar] [CrossRef] [PubMed]
  5. Oliveira, L.A.; Oshima, C.; Soffner, P.A.; Silva, M.S.; Lins, R.R.; Malinverni, A.; Waisberg, J. The canonal Wnt pathway in gastric carcinoma. Arq. Bras. Cir. Dig. 2019, 32, e1414. [Google Scholar] [CrossRef]
  6. Liesenfeld, D.B.; Habermann, N.; Owen, R.W.; Scalbert, A.; Ulrich, C.M. Review of mass spectrometry–based metabolomics in cancer research. Canc. Epidemiol. Biomarkers Prev. 2013, 22, 2182–2201. [Google Scholar] [CrossRef] [PubMed]
  7. Zhang, A.; Sun, H.; Wang, X. Serum metabolomics as a novel diagnostic approach for disease: A systematic review. Anal. Bioanal. Chem. 2012, 404, 1239–1245. [Google Scholar] [CrossRef]
  8. Yan, M.; Xu, G. Current and future perspectives of functional metabolomics in disease studies—A review. Anal. Chim. Acta 2018, 1037, 41–54. [Google Scholar] [CrossRef]
  9. Slupsky, C.M.; Steed, H.; Wells, T.H.; Dabbs, K.; Schepansky, A.; Capstick, V.; Faught, W.; Sawyer, M.B. Urine metabolite analysis offers potential early diagnosis of ovarian and breast cancers. Clin. Cancer Res. 2010, 16, 5835–5841. [Google Scholar] [CrossRef]
  10. Zhao, Y.; Liu, Y.; Lan, X.M.; Xu, G.L.; Sun, Y.Z.; Li, F.; Liu, H.N. Effect of Dendrobium officinale Extraction on Gastric Carcinogenesis in Rats. Evid. Based Complement. Alternat. Med. 2016, 2016, e19647. [Google Scholar] [CrossRef]
  11. Wang, G.Y.; Liu, H.N.; Ge, S.C.; Jiang, Y.N.; Zhao, Y. Urine metabolomics analysis of Dendrobium Officinale water extraction on precancerous lesions of gastric cancer. Chin. J. Exp. Tradit. Med. Formul. 2018, 24, 77–85. [Google Scholar]
  12. Zhu, C.; Huang, Q.; Zhu, H. Melatonin Inhibits the Proliferation of Gastric Cancer Cells Through Regulating the miR-16-5p-Smad3 Pathway. DNA Cell Biol. 2018, 37, 244–252. [Google Scholar] [CrossRef] [PubMed]
  13. Zhao, Y.; Sun, Y.; Wang, G.; Ge, S.; Liu, H. Dendrobium Officinale Polysaccharides Protect against MNNG-Induced PLGC in Rats via Activating the NRF2 and Antioxidant Enzymes HO-1 and NQO-1. Oxid. Med. Cell. Longev. 2019. [Google Scholar] [CrossRef] [PubMed]
  14. Yoo, N.J.A.K. Mutational Analysis of WTX Gene in Wnt/beta-Catenin Pathway in Gastric, Colorectal, and Hepatocellular Carcinomas. Dig Dis Sci. 2009, 54, 1011–1014. [Google Scholar] [CrossRef] [PubMed]
  15. Song, X.; Xin, N.; Wang, W.; Zhao, C. Wnt/beta-catenin, an oncogenic pathway targeted by H. pylori in gastric carcinogenesis. Oncotarget 2015, 6, 35579–35588. [Google Scholar] [CrossRef] [PubMed]
  16. Zhang, Z.; Wang, J.; Dong, X. Wnt2 contributes to the progression of gastric cancer by promoting cell migration and invasion. Oncol. Lett. 2018, 16, 2857–2864. [Google Scholar] [CrossRef] [PubMed]
  17. Tsukamoto, T.; Yamamoto, M.; Ogasawara, N.; Ushijima, T.; Nomoto, T.; Fujita, H.; Matsushima, T.; Nozaki, K.; Cao, X.; Tatematsu, M. beta-Catenin mutations and nuclear accumulation during progression of rat stomach adenocarcinomas. Cancer Sci. 2003, 94, 1046–1051. [Google Scholar] [CrossRef]
  18. Takasu, S.; Tsukamoto, T.; Ushijima, T.; Yamashita, S.; Ogasawara, N.; Ban, H.; Yanai, T.; Masegi, T.; Tatematsu, M. Cyclin D1 overexpression in N-methyl-N′-nitro-N-nitrosoguanidine-induced rat gastric adenocarcinomas. Exp. Toxicol. Pathol. 2007, 59, 171–175. [Google Scholar] [CrossRef]
  19. Bo Peng, H.L.X.P. Functional metabolomics: From biomarker discovery to metabolome reprogramming. Protein Cell. 2015, 9, 628–637. [Google Scholar] [CrossRef]
  20. Corona, G.; Cannizzaro, R.; Miolo, G.; Caggiari, L.; De Zorzi, M.; Repetto, O.; Steffan, A.; De Re, V. Use of Metabolomics as a Complementary Omic Approach to Implement Risk Criteria for First-Degree Relatives of Gastric Cancer Patients. Int. J. Mol. Sci. 2018, 19, 750. [Google Scholar] [CrossRef]
  21. Gu, J.; Hu, X.; Shao, W.; Ji, T.; Yang, W.; Zhuo, H.; Jin, Z.; Huang, H.; Chen, J.; Huang, C.; et al. Metabolomic analysis reveals altered metabolic pathways in a rat model of gastric carcinogenesis. Oncotarget 2016, 7, 60053–60073. [Google Scholar] [CrossRef] [PubMed] [Green Version]
  22. Craig, S.A. Betaine in human nutrition. Am. J. Clin. Nutr. 2004, 80, 539–549. [Google Scholar] [CrossRef] [PubMed] [Green Version]
  23. Xia, Y.; Chen, S.; Zhu, G.; Huang, R.; Yin, Y.; Ren, W. Betaine Inhibits Interleukin-1beta Production and Release: Potential Mechanisms. Front. Immunol. 2018, 9, 2670. [Google Scholar] [CrossRef] [PubMed]
  24. Wang, H.; Li, S.; Fang, S.; Yang, X.; Feng, J. Betaine Improves Intestinal Functions by Enhancing Digestive Enzymes, Ameliorating Intestinal Morphology, and Enriching Intestinal Microbiota in High-salt stressed Rats. Nutrients 2018, 10, 907. [Google Scholar] [CrossRef] [PubMed]
  25. Du, Y.P.; Peng, J.S.; Sun, A.; Tang, Z.H.; Ling, W.H.; Zhu, H.L. Assessment of the effect of betaine on p16 and c-myc DNA methylation and mRNA expression in a chemical induced rat liver cancer model. BMC Cancer 2009, 9, 261. [Google Scholar] [CrossRef]
  26. Betancor-Fernandez, A.; Sies, H.; Stahl, W.; Polidori, M.C. In vitro antioxidant activity of 2,5,7,8-tetramethyl-2-(2′-carboxyethyl)-6-hydroxychroman (alpha-CEHC), a vitamin E metabolite. Free Radic. Res. 2002, 36, 915–921. [Google Scholar] [CrossRef]
  27. Galli, F.; Stabile, A.M.; Betti, M.; Conte, C.; Pistilli, A.; Rende, M.; Floridi, A.; Azzi, A. The effect of alpha- and gamma-tocopherol and their carboxyethyl hydroxychroman metabolites on prostate cancer cell proliferation. Arch. Biochem Biophys. 2004, 423, 97–102. [Google Scholar] [CrossRef]
  28. Luo, Q.L.; Tang, Z.H.; Zhang, X.F.; Zhong, Y.H.; Yao, S.Z.; Wang, L.S.; Lin, C.W.; Luo, X. Chemical properties and antioxidant activity of a water-soluble polysaccharide from Dendrobium officinale. Int. J. Biol. Macromol. 2016, 89, 219–227. [Google Scholar] [CrossRef]
  29. Mali, A.V.; Joshi, A.A.; Hegde, M.V.; Kadam, S.S. Enterolactone modulates the ERK/NF-kappaB/Snail signaling pathway in triple-negative breast cancer cell line MDA-MB-231 to revert the TGF-beta-induced epithelial-mesenchymal transition. Cancer Biol. Med. 2018, 15, 137–156. [Google Scholar]
  30. Liu, H.; Liu, J.; Wang, S.; Zeng, Z.; Li, T.; Liu, Y.; Mastriani, E.; Li, Q.H.; Bao, H.X.; Zhou, Y.J.; et al. Enterolactone has stronger effects than enterodiol on ovarian cancer. J. Ovarian Res. 2017, 10, 49. [Google Scholar] [CrossRef]
  31. Eriksen, A.K.; Kyro, C.; Norskov, N.; Bolvig, A.K.; Christensen, J.; Tjonneland, A.; Overvad, K.; Landberg, R.; Olsen, A. Prediagnostic enterolactone concentrations and mortality among Danish men diagnosed with prostate cancer. Eur. J. Clin. Nutr. 2017, 71, 1235–1240. [Google Scholar] [CrossRef] [PubMed]
  32. Chikara, S.; Lindsey, K.; Borowicz, P.; Christofidou-Solomidou, M.; Reindl, K.M. Enterolactone alters FAK-Src signaling and suppresses migration and invasion of lung cancer cell lines. BMC Complement. Altern. Med. 2017, 17, 30. [Google Scholar] [CrossRef] [PubMed]
  33. Mali, A.V.; Padhye, S.B.; Anant, S.; Hegde, M.V.; Kadam, S.S. Anticancer and antimetastatic potential of enterolactone: Clinical, preclinical and mechanistic perspectives. Eur. J. Pharmacol. 2019, 852, 107–124. [Google Scholar] [CrossRef] [PubMed]
  34. Matsui, T.; Ichikawa, H.; Fujita, T.; Takagi, T.; Osada-Oka, M.; Minamiyama, Y. Histidine deficiency attenuates cell viability in rat intestinal epithelial cells by apoptosis via mitochondrial dysfunction. J. Nutr. 2017, 8, 21–28. [Google Scholar] [CrossRef]
  35. Hunting, D.; Henderson, J.F. Effects of 5′-deoxyadenosine on phosphoribosyl pyrophosphate and purine nucleotide synthesis in Ehrlich ascites tumor cells in vitro. Biochem. Pharmacol. 1978, 27, 2163–2169. [Google Scholar] [CrossRef]
  36. Rao, D.; Peitzsch, M.; Prejbisz, A.; Hanus, K.; Fassnacht, M.; Beuschlein, F.; Brugger, C.; Fliedner, S.; Langton, K.; Pamporaki, C. Plasma Methoxytyramine: Clinical Utility with Metanephrines for Diagnosis of Pheochromocytoma and Paraganglioma. Eur. J. Endocrinol. 2017, 177, 103–113. [Google Scholar] [CrossRef] [PubMed]
  37. Eisenhofer, G.; Lenders, J.W.; Timmers, H.; Mannelli, M.; Grebe, S.K.; Hofbauer, L.C.; Bornstein, S.R.; Tiebel, O.; Adams, K.; Bratslavsky, G.; et al. Measurements of plasma methoxytyramine, normetanephrine, and metanephrine as discriminators of different hereditary forms of pheochromocytoma. Clin. Chem. 2011, 57, 411–420. [Google Scholar] [CrossRef] [PubMed]
  38. Heinzmann, S.S.; Brown, I.J.; Chan, Q.; Bictash, M.; Dumas, M.; Kochhar, S.; Stamler, J.; Holmes, E.; Elliott, P.; Nicholson, J.K. Metabolic profiling strategy for discovery of nutritional biomarkers: Proline betaine as a marker of citrus consumption. Am. J. Clin. Nutr. 2010, 92, 436–443. [Google Scholar] [CrossRef]
  39. Manjunatha, S.G.; Rajappa, S. From N-nitroacetylproline to leucylproline. J. Chem. Soc. Chem. Commun. 1991, 372–373. [Google Scholar] [CrossRef]
  40. Shearer, G.C.; Harris, W.S.; Pedersen, T.L.; Newman, J.W. Detection of omega-3 oxylipins in human plasma and response to treatment with omega-3 acid ethyl esters. J. Lipid Res. 2010, 51, 2074–2081. [Google Scholar] [CrossRef] [Green Version]
  41. Yi, Z.; Yan, L.; Lan, X.M.; Guo-Liang, X.U.; Liu, H.N. Study on inhibition of Dendrobium officinale extract on gastric carcinogenesis. Chin. Tradit. Herbal Drugs 2015, 46, 3704–3709. [Google Scholar]
  42. Yamachika, T.; Nakanishi, H.; Inada, K.; Tsukamoto, T.; Shimizu, N.; Kobayashi, K.; Fukushima, S.; Tatematsu, M. N-methyl-N-nitrosourea concentration-dependent, rather than total intake-dependent, induction of adenocarcinomas in the glandular stomach of BALB/c mice. Jpn. J. Cancer Res. 1998, 89, 385–391. [Google Scholar] [CrossRef] [PubMed]
  43. Takahashi, M.; Kokubo, T.; Furukawa, F.; Kurokawa, Y.; Tatematsu, M.; Hayashi, Y. Effect of high salt diet on rat gastric carcinogenesis induced by N-methyl-N′-nitro-N-nitrosoguanidine. Jpn. J. Cancer Res. 1983, 74, 28–34. [Google Scholar]
Sample Availability: Samples of the compounds are not available from the authors.
Figure 1. The protein expression of β-catenin in stomach tissues by immunohistochemistry (400 × original magnification). (A): The CTRL group: the normal rat were administered with free water and diet; (B): The rat were given 150 μg/mL 1-Methyl-2-nitro-1-nitrosoguanidine (MNNG) in drinking water for 7 months and given 0.1 mL of 10% NaCl once weekly during the initial 20 weeks, which was regarded as the PLGC model; (CE): The PLGC model were administered with 9.6, 4.8, 2.4 g/kg/day Dendrobium officinale polysaccharide (DOP), respectively, and they were administered DOP 2 weeks earlier before starting the PLGC model. (F): The intensity of β-catenin measured by Image J. Data was presented as mean ± SEM (n = 6). Statistical analyses were carried out by using one-way ANOVA and Tukey post-hoc test. ** p < 0.01 vs. CTRL; # p < 0.05 vs. PLGC model.
Molecules 24 02660 g001
Figure 2. The effect of DOP on Wnt2β, Gsk3β, PCNA, and β-catenin gene expression. Results from administering DOP 7 months on PLGC rat model. The relative expression for a particular gene was calculated by using Ct method, a comparative 2−ΔΔCT method. Data was presented as mean ± SEM (n = 6). Statistical analyses were carried out by using one-way ANOVA and Tukey post-hoc test. * p < 0.05, ** p < 0.01 and *** p < 0.001 vs. CTRL; # p < 0.05 and ## p < 0.01 vs. PLGC model.
Molecules 24 02660 g002
Figure 3. The effect of DOP on Wnt2β, PCNA and β-catenin protein expression ((A) the western blot bands; (BE) the relative level of Wnt2β, PCNA, β-catenin and CyclinD1). Results from administering DOP 7 months on PLGC rat model. The relative expression for protein was analyzed and calculated by using Image lab software. Data was presented as mean ± SEM (n = 3). Statistical analyses were carried out by using one-way ANOVA and Tukey post-hoc test. * p < 0.05, ** p < 0.01 and *** p < 0.001 vs. CTRL; # p < 0.05 and ## p < 0.01 vs. PLGC model.
Molecules 24 02660 g003
Figure 4. PLS-DA analysis between different groups in positive and negative ion pattern. After the component identification was completed, the identified data was imported into the Ezinfo software for partial least squares-discriminant analysis (PLS-DA) analysis, the circle showed that they tend to be grouped together in the PLS-DA analysis, and could be separated between each groups of observations, then cited there have the change in PLGC group (A,B). After treatment with DOP (C,D), the gather was changed, which indicated that the endogenous metabolites could be different from the PLGC group.
Molecules 24 02660 g004aMolecules 24 02660 g004b
Figure 5. The effect of DOP on height values of nine changing endogenous metabolites in each group under positive and negative ion mode. Results from administering DOP 7 months on PLGC rat model: the compound was analyzed in the serum by UPLC/Q-TOF-MS and then selected variables with a VIP > 1.0 and p < 0.05 and that compound was regarded as potential biomarkers for further statistical analysis. Statistical analyses were carried out by using one-way ANOVA and Tukey post-hoc test. * p < 0.05, *** p < 0.001 vs. the CTRL; # p < 0.05, ## p < 0.01 and ### p < 0.001 vs. the PLGC model.
Molecules 24 02660 g005
Figure 6. To confirm the compound by two stages mass spectrometry analysis. Taking the metabolite m/z 252.1095 as an example, the first stage of mass spectrometry (MS1) is 252.1095 and second stage of mass spectrometry (MS2) is 136.0612 (A), next to compare with the METLIN metabolomics database, the MS2 136.0612 was also appeared (B), and then confirmed the MS1 of this compound was 252.1095. Student’s t-test was used for statistical analysis to evaluate significant differences of endogenous metabolites. (A): Two stages mass spectrometry of the sample; (B): Two stages mass spectrometry from the database.
Molecules 24 02660 g006
Figure 7. The effect of DOP on the metabolites pathway. By uploading the nine endogenous metabolites to the MetaboAnalyst software, metabolite enrichment analysis could be conducted.
Molecules 24 02660 g007
Figure 8. The diagrammatic sketch of the experiment.
Molecules 24 02660 g008
Table 1. Preliminary identification results of endogenous metabolites in plasma of rats in each group.
Ion ModelRetention Time (min)M/ZComponent IDMolecular FormulaComponent NameP Value
Positive9.521235.1691HMDB00043C5H11NO2Betaine2.48 × 10−10
10.305395.2206HMDB04063C10H15NO3Metanephrine1.21 × 10−11
6.889299.1313HMDB06101C18H18O4Enterolactone0.000245555
2.431252.1095HMDB01983C10H13N5O35′-Deoxyadenosine0.0000987
1.168144.1020HMDB04827C7H13NO2Proline betaine0.011885662
4.556157.0608HMDB02320C6H8N2O3Imidazolelactic acid0.000000336
Negative3.679227.1416HMDB11175C11H20N2O3L-leucyl-L-proline1.32 × 10−9
6.989311.2237HMDB10208C18H32O415,16-DiHODE0.000509626
4.920277.1455HMDB01518C16H22O4Alpha-CEHC0.00000215
Table 2. Enrichment analysis of metabolites.
Pathway NameTotalExpectedHitsRaw pHolm pFDR
Betaine Metabolism100.10910.10511
Methionine Metabolism240.26210.23511
Glycine, Serine and Threonine Metabolism260.28410.25211
Tyrosine Metabolism380.41510.34811

