
Comprehensive Characterization of Lignans from Forsythia viridissima by UHPLC-ESI-QTOF-MS, and Their NO Inhibitory Effects on RAW 264.7 Cells

 , ,
, , 
Abstract
1. Introduction
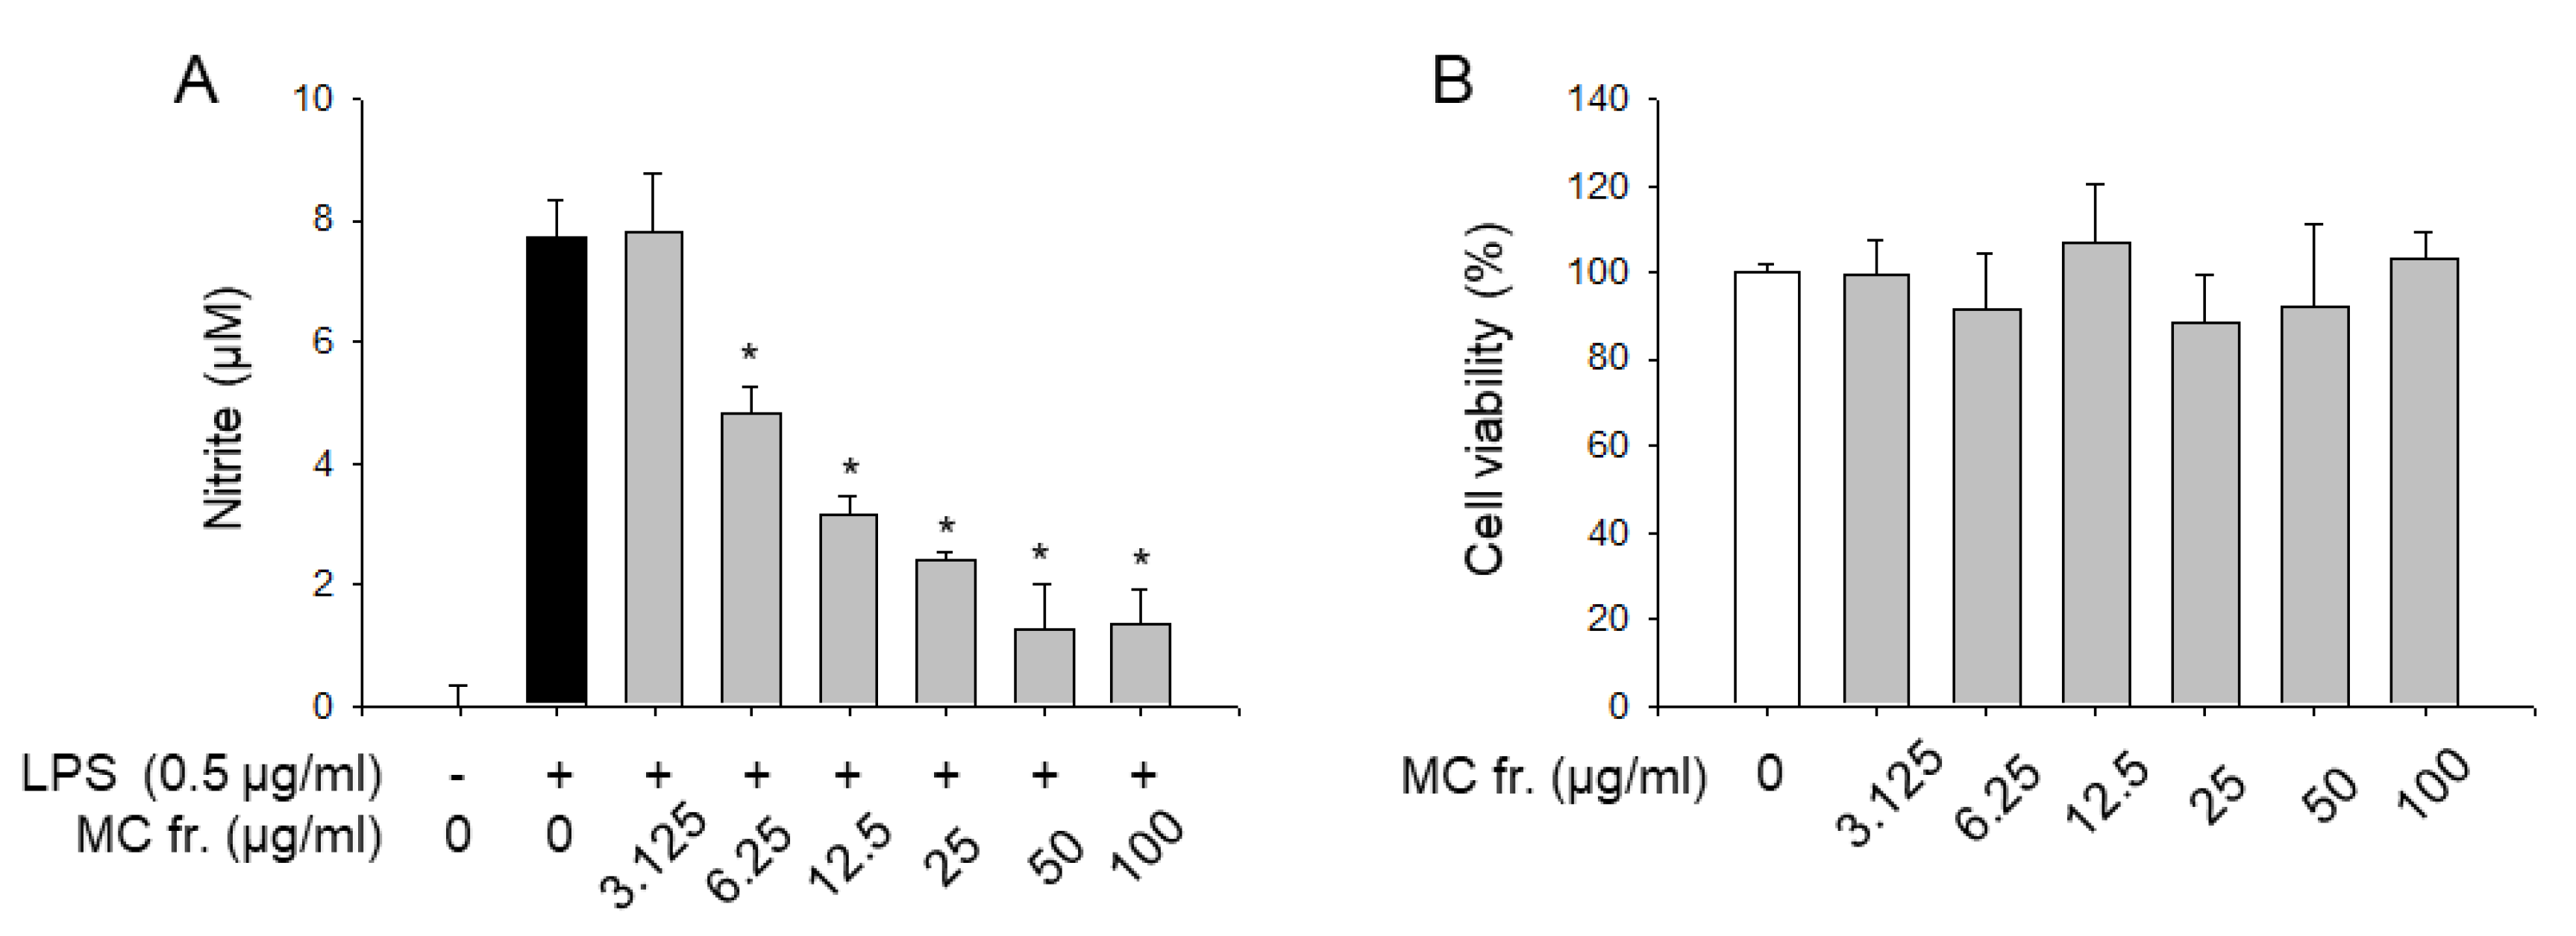
2. Results and Discussion
HR-MS Characterization of Lignan and Lignan Glycosides
3. Materials and Methods
3.1. Plant Materials
3.2. Chemicals and Reagents
3.3. Chromatographic Profiling of the Compounds Present in F. viridissima Subfractions
3.4. Cell Culture
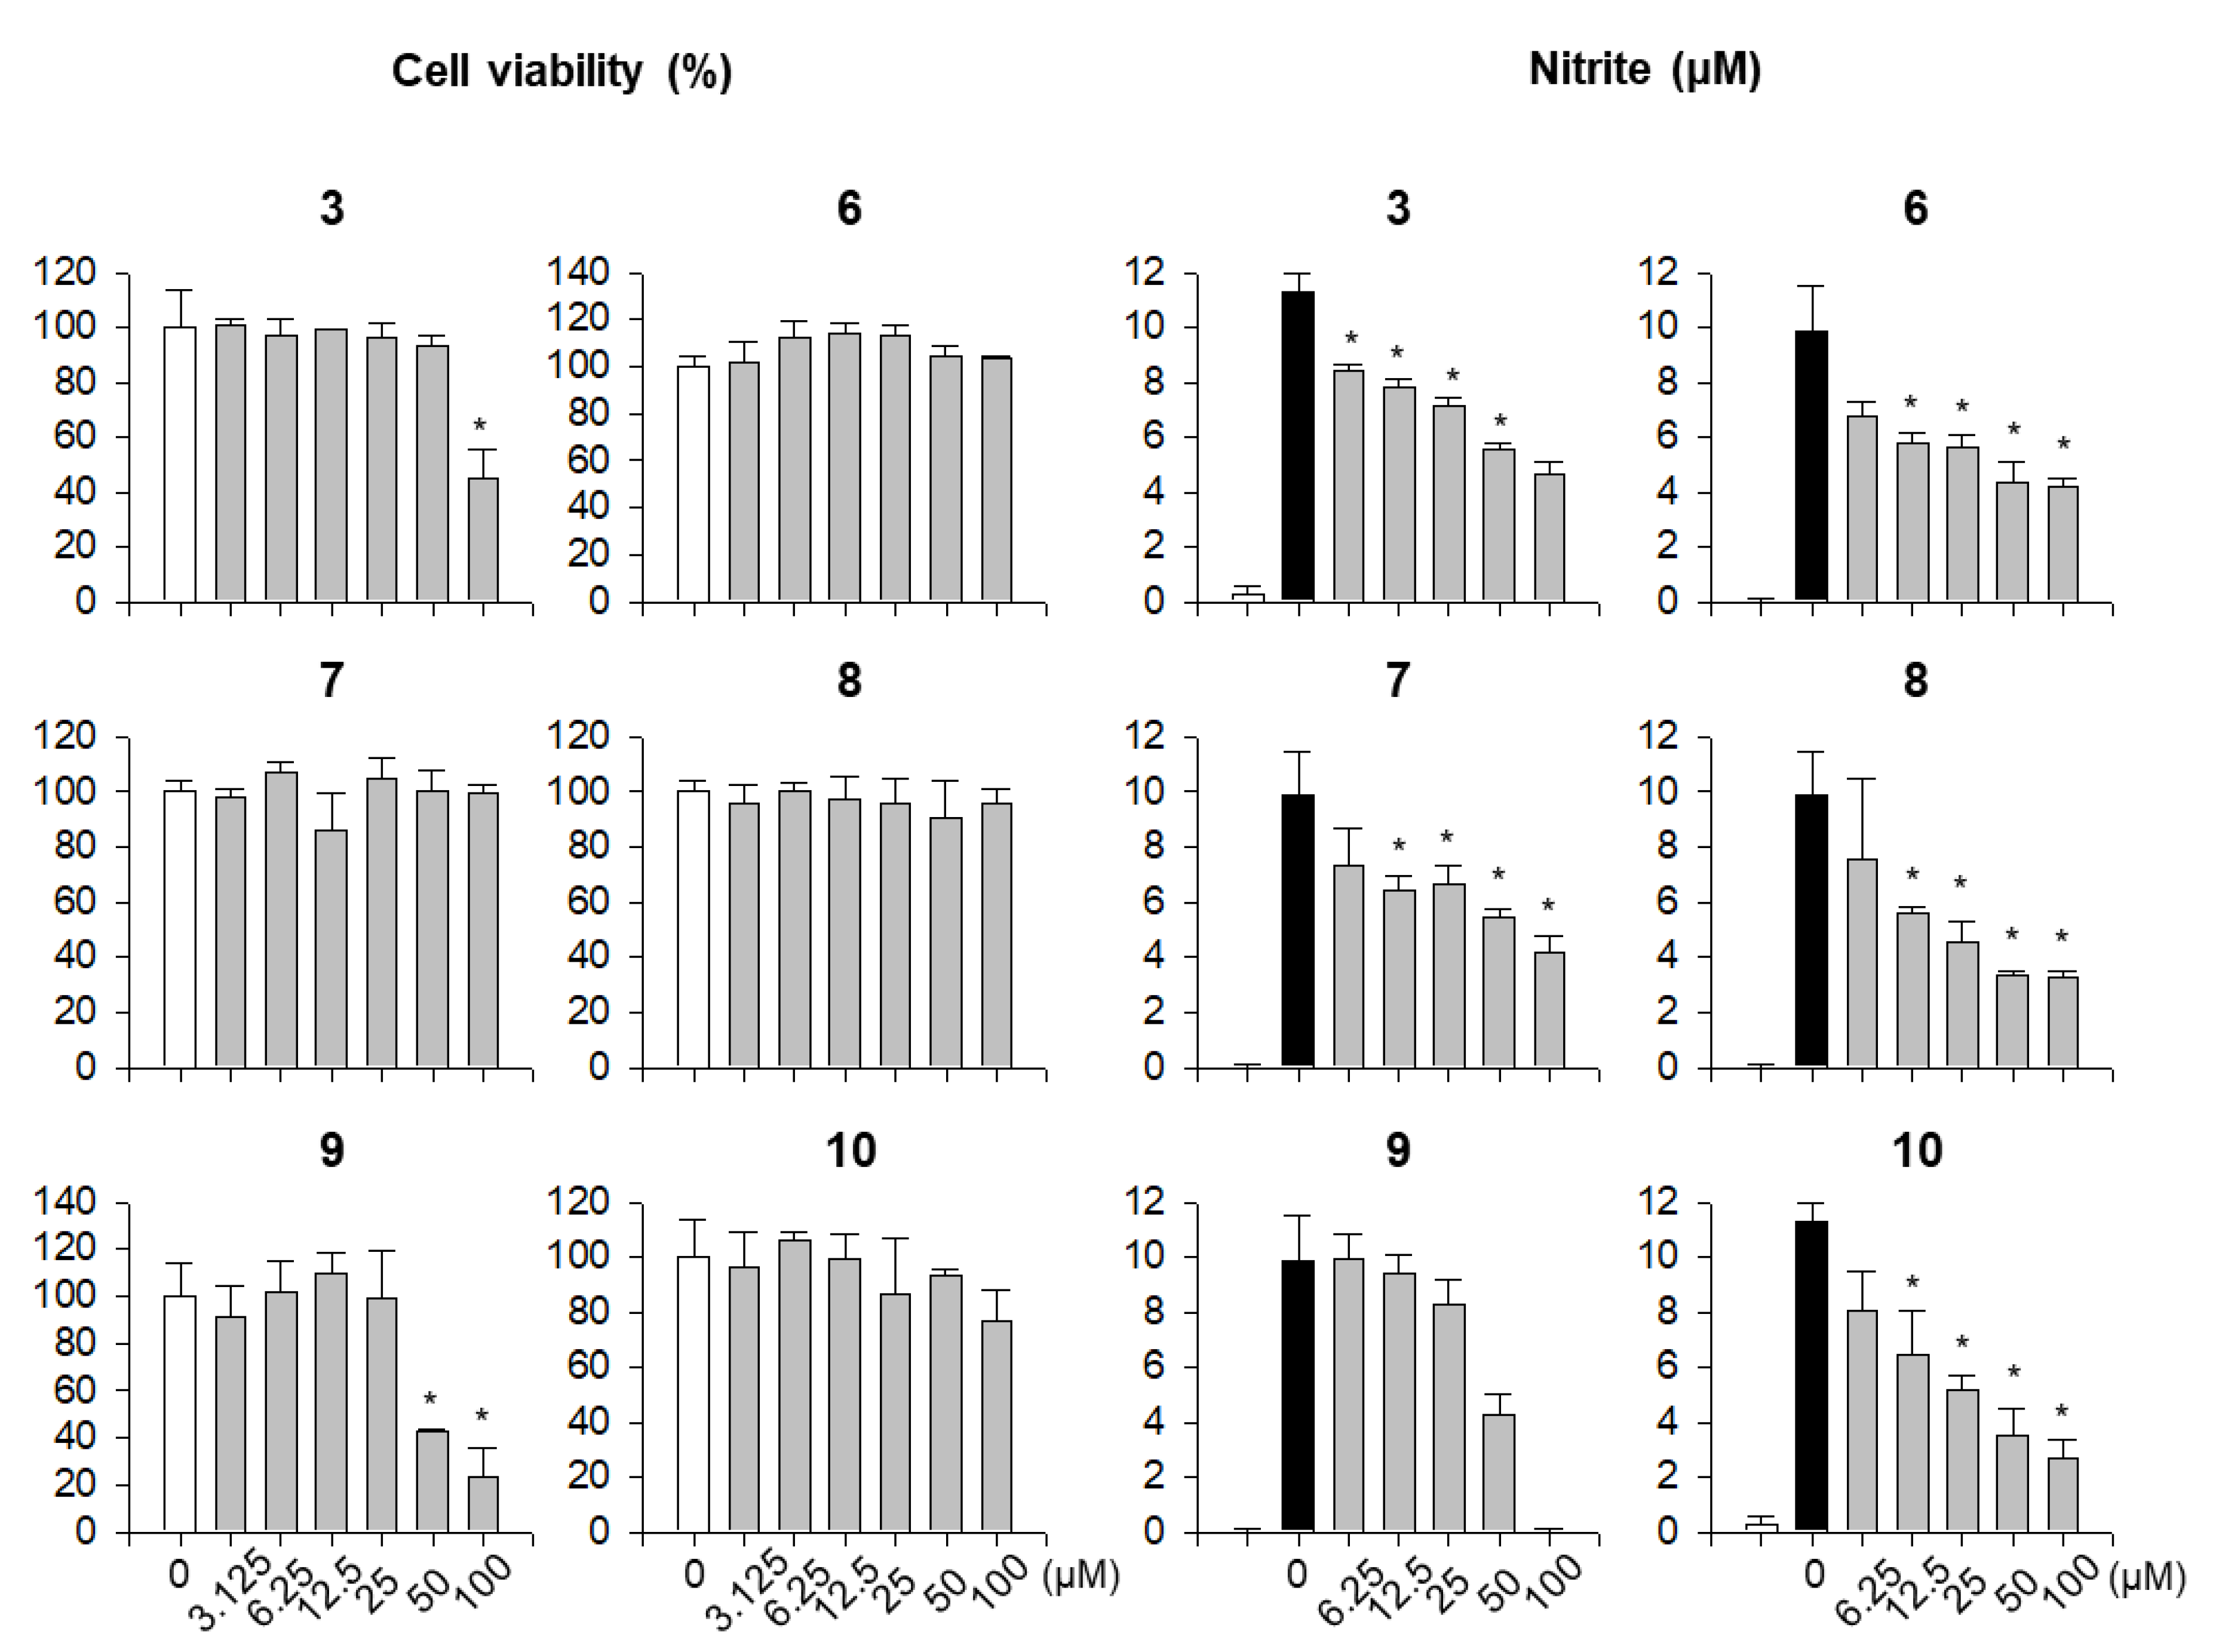
3.5. Cell Viability Assay
3.6. Nitrite Assay
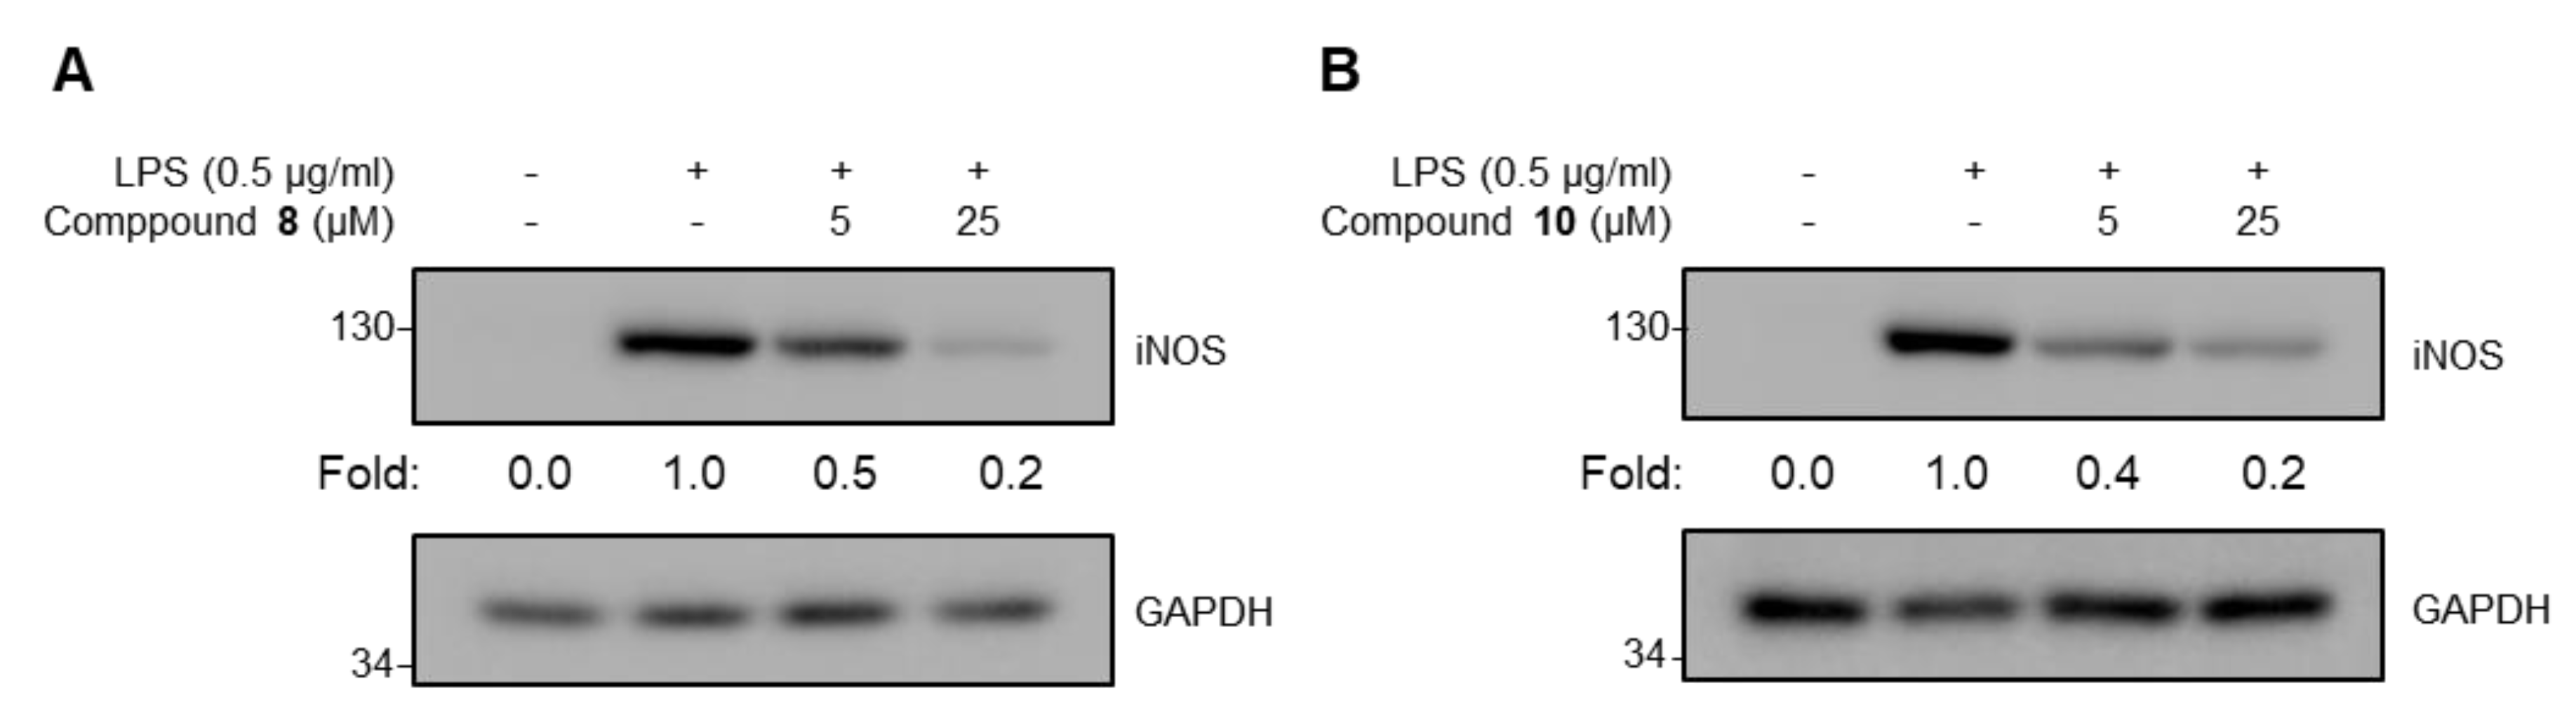
3.7. Immunoblotting
3.8. Statistical Analysis and Experimental Replicates
Supplementary Materials
Author Contributions
Funding
Acknowledgments
Conflicts of Interest
References
- Jones, B.W.; Means, T.K.; Heldwein, K.A.; Keen, M.A.; Hill, P.J.; Belisle, J.T.; Fenton, M.J. Different Toll-like receptor agonists induce distinct macrophage responses. J. Leukoc. Biol. 2001, 69, 1036–1044. [Google Scholar] [PubMed]
- Laskin, D.L.; Pendino, K.J. Macrophages and inflammatory mediators in tissue injury. Annu. Rev. Pharmacol. Toxicol. 1995, 35, 655–677. [Google Scholar] [CrossRef] [PubMed]
- MacMicking, J.; Xie, Q.W.; Nathan, C. Nitric oxide and macrophage function. Annu. Rev. Immunol. 1997, 15, 323–350. [Google Scholar] [CrossRef] [PubMed]
- Szabo, C.; Thiemermann, C. Regulation of the expression of the inducible isoform of nitric oxide synthase. Adv. Pharmacol. 1995, 34, 113–153. [Google Scholar] [PubMed]
- Guadagni, F.; Ferroni, P.; Palmirotta, R.; Portarena, I.; Formica, V.; Roselli, M. TNF/VEGF cross-talk in chronic inflammation-related cancer initiation and progression: An early target in anticancer therapeutic strategy. In Vivo 2007, 21, 147–161. [Google Scholar] [PubMed]
- Kroncke, K.D.; Fehsel, K.; Kolb-Bachofen, V. Inducible nitric oxide synthase in human diseases. Clin. Exp. Immunol. 1998, 113, 147–156. [Google Scholar] [CrossRef] [PubMed]
- Nishimoto, N.; Kishimoto, T. Interleukin 6: From bench to bedside. Nat. Clin. Pract. Rheumatol. 2006, 2, 619–626. [Google Scholar] [CrossRef] [PubMed]
- Dinarello, C.A. Anti-inflammatory Agents: Present and Future. Cell 2010, 140, 935–950. [Google Scholar] [CrossRef] [PubMed]
- Nishibe, S. The plant origins of herbal medicines and their quality evaluation. Yakugaku Zasshi 2002, 122, 363–379. [Google Scholar] [CrossRef] [PubMed]
- Lee, J.H.; Lee, J.Y.; Kim, T.D.; Kim, C.J. Antiasthmatic action of dibenzylbutyrolactone lignans from fruits of Forsythia viridissima on asthmatic responses to ovalbumin challenge in conscious guinea-pigs. Phytother. Res. 2011, 25, 387–395. [Google Scholar] [CrossRef] [PubMed]
- Lee, J.Y.; Moon, H.; Kim, C.J. Effects of hydroxy pentacyclic triterpene acids from Forsythia viridissima on asthmatic responses to ovalbumin challenge in conscious guinea pigs. Biol. Pharm. Bull. 2010, 33, 230–237. [Google Scholar] [CrossRef] [PubMed]
- Ozaki, Y.; Rui, J.; Tang, Y.T. Antiinflammatory effect of Forsythia suspensa Vahl and its active principle. Biol. Pharm. Bull. 2000, 23, 365–367. [Google Scholar] [CrossRef] [PubMed]
- Dong, Z.; Lu, X.; Tong, X.; Dong, Y.; Tang, L.; Liu, M. Forsythiae Fructus: A Review on its Phytochemistry, Quality Control, Pharmacology and Pharmacokinetics. Molecules 2017, 22, e1466. [Google Scholar] [CrossRef] [PubMed]
- Gao, Q.; Yang, M.; Zuo, Z. Overview of the anti-inflammatory effects, pharmacokinetic properties and clinical efficacies of arctigenin and arctiin from Arctium lappa L. Acta Pharmacol. Sin. 2018, 39, 787–801. [Google Scholar] [CrossRef] [PubMed]
- Yang, Y.N.; Huang, X.Y.; Feng, Z.M.; Jiang, J.S.; Zhang, P.C. New butyrolactone type lignans from Arctii Fructus and their anti-inflammatory activities. J. Agric. Food Chem. 2015, 63, 7958–7966. [Google Scholar] [CrossRef] [PubMed]
- Huh, J.; Song, J.H.; Kim, S.R.; Cho, H.M.; Ko, H.J.; Yang, H.; Sung, S.H. Lignan dimers from Forsythia viridissima roots and Their antiviral effects. J. Nat. Prod. 2019, 82, 232–238. [Google Scholar] [CrossRef] [PubMed]
- Schmidt, T.J.; Hemmati, S.; Fuss, E.; Alfermann, A.W. A combined HPLC-UV and HPLC-MS method for the identification of lignans and its application to the lignans of Linum usitatissimum L. and L. bienne Mill. Phytochem. Anal. 2006, 17, 299–311. [Google Scholar] [CrossRef] [PubMed]
- Schmidt, T.J.; Alfermann, A.W.; Fuss, E. High-performance liquid chromatography/mass spectrometric identification of dibenzylbutyrolactone-type lignans: Insights into electrospray ionization tandem mass spectrometric fragmentation of lign-7-eno-9,9’-lactones and application to the lignans of Linum usitatissimum L. (Common Flax). Rapid Commun. Mass Spectrom. 2008, 22, 3642–3650. [Google Scholar] [PubMed]
- Griess, P. Bemerkungen zu der abhandlung der, H.H. Weselsky und Benedikt “Ueber einige azoverbindungen”. Ber. Deutsch. Chem. Ges. 1879, 12, 426–428. [Google Scholar] [CrossRef]
Sample Availability: Samples of the compounds are available from the authors. |


| Rt (min) | [M + H]+ ([M + Na]+) | Molecular Formula | Error (ppm) | MS Fragments (m/z) | Compound |
|---|---|---|---|---|---|
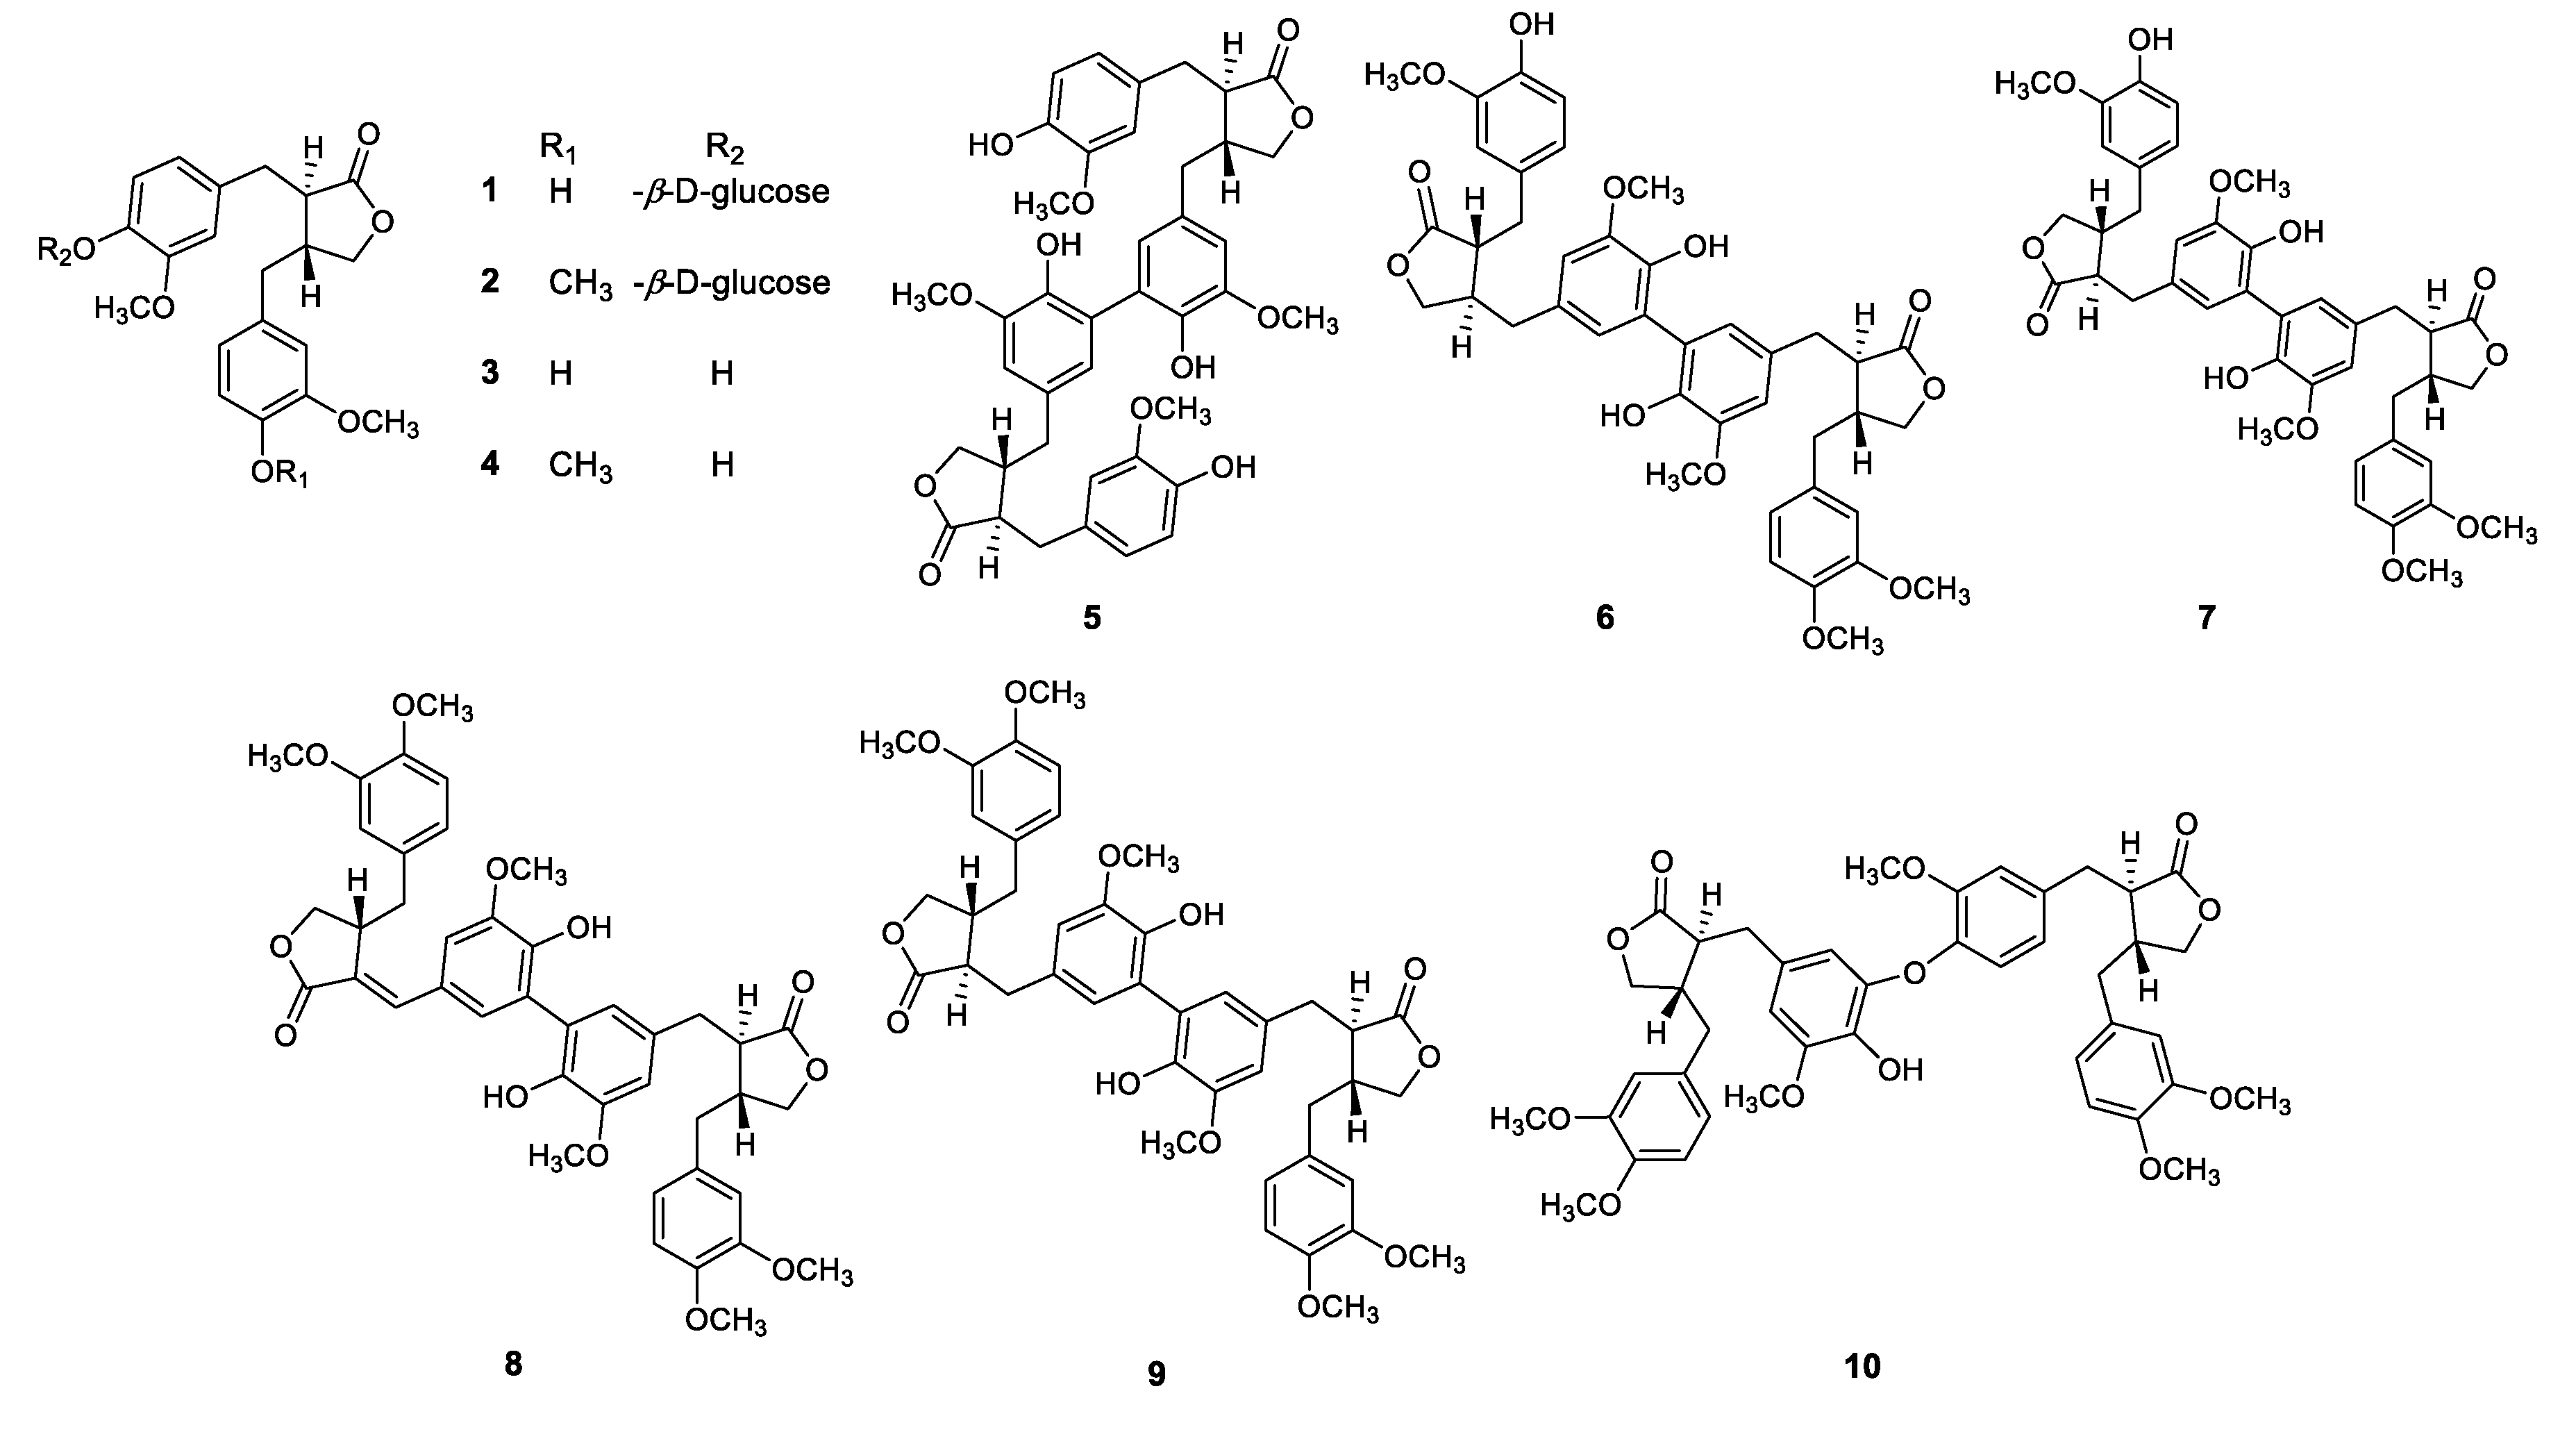
| 4.03 | (543.1844) | C26H43O11 | −4.1 | 359.1494, 341.1392, 137.0609 | Matairesinoside (1) |
| 4.46 | (557.2019) | C27H34O11 | −0.7 | 373.1662, 355.1558, 151.0770, 137.0614 | Arctiin (2) |
| 5.40 | 359.1494 | C20H22O6 | −0.3 | 341.1389, 137.0607 | Matairesinol (3) |
| 6.06 | 373.1653 | C21H24O6 | 0.5 | 355.1551, 137.0611 | Arctigenin (4) |
| 6.51 | 715.2741 | C40H42O12 | −2.0 | 697.2642, 679.2540, 137.0606 | Dimatairesinol (5) |
| 6.99 | 729.2905 | C41H44O12 | −0.8 | 711.2792, 693.2686, 151.0761, 137.0606 | Viridissimaol A (6) |
| 6.99 | 729.2896 | C41H44O12 | −2.1 | 711.2792, 693.2689, 151.0760, 137.0608 | Viridissimaol B (7) |
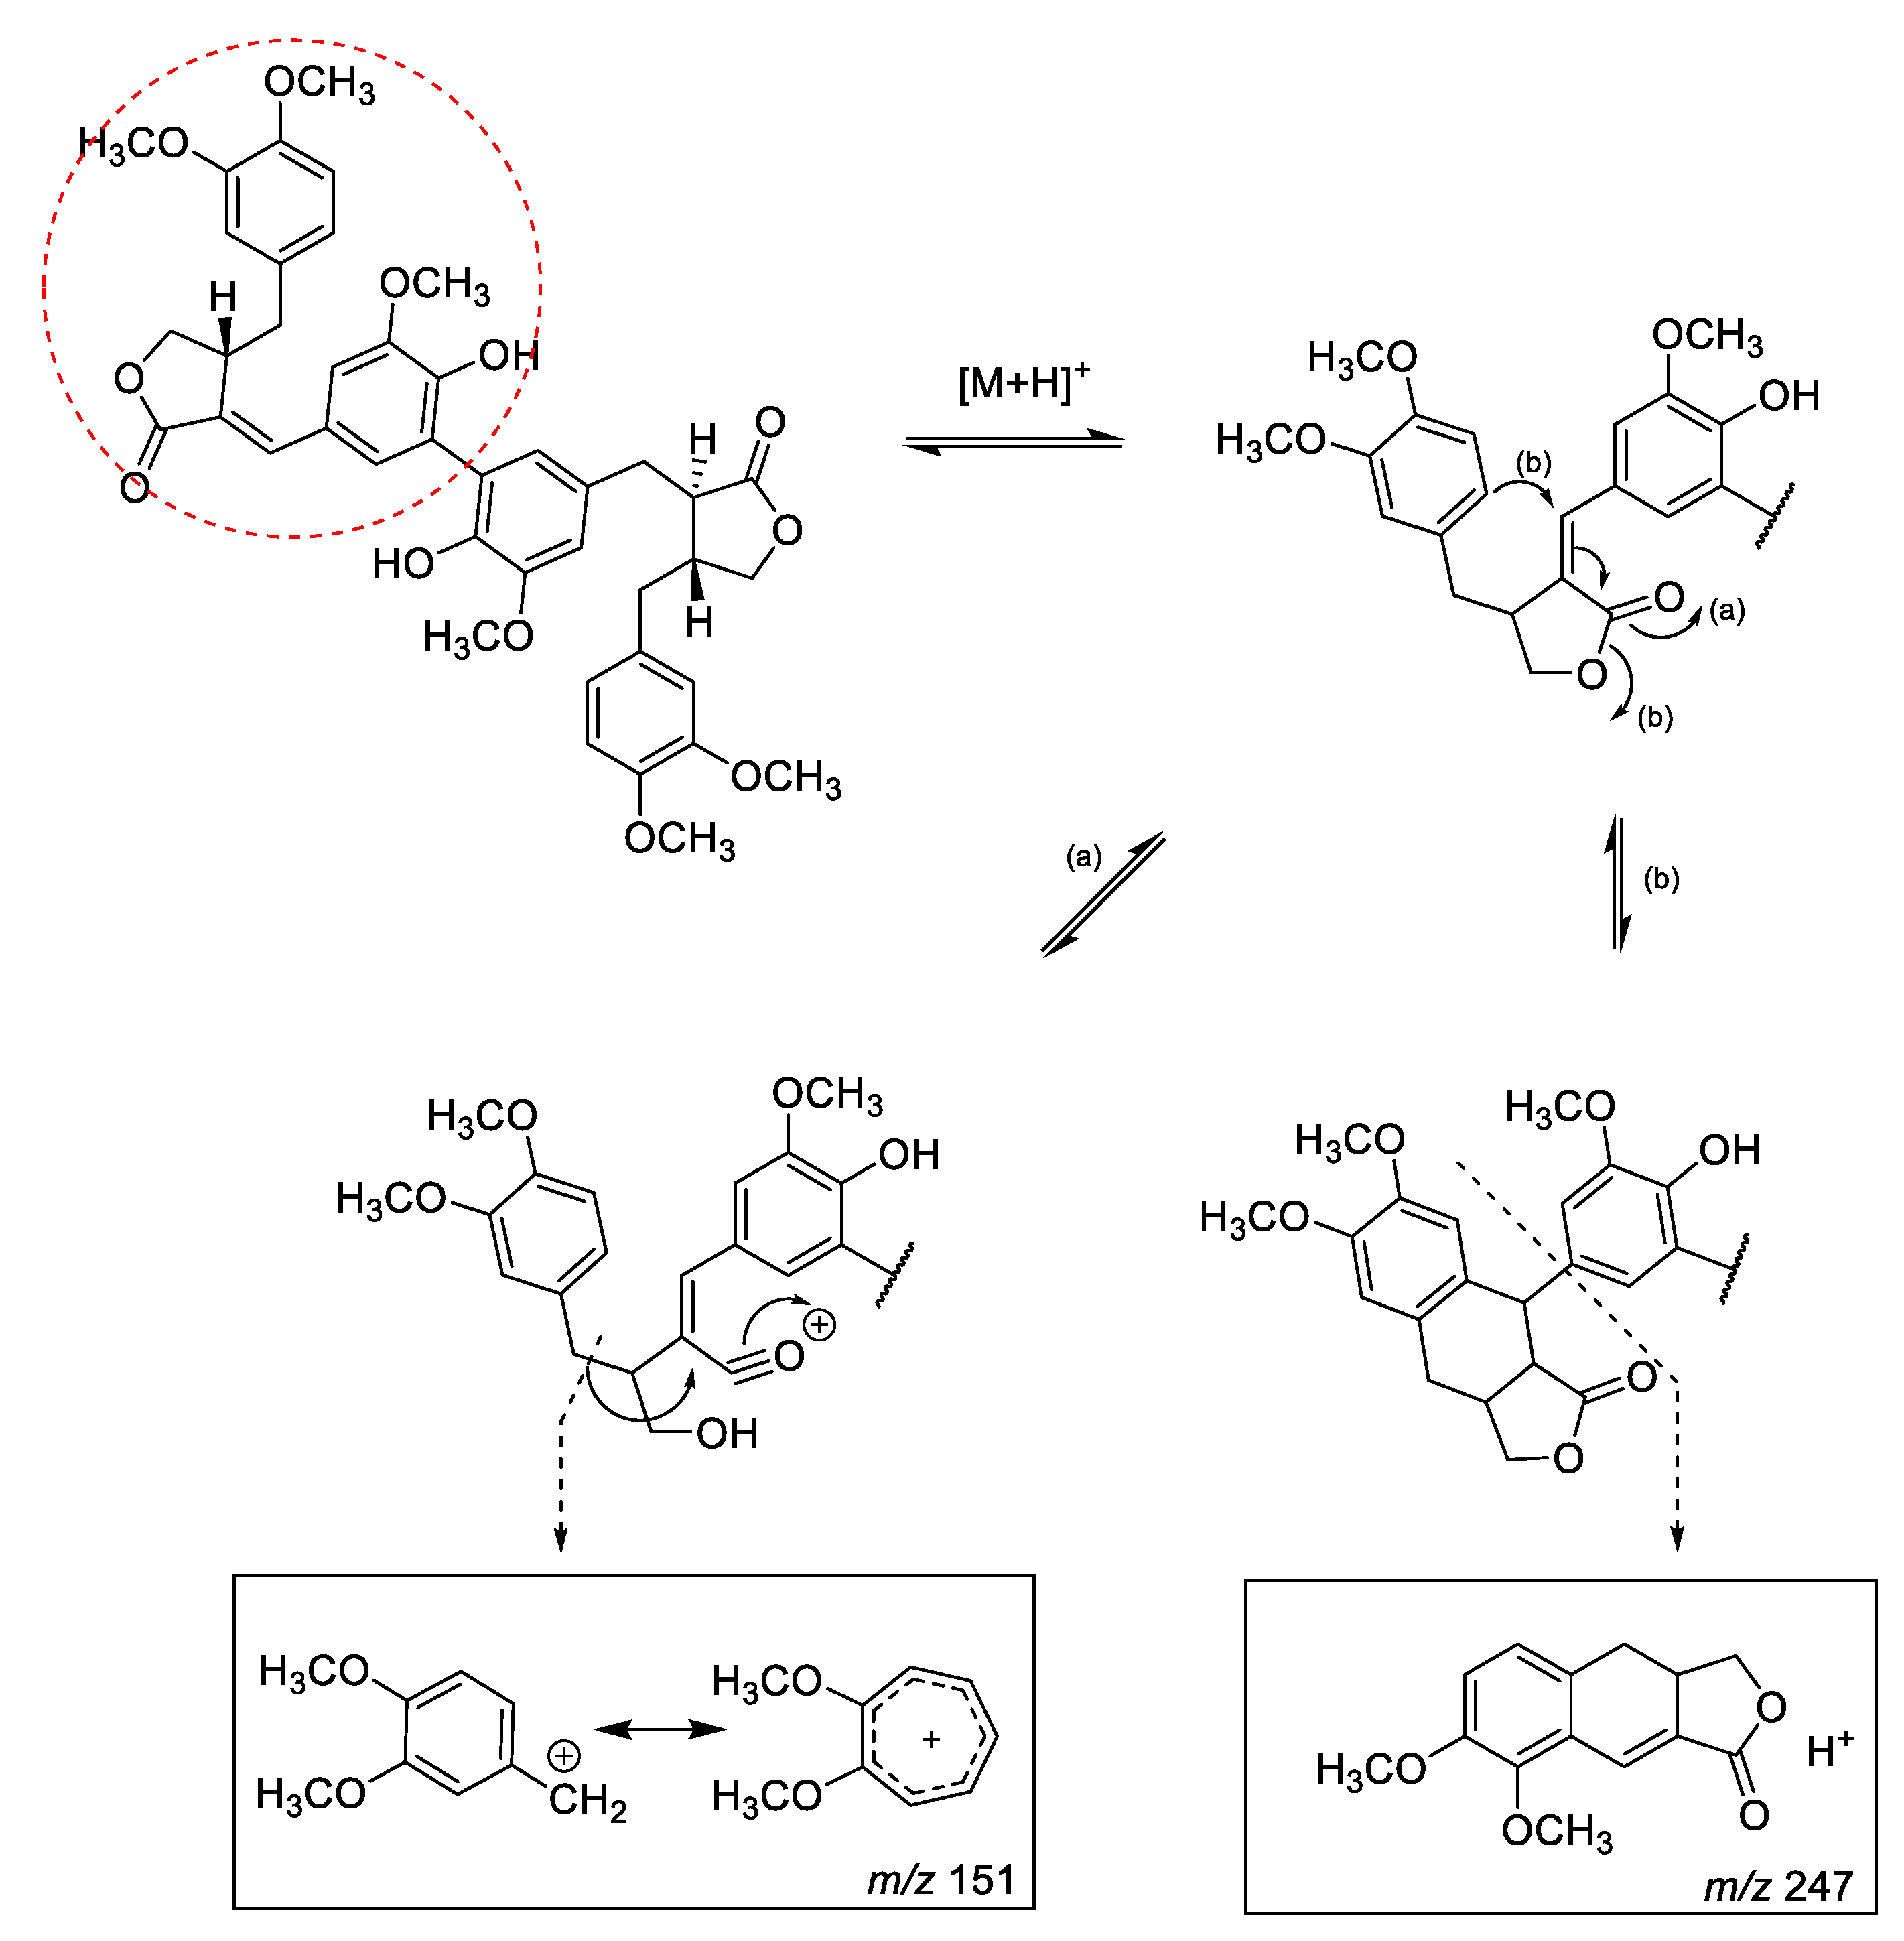
| 7.40 | 741.2907 | C42H44O12 | −0.5 | 723.2800, 705.2671, 247.0977, 151.0762 | Viridissimaol E (8) |
| 7.49 | 743.3055 | C42H46O12 | −1.7 | 725.2947, 707.2844, 151.0764, 137.0605 | Diarctigenin (9) |
| 7.81 | 743.3060 | C42H46O12 | −1.1 | 725.2958, 707.2844, 151.0768, 137.0613 | Conicaol A (10) |
© 2019 by the authors. Licensee MDPI, Basel, Switzerland. This article is an open access article distributed under the terms and conditions of the Creative Commons Attribution (CC BY) license (http://creativecommons.org/licenses/by/4.0/).
Share and Cite
Huh, J.; Lee, C.-M.; Lee, S.; Kim, S.; Cho, N.; Cho, Y.-C. Comprehensive Characterization of Lignans from Forsythia viridissima by UHPLC-ESI-QTOF-MS, and Their NO Inhibitory Effects on RAW 264.7 Cells. Molecules 2019, 24, 2649. https://doi.org/10.3390/molecules24142649
Huh J, Lee C-M, Lee S, Kim S, Cho N, Cho Y-C. Comprehensive Characterization of Lignans from Forsythia viridissima by UHPLC-ESI-QTOF-MS, and Their NO Inhibitory Effects on RAW 264.7 Cells. Molecules. 2019; 24(14):2649. https://doi.org/10.3390/molecules24142649
Chicago/Turabian StyleHuh, Jungmoo, Chang-Min Lee, Seoyoung Lee, Soeun Kim, Namki Cho, and Young-Chang Cho. 2019. "Comprehensive Characterization of Lignans from Forsythia viridissima by UHPLC-ESI-QTOF-MS, and Their NO Inhibitory Effects on RAW 264.7 Cells" Molecules 24, no. 14: 2649. https://doi.org/10.3390/molecules24142649
APA StyleHuh, J., Lee, C.-M., Lee, S., Kim, S., Cho, N., & Cho, Y.-C. (2019). Comprehensive Characterization of Lignans from Forsythia viridissima by UHPLC-ESI-QTOF-MS, and Their NO Inhibitory Effects on RAW 264.7 Cells. Molecules, 24(14), 2649. https://doi.org/10.3390/molecules24142649