Article

Styphnolobium japonicum (L.) Schott Fruits Increase Stress Resistance and Exert Antioxidant Properties in Caenorhabditis elegans and Mouse Models

1
Pharmaceutical Biology Department, Faculty of Pharmacy and Biotechnology, German University in Cairo, Cairo 11835, Egypt
2
Biology Department, Institute of Pharmacy and Molecular Biotechnology, Heidelberg University, Im Neuenheimer Feld 364, Heidelberg 69120, Germany
3
Departmento de Biotecnologia em Plantas Medicinais, Universidade de Ribeirão Preto, 14096-900 Ribeirão Preto, Brazil
4
Pharmacology and Toxicology department, Faculty of Pharmacy, Cairo University, Cairo 11562, Egypt
*
Author to whom correspondence should be addressed.
Molecules 2019, 24(14), 2633; https://doi.org/10.3390/molecules24142633
Submission received: 22 June 2019 / Revised: 15 July 2019 / Accepted: 17 July 2019 / Published: 19 July 2019
(This article belongs to the Special Issue Herbal Medicines–Unraveling Their Molecular Mechanism)

Abstract

:
Styphnolobium japonicum (L.) Schott is a popular Asian tree widely used in traditional medicine. The current study explored the potential stress resistance and antioxidant activities of its fruits. Phytochemical profiling of the hydroalcoholic fruit extract was done via high performance liquid chromatography-photodiode array-electrospray ionization-mass/mass (HPLC-PDA-ESI-MS/MS). Twenty four phenolic constituents were tentatively identified in the extract. The Caenorhabditis elegans (C. elegans) nematode model in addition to trimethyltin (TMT)-induced neurotoxicity mouse model were used for in vivo evaluation of its antioxidant properties. The ability of the extract to enhance stress resistance was manifested through increasing survival rate by 44.7% and decreasing basal reactive oxygen species (ROS) levels by 72.3% in C. elegans. In addition, the extract increased the levels of the stress response enzyme superoxide dismutase-3 (Sod-3) by 55.5% and decreased the expression of heat shock protein-16.2 (Hsp-16.2) in nematodes, which had been challenged by juglone, by 21%. Using a mouse model, the extract significantly decreased the expression of the oxidative stress marker malondialdehyde (MDA). Furthermore, an elevation in the levels of the antioxidant marker glutathione (GSH), SOD and heme oxygenase-1 (HO-1) enzymes were observed. Our findings imply that Styphnolobium japonicum has the potential to be used in future studies focusing on diseases associated with oxidative stress.

1. Introduction

Styphnolobium japonicum (SJ) (L.) Schott (formerly Sophora japonica), also called Chinese scholar tree and Japanese pagoda tree, is a deciduous tree that belongs to family Fabaceae. Though this tree originated in China, it is found as an ornamental plant in other areas like Eastern Asia, Europe, South Africa, and North America [1]. It is widely known for its use in traditional Chinese medicine for treating dizziness, headache, hypertension, hematemesis, intestinal hemorrhage, and hemorrhoids [1,2]. Several parts of the plant are used pharmaceutically as Sophorae fructus, Sophorae flos, and Sophorae gemmae [3]. Extracts from flower buds and the isolated rutin are used in phytotherapy to treat symptoms of capillary and venous insufficiency, including swollen legs, varicose veins, cramps, and piles [1,4]. Extracts of different plant parts have also shown astringent, antibacterial, antispasmodic, hypotensive, anticholesterolemic, and anti-inflammatory properties [2,5,6,7,8,9].
Several phytochemical studies of SJ have revealed the presence of many secondary metabolites like flavonoids, triterpenoids, and amino acids, but most of the pharmacological properties are attributed to both flavonoids and isoflavonoids [1]. It is also noteworthy that rutin represents 20% of SJ flower buds dry weight [3].
Several studies addressed the pharmacological activities of extracts from different parts of SJ. Fruit extracts have shown an inhibitory effect on the activity of osteoclasts, leading to prevention of bone loss. Dichloromethane extract of the fruits, rich in genistein, has demonstrated osteogenic properties via promoting differentiation of osteoblasts [10]. The estrogenic compound sophoricoside, found and isolated from the seeds of SJ, has shown promising activity against osteoporosis when tested in ovariectomized rat model [11,12]. Also a fruit extract, rich in isoflavones, was able to enhance the production of the growth factors TGF-β and IGF-1 in bone marrow cells from rat model [13].
Moreover, an extract of the flower buds was able to suppress the activation of microglia, the expression of IL-1β, and cell apoptosis. This led to decreased cerebral infarction area in a model of ischemia-reperfusion injury [14]. Furthermore, an ethanol flower bud extract was active against different bacteria like Propionibacterium avidum, Propionibacterium acne, and Staphylococcus aureus [15]. On the other hand, administration of mature fruits in a fatty diet to obese mice caused a decrease in body weight gain, high-density lipoprotein cholesterol, and total serum cholesterol levels [16].
Some flavonol triglycosides, which were isolated from fruits, have shown antioxidant effects in 2,2-diphenyl-1-picrylhydrazyl (DPPH) and cytochrome-c assays [17]. However, few studies focused on the antioxidant properties of the plant. Therefore, this study aimed at further investigation of these properties.
In the present study, hydroalcoholic extract from the dried fruits of SJ was tested for its in vitro antioxidant activities using DPPH assay. The secondary metabolites of the bioactive extract were characterized using high performance liquid chromatography-photodiode array-electrospray ionization-mass/mass (HPLC-PDA-ESI-MS/MS). Furthermore, antioxidant activities were further investigated using two different in vivo models, Caenorhabditis elegans (C. elegans) and trimethyltin (TMT)-induced neurotoxicity model in mice.
C. elegans nematode is a vastly used successful model system for screening different agents regarding their antioxidant and neuroprotective activities [18,19,20]. Using this model, the ability of the extract to increase stress resistance and to modulate stress response genes expression, heat shock protein-16.2 (Hsp-16.2) and superoxide dismutase-3 (Sod-3), were investigated in our study. The levels of the antioxidant enzymes SOD, heme oxygenase-1 (HO-1), of glutathione (GSH) and of the oxidative stress marker malondialdehyde (MDA) were assessed using brains of TMT-stressed mice.

2. Results and Discussion

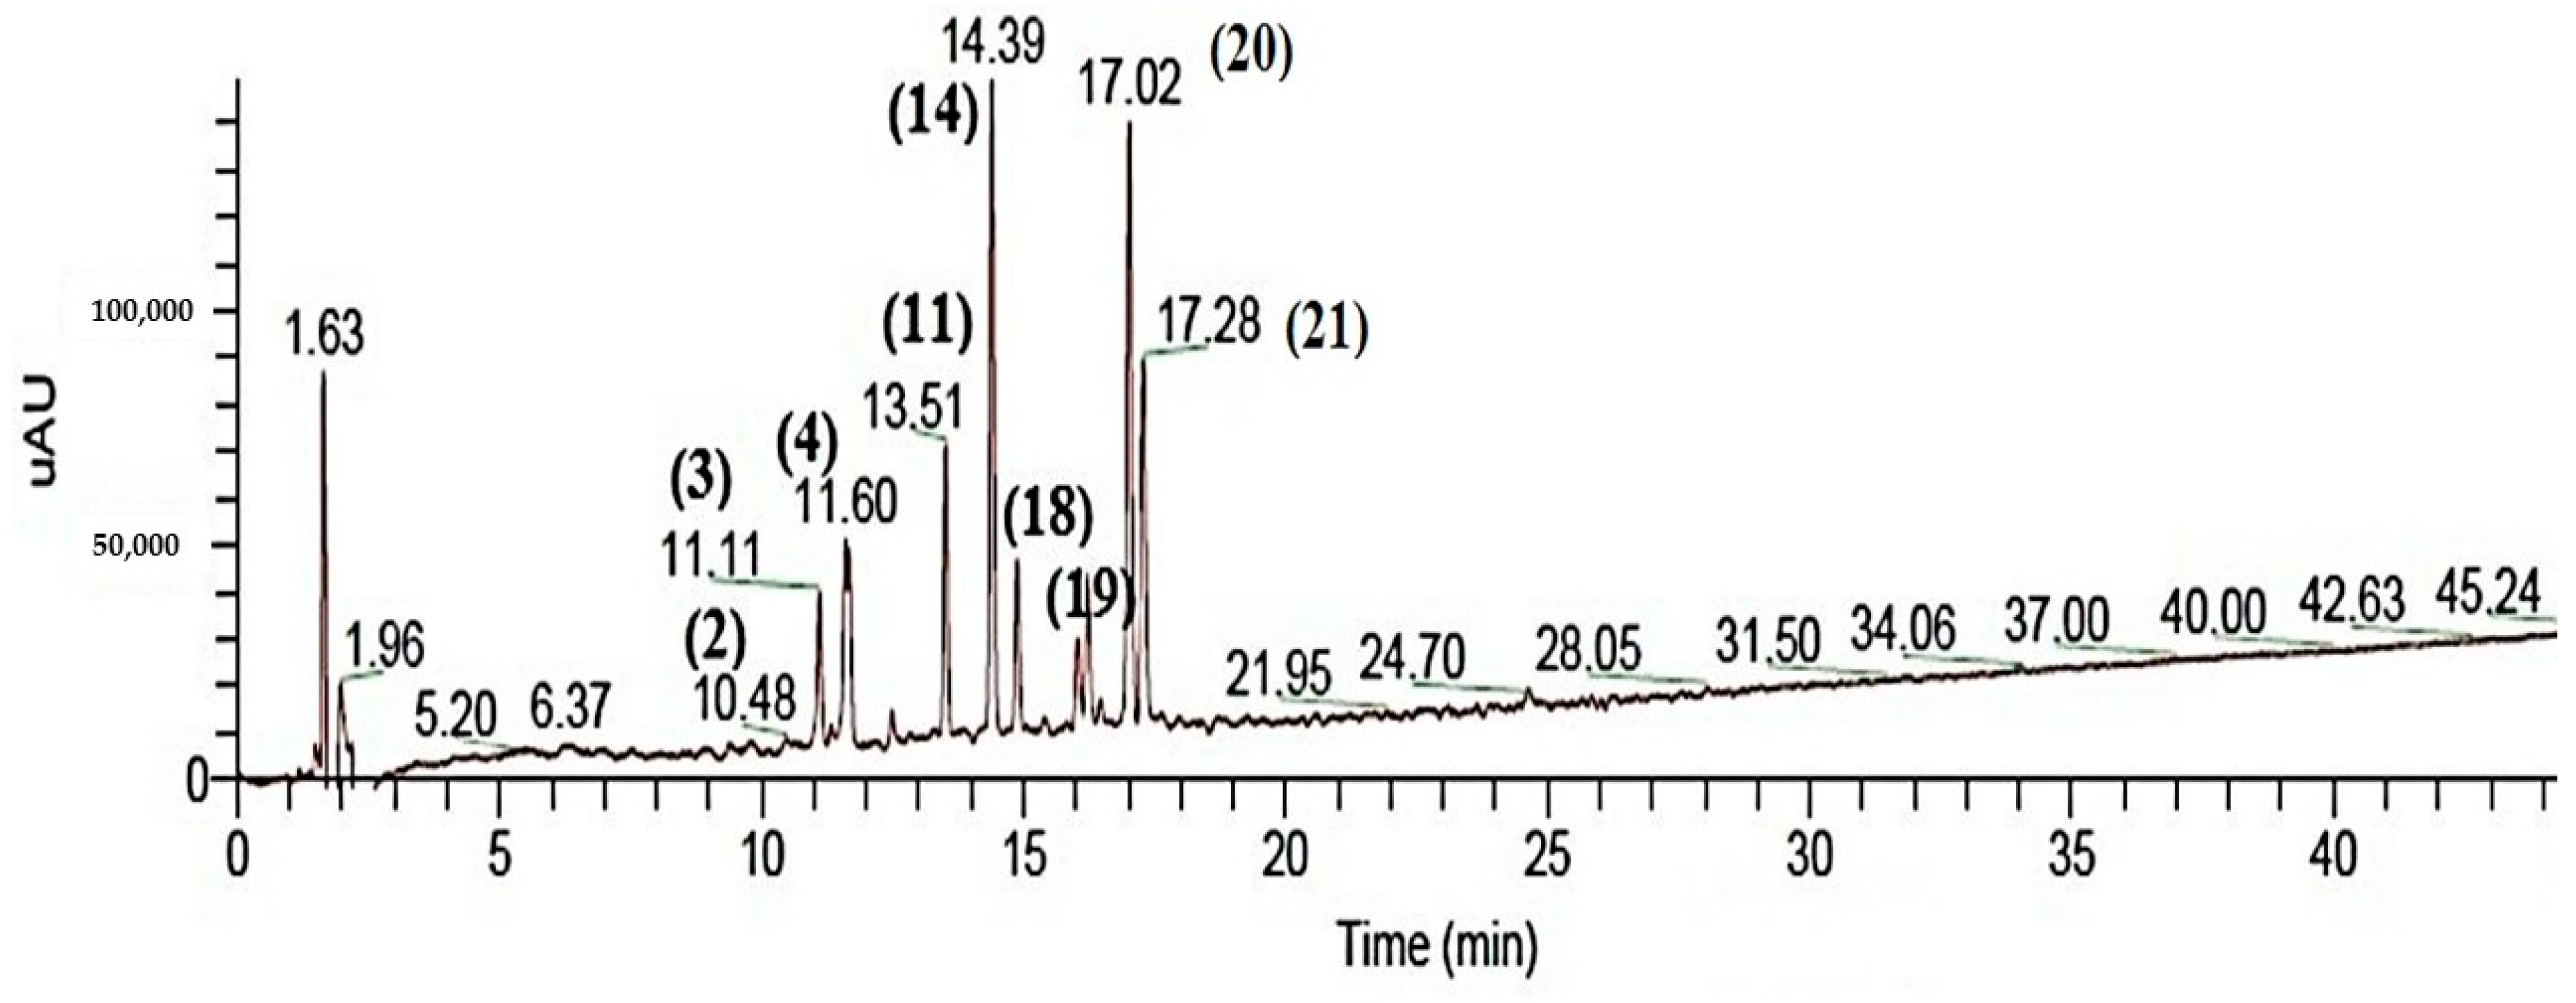
2.1. Chemical Characterization of SJ Extract

Phytochemical analysis of the hydroalcoholic fruit extract of Styphnolobium japonicum was performed using HPLC-PDA-ESI-MS/MS technique, see Figure 1 [21]. Several classes of secondary metabolites were detected as phenolic acids, flavones, flavan-3-ols, and tannins.
Several apigenin glycosides were represented in the bioactive extract. The major compound was represented in peak 14. Peak 14 was tentatively identified as apigenin 7-O-(2″-dihydrogalloyl)-deoxyhexosyl-6-C-(2″′-pentosyl)-hexoside (Table 1), as the deprotonated ion appeared at m/z 862. Its major ion fragment appeared at m/z 700, indicating loss of a hexose molecule [22].
Peak 1, [M − H] at m/z 639, was identified as apigenin acetyl dihexoside. Fragment ion peaks are present at m/z 431, which corresponds to apigenin hexoside and at m/z 638 corresponding to [M − 2H]. Moreover, fragment ion peak at m/z 592 indicates apigenin dihexoside moiety and loss of acetyl group [M − H − 44].
Peak 10 was identified as apigenin hexoside, its deprotonated molecule appeared at m/z 431. The major fragment ion appeared at m/z 269 indicating apigenin aglycone [23]. Furthermore, peak 13 was recognized as apigenin 7-O-rutinoside (isorhoifolin). It is identified according to its deprotonated molecule at m/z 577 and its molecular ion peak of [M − H − 308] at m/z 269, due to rutinose loss [24].
Moreover, several kaempferol glycosides were recognized. Peak 4, representing one of the major compounds, was tentatively identified as kaempferol 3-O-[6″-O-(hexosyl) hexoside] 7-O-deoxyhexoside, as its [M − H] appeared at m/z 755. Several molecular ion peaks were shown at m/z 609, 431 and 284 representing loss of deoxyhexose [M – H − deoxyhex], two hexose moieties [M − H − hex − hex], and the presence of kaempferol moiety, respectively.
Kaempferol dihexoside was identified as peak 5, [M − H] at m/z 609. Two deprotonated fragments were shown at m/z 429 and m/z 284 representing losing one hexose [M − H − hex] and two hexose moieties [M − H − hex − hex], respectively.
Peak 2 was tentatively identified as kaempferol-3-O-rutinoside-7-O-β-D-hexopyranoside, [M − H] at m/z 755. That was confirmed via the observed fragmentation pattern as m/z 754 due to [M − 2H]. In addition, m/z 609, m/z 593, and m/z 285 appeared representing the loss of deoxyhexose [M − H − deoxyhex], hexose [M − H − hex], and the presence of kaempferol moiety respectively [25].
Peak 8 was identified as kaempferol-feruloyl-di-hexose-pentose, [M − H] at m/z 931, and [M − H − 146] at m/z 785 indicating the loss of a deoxyhexose moiety [26].
The tentative identification of 24 compounds based on their retention values, MS data, and fragmentation pattern (MS daughter ions) is shown in Table 1.

2.2. Total Phenolic Content and Evaluation of Antioxidant Activity In Vitro

Total phenolic content was determined by Folin–Ciocalteu. The extract presented 192.4 ± 4.8 µg of gallic acid equivalents (GAE)/mg of SJ extract. This value was higher than that observed using aqueous extract of the plant and comparable to that obtained with 50% methanloic extract, using catechin standard [35].
Free radical scavenging activity of SJ extract was evaluated using DPPH assay, showing relatively high value (EC50 of 110.36 ± 3.18 µg/mL) compared to standard antioxidants; (−)-epigallocatechingallate (EGCG) (EC50 of 1.4 ± 0.06 µg/mL) and vitamin C (EC50 of 2.7 ± 0.09 µg/mL).

2.3. In Vivo Antioxidant Activity Using the C. elegans Model

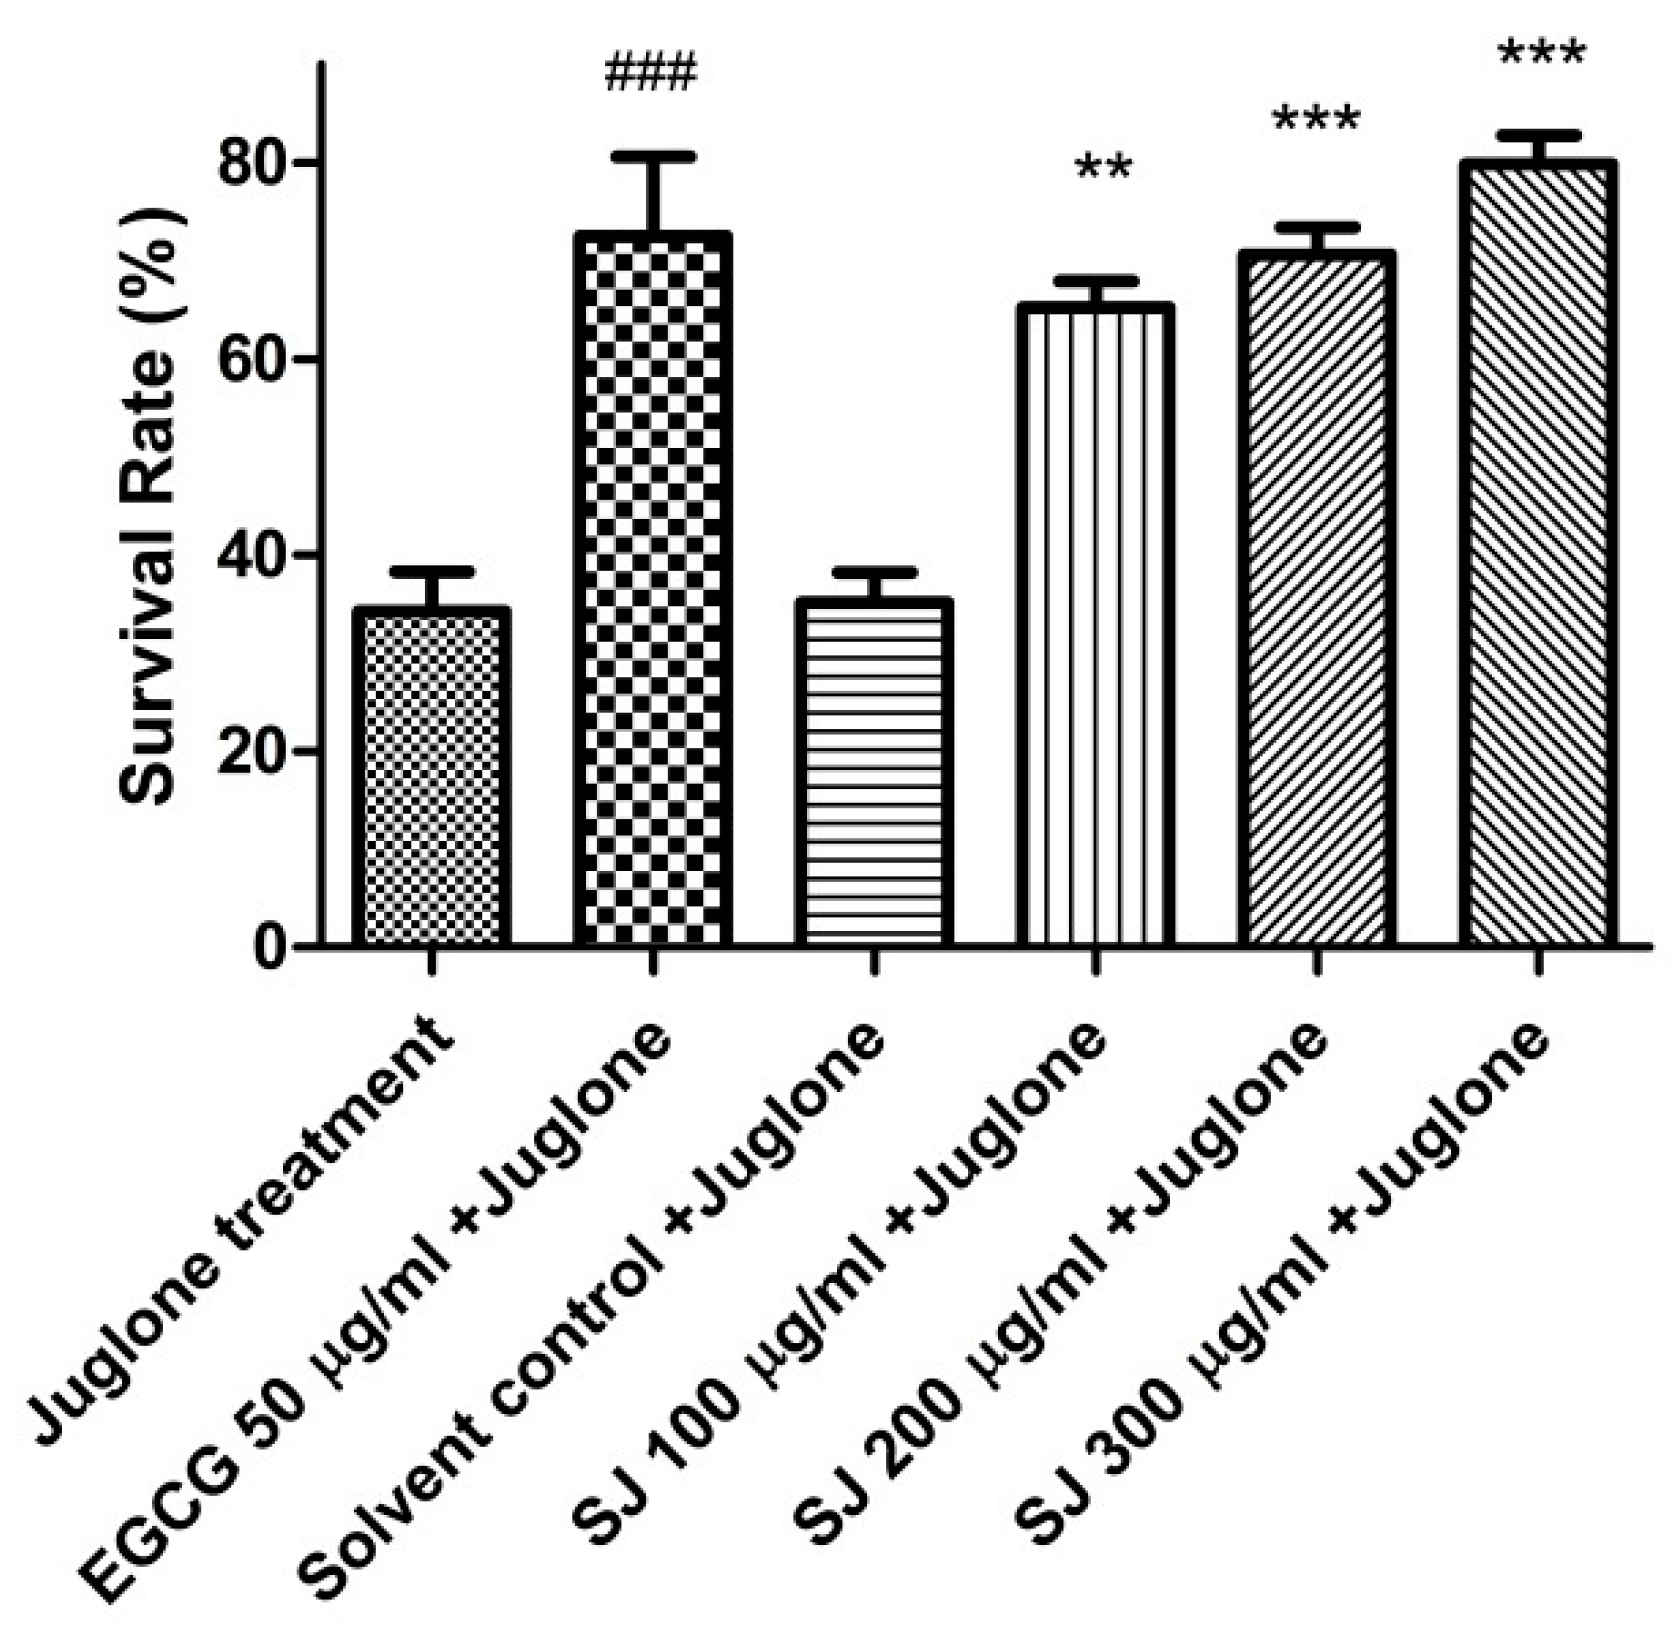
2.3.1. Survival Assay

Several assays were employed to evaluate the antioxidant effects of SJ extract in vivo using the widely known C. elegans model. For the survival assay, a lethal dose of the naphthoquinone juglone was applied as a pro-oxidant for the induction of severe oxidative stress condition. Worms that were pretreated with SJ extract demonstrated significantly higher rates of survival, compared with the solvent control group. The highest dose of the extract—SJ 300 µg/mL—demonstrated the highest survival rate among all the tested doses, 79.86 ± 2.87%, compared to the juglone group (35.15 ± 3.06%, p-value < 0.001) (Figure 2). This result was even higher than that of the EGCG positive control group (72.46 ± 8.1%, p-value < 0.001). This data demonstrates the bioavailability of the extract.
Several flavonoids identified via HPLC-PDA-ESI-MS/MS, like kaempferol and proanthocyanidin derivatives, could be contributing to the observed effect. Kaempferol was reported previously to increase survival and resistance to thermal stress when tested in C. elegans [36]. Furthermore, plant extract rich in proanthocyanidins was able to enhance survival rates among the nematodes [37].
Moreover, increased survival rates could be due to the direct scavenge of reactive oxygen species (ROS) by the phenolic compounds of SJ extract or due to the activation of protective signaling pathways with subsequent expression of genes related to oxidative stress resistance.

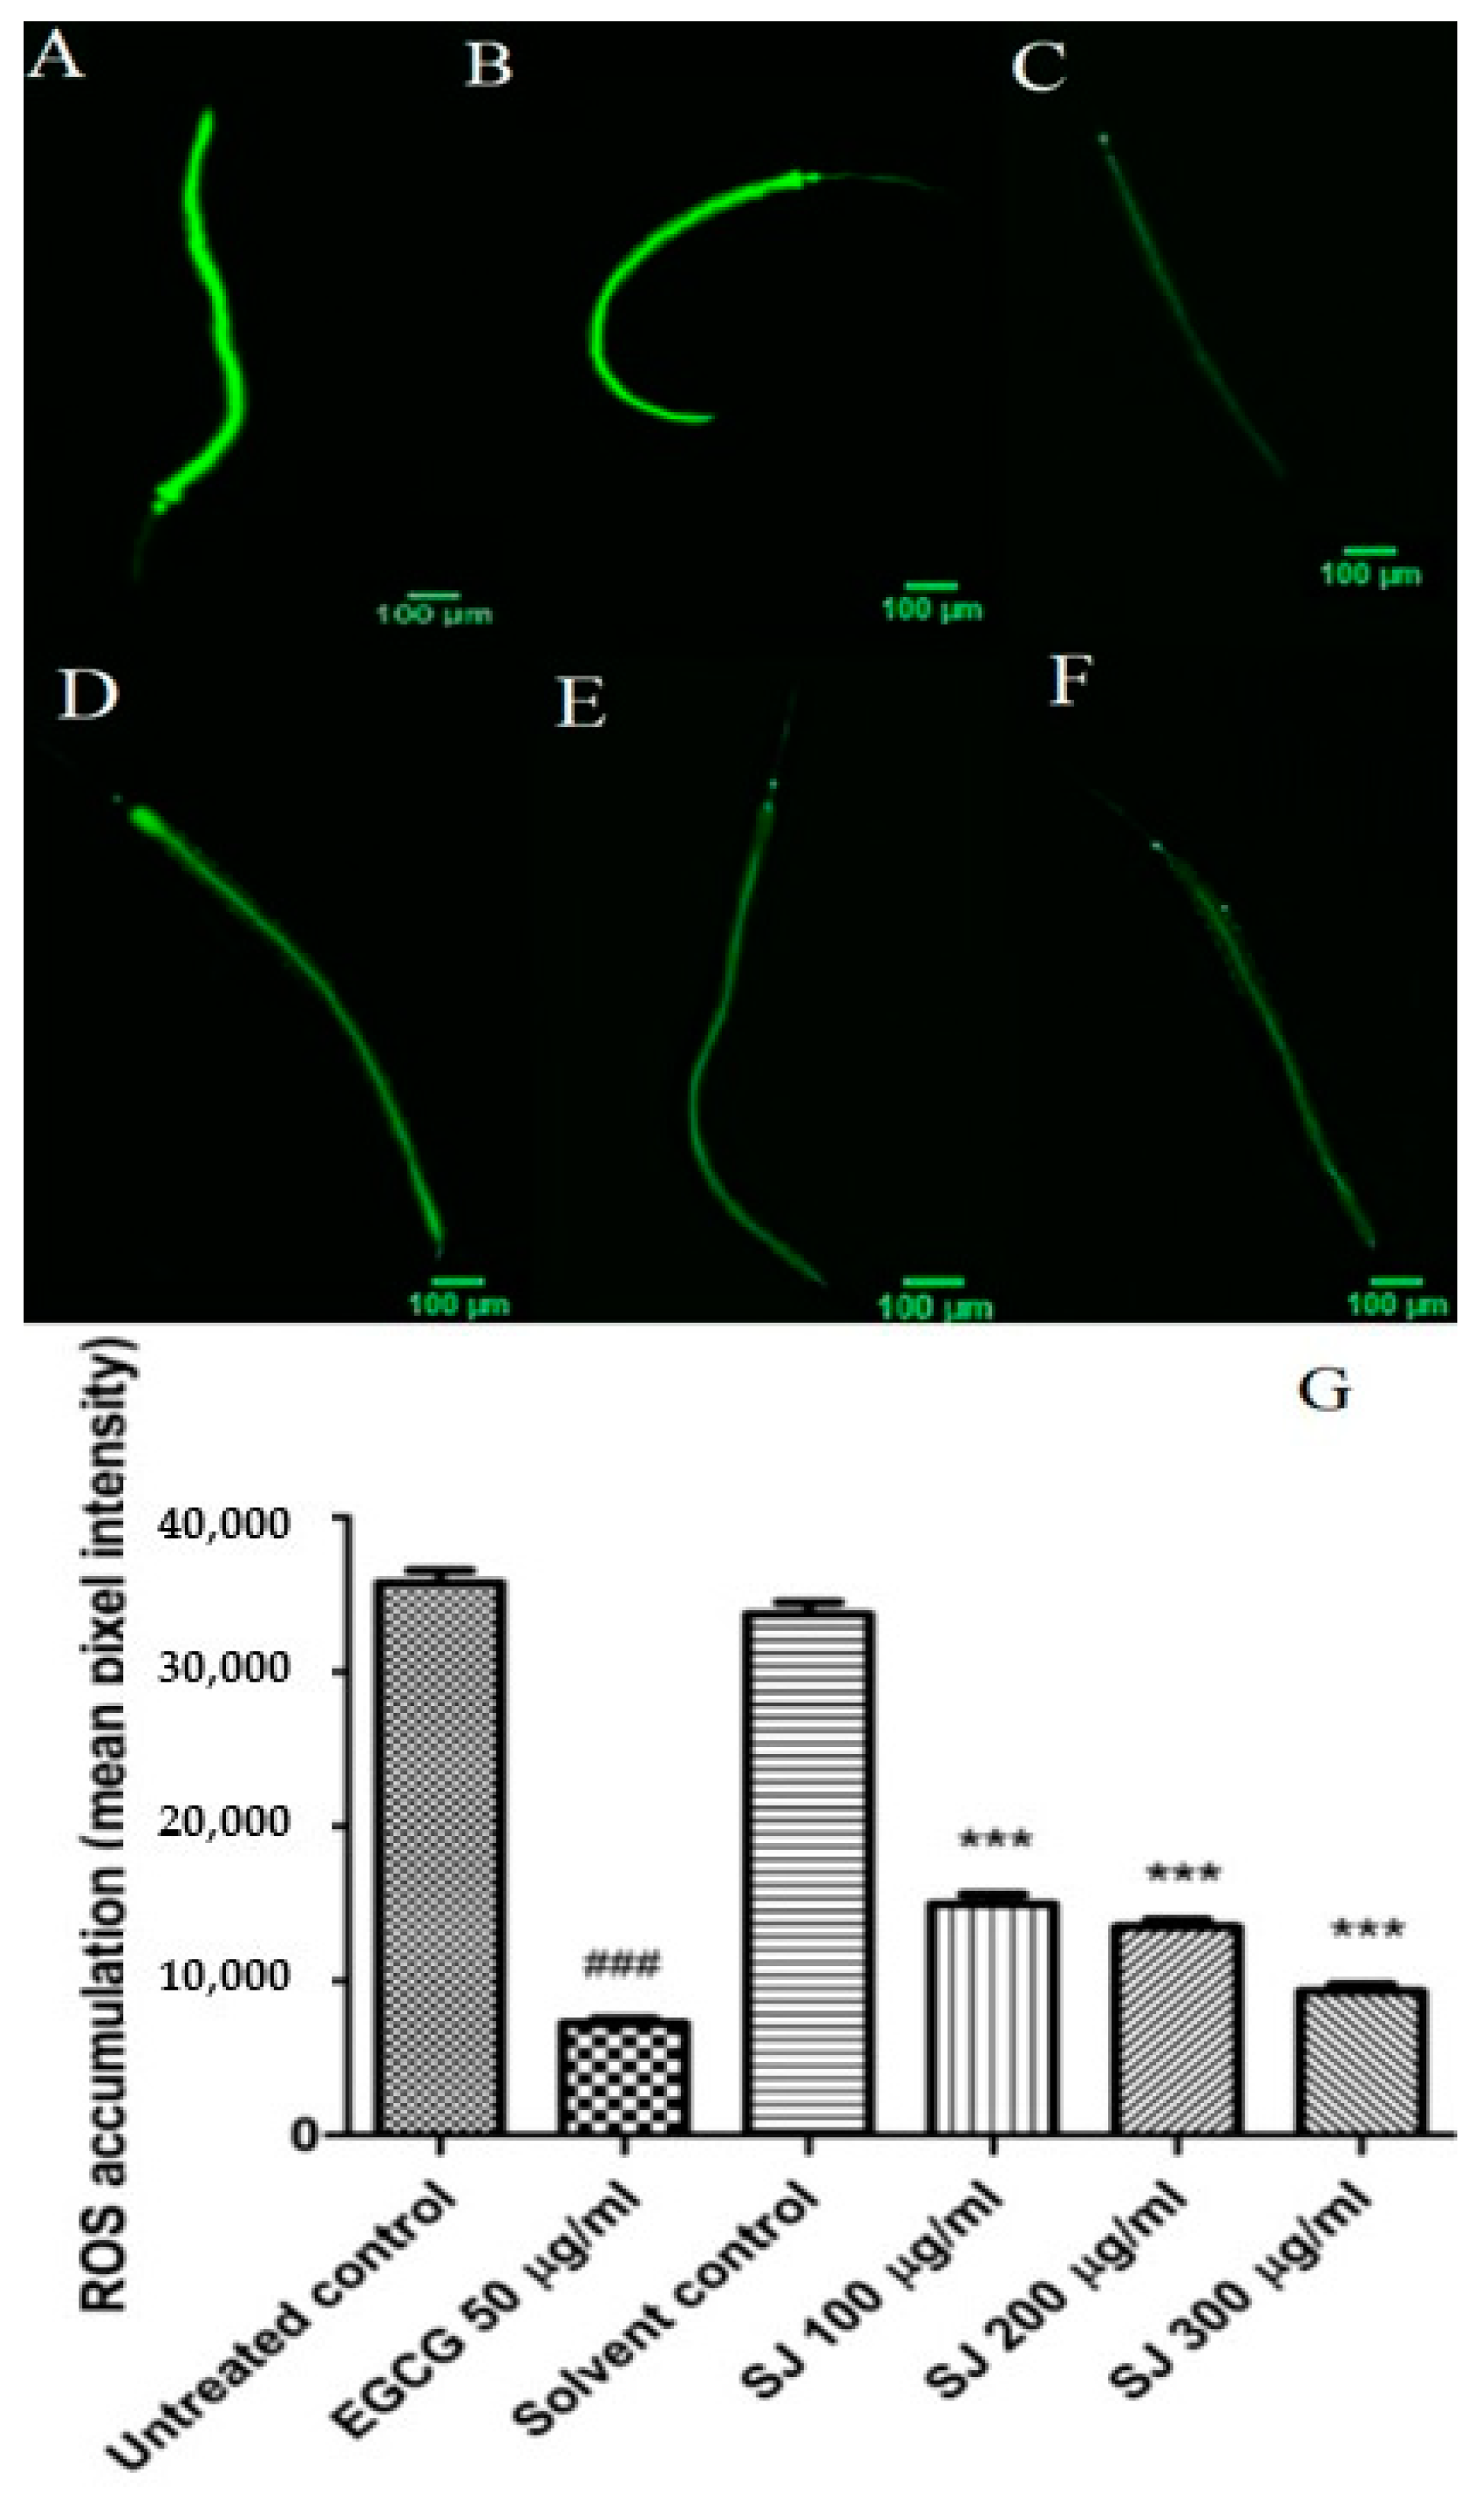
2.3.2. ROS Intracellular Accumulation

To further assess the antioxidant potential of SJ extract in C. elegans, wild type (N2) worms were used for quantification of intracellular ROS levels. For the detection of ROS, the membrane permeable 2′,7′-dichlorofluorescein diacetate (H2DCF-DA) dye was employed. After deacetylation by cellular esterases, the dye is oxidized by ROS into 2’,7’-dichlorofluorescein (DCF), a fluorescent compound.
Treatment with different doses of SJ extract resulted in a significant decline in ROS levels in comparison to solvent control group. SJ 300 µg/mL resulted in the highest decline in ROS levels, 72.3%, a result which is close to that of EGCG positive control group, 79.6% (p-value < 0.001) (Figure 3).
Proanthocyanidins, quercetin, and kaempferol derivatives, identified in the extract, could be participating in reducing ROS levels. Those flavonoids have previously reduced ROS accumulation in the C. elegans model [36,37,38].
As hypothesized for the survival assay, in addition to direct ROS scavenging, the activation of stress resistance related genes mediated by different compounds within the extract can also be involved in the observed diminution of ROS levels by SJ treatment.

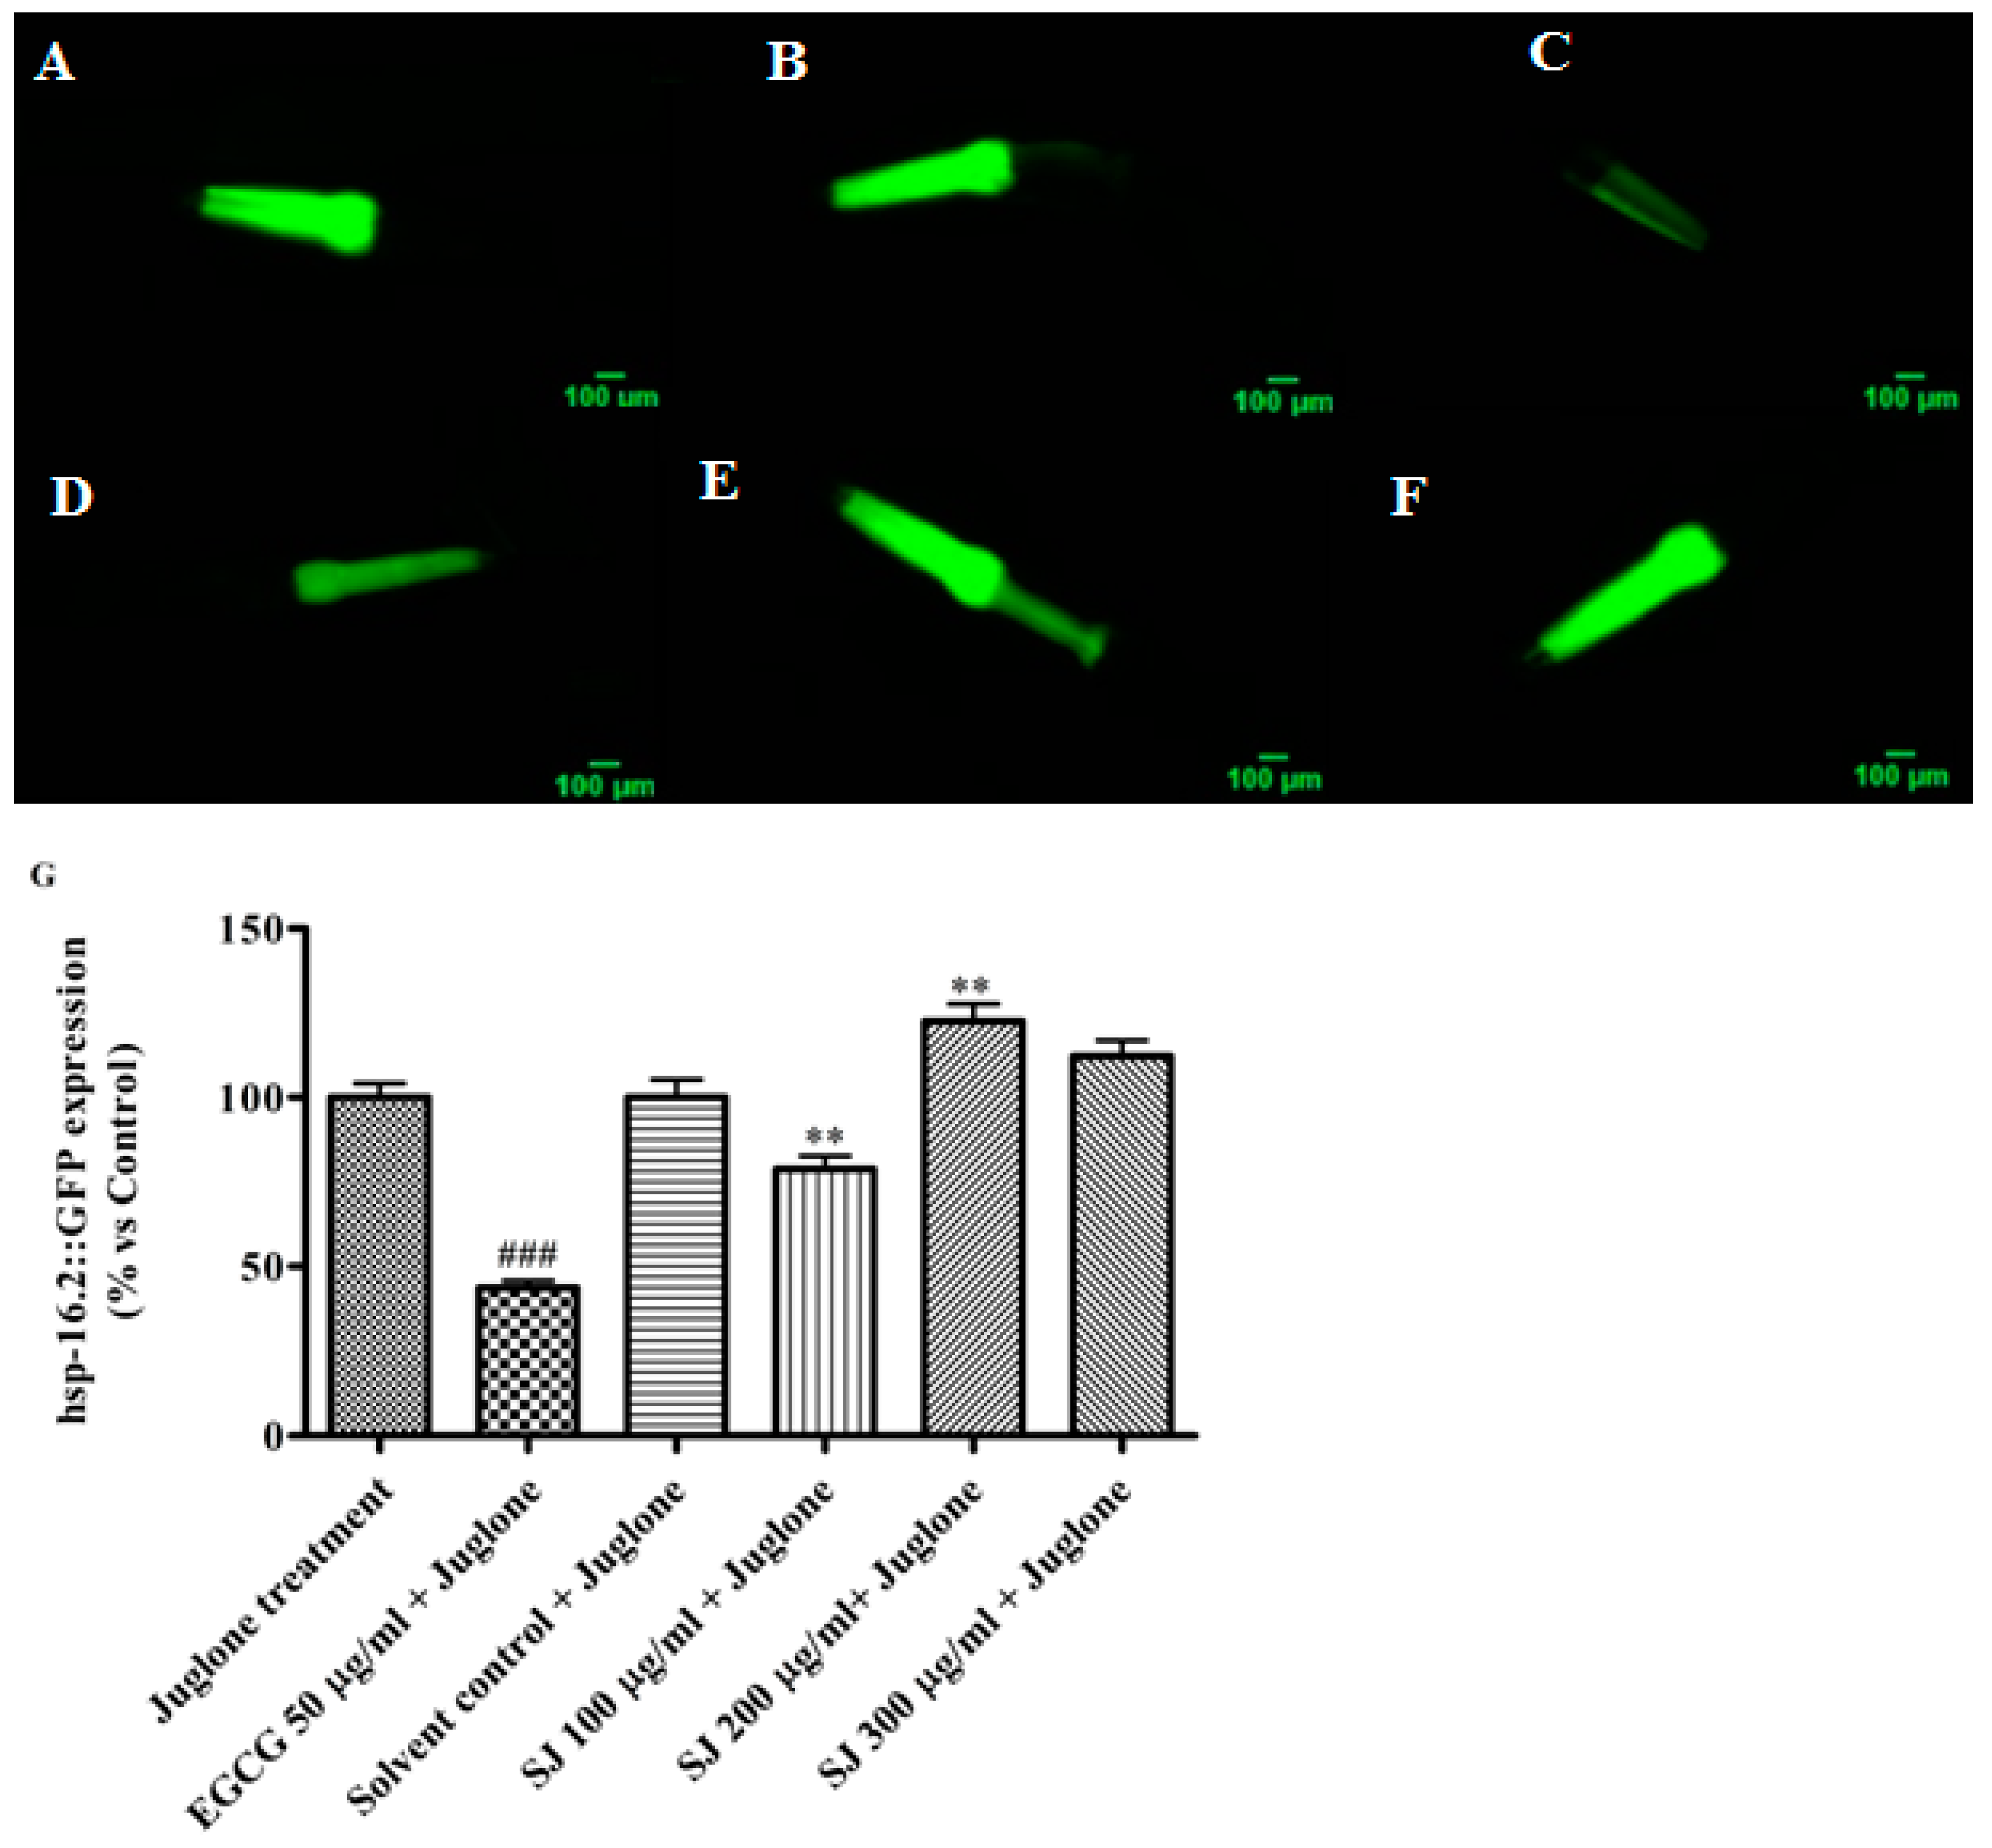
2.3.3. Expression of Hsp-16.2 Gene

The expression of Hsp-16.2, used as a marker of stress levels, was done using TJ375 mutants. These worms have Hsp-16.2 gene coupled to green fluorescent protein (GFP). This protein is inducible by applying different stressors, like heat and oxidative stress [39]. When nematodes are treated with juglone, a strong fluorescent signal becomes visible. Worms pretreated with the lowest dose of SJ extract, 100 µg/mL, then subjected to mild oxidative stress conditions using 20 µM juglone showed a very significant decrease in fluorescence intensity (21 ± 3.88%), in comparison to solvent control + juglone group (p-value < 0.01). EGCG group also showed a highly significant decline in fluorescence intensity (56.3 ± 2.08%) in comparison with juglone group (p-value < 0.001). On the other side, a higher SJ dose of 200 µg/mL lead to a significant rise in Hsp-16.2 levels (Figure 4).
Hormesis is defined as an adaptive process by which a low dose of a toxic compound leads to beneficial effects on the organism. Several antioxidants have demonstrated a hormetic dose response effect. They acted as pro-oxidants above certain doses, inducing the activation of antioxidant defense mechanisms and forming a state of stress resistance [40].
The elevated levels of Hsp-16.2, observed at concentrations above 200 μg/mL, might indicate a pro-oxidant activity of SJ extract causing a hormetic response. Comparable results were previously reported for several polyphenols that were able to trigger hormetic responses via modulating the expression of different Hsps [41].
In C. elegans, heat shock protein expression is regulated by the heat shock factor-1 (HSF-1) and DAF-16 transcription factor [42]. Therefore, further studies involving DAF-16 mutants will be needed for more understanding of the mechanism by which the extract exerts its effects.

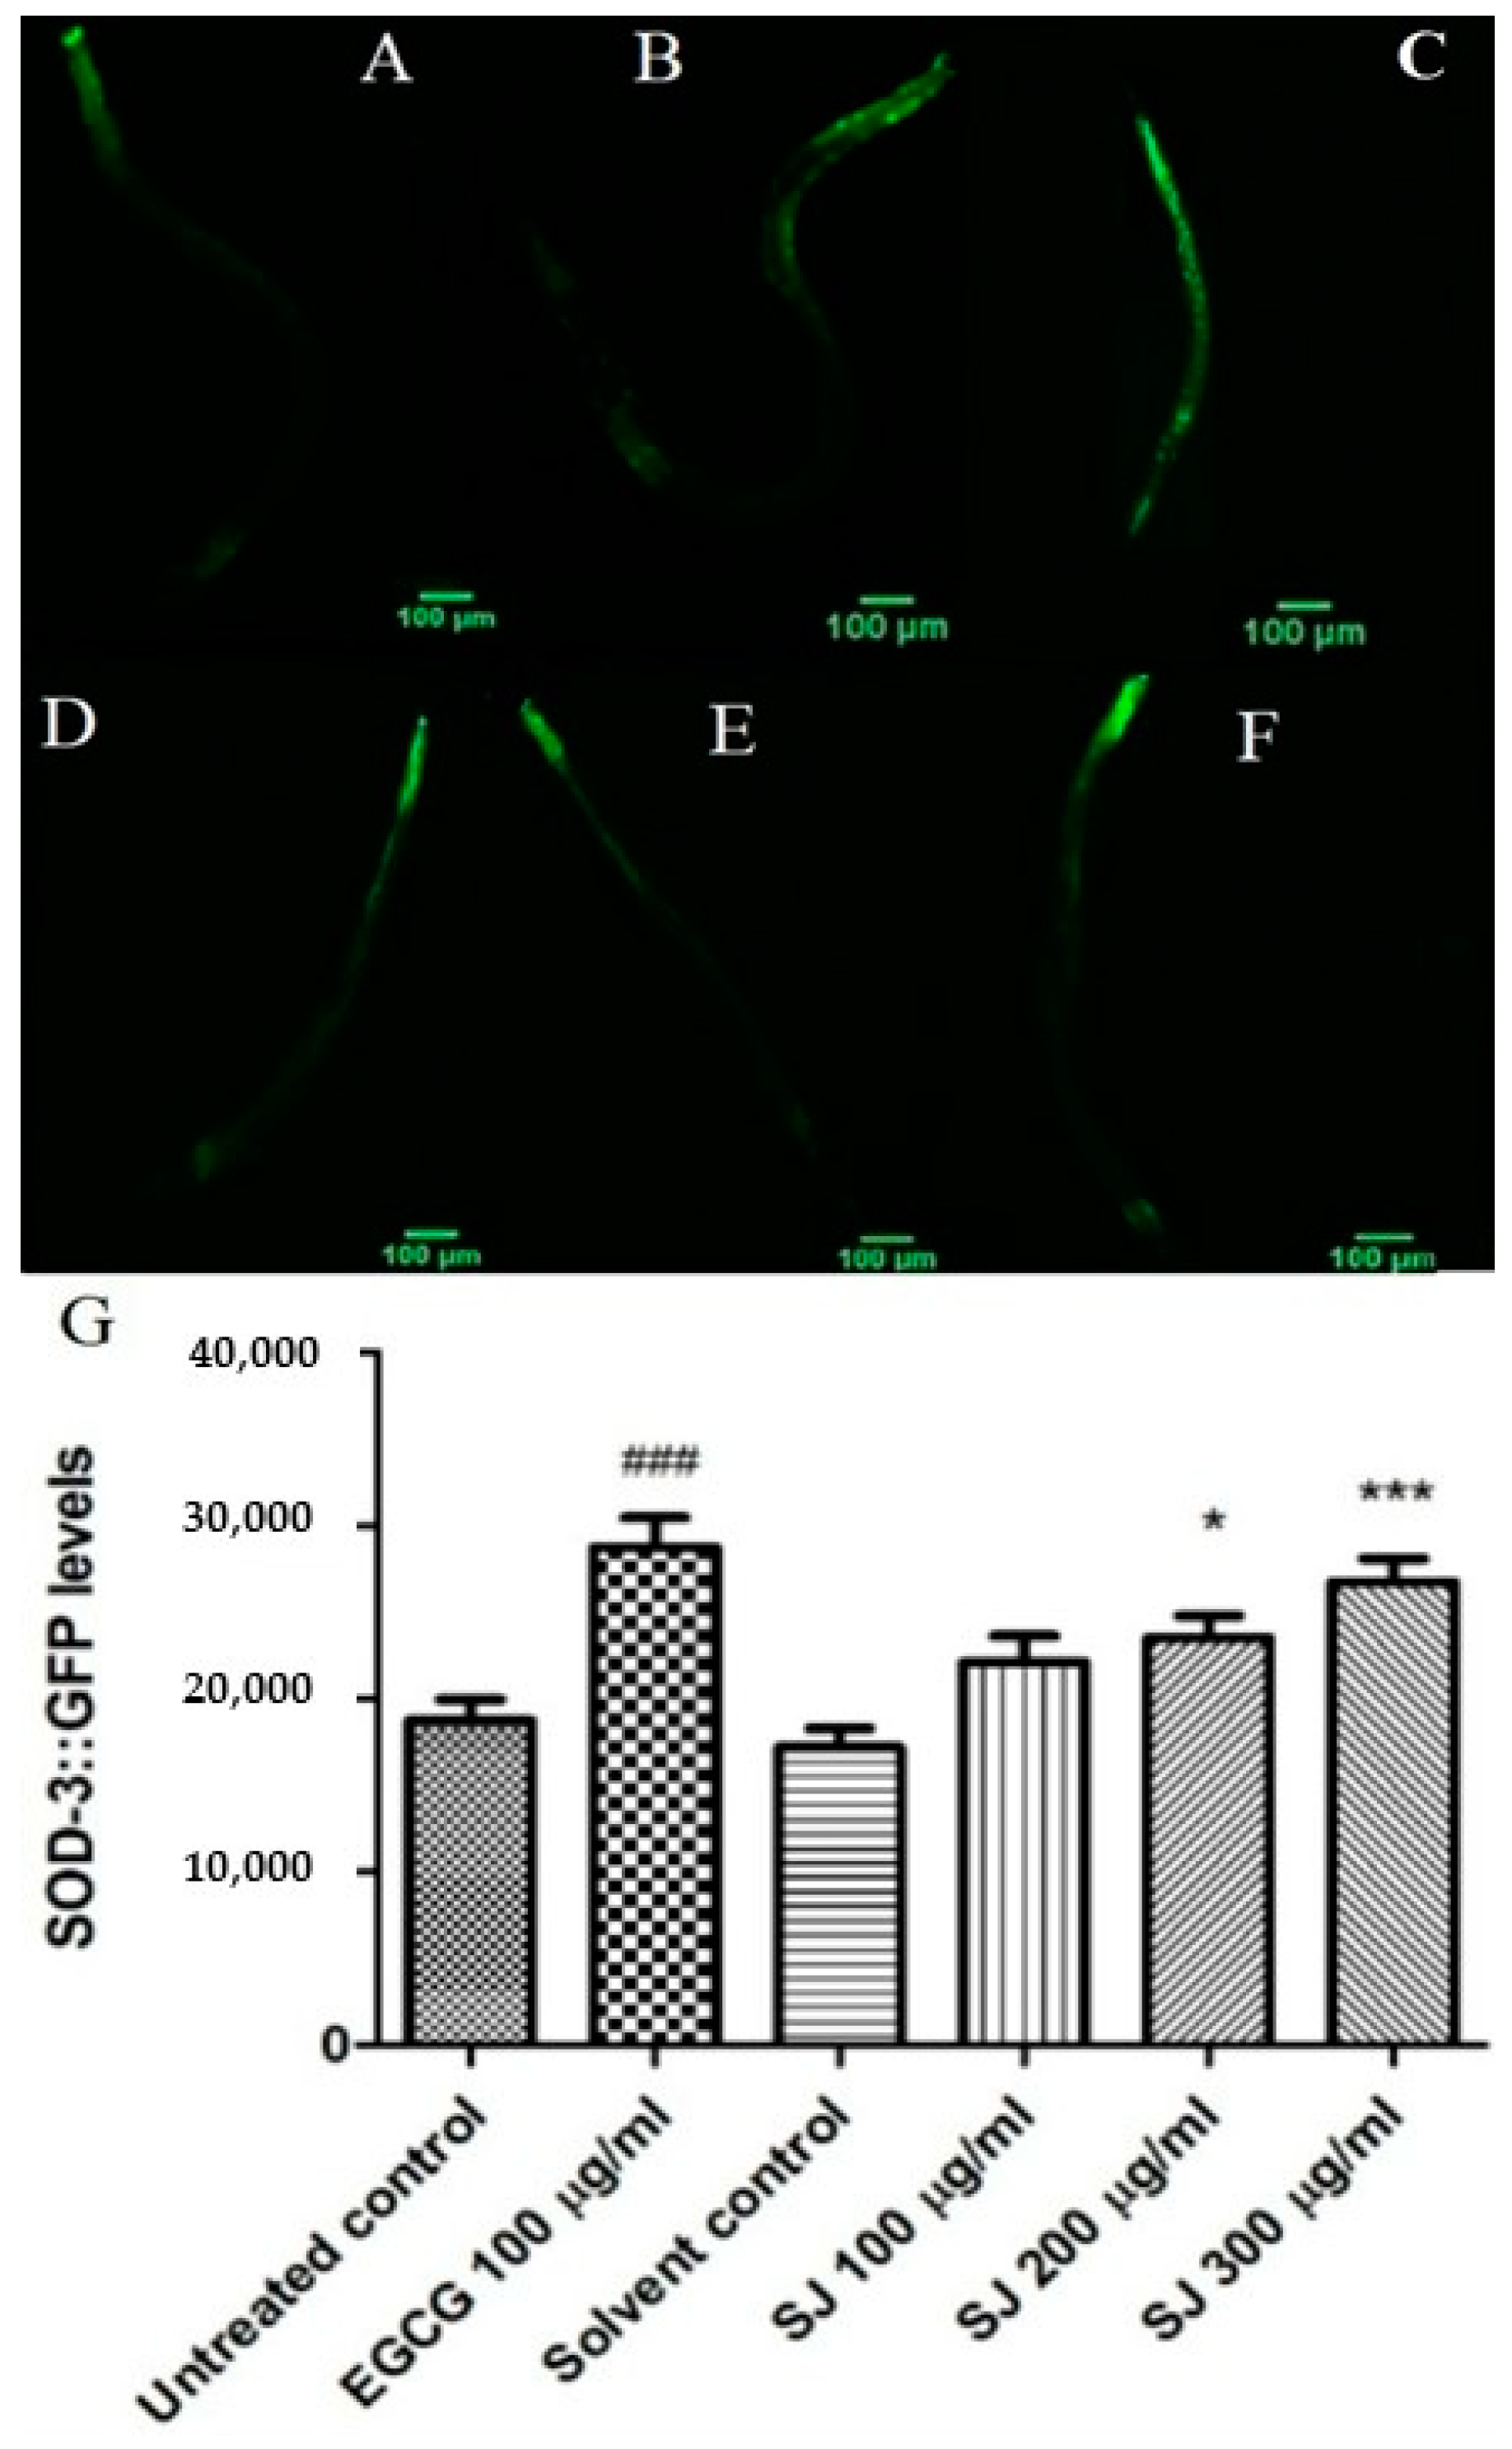
2.3.4. Expression of Sod-3 Gene

SOD-3 enzyme expression was evaluated using the mutant CF1553 strain with sod-3 coupled to GFP reporter. Compounds with antioxidant activities often lead to elevation in sod-3 levels, which increases the superoxide anion radical (O2-) scavenging effect. SJ extract increased the levels of sod-3 in a dose-dependent fashion. The highest concentration tested of SJ extract, 300 µg/mL, shows the highest levels of SOD-3 enzyme (55.5%) in comparison with the solvent control group, whereas EGCG showed a 53.3% increase similar to that of SJ 300 µg/mL (p-value < 0.001) (Figure 5). Since sod-3 is directly regulated by DAF-16, the observed antioxidant effects might be due to the participation of DAF-16 transcription factor.

2.4. In Vivo Antioxidant Activity Using TMT Mouse Model

TMT is an organotin widely known for being used as a pesticide [43]. However, its neurotoxicity was revealed from previous reports of human intoxication with symptoms of amnesia, memory impairment and epilepsy [44,45,46]. Many studies reported its selectivity towards hippocampus. Therefore, it is considered a good model to be used for neuroscience research [43], especially in chronic neurodegenerative disorders like Alzheimer’s disease (AD) [47]. TMT neurotoxicity is mainly mediated via oxidative damage, resulting in the elevation of ROS and extracellular glutamate levels [48,49]. Moreover, a decrease in total SOD and GSH levels usually occurs after TMT intoxication [50,51]. Increasing ROS levels, as a result of TMT intoxication, is usually accompanied by lipid peroxidation with subsequent production of lipid peroxidation products like 4-hydroxynonenal and MDA [52]. Natural phytoconstituents, as vitamin C and quercetin, proved to exert neuroprotective activity via modulation of the oxidative damage induced by TMT [53,54].
In the current work, intraperitoneal injection of 2.5 mg/kg TMT in mice caused acute neurotoxicity within 24 h [55]. Neurotoxicity, possibly via oxidative damage, was demonstrated by the increased levels of the lipid peroxidation product MDA in the brains of mice in TMT group compared with saline control group. Moreover, the levels of the antioxidant enzymes SOD, HO-1 and of GSH were decreased significantly in TMT group in comparison with saline control.

2.4.1. Levels of the Oxidative Stress Marker MDA

MDA is a known toxic lipid peroxidation byproduct responsible for induction of mutagenicity through interaction with proteins and DNA [56]. It is considered as one of the commonly known biomarkers for detecting lipid peroxidation levels [57].
Mice that received TMT manifested increment in the levels of MDA by 4.5-fold, compared to saline control group (p < 0.001). Mice pretreated with SJ extract showed significant depression in MDA levels as compared to the TMT group. The higher dose, SJ 200 mg/kg, showed a higher decline in MDA levels by 79.25 ± 0.09%; a result that is even higher than that of the group pretreated with EGCG (61.9 ± 1.47%, p < 0.001) (Figure 6). This result is similar to that observed in TMT mouse model using a Ginkgo biloba extract [58]. A proanthocyanidin-rich extract from Cassia abbreviata was also able to decrease MDA levels in rats [37].
The antioxidant effect exerted by SJ is probably due to the phenolic constituents found in the extract, like proanthocyanidins. They could be acting either directly through scavenging free radicals produced as a result of TMT injection, or indirectly via increasing antioxidant enzyme expression. A combination of both scenarios is also possible.

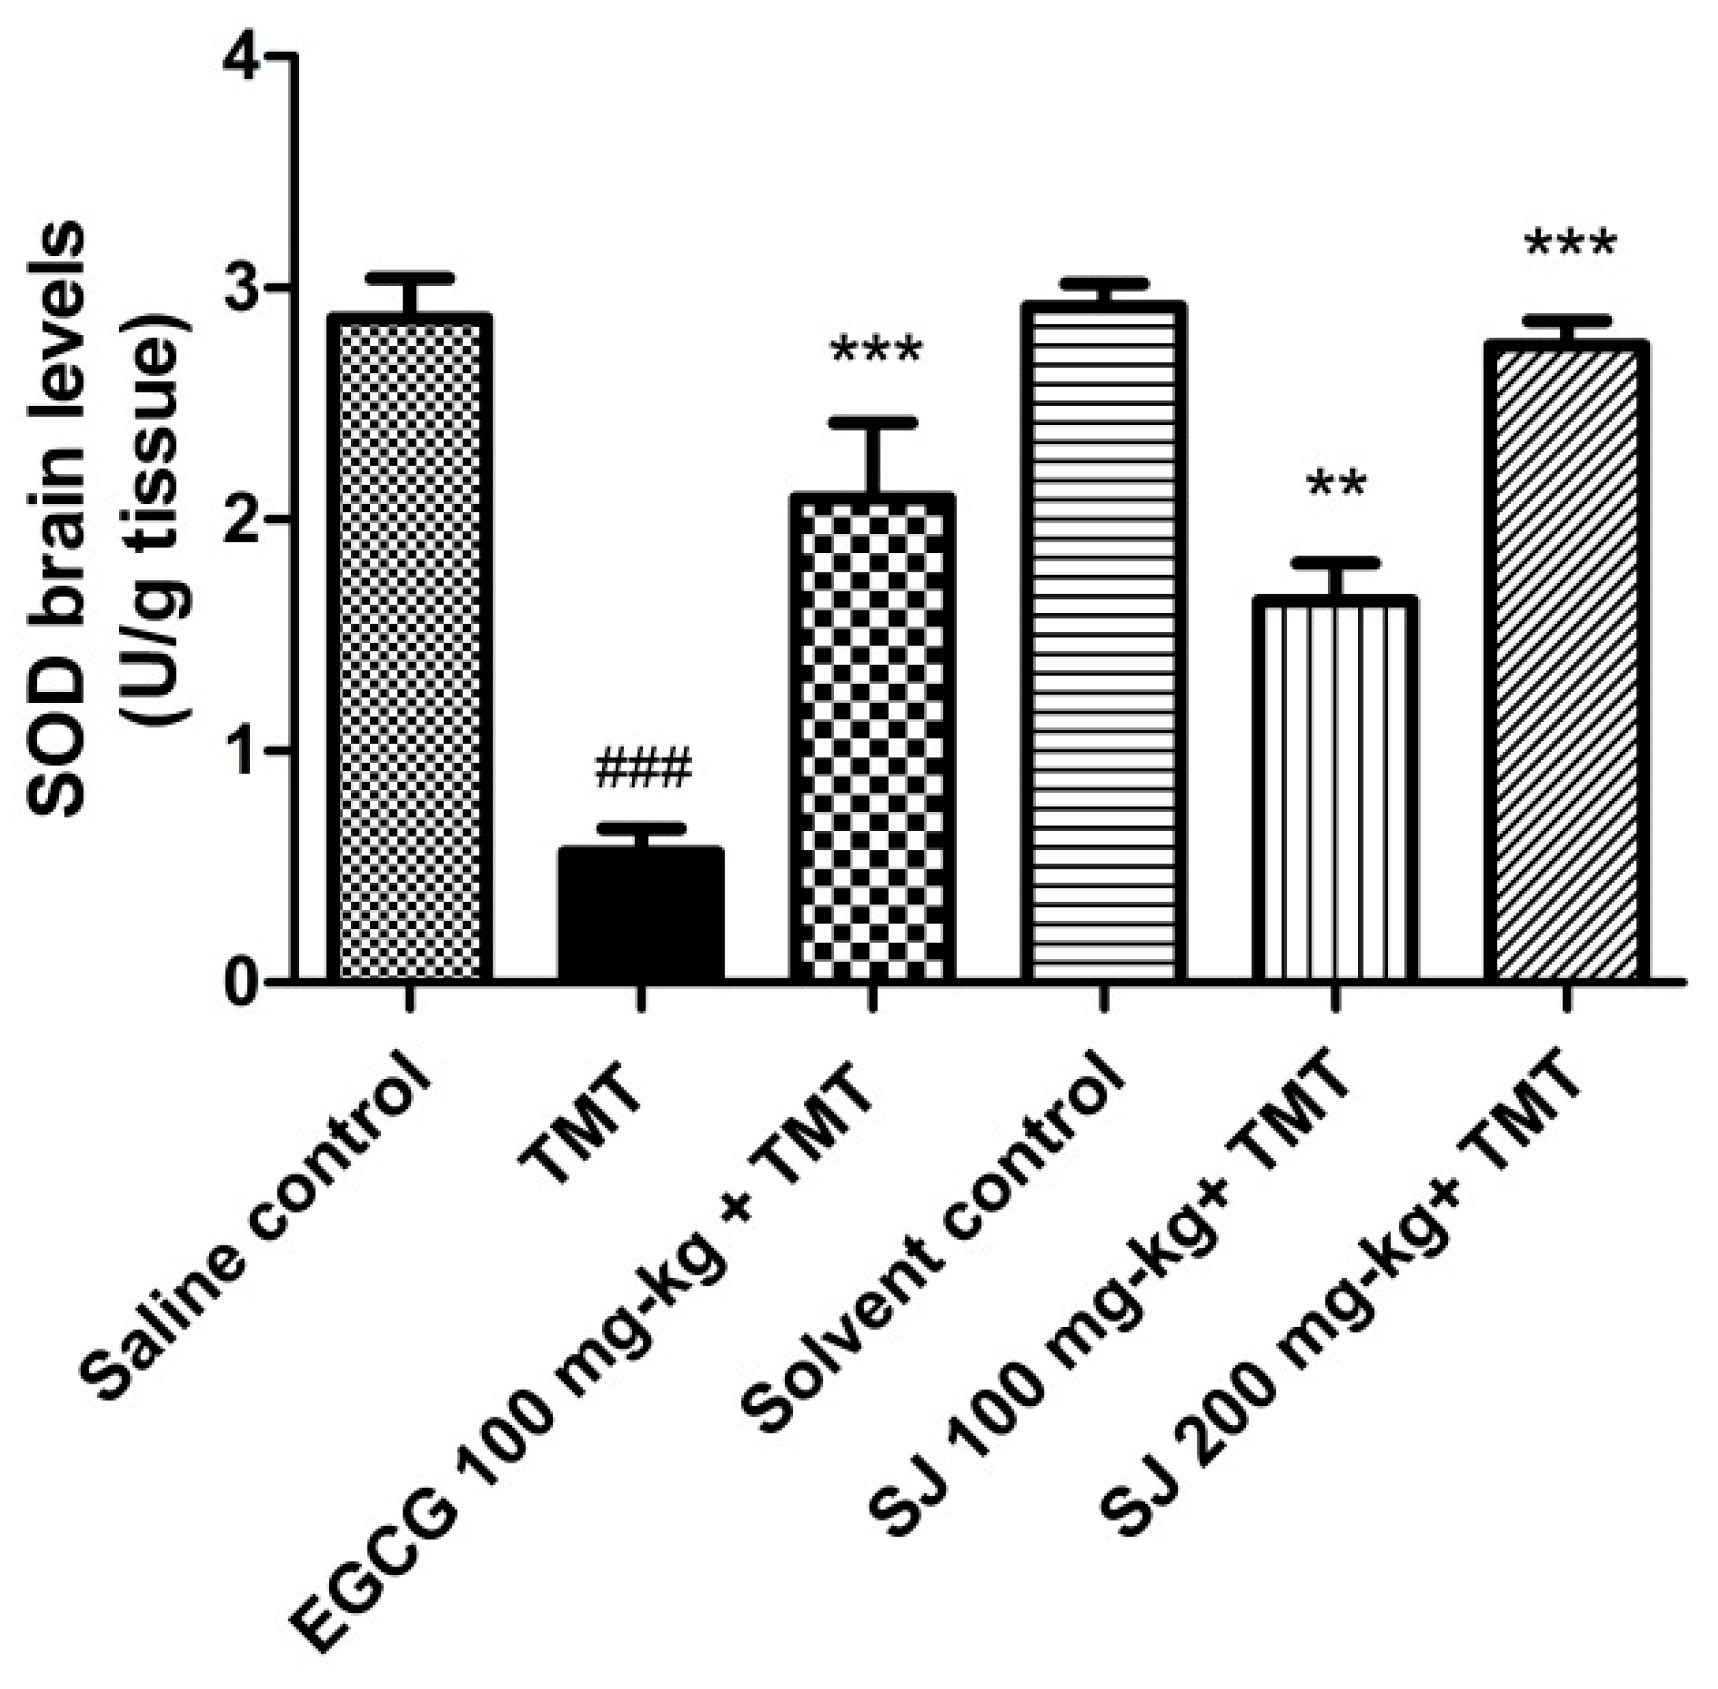
2.4.2. Brain SOD Levels

SODs are a family of metalloenzymes that exert antioxidant effect via detoxifying O2.- to O2 and hydrogen peroxide (H2O2) that is further reduced to H2O through glutathione peroxidase or catalase enzymes [59]. Antioxidant enzymes, like catalase and SOD, have a well-known role in protecting the body from high ROS levels via exerting detoxification mechanisms [60].
To highlight on the possible involvement of antioxidant enzymes in the action of SJ extract, total SOD levels were measured in brains of mice. Acute administration of TMT to mice resulted into 80 ± 0.1% decline in the levels of SOD enzyme in the brains in comparison with saline control group (p < 0.001). This effect was reported previously using the TMT-induced neurotoxicity model [50,58]. Treatment with SJ extract counteracted the decline in SOD enzyme levels in a dose-dependent way. The used doses showed significantly higher SOD levels compared to TMT treated group. SJ 200 mg/kg group showed improvement in SOD levels by 92.9 ± 0.11% (p < 0.001). EGCG also demonstrated a significant elevation in SOD levels in comparison with that of TMT group (64.9 ± 0.32%, p < 0.001) (Figure 7).
Quercetin derivative could be contributing to the observed effect of the extract, as previous data showed the ability of quercetin to increase SOD levels in a mouse model of Parkinson’s disease [61].

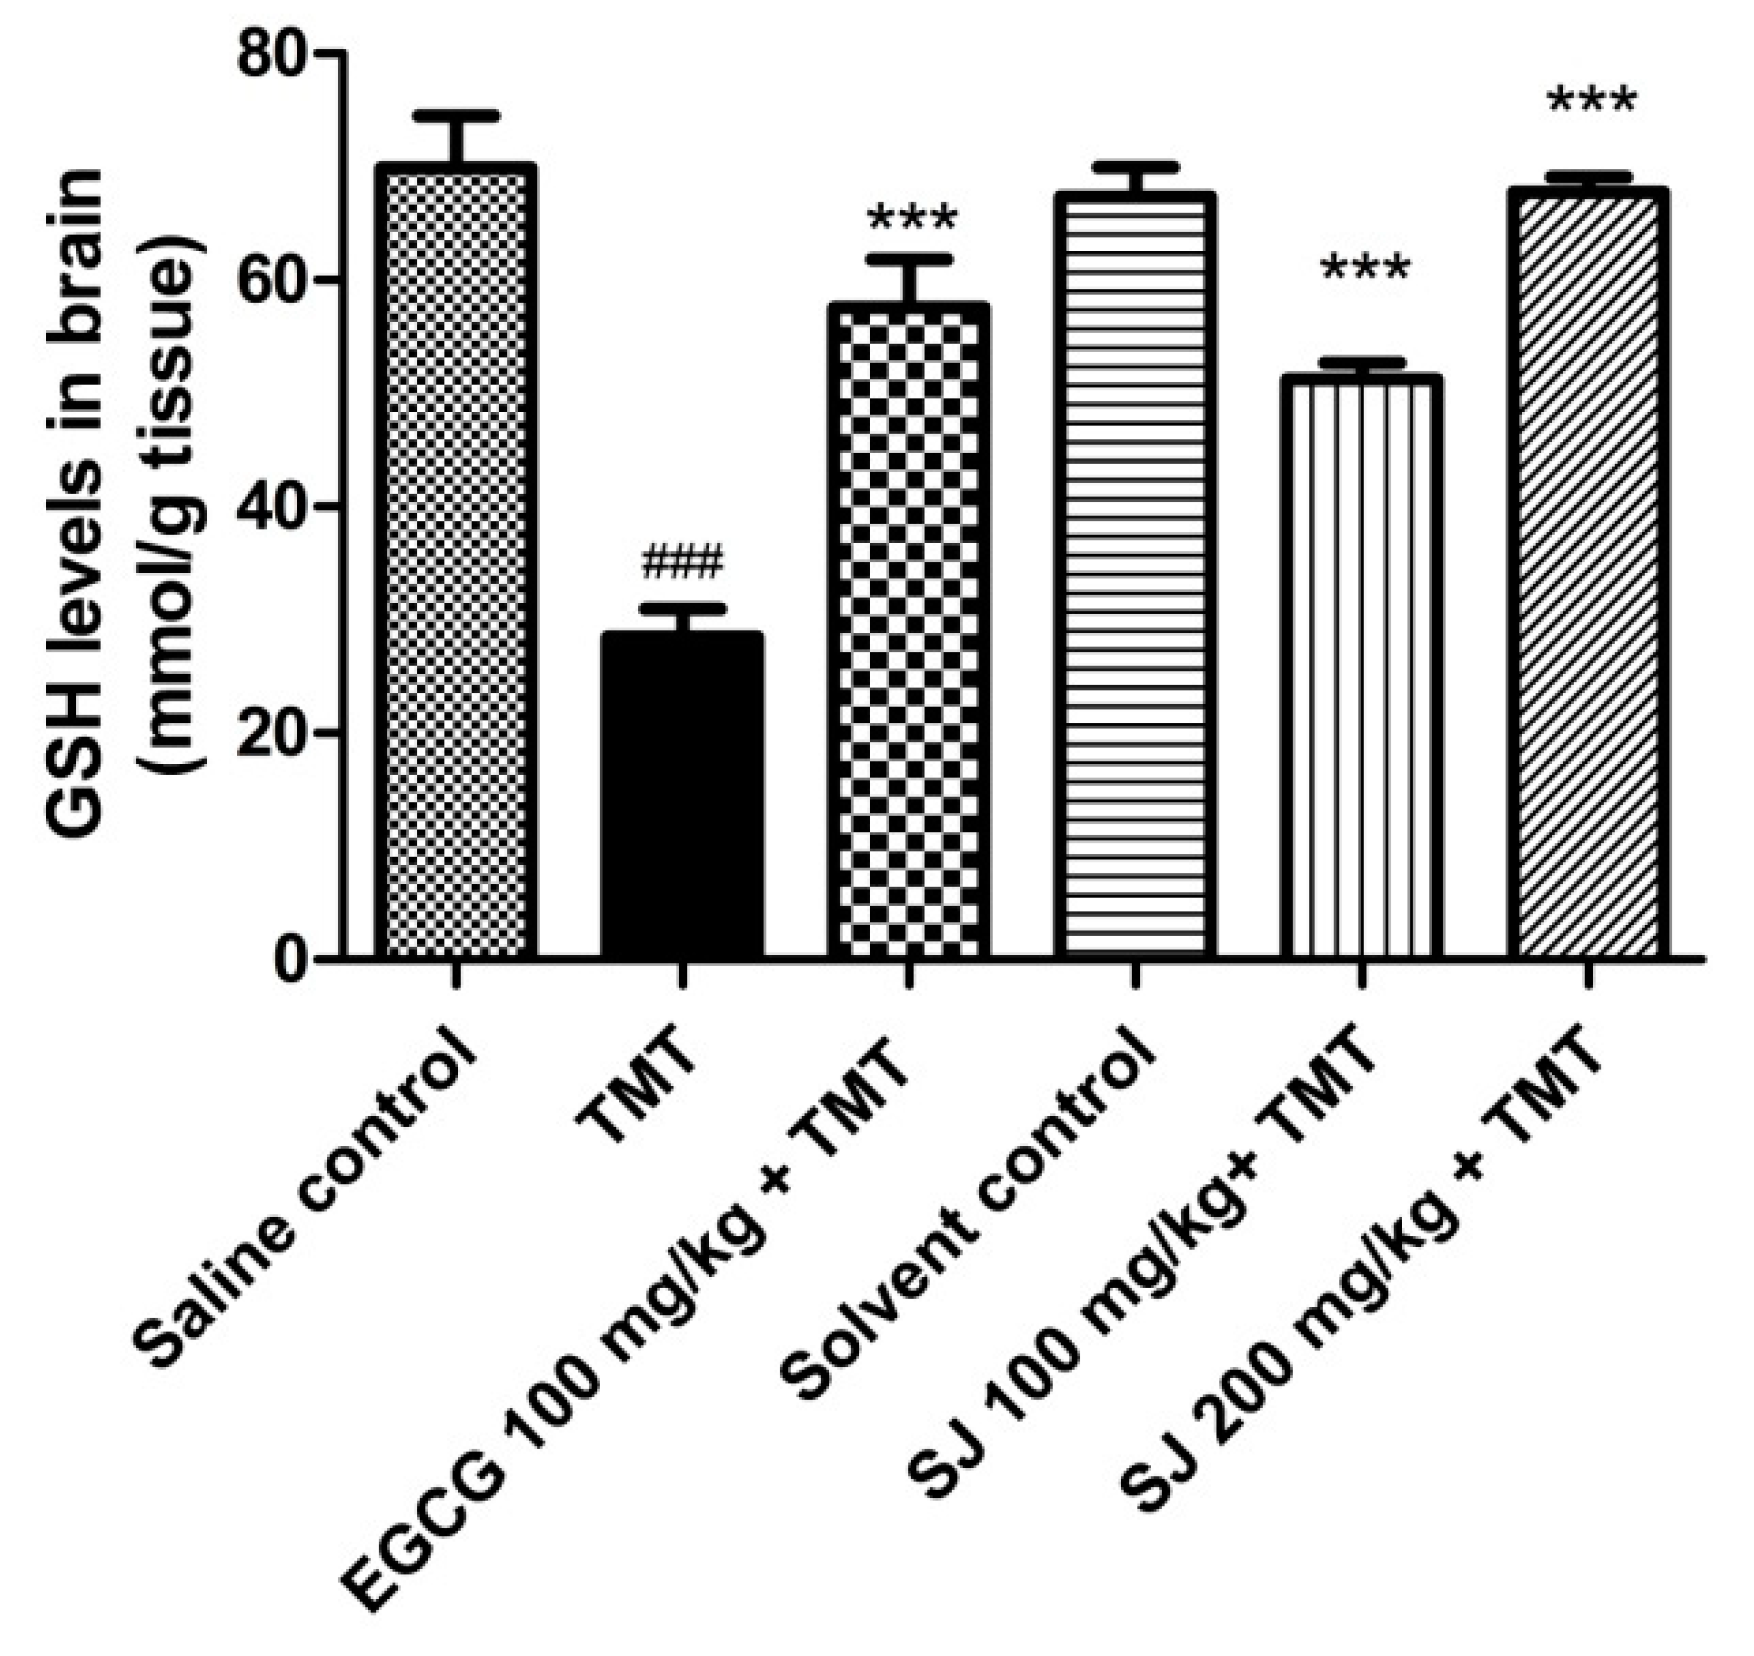
2.4.3. GSH Brain Levels

Glutathione is a well-known thiol containing nonenzymatic antioxidant compound found in the brain in its reduced and oxidized forms (GSH & GSSG) [62]. It protects the body from oxidative stress via direct scavenging activity of ROS and/or participation in some enzyme-catalyzed redox reactions to maintain redox homeostasis. Moreover, the absence of GSH in the brain increases the risk of oxidative stress and toxicity. Neurodegenerative disorders like AD, Parkinson’s disease (PD) and Huntington’s disease (HD) are characterized by imbalance in the levels of GSH in the brain. On the other side, low GSH levels is highly doubted to be one of the reasons for developing these diseases [63,64,65].
In the current study, the TMT treated mice demonstrated a highly significant decline of GSH to 59.16 ± 2.42% relative to saline control group (p < 0.001). Similarly, it was reported previously that the levels of GSH were reduced in the hippocampus of mice after administration of TMT [51]. However, groups treated with SJ extract showed higher GSH levels compared to TMT treated group. SJ 200 mg/kg treated group revealed 90.77 ± 1.32% elevation in GSH levels in the brain (p < 0.001). EGCG treated group showed highly significant result of 70.2 ± 4.24% elevation in GSH levels (p < 0.001) (Figure 8).
Previous administration of several herbal extracts resulted in elevating GSH levels, with a subsequent increase in the antioxidant potential and hepatoprotective activities in rat models of hepatotoxicity and neurodegenerative disorders like AD and PD [37,66,67].

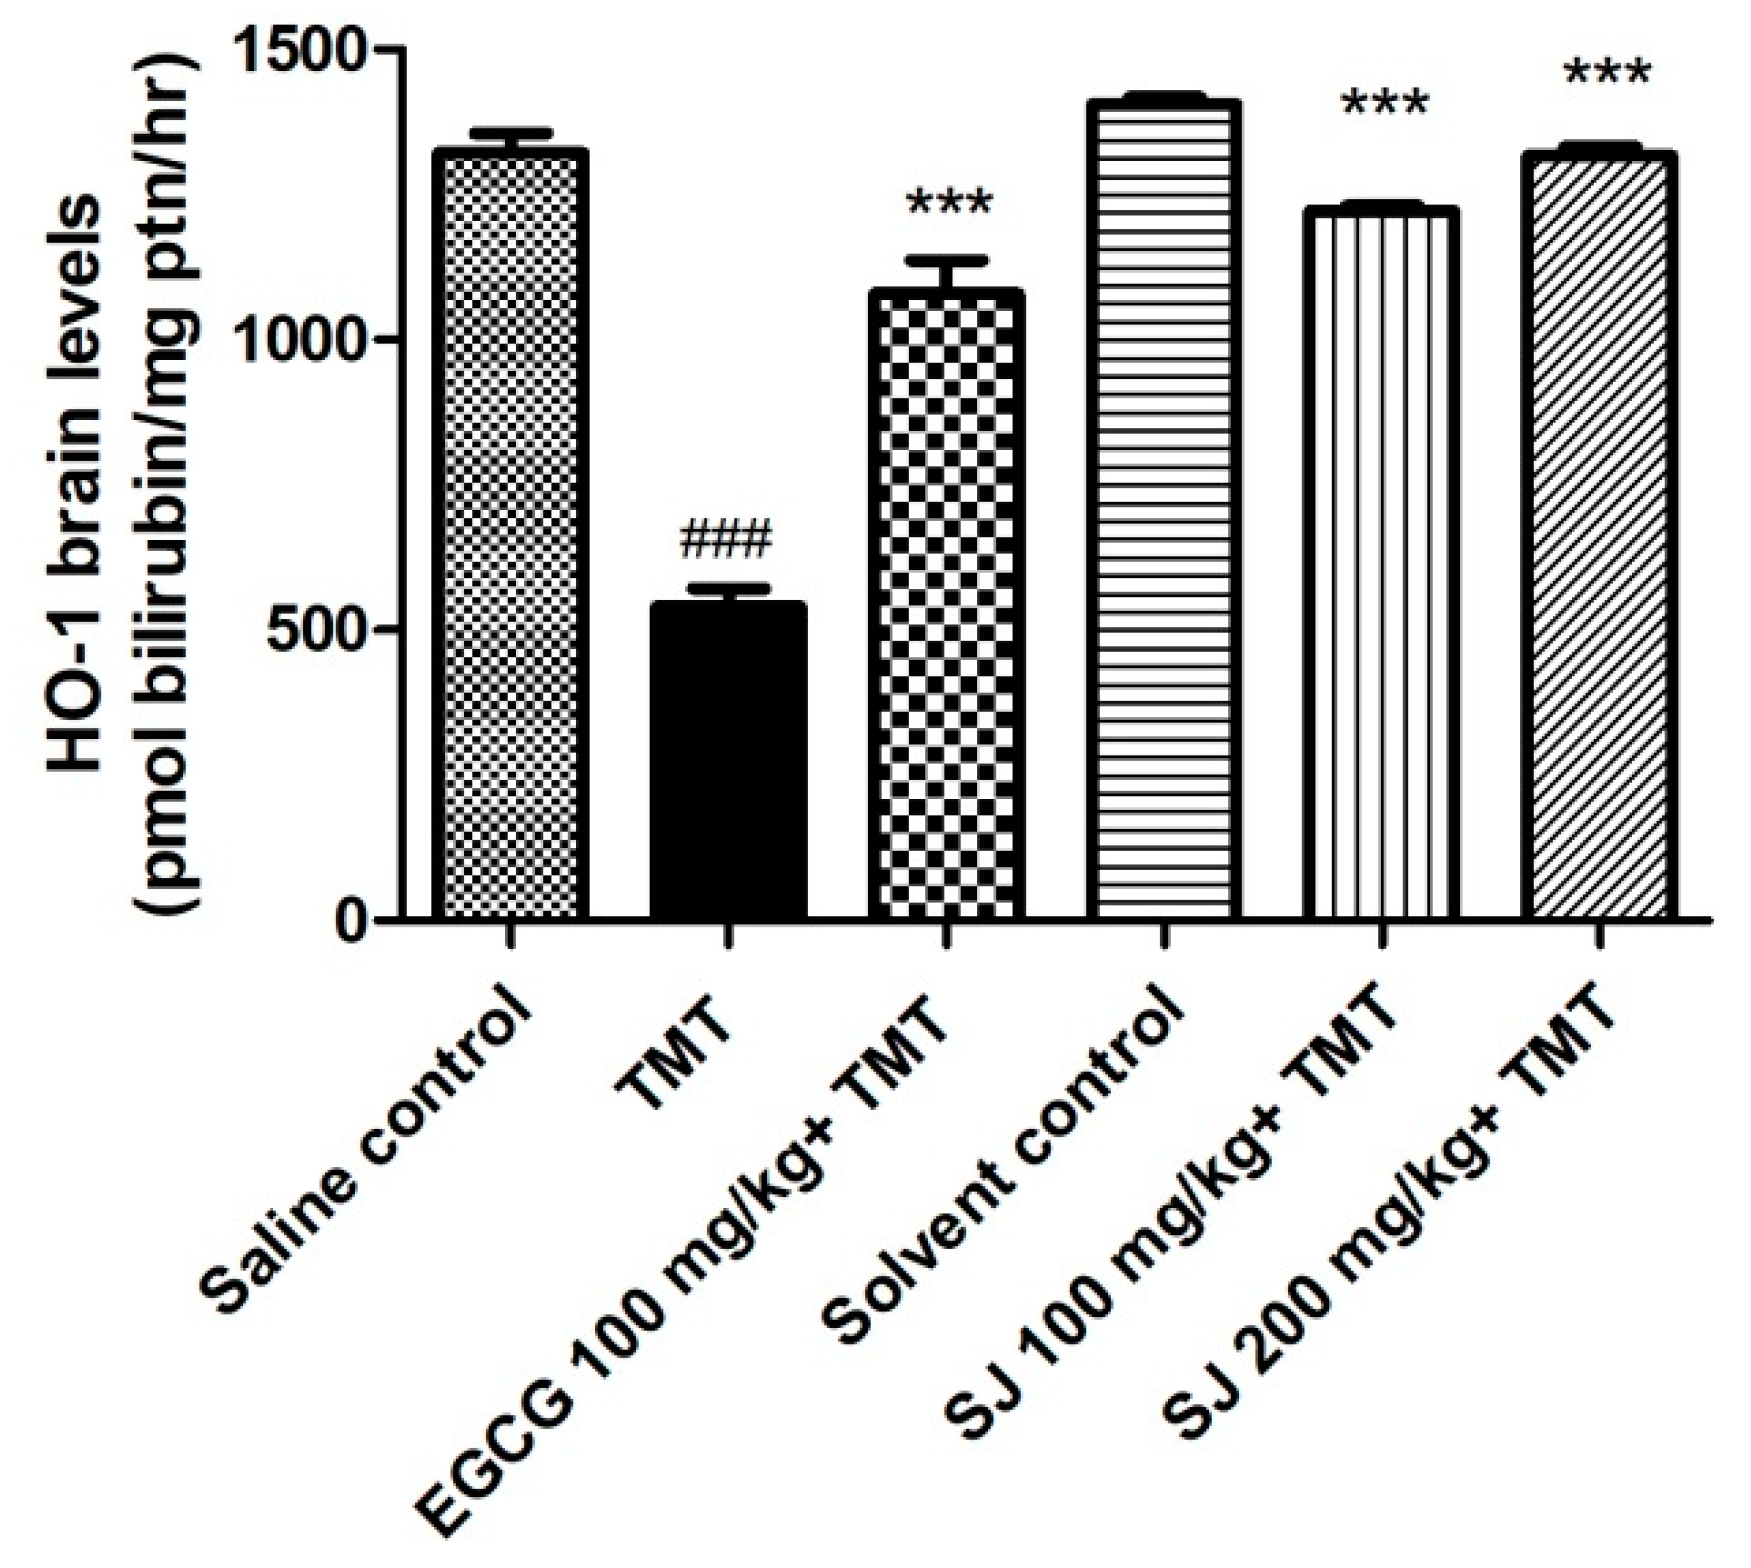
2.4.4. HO-1 Levels in Brain

HO-1 is an isoenzyme that belongs to the family of heme oxygenases. It is a stress-inducible antioxidant enzyme whose expression is induced via certain stressors like heavy metals, UV light, and heat shock. HO-1 activation is mediated via nuclear factor (erythroid-derived 2)-like 2/antioxidant response element (Nrf2/ARE) signaling pathway. It has a role in protecting neurons through catabolizing the pro-oxidant free heme to biliverdin, CO, and iron. This is essential to avoid the formation of free radicals that lead subsequently to cell death [68,69,70,71]. The increase in HO-1 expression is thought to increase oxidative stress resistance and to contribute in protection against cell death caused by oxidative stress [72].
In this study, TMT injection caused a highly significant decline in HO-1 levels by 59% relative to saline control group (p < 0.001), which could be due to over consumption of the enzyme to detoxify ROS. Groups that received SJ extract showed high HO-1 levels compared to TMT treated group. SJ 200 mg/kg treated group demonstrated the highest increase in HO-1 levels (89%, p < 0.001). EGCG treated group also showed a highly significant increase in HO-1 levels (62.3%, p < 0.001) (Figure 9). The previous results highlight the possibility of the involvement of Nrf2/ARE pathway in the activity of the extract.
To sum up, the observed in vivo antioxidant activities using mouse model of neurotoxicity could be due to the variety of phenolic constituents present, like kaempferol and quercetin with their derivatives, which have shown neuroprotective properties in previous studies via decreasing MDA levels, increasing SOD, GPx, and HO-1 levels [73].

3. Materials and Methods

3.1. Plant Material

Dried ripe fruits of Styphnolobium japonicum were purchased from Kräuter Schulte, Germany. A voucher specimen of the plant, accession number 0047, is kept at Department of Pharmaceutical Biology in the Faculty of Pharmacy and Biotechnology at German University in Cairo.
The dried fruits were grounded, homogenized, and then extracted exhaustively with 70% methanol using agitated maceration at a temperature of 50–60 °C, for 24 h. Next, cotton wool was used for filtering the extract followed by two other rounds of extraction using the same conditions on the same plant material. The extracts were concentrated by being subjected to vacuum concentration using rotary evaporator at 37 °C. The product was freeze-dried, using a lyophilizer, and stored at −20 °C for further usage.

3.2. Chemical Profiling of Phenolic Constituents with HPLC-PDA-ESI-MS/MS

Analysis of metabolites in SJ extract was done using HPLC-PDA-ESI-MS/MS. Thermo Finnigan LCQ-Duo ion trap mass spectrometer supported with an ESI source (Thermo Quest, Germany) directed to Finnigan Surveyor gradient HPLC system which compromises MS pump plus, autosampler (for automatic injection of the sample) and PDA detector plus was used. An EC 150/3 NUCLEODUR 100-3, reversed phase, C18ec column (Macherey-Nagel, Germany) was used for separation.
The mobile phase was composed of water and acetonitrile (ACN). The gradient employed was in the range of 5% to 60% ACN at 30 °C for 45 min, 0.5 mL/min flow rate. Sample volume of injection was 20 µL. MS detection was performed in the negative ion mode as previously described [18].
Full scan mode was applied with a mass range of 50 to 2000 m/z, using 35% collision energy for inducing fragmentation in MS/MS. Xcalibur software (XcaliburTM 2.0.7, Thermo Scientific, Waltham, MA, USA) was used for analysis and acquisition of data.

3.3. Antioxidant Activity In Vitro

3.3.1. Measurement of Total Phenolic Content

Folin–Ciocalteu assay was used for evaluating total phenolic content of the extract using a 96-well microplate [74]. Twenty microliters of the extract or gallic acid standard were added. Afterwards, the addition of 100 µL of Folin–Ciocalteu reagent (Merck, Darmstadt, Germany) took place. After waiting at room temperature for duration of 5 min, 80 µL of 7.5% solution sodium carbonate were put to all wells. The reaction was left to take place at room temperature for duration of 1 h, away from light. Finally, absorbance measurement was done at 750 nm via microplate reader. The assay was done in duplicates, three times. Expression of phenolic content is done as gallic acid equivalents (μg of GAE/mg of SJ extract).

3.3.2. DPPH Assay

This method was done to test for free radicals scavenging ability of SJ total extract in vitro. The assay was done using Blois method in a 96-well microplate [75]. One-hundred microliters of different concentrations of SJ, EGCG, and vitamin C were added followed by 100 μL of 200 μM DPPH solution (Sigma-Aldrich, Germany). Absorbance was measured at 517 nm after incubating the plate away from any source of light, for 30 min, at room temperature. A blank was prepared and measured for each sample in the same way, but without DPPH addition. The blank value was deducted from that of DPPH. All measurements were done in duplicates and the assay was repeated three times. The ability to scavenge radicals was calculated via the following equation.
DPPH scavenging ability (%) = [(A0 - A1)/A0] × 100
A0 and A1 represent the absorbance of the control and the sample respectively.
EC50 was evaluated via sigmoid nonlinear regression in SigmaPlot and represented in µg/mL.

3.4. In Vivo Antioxidant Activity

3.4.1. Strains and Culture Conditions of Caenorhabditis Elegans

All strains of C. elegans used in the current study and E.coli OP50 were bought from the Caenorhabditis Genetics Center (CGC), University of Minnesota, Minneapolis, MN, U.S.A.
All nematodes used in the study were cultured using nematode growth media (NGM) supplied with E. coli OP50 as their source of food and were preserved at 20 °C in an incubator. The used strains are as follows; wild type (N2), TJ375 (gpIs1[hsp-16.2::GFP]), and CF1553 (mu1s84[pAD76(sod-3::GFP)]). Age-synchronized worms were achieved as previously described [18,76].

3.4.2. Survival Assay

Worms were sorted into six groups, 75–80 worms in each. First and second groups were used as negative controls. The first group was not treated: untreated control. This group is used for comparison with the solvent control group to ensure the absence of any activity resulting from the solvent used for dissolving the extract. The second group was the solvent control group and was treated with the same solvent used for dissolving the extract: 2.1% methanol. The third one was that of the positive control, EGCG 50 µg/mL. The last three groups were given different concentrations of SJ extract dissolved in 2.1% methanol: 100, 200, and 300 µg/mL respectively. All groups were incubated at 20 °C for 48 h. Afterwards, a toxic concentration of 80 µM juglone (Sigma-Aldrich, Germany) was added, a pro-oxidant used for oxidative stress induction. All worms were left for 24 h then dead and alive ones were scored. The dead worms are those which did not react to gentle repetitive stimuli with a platinum wire [77]. Survival assay was repeated five times and results were calculated and recorded as mean ± SEM of survival rate %. Analysis of results was performed with one-way ANOVA and Bonferroni’s method (post hoc).

3.4.3. ROS Assay

Age-synchronized N2 worms at L1 stage were kept at 20 °C incubator in S-medium supplied with E.coli OP50. They were classified into six groups and treated as described before. Forty-eight hours later, all worms were washed using M9 buffer. After washing, 1 mL of 50 µM H2DCF-DA (Sigma-Aldrich, Germany), a dye used as an indication for ROS intracellular levels, was added to all groups. Afterwards, incubation was done at 20 °C for one hour in the absence of light. Finally, nematodes were washed using M9 buffer for the removal of excess dye. Fixing was done on glass slides using 10 mM sodium azide (AppliChem GmbH, Darmstadt, Germany) to induce paralysis. Fluorescence microscope (BIOREVO BZ-9000, Keyence Deutschland GmbH, Neu-Isenburg, Germany) supplied with mercury lamp at λex 480/20 nm, λem 510/38, was used to take live images from the worms using constant time of exposure and 10X objective lens [19]. At least 30 worms were photographed from each group and the relative fluorescence intensity was determined for the full body of the worm densitometrically via Image J, version 1.48 (National Institutes of Health, Bethesda, MD, USA). Three different runs were made and results were presented as average fluorescence intensity. Results were compared via one-way analysis of variance test (ANOVA) followed by Bonferroni’s method of correction.

3.4.4. Expression of Hsp-16.2::GFP

Transgenic age-synchronized TJ375 worms at L1 stage carrying GFP fused to Hsp-16.2 were used in this assay. Worms were sorted into six groups and treatment was performed as mentioned previously. All groups were left at 20 °C for 72 h. Afterwards, a sub-lethal juglone dose (20 µM) was added to all groups and worms were kept at 20 °C for another 24 h. 10 mM sodium azide was used for mounting the worms on glass slides [18]. Photos of 30 worms per group were taken using fixed time of exposure. Four different assays were performed and fluorescence intensity of the head was scored densitometrically via Image J. Results were analyzed and the mean fluorescence intensity was compared as previously mentioned.

3.4.5. Expression of Sod-3::GFP

Age-synchronized CF1553 transgenic L1 worms, where GFP is fused to Sod-3 gene, were utilized in this assay. They were sorted into six groups and treatment was done as previously mentioned, except for EGCG positive control group where a dose of 100 µg/mL was used. Seventy-two hours later, they were analyzed using fluorescence microscopy and 10 mM sodium azide was used to paralyze worms to be mounted on glass slides [78]. Twenty to thirty worms were photographed per group via 10X objective lens using a constant time of exposure. Relative fluorescence intensity for the posterior part of the intestine was densitometrically measured via Image J. Results of three assays were analyzed and mean fluorescence intensity was compared as described previously.

3.4.6. Animals

Adult Swiss albino male mice, 10–12 weeks old and weighing 25–30 g each, were used in the current study. All mice were bought from the animal colony of the National Institute of Research in Cairo, Egypt. They were housed for a minimum of one week in the animal house present in the Faculty of Pharmacy, Cairo University, for acclimatization before performing experiments. Animals were kept in plastic cages (6 mice/cage), supplied with wood shavings, and they were allowed to freely access rodent food and water. They were housed in both humidity and temperature-controlled room (20–25 °C; 50–60%) and exposed to 12 h light/dark cycle. Experiments involving animals were done after acquiring the approval of the Ethics Committee of the Faculty of Pharmacy in Cairo University (approval no. PT 2425). All treatments were done according to the guidelines of the National Institutes of Health Guide for Care and Use of Laboratory Animals. All considerations were done to make animal suffering as minimal as possible.

3.4.7. Experimental Design

A single TMT dose of 2.5 mg/kg was used for induction of neuronal damage in mice [55]. Mice were weighed and sorted randomly into six groups, 6 mice each. All injections were done intraperitoneally.
Group I: Mice were injected saline three times (the first injection followed by the second, 1 h later, then a third injection taken 2 h from the previous one). This group acted as normal (saline) control. Group II: Mice were injected saline. After 1 h, they were injected TMT (2.5 mg/kg, i.p.), and then 2 h later they were reinjected with saline. This group served as TMT group. Group III was positive control group; mice were injected 100 mg/kg EGCG 1 h before and 2 h after TMT injection. Group IV was solvent control group; mice were injected 0.7% MeOH at three time intervals 0 h, 1 h, and 3 h, respectively. Groups V and VI were injected 100 and 200 mg/kg SJ extract respectively, 1 h before and 2 h after TMT injection. 2 h following the last injection, half of the mice were sacrificed and the other half was sacrificed after 24 h [55].
Mice were euthanized by cervical dislocation and the brains were immediately excised, rinsed with cold saline, to remove R.B.C remnants, and blotted between 2 filter papers. All brains were weighed and kept in −80 °C for the assay of different antioxidant and oxidative stress markers.

3.4.8. Biochemical Analysis

Estimation of MDA Brain Levels

Estimation of lipid peroxides content in the brain, in response to injury mediated through TMT, was performed via assaying the most common lipid peroxidation product, MDA. MDA brain levels were evaluated in brain homogenates using the method described by Ohkawa et al. where brain homogenates were centrifuged (6000× g for 10 min at 4 °C). Afterwards, the supernatant was mixed with 0.67% thiobarbituric acid solution (TBA), 1% phosphoric acid and incubated in a water bath (95 °C for 1 h). After cooling, absorbance was measured at 532 nm [79].

Estimation of SOD Brain Levels

SODs total enzyme levels—cytosolic and mitochondrial—were determined in the brain homogenates using colorimetric test reagent kit (Biodiagnostics, Egypt) following the methods previously described by Nishikimi et al. [80]. Homogenates for measuring total SODs levels were centrifuged at 10,000× g for 15 min at 4 °C. Afterwards, a mixture of phosphate buffer, nitroblue tetrazolium (NBT), and NADH were added to the supernatant. Finally, phenazine methosulphate (PMS) was added to initiate the reaction and the increase in absorbance was recorded at 25 °C spectrophotometrically for 5 min at 560 nm.

Estimation of GSH Brain Levels

GSH brain levels were assayed using GSH kit of Biodiagnostic, Egypt. The method, according to Beutler and Kelly, depends on the reduction of 5,5’-dithiobis-(2-nitrobenzoic acid) (DTNB) by the SH group in glutathione (GSH) to produce an intense yellow compound. The reduced chromogen is directly proportional to GSH concentration and its absorbance can be measured colorimetrically at 405 nm [81].

Estimation of HO-1 Brain Levels

HO-1 isoenzyme activity in the brain tissue was evaluated following the method of Abraham et al. [82]. Bilirubin, the end product of heme degradation, was extracted using chloroform followed by determining its concentration spectrophotometrically.

3.5. Statistical Analysis

GraphPad Prism software version 5.01 (GraphPad Software Inc., San Diego, California, USA) was used for statistical analysis. Statistical significance between various groups was detected using one-way ANOVA followed by Bonferroni’s (post hoc) method. A probability level of p less than 0.05 was considered as statistically significant. SigmaPlot 11.0 (Systat Software GmbH Erkrath, Germany) was used to calculate EC50 value in DPPH assay.

4. Conclusions

Chemical profiling of a hydroalcoholic fruit extract of Styphnolobium japonicum by HPLC-PDA-ESI-MS/MS revealed the presence of a wide array of phenolic constituents, which could be responsible for the potential stress resistance properties shown via the in vivo used models.
In C. elegans, SJ extract exerted strong stress resistance properties via increasing survival rates, after exposure to oxidative stress, and decreasing intracellular ROS levels. Moreover, the antioxidant activity was demonstrated by the increased expression of sod-3, a DAF-16-specific target gene. Further studies are required to investigate the involvement of DAF-16/FOXO pathway in the activity of the extract.
Testing the extract on a mouse model—a mammalian system—has further confirmed the antioxidant and stress resistance activities. Furthermore, high levels of HO-1 suggest the possible intervention of Nrf2/ARE pathway in the activity of the extract.
In summary, the extract possesses promising activities and might be beneficial as a complementary therapy in the treatment of diseases involving oxidative stress. However, further investigations are needed to unveil the exact molecular mechanisms behind these activities. Additionally, its efficacy and safety on humans still needs exploration.

Author Contributions

H.H. was responsible for chemical characterization of SJ extract and for revising the manuscript. M.R. and B.C.d.A. performed the total phenolic content, in vitro antioxidant activity, and HSP assays. M.R. revised the manuscript. N.S.E.E.S. was responsible for doing the study design of the mouse model and revising the manuscript. S.T. performed survival, ROS, SOD-3, in vivo antioxidant assays using the mouse model, analyzed the experimental data, and wrote the paper. M.W. designed the project and revised the manuscript.

Funding

The authors received financial support from the Deutsche Forschungsgemeinschaft and Ruprecht-Karls-Universität Heidelberg within the funding program Open Access Publishing.

Acknowledgments

Special thanks to Bernhard Wetterauer (IPMB) for performing HPLC-PDA-ESI-MS/MS analyses and for Ms. Mai Selim, an instructor in the English department in the German University in Cairo, for considering the manuscript revision.

Conflicts of Interest

The authors declare no conflicts of interest.

References

  1. He, X.; Bai, Y.; Zhao, Z.; Wang, X.; Fang, J.; Huang, L.; Zeng, M.; Zhang, Q.; Zhang, Y.; Zheng, X. Local and traditional uses, phytochemistry, and pharmacology of Sophora japonica L.: A review. J. Ethnopharmacol. 2016, 187, 160–182. [Google Scholar] [CrossRef] [PubMed]
  2. Duke, J.A.; Ayensu, E.S. Medicinal Plants of China; Reference Publications Inc.: Algonac, MI, USA, 1985; Volume 2, pp. 363–705. [Google Scholar]
  3. Kite, G.C.; Veitch, N.C.; Boalch, M.E.; Lewis, G.P.; Leon, C.J.; Simmonds, M.S. Flavonol tetraglycosides from fruits of Styphnolobium japonicum (Leguminosae) and the authentication of Fructus Sophorae and Flos Sophorae. Phytochemistry 2009, 70, 785–794. [Google Scholar] [CrossRef] [PubMed]
  4. Beretz, A.; Cazenave, J.-P. The effect of flavonoids on blood-vessel wall interactions. Prog. Clin. Biol. Res. 1988, 280, 187–200. [Google Scholar] [PubMed]
  5. Bown, D. Encyclopedia of Herbs & Their Uses; Dorling Kindersley Publishing: New York, NY, USA, 1995; pp. 143–153. [Google Scholar]
  6. Nguyẽn, V.D.; Nguyẽn, G.C. Selected Medicinal Plants in Vietnam; Science and Technology Publishing House: Hanoi, Vietnam, 1999. [Google Scholar]
  7. Stuart, G. Chinese Materia Medica; Vegetable Kingdom; Southern Materials Center Inc.: Taipei, Taiwan, 1979; pp. 15–18. [Google Scholar]
  8. Vo, V. Dictionary of Medicinal Plants in Vietnam; Y Hoc: Ho Chi Minh City, Vietnam, 1997; Volume 435, p. 1249. [Google Scholar]
  9. WHO. Medicinal Plants in the Republic of Korea: Information on 150 Commonly Used Medicinal Plants; WHO Regional Office for the Western Pacific: Manila, Philippines, 1998. [Google Scholar]
  10. Yoon, H.-J.; Seo, C.-R.; Kim, M.; Kim, Y.-J.; Song, N.-J.; Jang, W.-S.; Kim, B.-J.; Lee, J.; Hong, J.-W.; Nho, C.W. Dichloromethane extracts of Sophora japonica L. stimulate osteoblast differentiation in mesenchymal stem cells. Nutr. Res. 2013, 33, 1053–1062. [Google Scholar] [CrossRef] [PubMed]
  11. Abdallah, H.M.; Al-Abd, A.M.; Asaad, G.F.; Abdel-Naim, A.B.; El-Halawany, A.M. Isolation of antiosteoporotic compounds from seeds of Sophora japonica. PLoS ONE 2014, 9, e98559. [Google Scholar] [CrossRef] [PubMed]
  12. Che, C.-T.; Wong, M.; Lam, C. Natural products from Chinese medicines with potential benefits to bone health. Molecules 2016, 21, 239. [Google Scholar] [CrossRef] [PubMed]
  13. Joo, S.-S.; Won, T.-J.; Kang, H.-C.; Lee, D.-I. Isoflavones extracted from sophorae fructus upregulate IGF-I and TGF-β and inhibit osteoclastogenesis in rat born marrow cells. Arch. Pharmacal Res. 2004, 27, 99–105. [Google Scholar] [CrossRef]
  14. Lao, C.-J.; Lin, J.-G.; Kuo, J.-S.; Chao, P.-D.L.; Cheng, C.-Y.; Tang, N.-Y.; Hsieh, C.-L. Microglia, apoptosis and interleukin-1β expression in the effect of Sophora Japonica L. on cerebral infarct induced by ischemia-reperfusion in rats. Am. J. Chin. Med. 2005, 33, 425–438. [Google Scholar] [CrossRef] [PubMed]
  15. Kimura, M.; Yamada, H. Interaction in the antibacterial activity of flavonoids from Sophora japonica L. to Propionibacterium. Yakugaku Zasshi J. Pharma. Soc. Jpn. 1984, 104, 340. [Google Scholar] [CrossRef]
  16. Park, K.W.; Lee, J.-E.; Park, K.-M. Diets containing Sophora japonica L. prevent weight gain in high-fat diet-induced obese mice. Nutr. Res. 2009, 29, 819–824. [Google Scholar] [CrossRef]
  17. Tang, Y.-P.; Li, Y.-F.; Hu, J.; Lou, F.-C. Isolation and identification of antioxidants from Sophora japonica. J. Asian Nat. Prod. Res. 2002, 4, 123–128. [Google Scholar] [CrossRef] [PubMed]
  18. Thabit, S.; Handoussa, H.; Roxo, M.; El Sayed, N.S.; de Azevedo, B.C.; Wink, M. Evaluation of antioxidant and neuroprotective activities of Cassia fistula (L.) using the Caenorhabditis elegans model. PeerJ 2018, 6, e5159. [Google Scholar] [CrossRef] [PubMed]
  19. Peixoto, H.; Roxo, M.; Silva, E.; Valente, K.; Braun, M.; Wang, X.; Wink, M. Bark Extract of the Amazonian Tree Endopleura uchi (Humiriaceae) Extends Lifespan and Enhances Stress Resistance in Caenorhabditis elegans. Molecules 2019, 24, 915. [Google Scholar] [CrossRef] [PubMed]
  20. Braungart, E.; Gerlach, M.; Riederer, P.; Baumeister, R.; Hoener, M.C. Caenorhabditis elegans MPP+ model of Parkinson’s disease for high-throughput drug screenings. Neurodegener. Dis. 2004, 1, 175–183. [Google Scholar] [CrossRef] [PubMed]
  21. Bergantin, C.; Maietti, A.; Cavazzini, A.; Pasti, L.; Tedeschi, P.; Brandolini, V.; Marchetti, N. Bioaccessibility and HPLC-MS/MS chemical characterization of phenolic antioxidants in Red Chicory (Cichorium intybus). J. Funct. Foods 2017, 33, 94–102. [Google Scholar] [CrossRef]
  22. Benayad, Z.; Gómez-Cordovés, C.; Es-Safi, N.E. Characterization of flavonoid glycosides from fenugreek (Trigonella foenum-graecum) crude seeds by HPLC–DAD–ESI/MS analysis. Int. J. Mol. Sci. 2014, 15, 20668–20685. [Google Scholar] [CrossRef] [PubMed]
  23. Simirgiotis, M.J.; Benites, J.; Areche, C.; Sepúlveda, B. Antioxidant capacities and analysis of phenolic compounds in three endemic Nolana species by HPLC-PDA-ESI-MS. Molecules 2015, 20, 11490–11507. [Google Scholar] [CrossRef]
  24. Brito, A.; Ramirez, J.E.; Areche, C.; Sepúlveda, B.; Simirgiotis, M.J. HPLC-UV-MS profiles of phenolic compounds and antioxidant activity of fruits from three citrus species consumed in Northern Chile. Molecules 2014, 19, 17400–17421. [Google Scholar] [CrossRef]
  25. Wan, C.; Yu, Y.; Zhou, S.; Tian, S.; Cao, S. Isolation and identification of phenolic compounds from Gynura divaricata leaves. Pharmacogn. Mag. 2011, 7, 101. [Google Scholar]
  26. Oszmiański, J.; Kolniak-Ostek, J.; Wojdyło, A. Application of ultra performance liquid chromatography-photodiode detector-quadrupole/time of flight-mass spectrometry (UPLC-PDA-Q/TOF-MS) method for the characterization of phenolic compounds of Lepidium sativum L. sprouts. Eur. Food Res. Technol. 2013, 236, 699–706. [Google Scholar] [CrossRef]
  27. Fracassetti, D.; Costa, C.; Moulay, L.; Tomás-Barberán, F.A. Ellagic acid derivatives, ellagitannins, proanthocyanidins and other phenolics, vitamin C and antioxidant capacity of two powder products from camu-camu fruit (Myrciaria dubia). Food Chem. 2013, 139, 578–588. [Google Scholar] [CrossRef] [PubMed]
  28. Schatz, P.; Lappierr, C.; Ralph, J. Synthesis of hydroxycinnamoyl-L-malic acids and identification of 5-hydroxyferuloyl-L-malic acid in COMT-downregulated Arabidopsis. In Proceedings of the International Symposium on Wood and Pulping Chemistry, Madison, WI, USA, 9–12 June 2003; Volume 3, pp. 159–162. [Google Scholar]
  29. Ferreres, F.; Sousa, C.; Justin, M.; Valentão, P.; Andrade, P.B.; Llorach, R.; Rodrigues, A.; Seabra, R.M.; Leitão, A. Characterisation of the phenolic profile of Boerhaavia diffusa L. by HPLC-PAD-MS/MS as a tool for quality control. Phytochem. Anal. 2005, 16, 451–458. [Google Scholar] [CrossRef] [PubMed]
  30. Martucci, M.E.P.; De Vos, R.C.; Carollo, C.A.; Gobbo-Neto, L. Metabolomics as a potential chemotaxonomical tool: Application in the genus Vernonia Schreb. PLoS ONE 2014, 9, e93149. [Google Scholar] [CrossRef] [PubMed]
  31. Barros, L.; Dueñas, M.; Ferreira, I.C.; Carvalho, A.M.; Santos-Buelga, C. Use of HPLC–DAD–ESI/MS to profile phenolic compounds in edible wild greens from Portugal. Food Chem. 2011, 127, 169–173. [Google Scholar] [CrossRef]
  32. Kajdžanoska, M.; Gjamovski, V.; Stefova, M. HPLC-DAD-ESI-MSn identification of phenolic compounds in cultivated strawberries from Macedonia. Maced. J. Chem. Chem. Eng. 2010, 29, 181–194. [Google Scholar] [CrossRef] [Green Version]
  33. Bamawa, C.M.; Ndjele, L.M.; Foma, F.M. Characterization of leaf phenolic compounds of Hymenocardia ulmoides (Wild plant tea) by HPLC-MS. Int. J. Pharm. Biol. Res. 2013, 4, 170–174. [Google Scholar]
  34. Beelders, T.; De Beer, D.; Stander, M.; Joubert, E. Comprehensive phenolic profiling of Cyclopia genistoides (L.) Vent. by LC-DAD-MS and-MS/MS reveals novel xanthone and benzophenone constituents. Molecules 2014, 19, 11760–11790. [Google Scholar] [CrossRef]
  35. Mai, T.T.; Thu, N.N.; Tien, P.G.; Van Chuyen, N. Alpha-glucosidase inhibitory and antioxidant activities of Vietnamese edible plants and their relationships with polyphenol contents. J. Nutr. Sci. Vitaminol. 2007, 53, 267–276. [Google Scholar] [CrossRef]
  36. Kampkötter, A.; Nkwonkam, C.G.; Zurawski, R.F.; Timpel, C.; Chovolou, Y.; Wätjen, W.; Kahl, R. Effects of the flavonoids kaempferol and fisetin on thermotolerance, oxidative stress and FoxO transcription factor DAF-16 in the model organism Caenorhabditis elegans. Arch. Toxicol. 2007, 81, 849–858. [Google Scholar] [CrossRef]
  37. Sobeh, M.; Mahmoud, M.F.; Abdelfattah, M.A.; Cheng, H.; El-Shazly, A.M.; Wink, M. A proanthocyanidin-rich extract from Cassia abbreviata exhibits antioxidant and hepatoprotective activities in vivo. J. Ethnopharmacol. 2018, 213, 38–47. [Google Scholar] [CrossRef]
  38. Kampkötter, A.; Nkwonkam, C.G.; Zurawski, R.F.; Timpel, C.; Chovolou, Y.; Wätjen, W.; Kahl, R. Investigations of protective effects of the flavonoids quercetin and rutin on stress resistance in the model organism Caenorhabditis elegans. Toxicology 2007, 234, 113–123. [Google Scholar] [CrossRef]
  39. Strayer, A.; Wu, Z.; Christen, Y.; Link, C.D.; Luo, Y. Expression of the small heat-shock protein Hsp16-2 in Caenorhabditis elegans is suppressed by Ginkgo biloba extract EGb 761. FASEB J. 2003, 17, 2305–2307. [Google Scholar] [CrossRef]
  40. Rattan, S.I. Hormesis in aging. Ageing Res. Rev. 2008, 7, 63–78. [Google Scholar] [CrossRef]
  41. Pietsch, K.; Saul, N.; Chakrabarti, S.; Stürzenbaum, S.R.; Menzel, R.; Steinberg, C.E. Hormetins, antioxidants and prooxidants: Defining quercetin-, caffeic acid-and rosmarinic acid-mediated life extension in C. elegans. Biogerontology 2011, 12, 329–347. [Google Scholar] [CrossRef]
  42. Hsu, A.-L.; Murphy, C.T.; Kenyon, C. Regulation of aging and age-related disease by DAF-16 and heat-shock factor. Science 2003, 300, 1142–1145. [Google Scholar] [CrossRef]
  43. Balaban, C.; Callaghan, J.; Billingsle, M. Trimethyltin-induced neuronal damage in the rat brain: Comparative studies using silver degeneration stains, immunocytochemistry and immunoassay for neuronotypic and gliotypic proteins. Neuroscience 1988, 26, 337–361. [Google Scholar] [CrossRef]
  44. Feldman, R.G.; White, R.F.; Eriator, I.I. Trimethyltin encephalopathy. Arch. Neurol. 1993, 50, 1320–1324. [Google Scholar] [CrossRef]
  45. Fortemps, E.; Amand, G.; Bomboir, A.; Lauwerys, R.; Laterre, E.-C. Trimethyltin poisoning·report of two cases. Int. Arch. Occup. Environ. Health 1978, 41, 1–6. [Google Scholar] [CrossRef]
  46. Kreyberg, S.; Torvik, A.; Bjørneboe, A.; Wiik-Larsen, W.; Jacobsen, D. Trimethyltin poisoning: Report of a case with postmortem examination. Clin. Neuropathol. 1992, 11, 256–259. [Google Scholar]
  47. O’Connell, A.W.; Strada, O.; Earley, B.; Leonard, B.E. Altered expression of amyloid protein precursor mRNA in the rat hippocampus following trimethyltin intoxication: An in situ hybridization study. Neurochem. Int. 1997, 30, 313–320. [Google Scholar] [CrossRef]
  48. Ali, S.; LeBel, C.; Bondy, S. Reactive oxygen species formation as a biomarker of methylmercury and trimethyltin neurotoxicity. Neurotoxicology 1992, 13, 637–648. [Google Scholar]
  49. Naalsund, L.; Fonnum, F. The effect of trimethyltin on three glutamergic and gabaergic transmitter parameters in vitro: High affinity uptake, release and receptor binding. Neurotoxicology 1986, 7, 53–62. [Google Scholar] [PubMed]
  50. Ha, J.S.; Jin, D.E.; Park, S.K.; Park, C.H.; Seung, T.W.; Bae, D.-W.; Kim, D.-O.; Heo, H.J. Antiamnesic effect of Actinidia arguta extract intake in a mouse model of TMT-induced learning and memory dysfunction. EVID-Based Complem. Altern. Med. 2015, 2015. [Google Scholar] [CrossRef]
  51. Kim, J.M.; Park, S.K.; Kang, J.Y.; Park, S.B.; Yoo, S.K.; Han, H.J.; Kim, C.-W.; Lee, U.; Kim, S.-H.; Heo, H.J. Ethyl Acetate Fraction from Persimmon (Diospyros kaki) Ameliorates Cerebral Neuronal Loss and Cognitive Deficit via the JNK/Akt Pathway in TMT-Induced Mice. Int. J. Mol. Sci. 2018, 19, 1499. [Google Scholar] [CrossRef] [PubMed]
  52. Wang, X.; Wang, W.; Li, L.; Perry, G.; Lee, H.-G.; Zhu, X. Oxidative stress and mitochondrial dysfunction in Alzheimer’s disease. Biochim. Biophys. Acta Mol. Basis Dis. 2014, 1842, 1240–1247. [Google Scholar] [CrossRef]
  53. Choi, G.N.; Kim, J.H.; Kwak, J.H.; Jeong, C.-H.; Jeong, H.R.; Lee, U.; Heo, H.J. Effect of quercetin on learning and memory performance in ICR mice under neurotoxic trimethyltin exposure. Food Chem. 2012, 132, 1019–1024. [Google Scholar] [CrossRef]
  54. Shin, E.-J.; Suh, S.; Lim, Y.; Jhoo, W.-K.; Hjelle, O.; Ottersen, O.; Shin, C.; Ko, K.; Kim, W.-K.; Kim, D. Ascorbate attenuates trimethyltin-induced oxidative burden and neuronal degeneration in the rat hippocampus by maintaining glutathione homeostasis. Neuroscience 2005, 133, 715–727. [Google Scholar] [CrossRef] [PubMed] [Green Version]
  55. Kim, Y.S. Magnolol protects against trimethyltin-induced neuronal damage and glial activation in vitro and in vivo. Neurotoxicology 2016, 53, 173–185. [Google Scholar] [CrossRef] [Green Version]
  56. Marnett, L.J. Lipid peroxidation—DNA damage by malondialdehyde. Mutat. Res. Fundam. Mol. Mech. Mutagen. 1999, 424, 83–95. [Google Scholar] [CrossRef]
  57. Cini, M.; Fariello, R.; Bianchetti, A.; Moretti, A. Studies on lipid peroxidation in the rat brain. Neurochem. Res. 1994, 19, 283–288. [Google Scholar] [CrossRef]
  58. Kaur, S.; Chhabra, R.; Nehru, B. Ginkgo biloba extract attenuates hippocampal neuronal loss and cognitive dysfunction resulting from trimethyltin in mice. Phytomedicine 2013, 20, 178–186. [Google Scholar] [CrossRef] [PubMed]
  59. Halliwell, B.; Gutteridge, J. Oxygen toxicity, oxygen radicals, transition metals and disease. Biochem. J. 1984, 219, 1. [Google Scholar] [CrossRef] [PubMed]
  60. Matés, J.M.; Pérez-Gómez, C.; De Castro, I.N. Antioxidant enzymes and human diseases. Clin. Biochem. 1999, 32, 595–603. [Google Scholar] [CrossRef]
  61. Lv, C.; Hong, T.; Yang, Z.; Zhang, Y.; Wang, L.; Dong, M.; Zhao, J.; Mu, J.; Meng, Y. Effect of quercetin in the 1-methyl-4-phenyl-1, 2, 3, 6-tetrahydropyridine-induced mouse model of Parkinson’s disease. EVID-Based Complem. Altern. Med. 2012, 2012. [Google Scholar] [CrossRef] [PubMed]
  62. Chapple, I.L.; Matthews, J.B. The role of reactive oxygen and antioxidant species in periodontal tissue destruction. Periodontology 2000 2007, 43, 160–232. [Google Scholar] [CrossRef] [PubMed]
  63. Gu, F.; Chauhan, V.; Chauhan, A. Glutathione redox imbalance in brain disorders. Curr. Opin. Clin. Nutr. Metab. Care 2015, 18, 89–95. [Google Scholar] [CrossRef]
  64. Sian, J.; Dexter, D.T.; Lees, A.J.; Daniel, S.; Agid, Y.; Javoy-Agid, F.; Jenner, P.; Marsden, C.D. Alterations in glutathione levels in Parkinson’s disease and other neurodegenerative disorders affecting basal ganglia. Ann. Neurol. 1994, 36, 348–355. [Google Scholar] [CrossRef]
  65. Terpstra, M.; McCarten, J.R.; Hodges, J.; Hemmy, L.S.; Grant, A.; Deelchand, D.K.; Marjanska, M. Noninvasively Measured Human Brain Glutathione and Ascorbate Concentrations in Healthy Aging and in Alzheimer’s Disease. Free Radic. Biol. Med. 2016, 100, S89. [Google Scholar] [CrossRef]
  66. Ebrahimi, A.; Hajizadeh Moghaddam, A. The effect of olive leaf methanolic extract on hippocampal antioxidant biomarkers in an animal model of Parkinson’s disease. J. Basic. Clin. Pathophysiol. 2017, 5, 9–14. [Google Scholar]
  67. Hritcu, L.; Noumedem, J.A.; Cioanca, O.; Hancianu, M.; Postu, P.; Mihasan, M. Anxiolytic and antidepressant profile of the methanolic extract of Piper nigrum fruits in beta-amyloid (1–42) rat model of Alzheimer’s disease. Behav. Brain Funct. 2015, 11, 13. [Google Scholar] [CrossRef]
  68. Cuadrado, A.; Rojo, A.I. Heme oxygenase-1 as a therapeutic target in neurodegenerative diseases and brain infections. Curr. Pharm. Des. 2008, 14, 429–442. [Google Scholar] [CrossRef]
  69. Gozzelino, R.; Jeney, V.; Soares, M.P. Mechanisms of cell protection by heme oxygenase-1. Annu. Rev. Pharmacol. Toxicol. 2010, 50, 323–354. [Google Scholar] [CrossRef]
  70. Motterlini, R.; Green, C.J.; Foresti, R. Regulation of heme oxygenase-1 by redox signals involving nitric oxide. Antioxid. Redox Signal. 2002, 4, 615–624. [Google Scholar] [CrossRef]
  71. Shibahara, S.; Han, F.; Li, B.; Takeda, K. Hypoxia and heme oxygenases: Oxygen sensing and regulation of expression. Antioxid. Redox Signal. 2007, 9, 2209–2226. [Google Scholar] [CrossRef]
  72. Chen, K.; Gunter, K.; Maines, M.D. Neurons overexpressing heme oxygenase-1 resist oxidative stress-mediated cell death. J. Neurochem. 2000, 75, 304–313. [Google Scholar] [CrossRef]
  73. Huang, S.-W.; Wang, W.; Zhang, M.-Y.; Liu, Q.-B.; Luo, S.-Y.; Peng, Y.; Sun, B.; Wu, D.-L.; Song, S.-J. The effect of ethyl acetate extract from persimmon leaves on Alzheimer’s disease and its underlying mechanism. Phytomedicine 2016, 23, 694–704. [Google Scholar] [CrossRef]
  74. Zhang, Q.; Zhang, J.; Shen, J.; Silva, A.; Dennis, D.A.; Barrow, C.J. A simple 96-well microplate method for estimation of total polyphenol content in seaweeds. J. Appl. Phycol. 2006, 18, 445–450. [Google Scholar] [CrossRef]
  75. Blois, M.S. Antioxidant determinations by the use of a stable free radical. Nature 1958, 181, 1199. [Google Scholar] [CrossRef]
  76. Stiernagle, T. Maintenance of C. elegans. C. Elegans 1999, 2, 51–67. [Google Scholar] [CrossRef]
  77. Peixoto, H.; Roxo, M.; Koolen, H.; da Silva, F.; Silva, E.; Braun, M.; Wang, X.; Wink, M. Calycophyllum spruceanum (Benth.), the amazonian “tree of youth” prolongs longevity and enhances stress resistance in Caenorhabditis elegans. Molecules 2018, 23, 534. [Google Scholar] [CrossRef]
  78. Peixoto, H.; Roxo, M.; Krstin, S.; Röhrig, T.; Richling, E.; Wink, M. An anthocyanin-rich extract of acai (Euterpe precatoria Mart.) increases stress resistance and retards aging-related markers in Caenorhabditis elegans. J. Agric. Food Chem. 2016, 64, 1283–1290. [Google Scholar] [CrossRef]
  79. Ohkawa, H.; Ohishi, N.; Yagi, K. Assay for lipid peroxides in animal tissues by thiobarbituric acid reaction. Anal. Biochem. 1979, 95, 351–358. [Google Scholar] [CrossRef]
  80. Nishikimi, M.; Rao, N.A.; Yagi, K. The occurrence of superoxide anion in the reaction of reduced phenazine methosulfate and molecular oxygen. Biochem. Biophys. Res. Commun. 1972, 46, 849–854. [Google Scholar] [CrossRef]
  81. Beutler, E.; Kelly, B.M. The effect of sodium nitrite on red cell GSH. Experientia 1963, 19, 96–97. [Google Scholar] [CrossRef]
  82. Abraham, N.; Lutton, J.; Levere, R. Heme metabolism and erythropoiesis in abnormal iron states: Role of delta-aminolevulinic acid synthase and heme oxygenase. Exp. Hematol. 1985, 13, 838–843. [Google Scholar]
Sample Availability: Samples of the plant material are available from the authors.
Figure 1. HPLC-PDA-ESI-MS/MS chromatogram for metabolites detected in a hydroalcoholic fruit extract of SJ (negative mode).
Molecules 24 02633 g001
Figure 2. Effect of SJ extract on the survival rate of N2 worms pretreated with different doses of the extract and then subjected to oxidative stress via a toxic dose of juglone. SJ 300 µg/mL + juglone group showed a highly significant increase in rate of survival compared with solvent control + juglone group. Data is represented as mean ± SEM of survival rate % (n = 5) obtained by one-way analysis of variance test (ANOVA) followed by Bonferroni’s method of correction. ** p < 0.01 and *** p < 0.001 in comparison with solvent control + juglone group. ### p < 0.001 in comparison with juglone group.
Molecules 24 02633 g002
Figure 3. Intracellular reactive oxygen species (ROS) levels in C. elegans. (AF) Pictures demonstrate intracellular ROS levels in worms: (A) untreated control, (B) solvent control, (C) (−)-epigallocatechingallate (EGCG) 50 µg/mL, (D) SJ 100 µg/mL, (E) SJ 200 µg/mL, (F) SJ 300 µg/mL, and (G) quantification of ROS levels using fluorescence intensity for different treated groups. SJ treatment resulted into lower ROS levels. Data represents the mean of three assays. Analysis was made through one-way ANOVA followed by Bonferroni’s method. *** p < 0.001 in comparison with solvent control and ### p < 0.001 in comparison with untreated control.
Molecules 24 02633 g003
Figure 4. Hsp-16.2 gene expression in C. elegans. (AF) GFP images of TJ375 worms from different treatment groups: (A) juglone group, (B) solvent control + juglone, (C) EGCG 50 µg/mL + juglone, (D) SJ 100 µg/mL + juglone, (E) SJ 200 µg/mL + juglone, (F) SJ 300 µg/mL + juglone, and (G) quantification of Hsp-16.2 levels using fluorescence intensity measurement for different groups. The lowest concentration of SJ extract used—SJ 100 µg/mL—resulted in significantly decreased expression of Hsp-16.2 gene. Data represent the mean of four assays. Analysis was performed through one-way ANOVA followed by Bonferroni’s method. ** p < 0.01 in comparison with solvent control + juglone and ### p < 0.001 in comparison with juglone group.
Molecules 24 02633 g004
Figure 5. Expression of Sod-3 gene in C. elegans. (AF) Photos of GFP fluorescence in the posterior part of the intestine of CF1553 worms from different treatment groups: (A) untreated control group, (B) solvent control, (C) EGCG 100 µg/mL, (D) SJ 100 µg/mL, (E) SJ 200 µg/mL, (F) SJ 300 µg/mL, and (G) quantification of sod-3 levels through fluorescence intensity measurement for different groups. The highest concentration of SJ extract used—SJ 300 µg/mL—resulted in significant expression of sod-3 gene. Data is represented as mean of three assays analyzed through one-way ANOVA followed by Bonferroni’s method. * p < 0.05, *** p < 0.001 in comparison with solvent control and ### p < 0.001 in comparison with untreated control group.
Molecules 24 02633 g005
Figure 6. The effect of two different doses of SJ extract on MDA brain levels in mice intoxicated with TMT. The higher concentration of SJ extract used—SJ 200 mg/kg—resulted into higher decline in MDA levels. Statistical analysis was done via one-way ANOVA then Bonferroni’s method. *** p < 0.001 in comparison with TMT group and ### p < 0.001 in comparison with saline control group.
Molecules 24 02633 g006
Figure 7. SOD enzyme levels in the brains of mice receiving two different doses of SJ extract then intoxicated via TMT. SJ 200 mg/kg treated group showed significantly higher SOD levels compared to TMT treated group. Statistical analysis was done via one-way ANOVA then Bonferroni’s method. *** p < 0.001 in comparison with TMT group and ### p < 0.001 in comparison with saline control group.
Molecules 24 02633 g007
Figure 8. GSH brain levels in mice pretreated with SJ extract, at two different doses, then injected TMT. SJ 200 mg/kg group showed highly significant increase in GSH levels in comparison with TMT treated group. Statistical analysis was performed via one-way ANOVA then Bonferroni’s method. *** p < 0.001 in comparison with TMT group and ### p < 0.001 in comparison with saline control group.
Molecules 24 02633 g008
Figure 9. HO-1 levels in the brains of mice administering two different doses of SJ extract before being injected with TMT. SJ 200 mg/kg group demonstrated highly significant elevation in HO-1 levels compared to TMT treated group. Statistical analysis was done via one-way ANOVA then Bonferroni’s method. *** p < 0.001 relative to TMT treated group and ### p < 0.001 relative to saline control group.
Molecules 24 02633 g009
Table 1. Characterization of secondary metabolites in the hydroalcoholic extract of SJ fruits by HPLC-PDA-ESI-MS/MS.
Peak no.Tentative IdentificationRt (min)UV-Vis
(λ max)
Peak Area
(%)
[M − H]Fragment Ions (Ms/Ms)Ref.
1Apigenin acetyl dihexoside * 9.45 272, 334 0.3639 638, 592, 431 Tentative
2Kaempferol-3-O-rutinoside-7-O-β-D hexopyranoside * 10.48 290, 348 0.5755 754, 609, 593, 285 [25]
3Digalloyl-HHDP-Hexose * 11.11 240, 272 1.8784 633, 631, 301 [27]
4Kaempferol 3-O-[6″-O-(hexosyl) hexoside] 7-O-deoxyhexoside 11.60 290, 348 2.8755 609, 431, 284 [28]
5Kaempferol dihexoside12.30 278, 349 0.7609429, 284 Tentative
6Quercetin 7-O-hexoside-3-O-Rutinoside * 12.53 255, 354 0.25771 463, 300 [24]
7Trihydroxy-dimethoxy-flavone hexosyl-hexoside12.65 271, 342 0.3654 473 [29]
8Kaempferol-feruloyl-di-hexose-pentose * 12.98 266, 333 0.18931 785 [26]
9Kaempferol 3-O-[6″-O-(hexosyl) hexoside] 7-O-deoxyhexoside 13.38 290, 348 0.15755 284 [28]
10Apigenin hexoside *13.4 270, 338 0.19431 269 [23]
11Kaempferol rutinoside13.51254, 3672.3593285[24]
12Kaempferol-3-O-hexose-O-caffeoyl-Odeoxyhexoside * 13.62254, 3300.2755284[30]
13Apigenin 7-O-rutinoside * 14.19268, 3340.1577269[24]
14Apigenin 7-O-(2’’-dihydrogalloyl)-deoxyhexosyl-6-C-(2″′-pentosyl)-hexoside * 14.39232, 3363.5862700[22]
15Kaempferol derivative 14.5278, 3300.08654284Tentative
16Kaempferol di-O-deoxyhexoside14.55246, 3440.07577431[31]
17Kaempferol-O-deoxyhexoside14.94245, 3440.05431284[31]
18Galloyl-bis-HHDP hexose * 14.982561.8935633[32]
19Coumaroyl quinic acid * 16.35264,3251.72337191[33]
20Naringenin-O-hexose-O-deoxyhexose17.022811.85578433, 271[34]
21Naringenin-O-hexose17.282810.82432271[34]
22Apigenin 7-O-(2″-dihydrogalloyl)-rhamonsyl-6-C-(2″′-pentosyl)-hexoside * 18.2232, 3360.9863269[22]
23Proanthocyanidin tetramer *40.592780.11121849, 831[32]
24Apigenin 6-C-hexosyl 8-C- (6″-O-methoxygalloyl)- hexoside * 43.07272, 3400.4758269[22]
* Secondary metabolites recognized for the first time from Styphnolobium japonicum.

