Antimicrobial Photodynamic Therapy Mediated by Curcumin-Loaded Polymeric Nanoparticles in a Murine Model of Oral Candidiasis

 ,
,  ,
, 
Abstract
1. Introduction
2. Results
2.1. Synthesis and Characterization of CUR-NPs
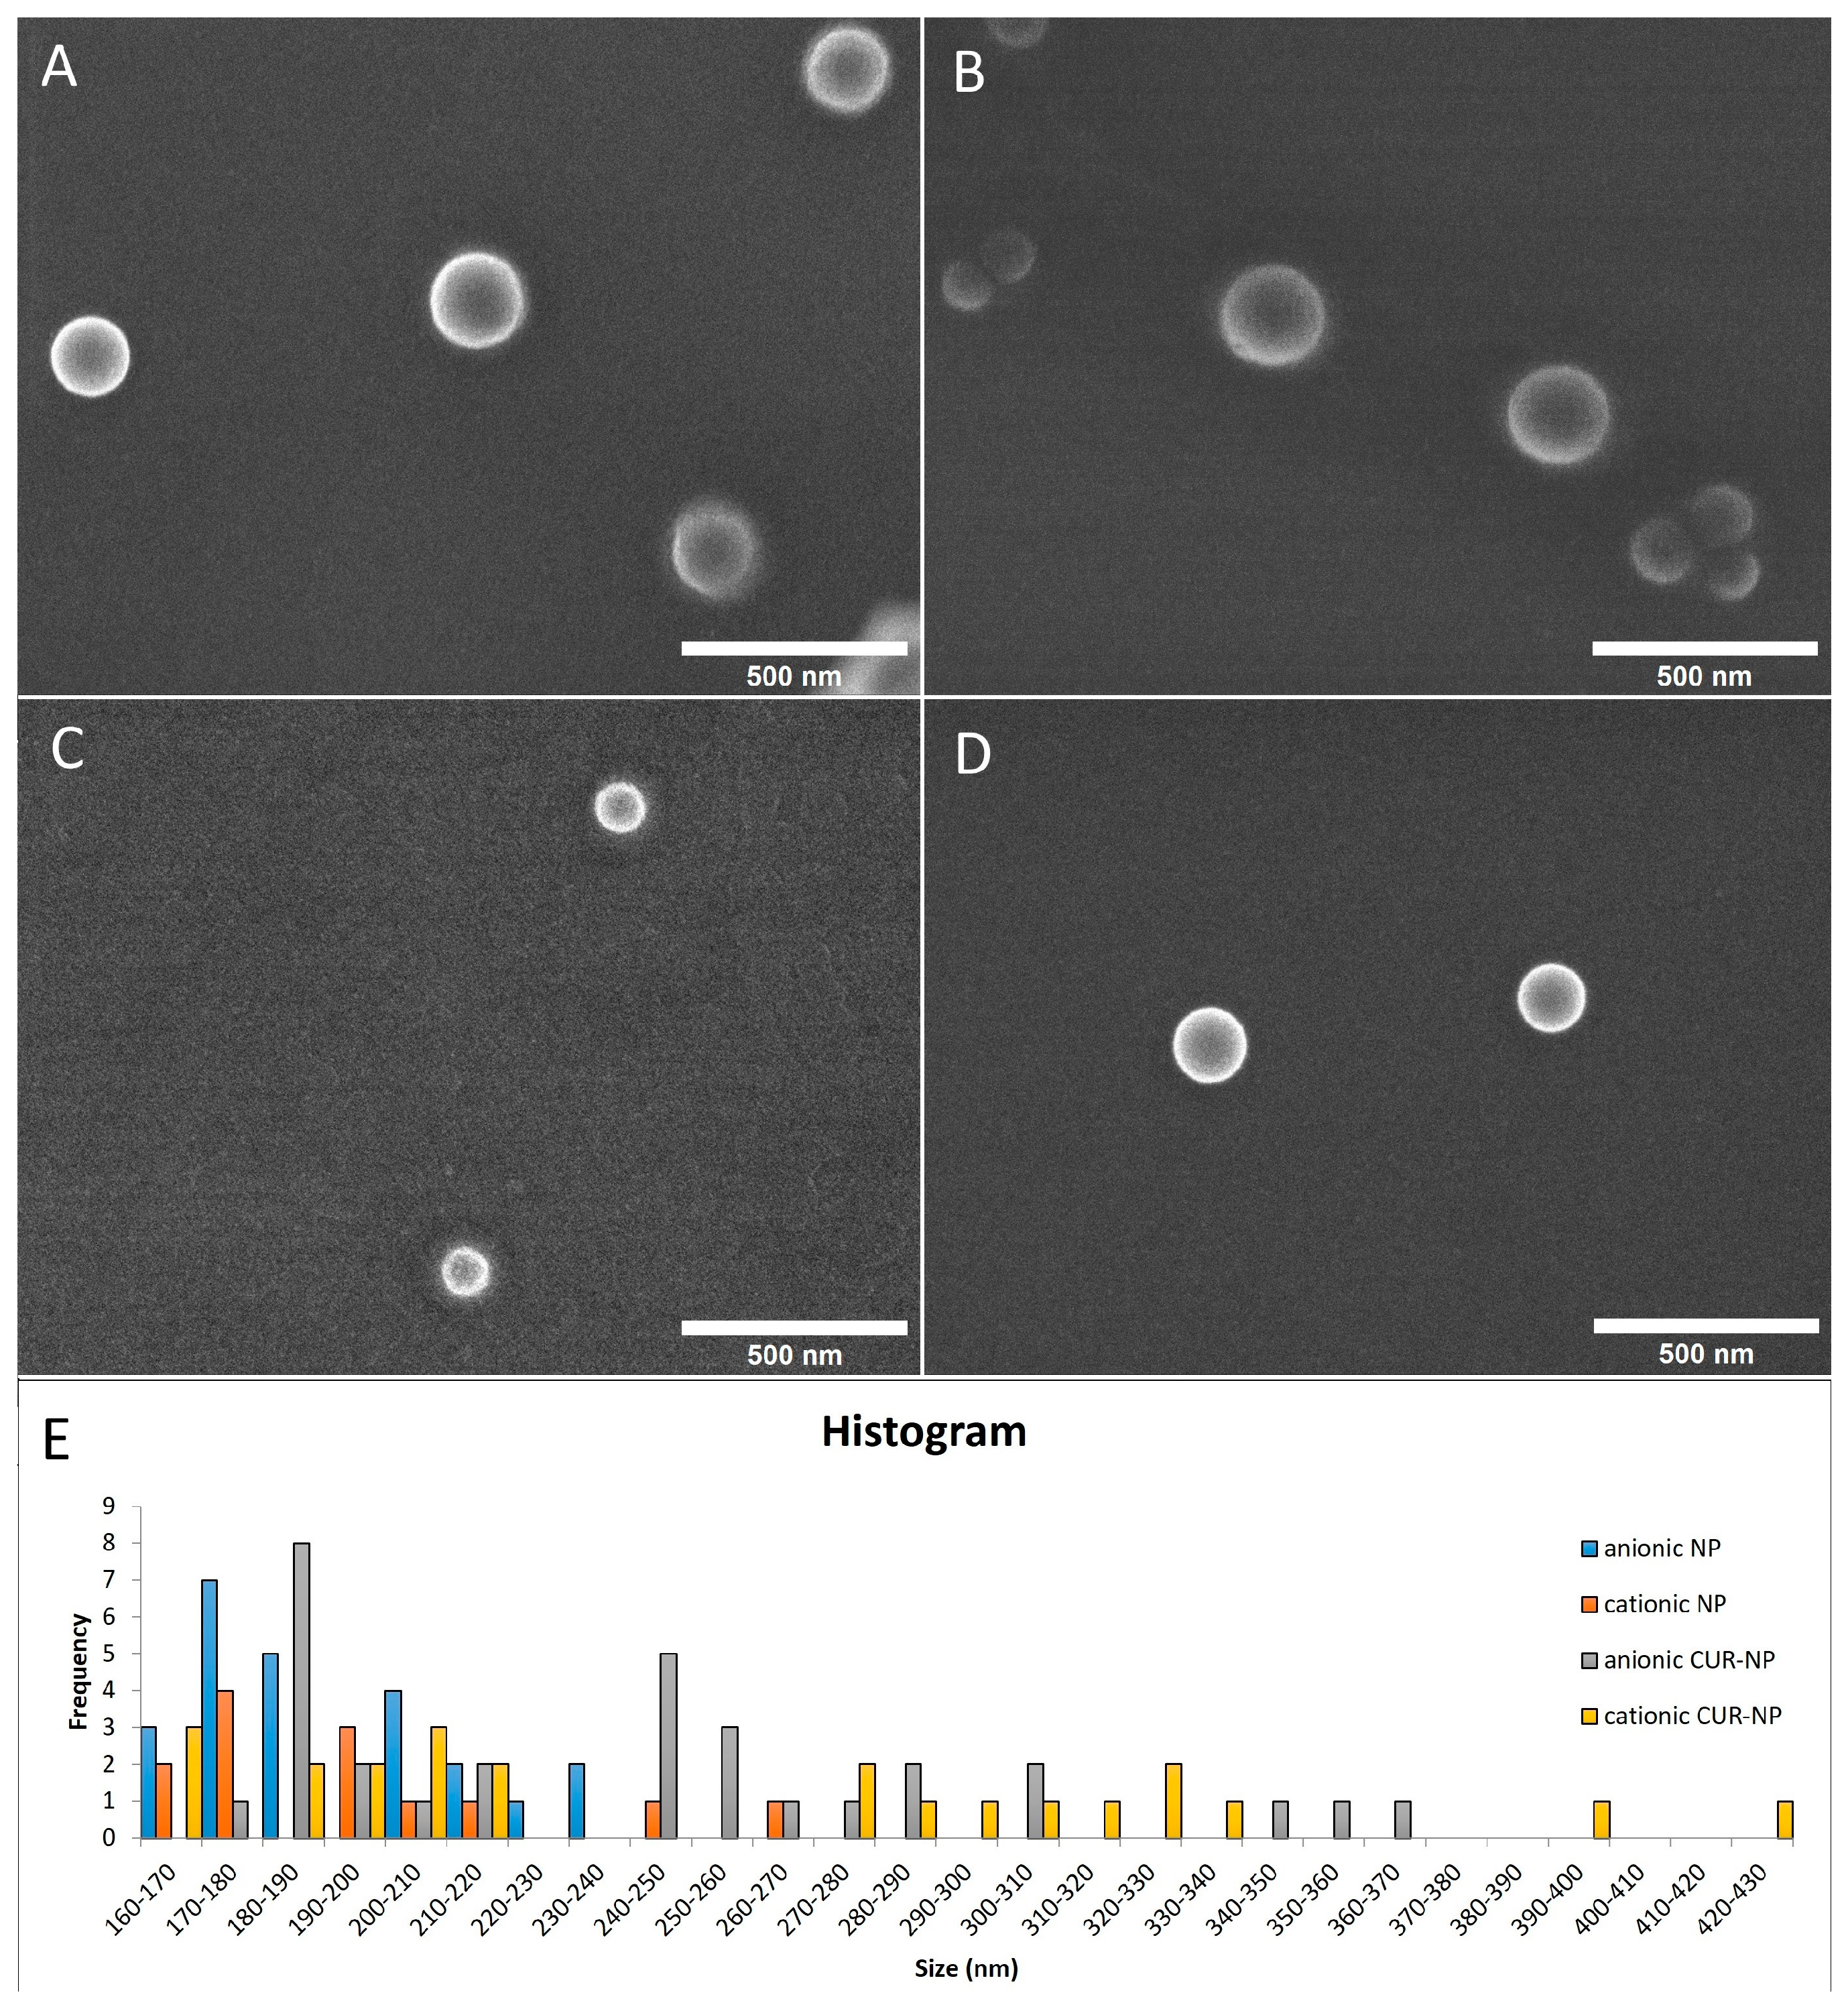
2.1.1. Physicochemical Properties and Morphology Analysis
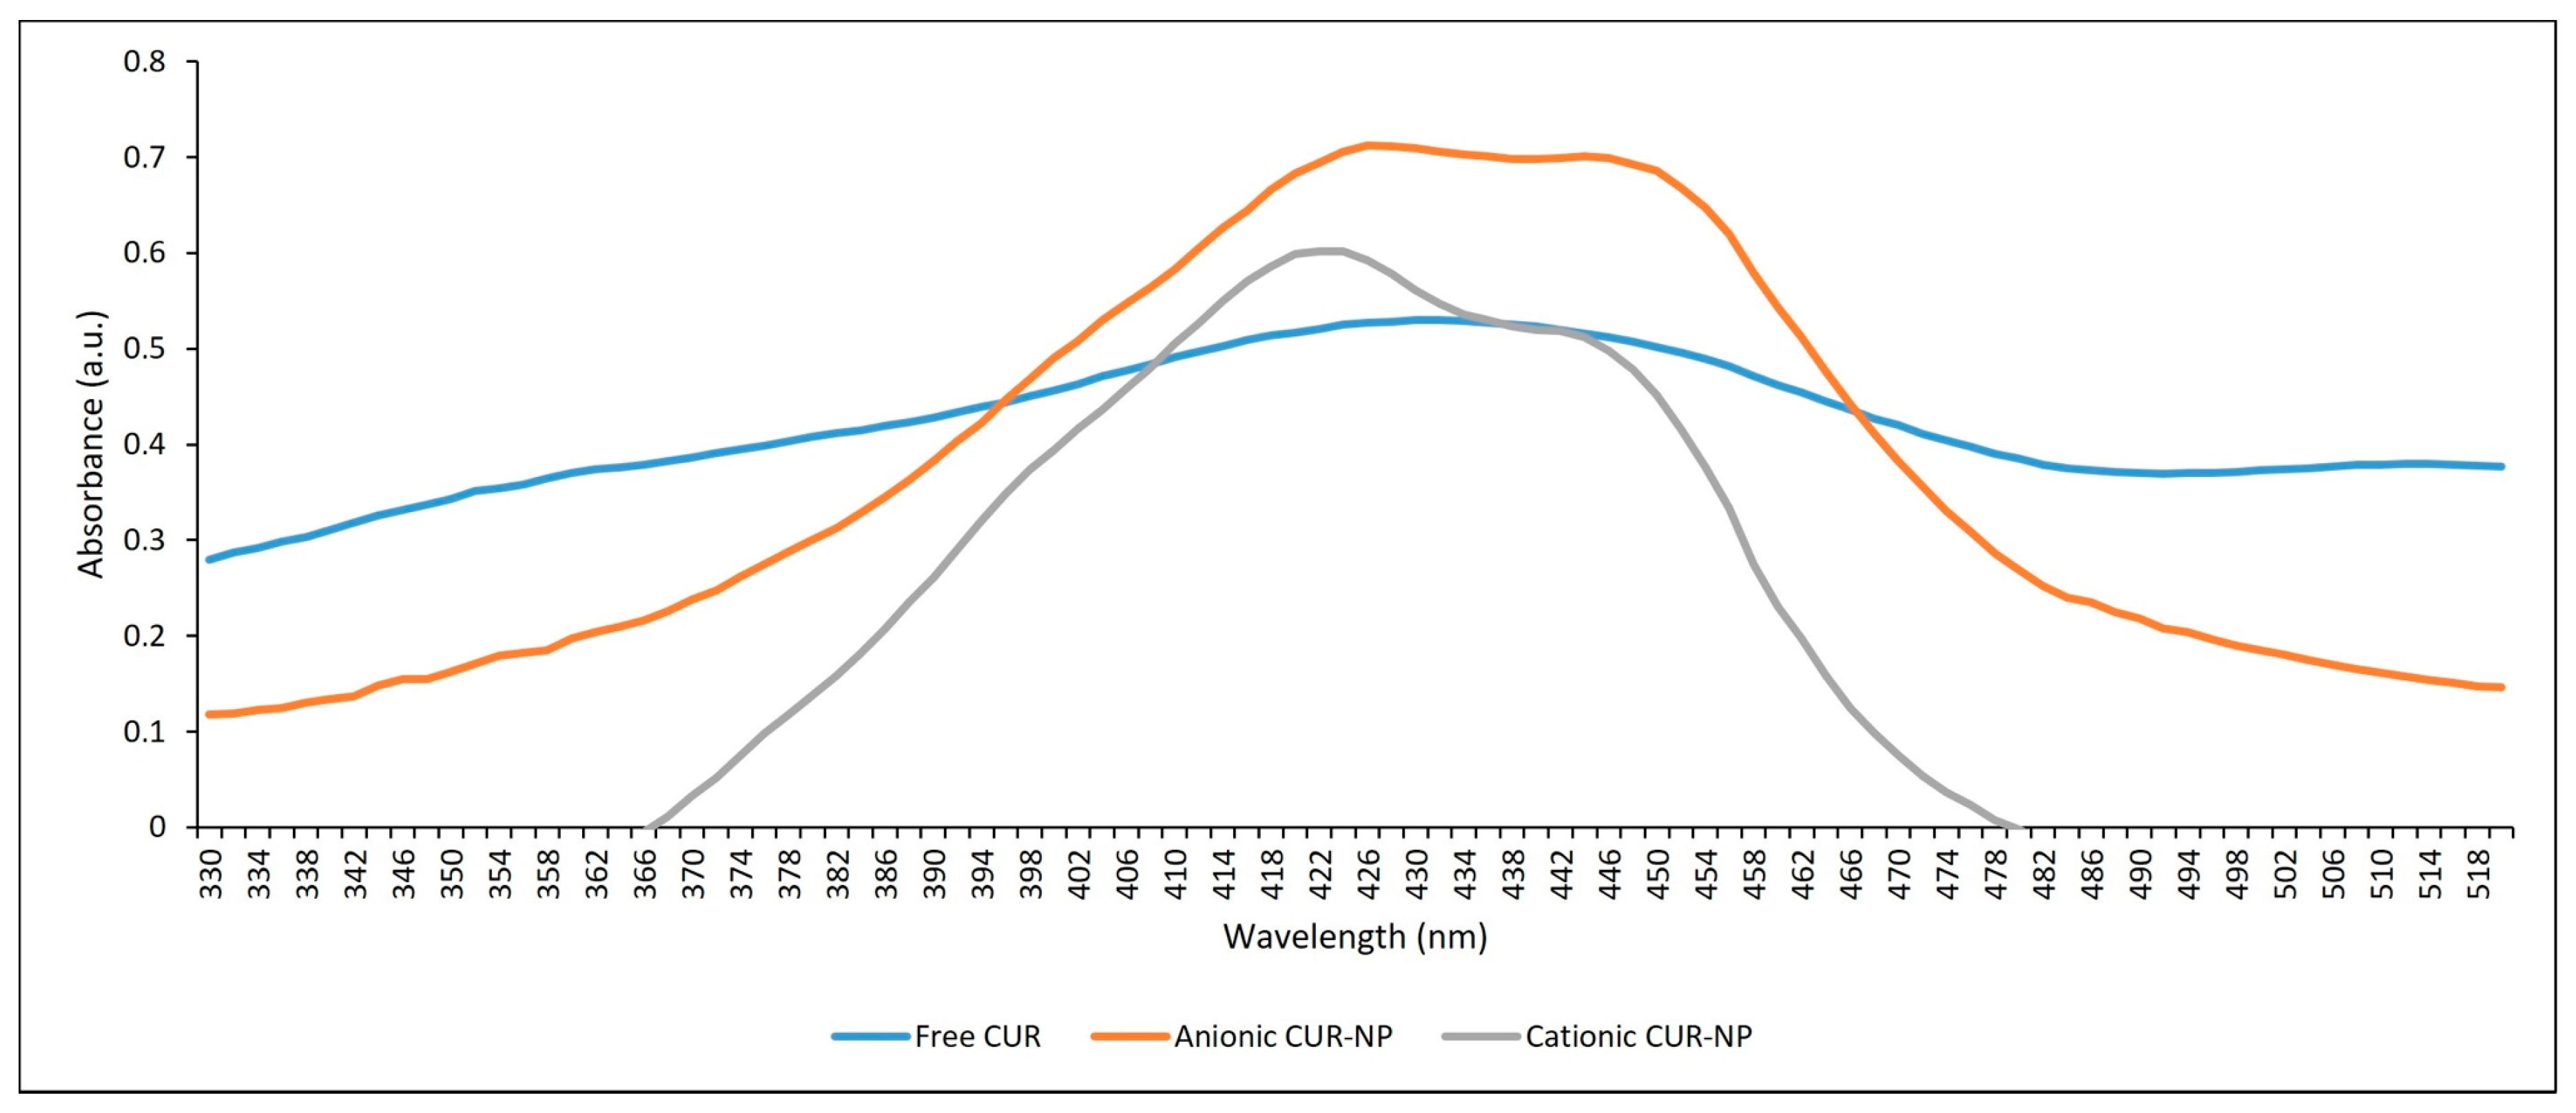
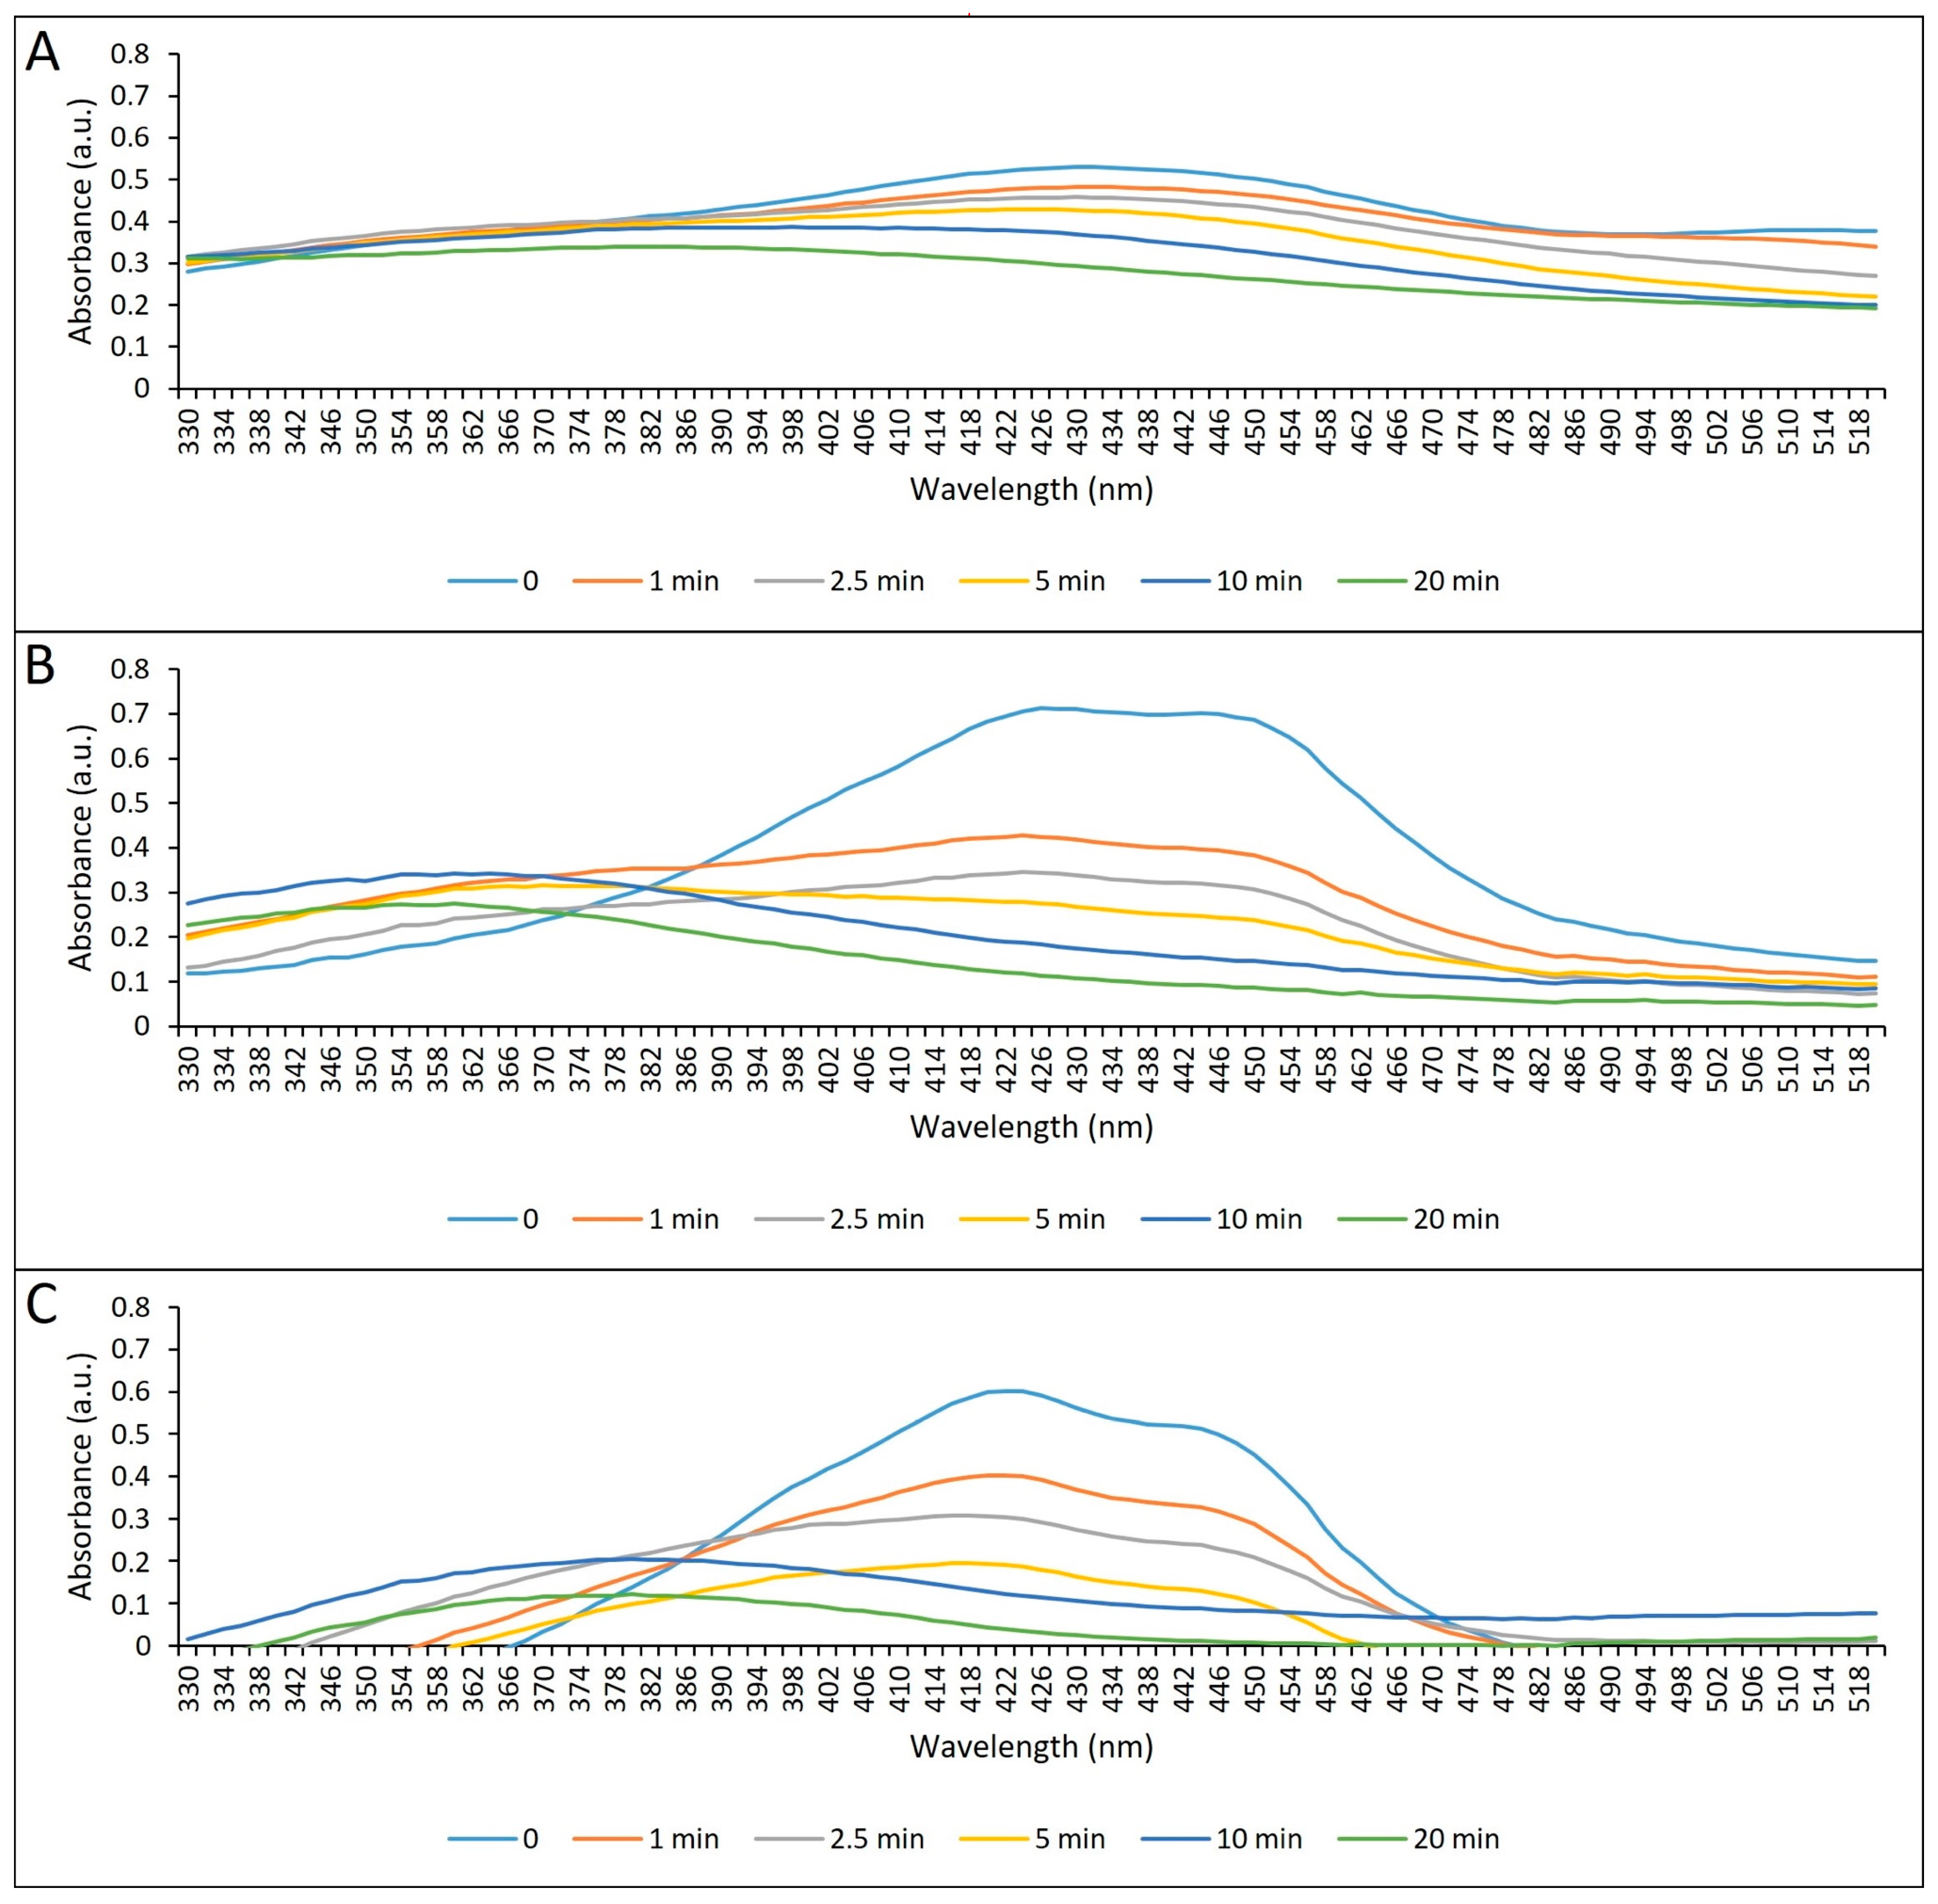
2.1.2. Absorption Spectrum and Photostability
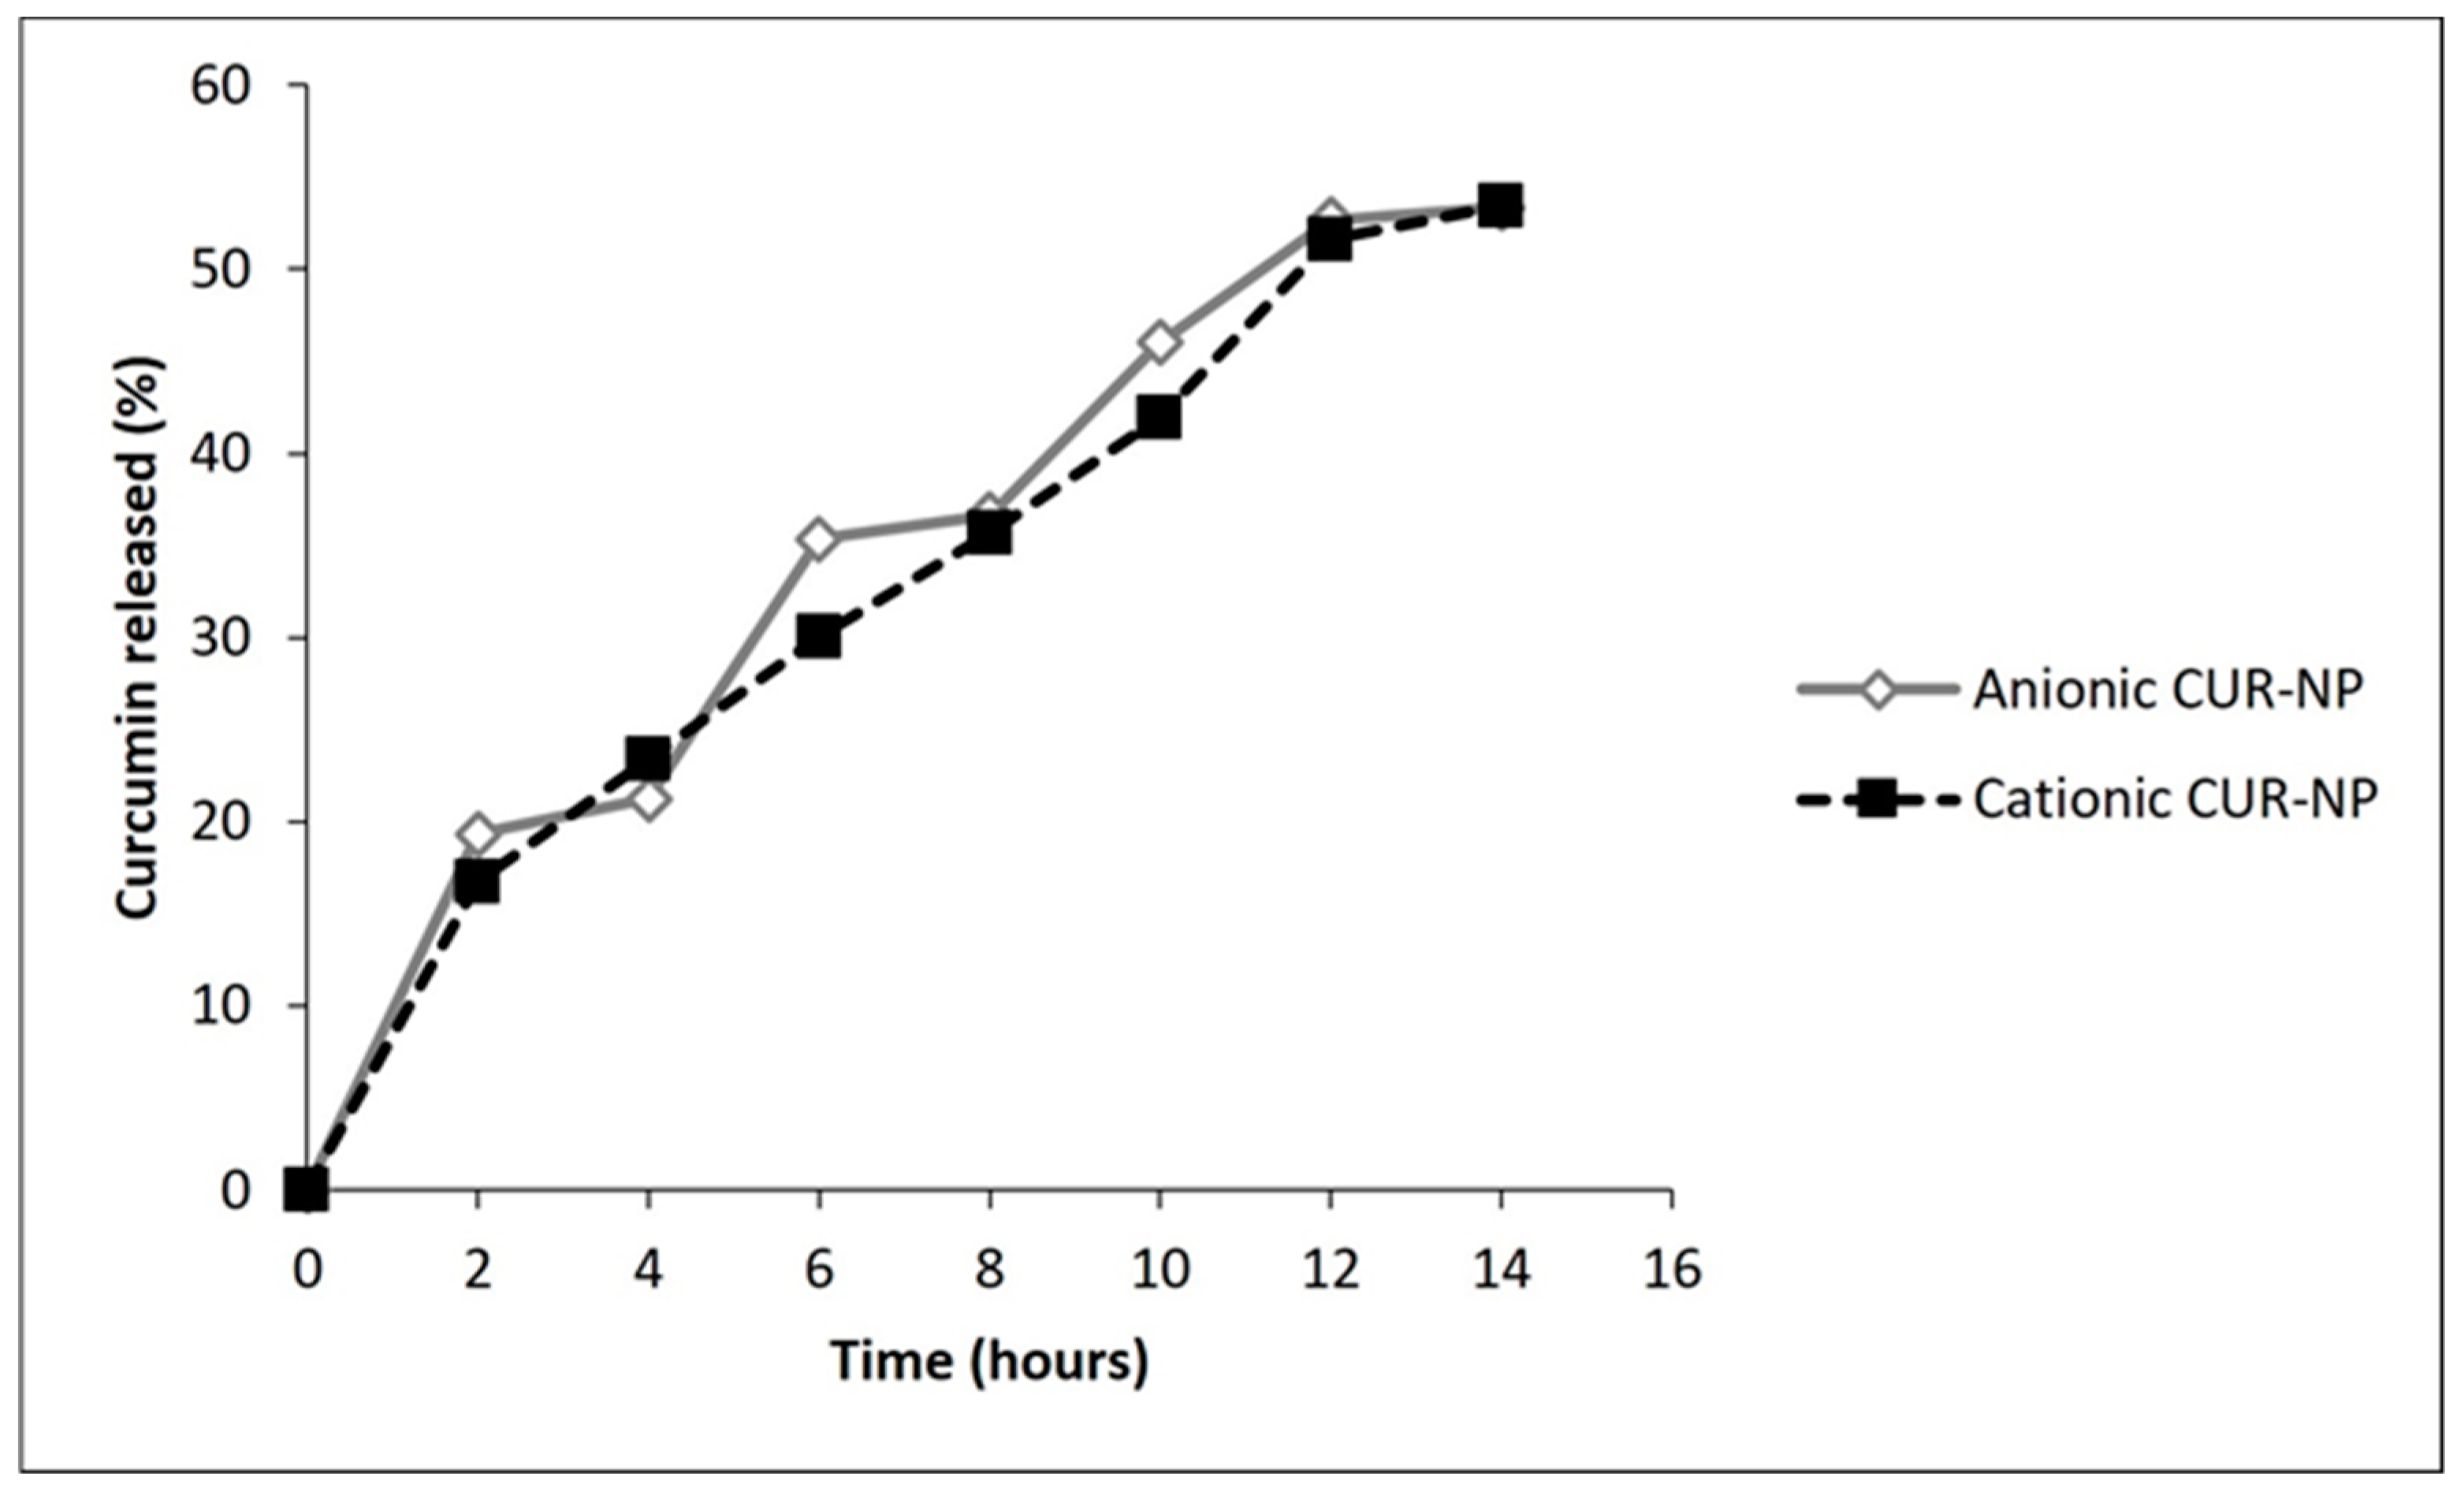
2.1.3. Encapsulation Efficiency (EE) and Release of CUR from NPs
2.2. In Vivo Study
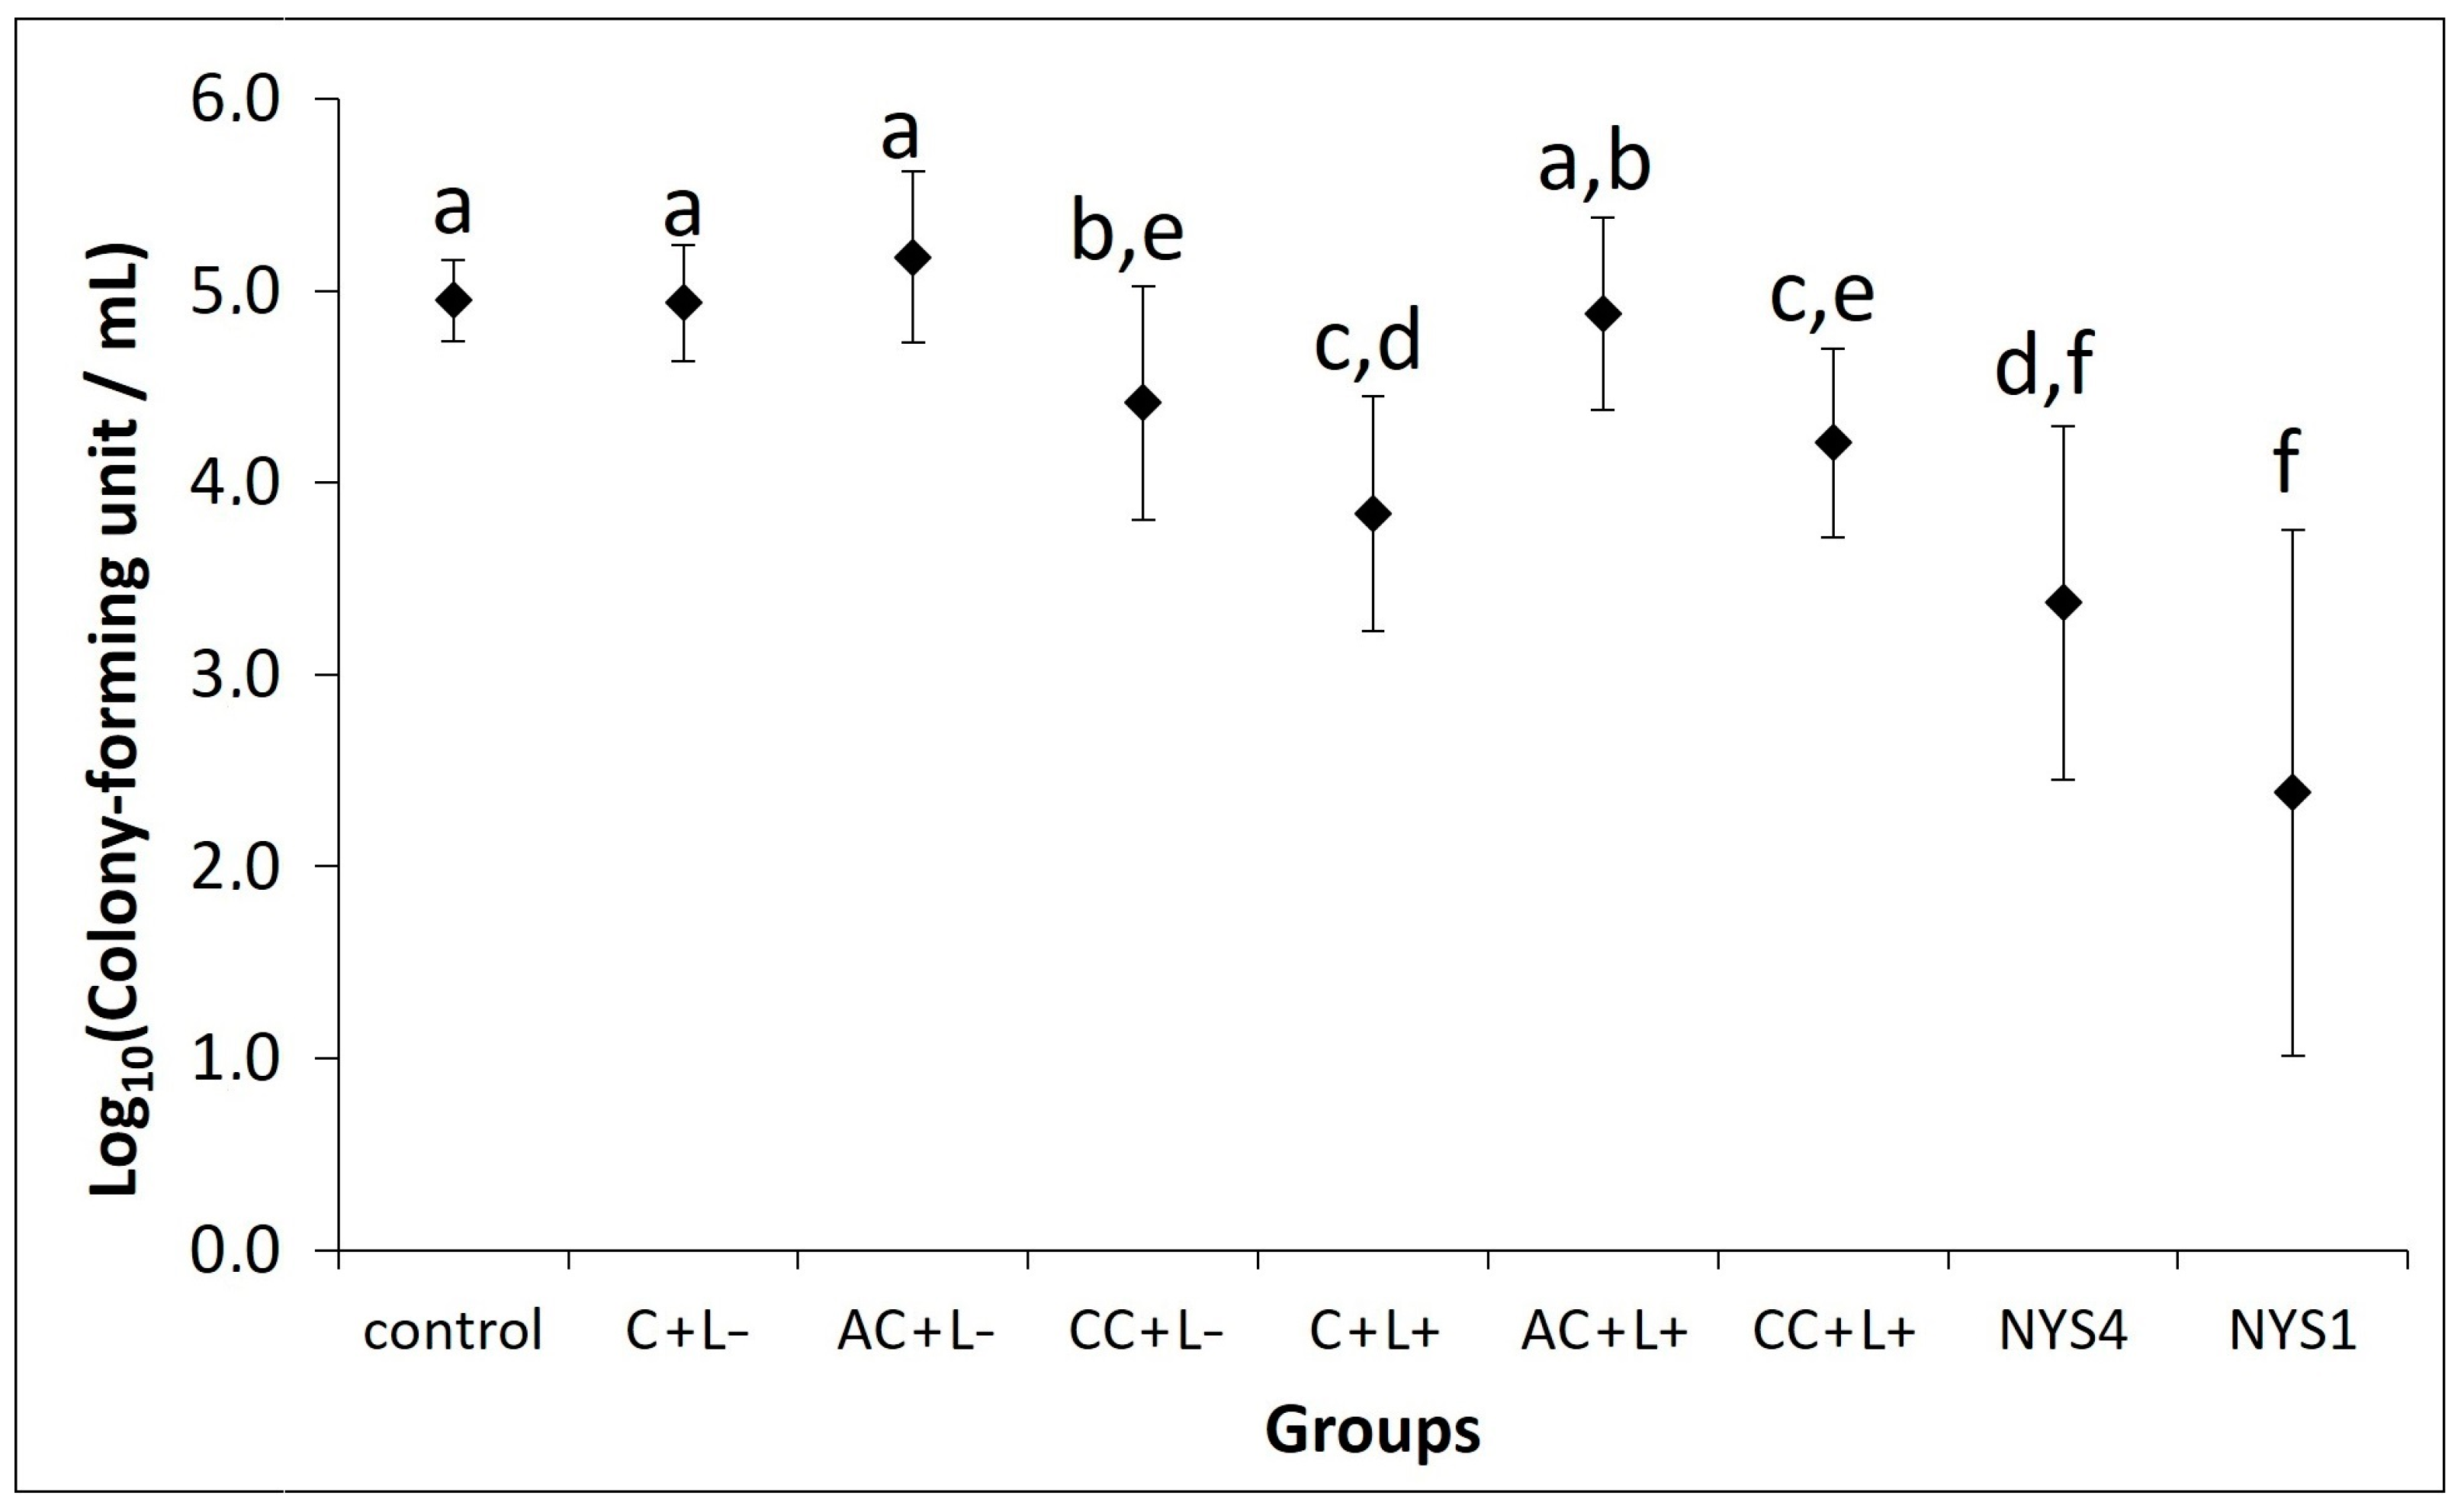
2.2.1. Antifungal Treatments of Oral Candidiasis in Mice
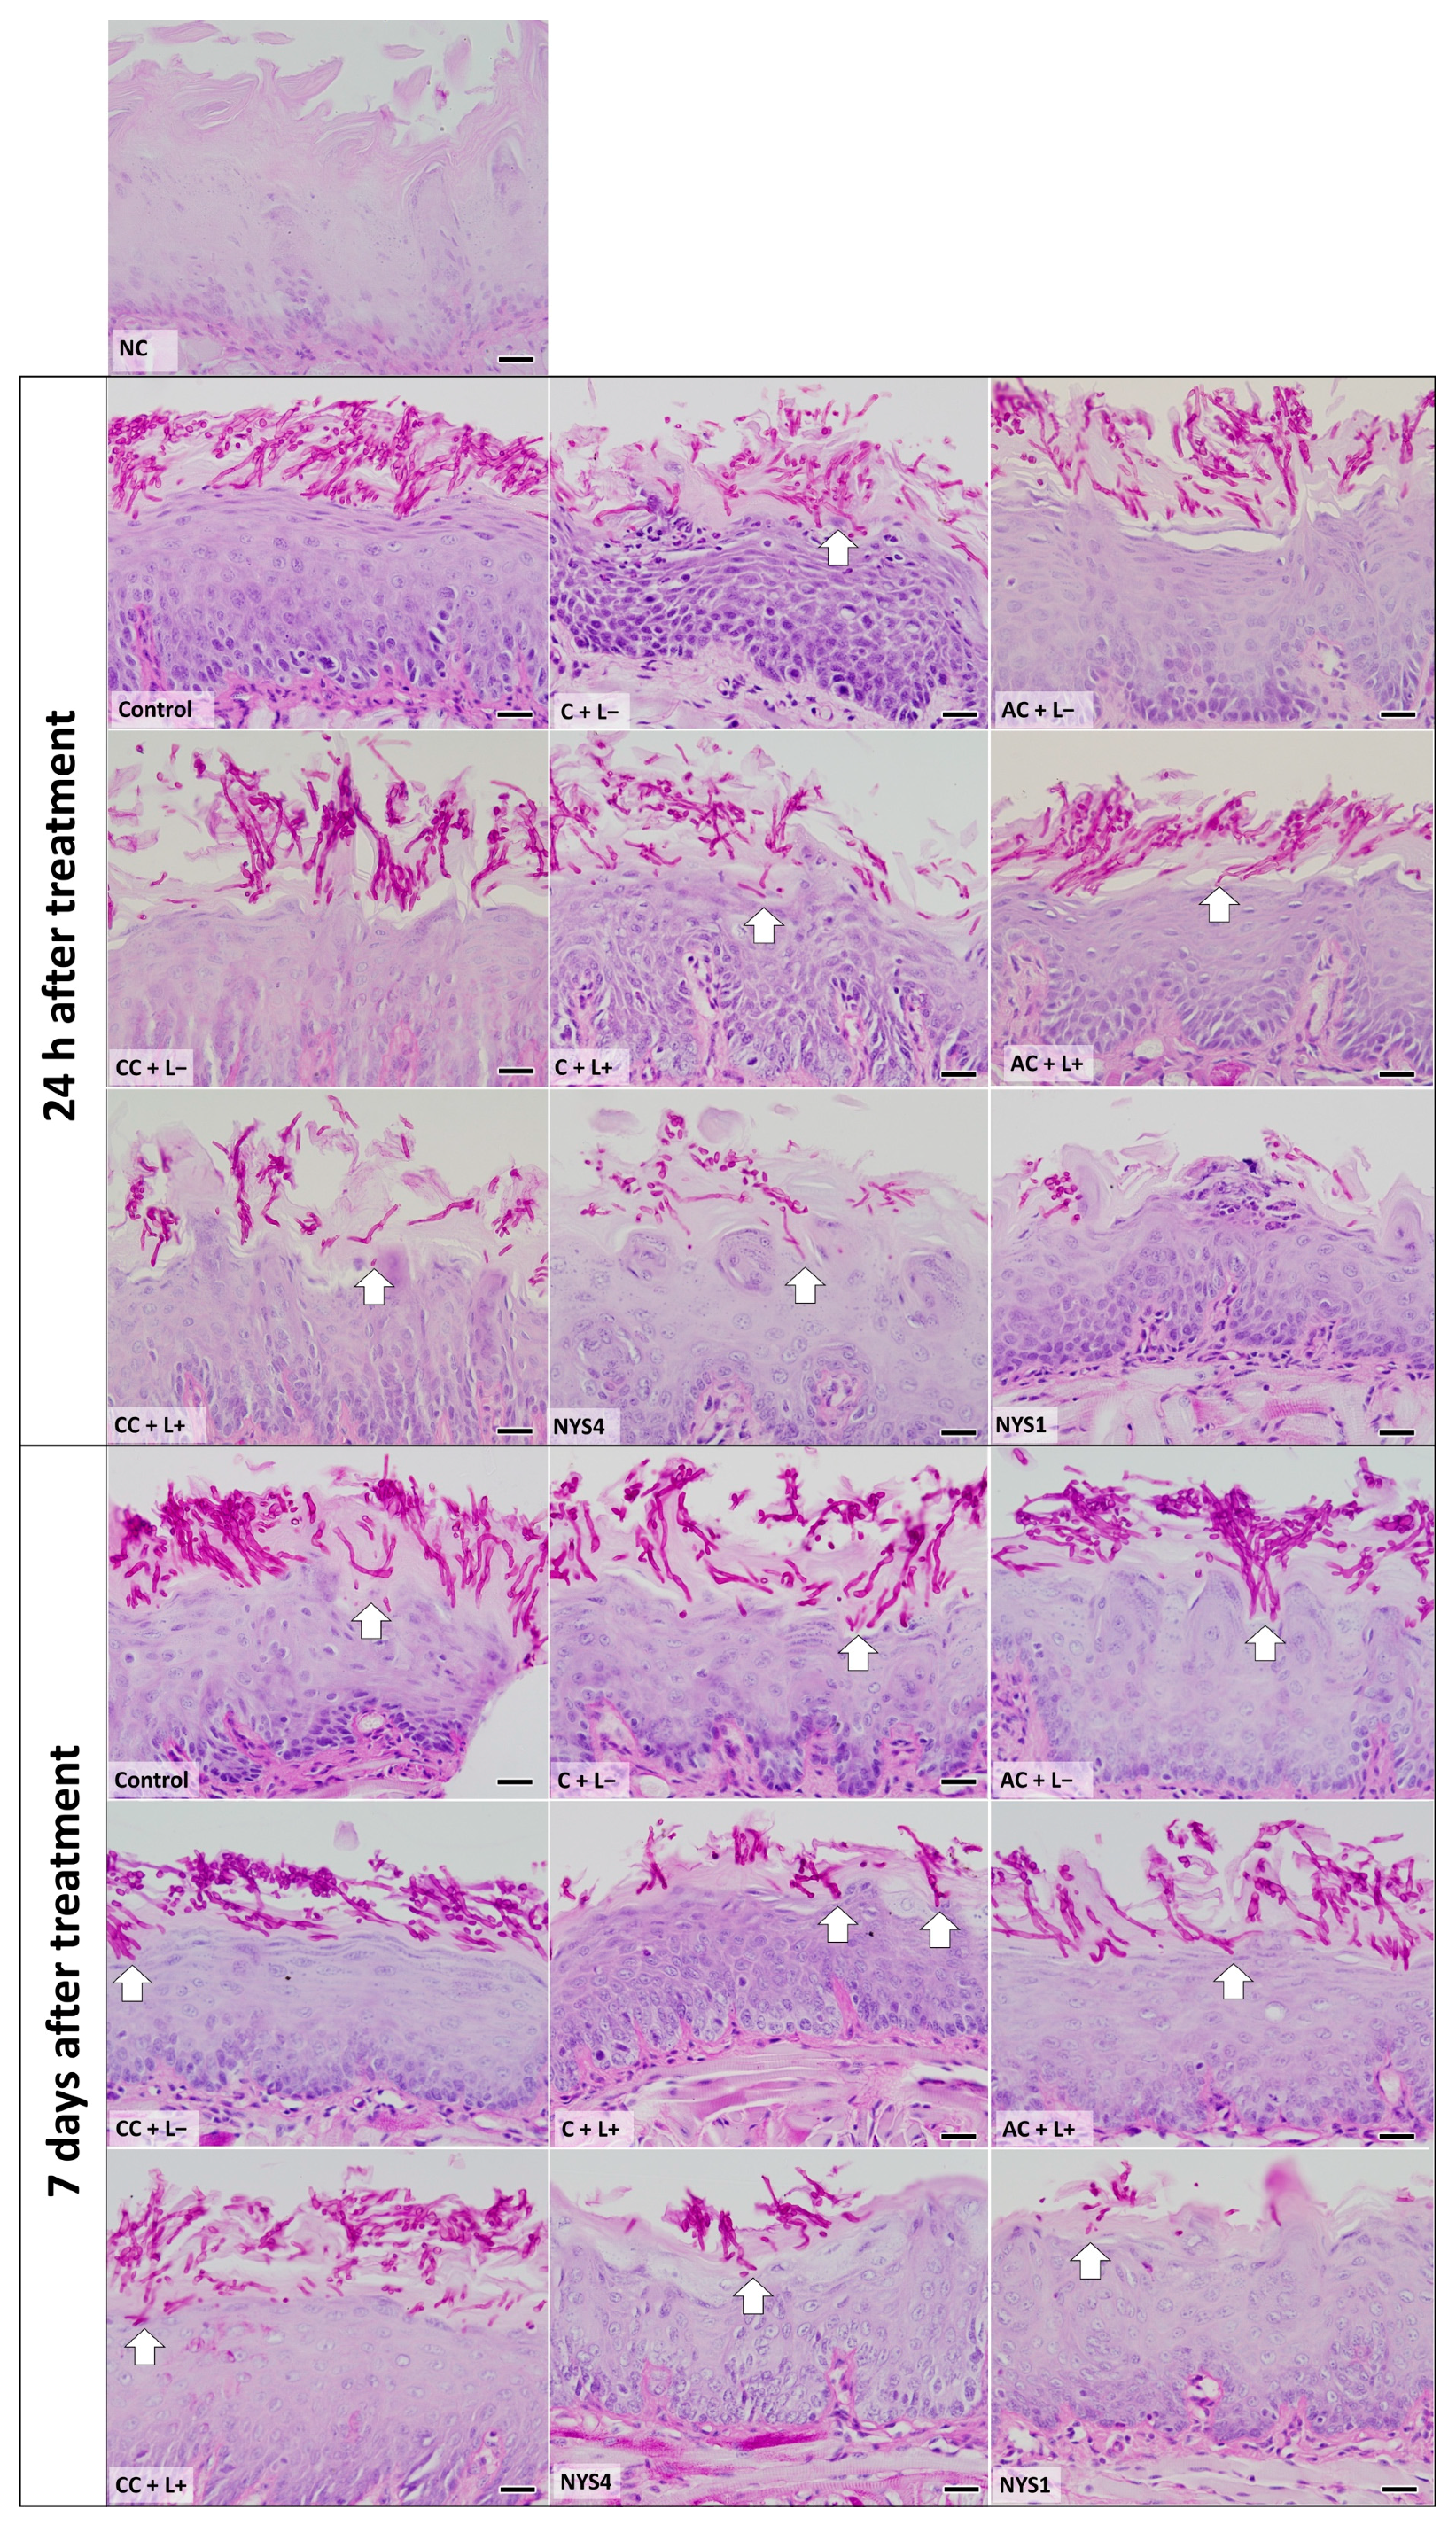
2.2.2. Histological Analysis—Periodic Acid-Schiff (PAS)
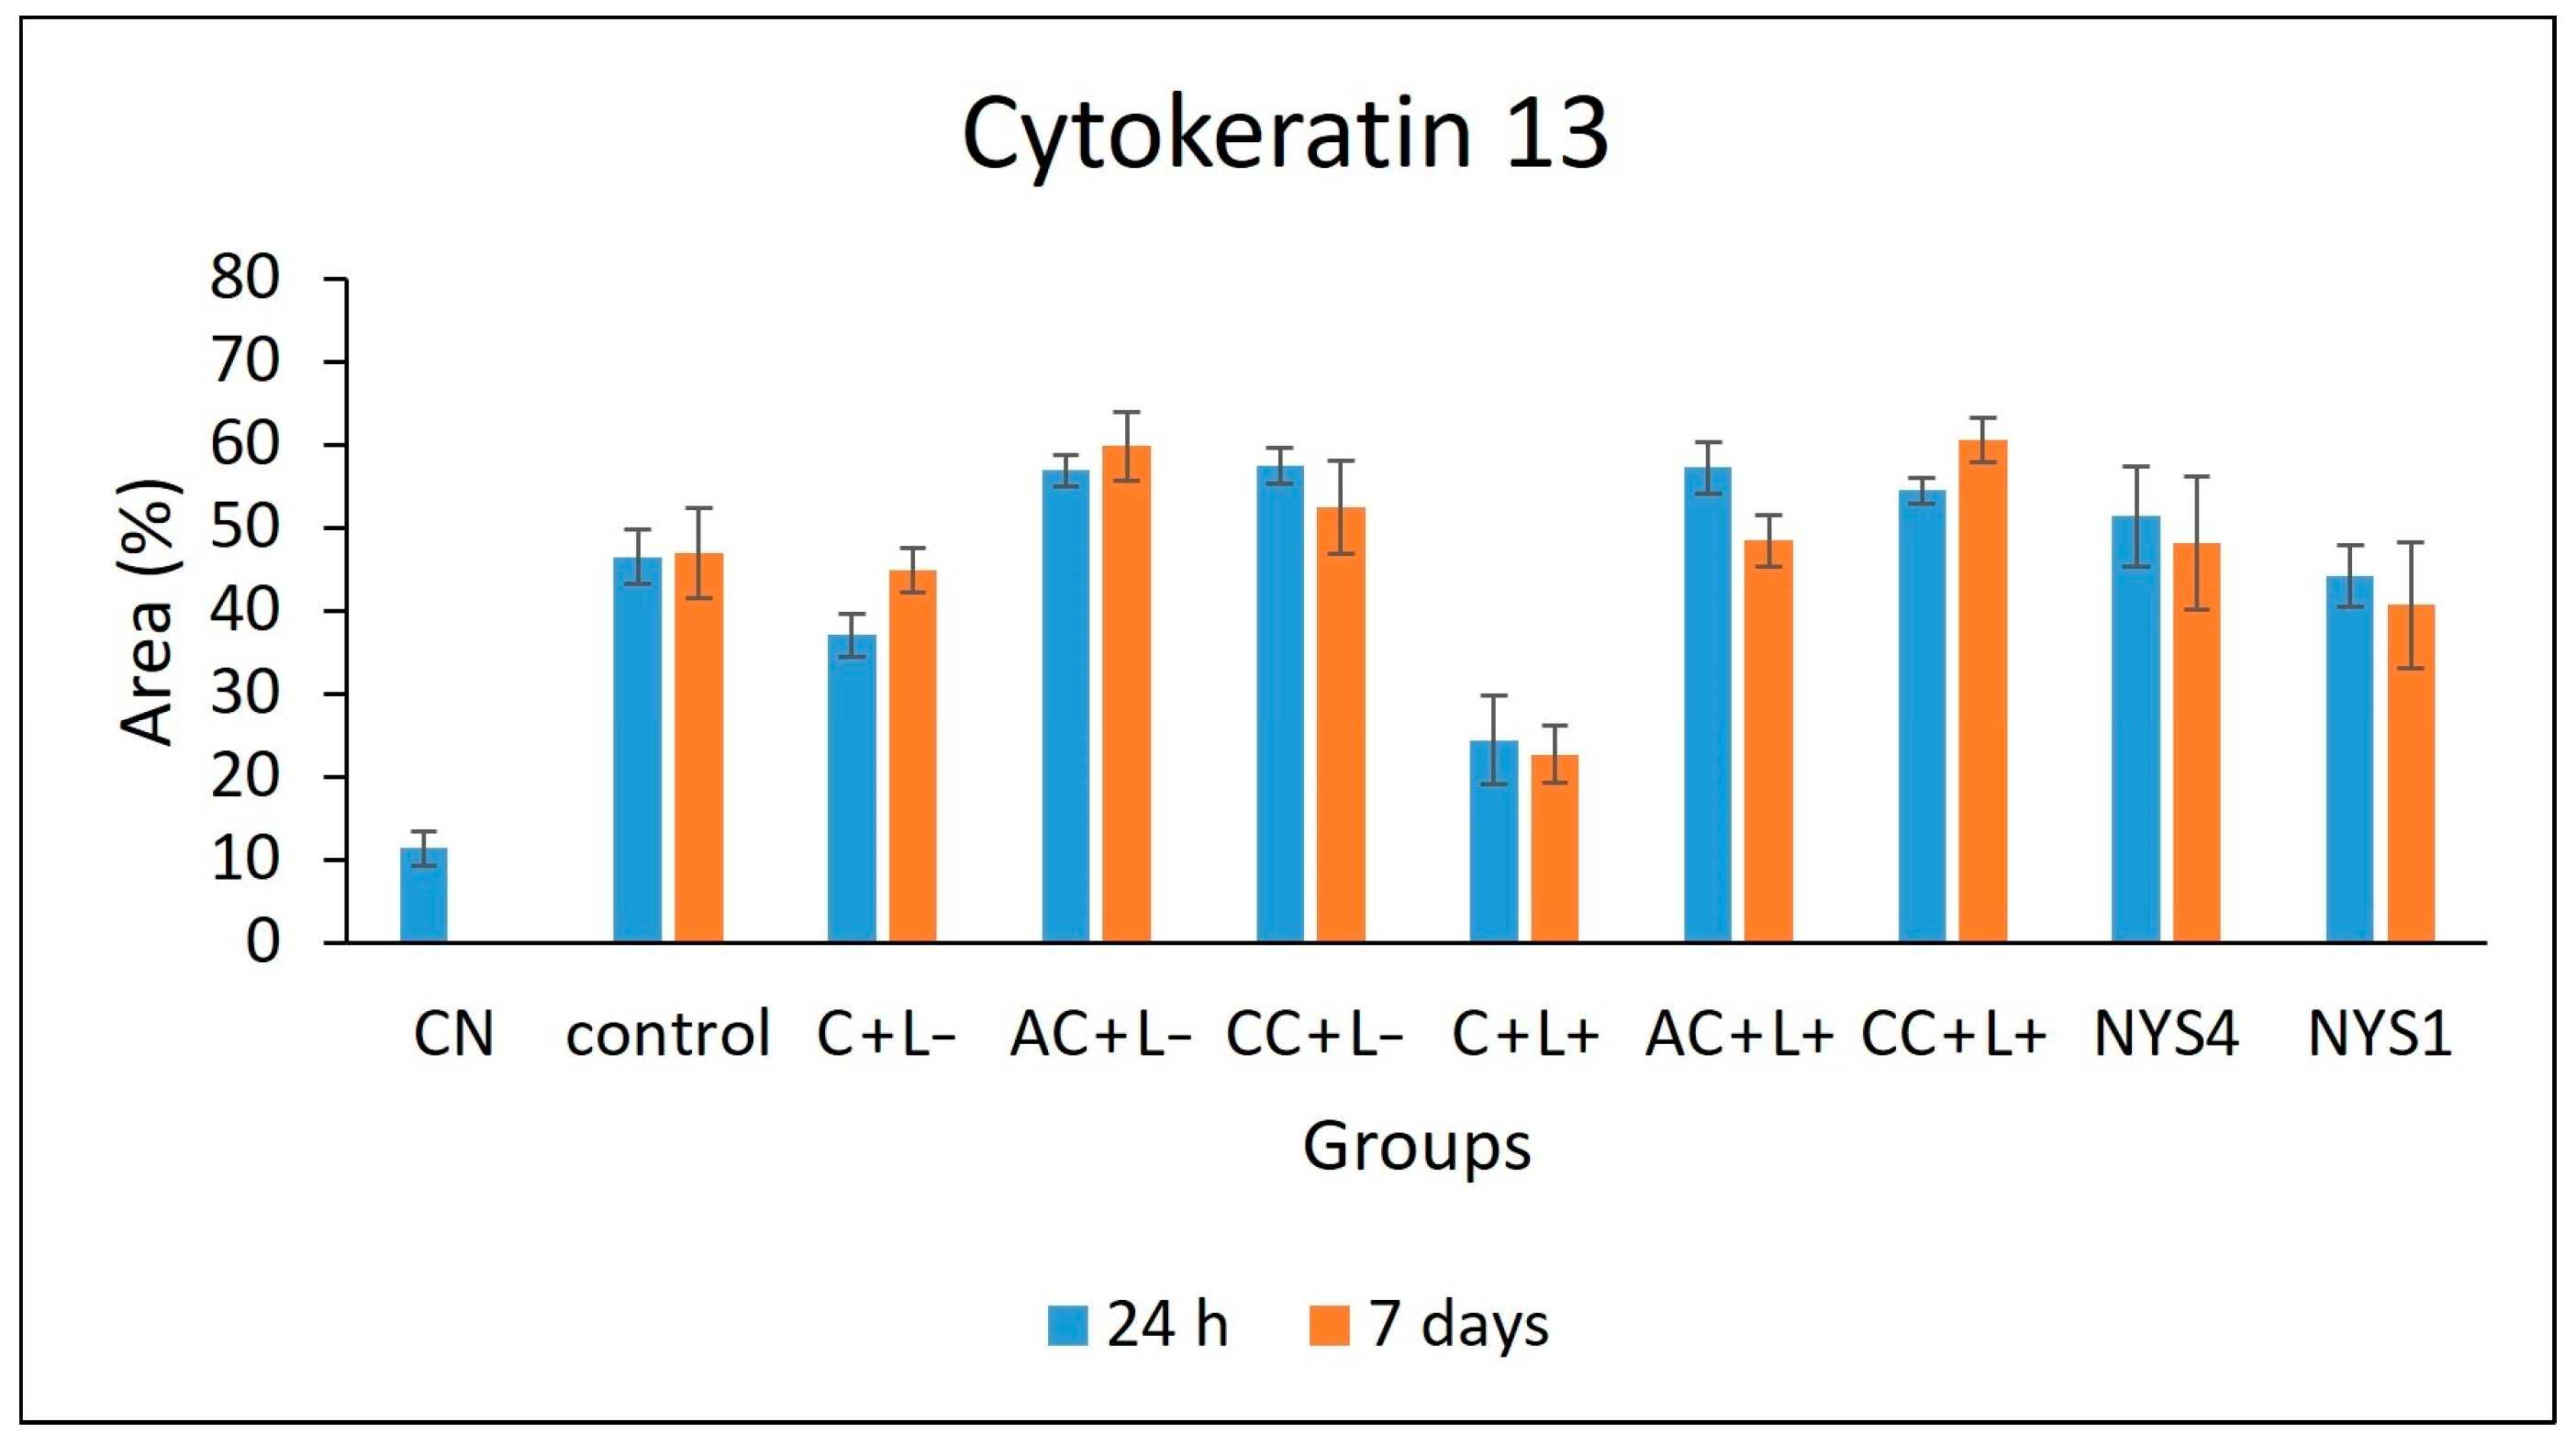
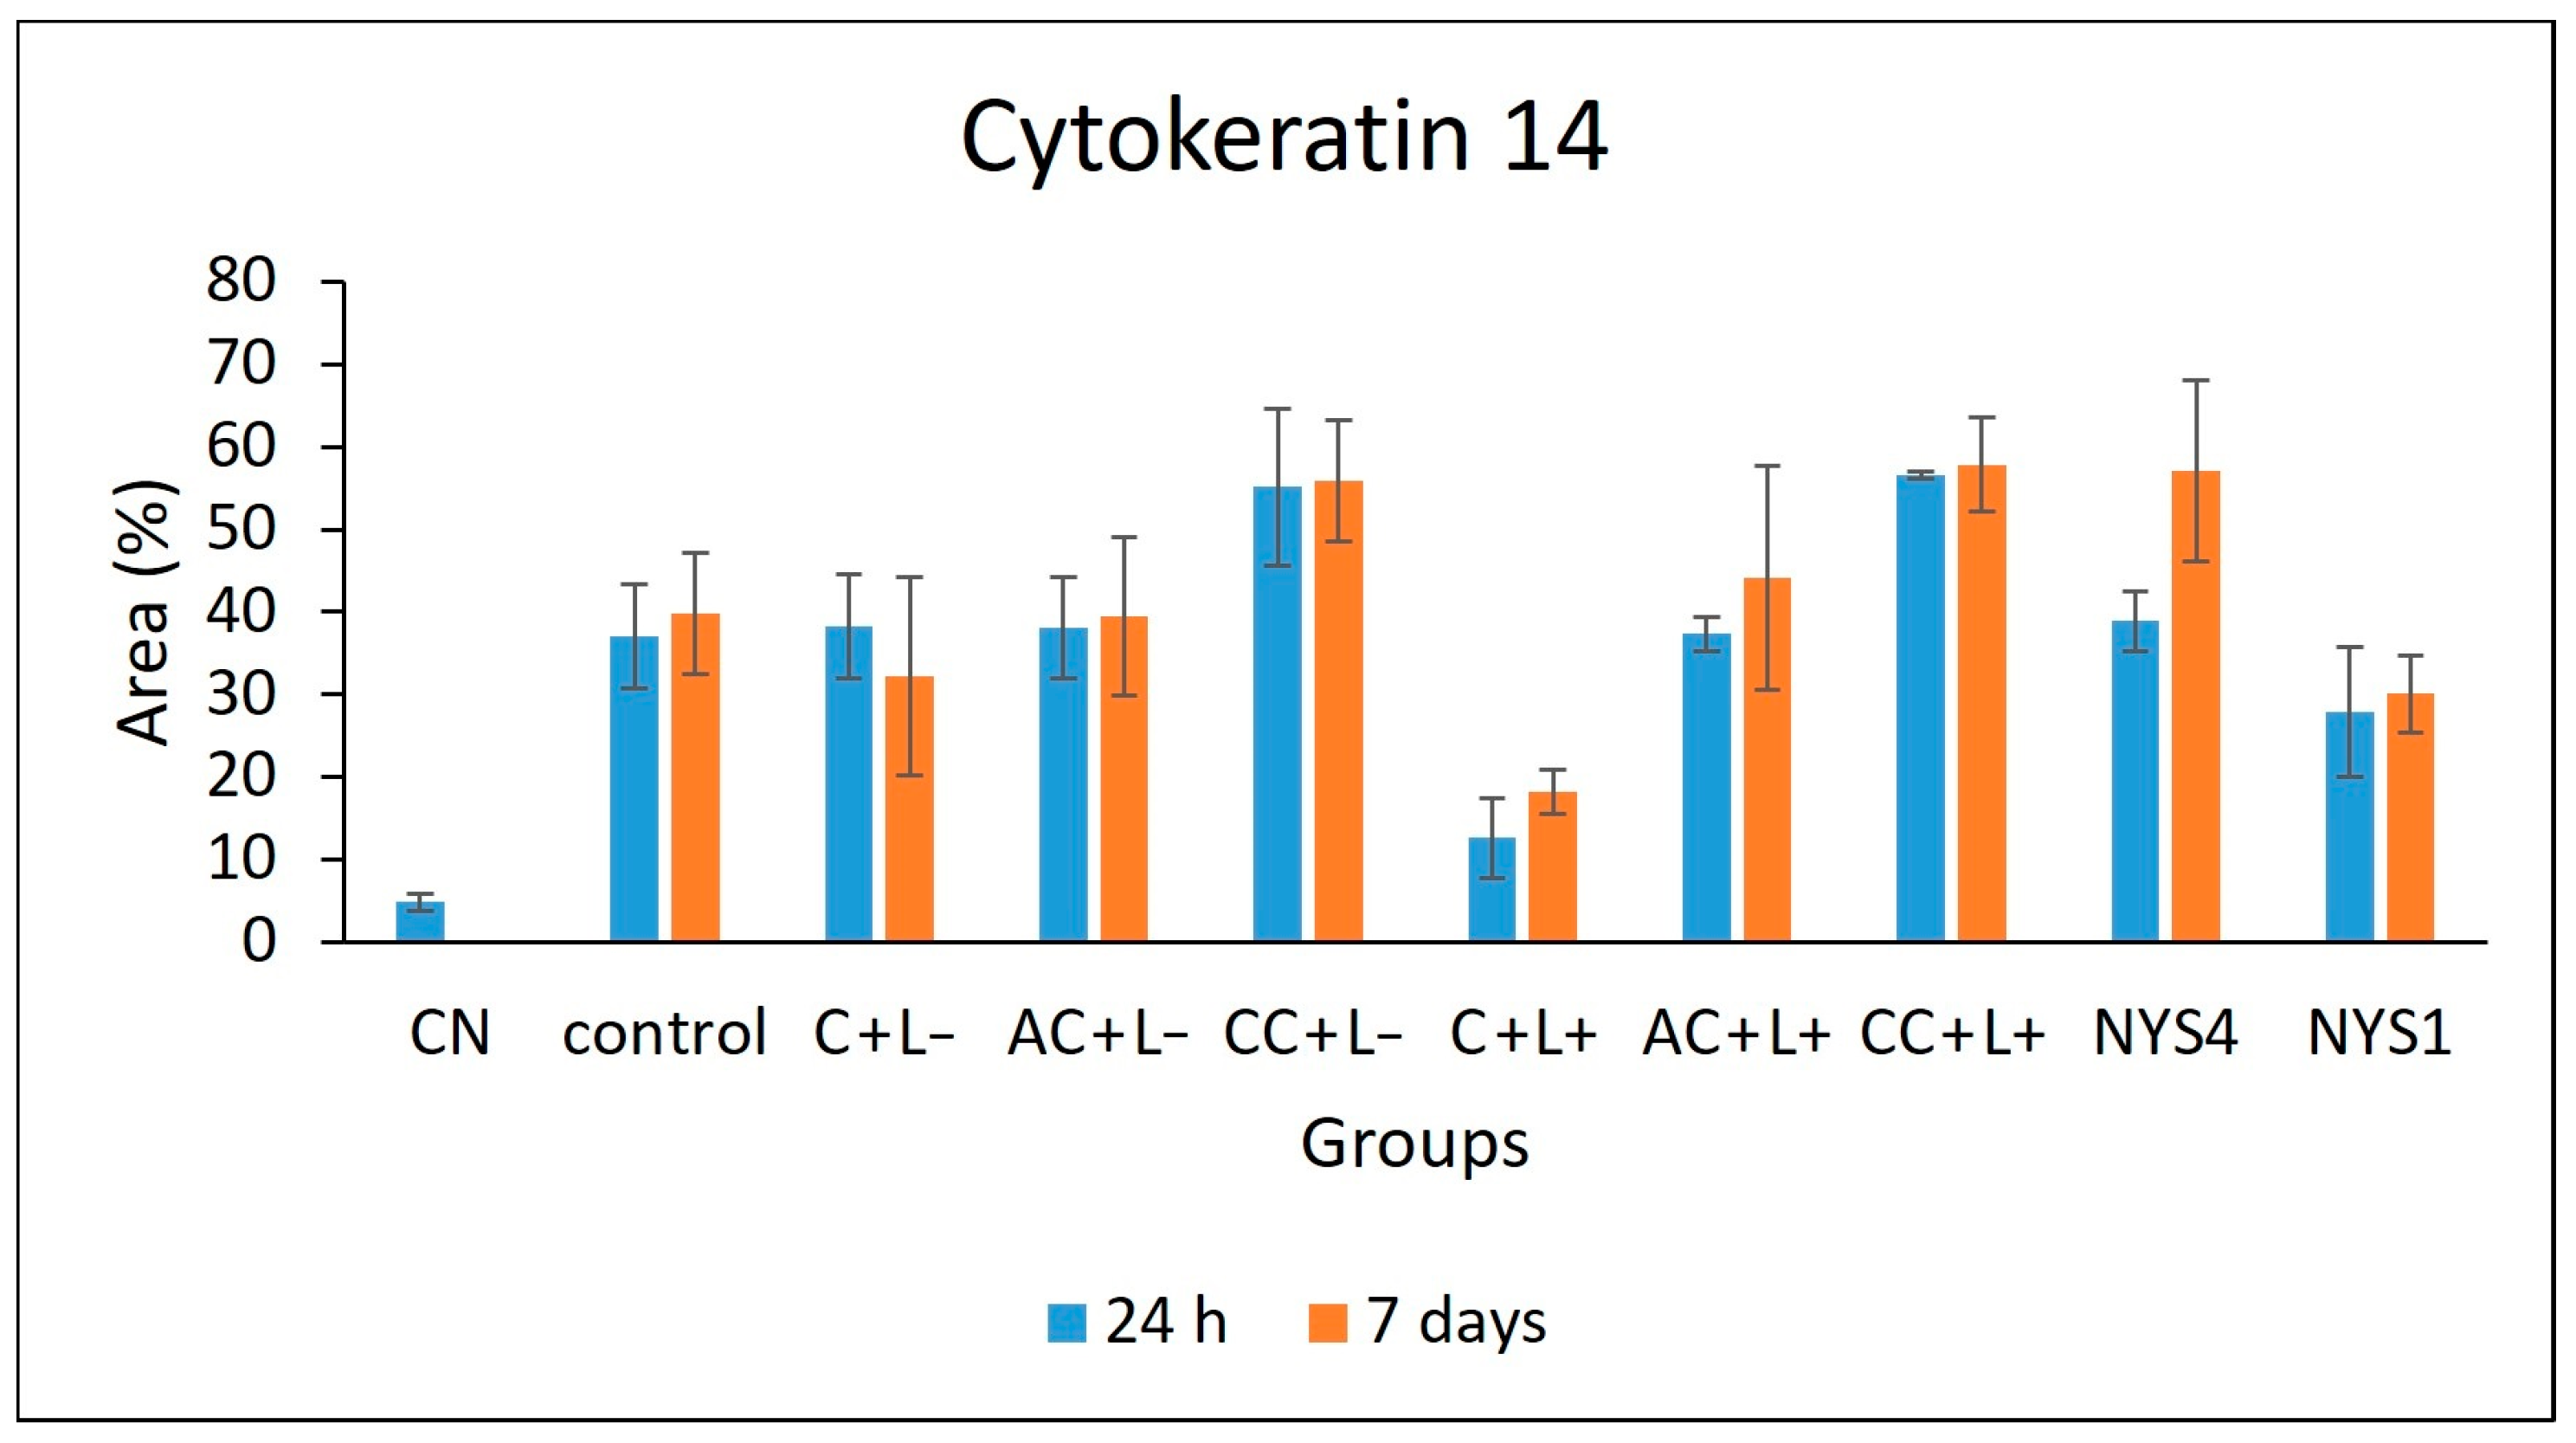
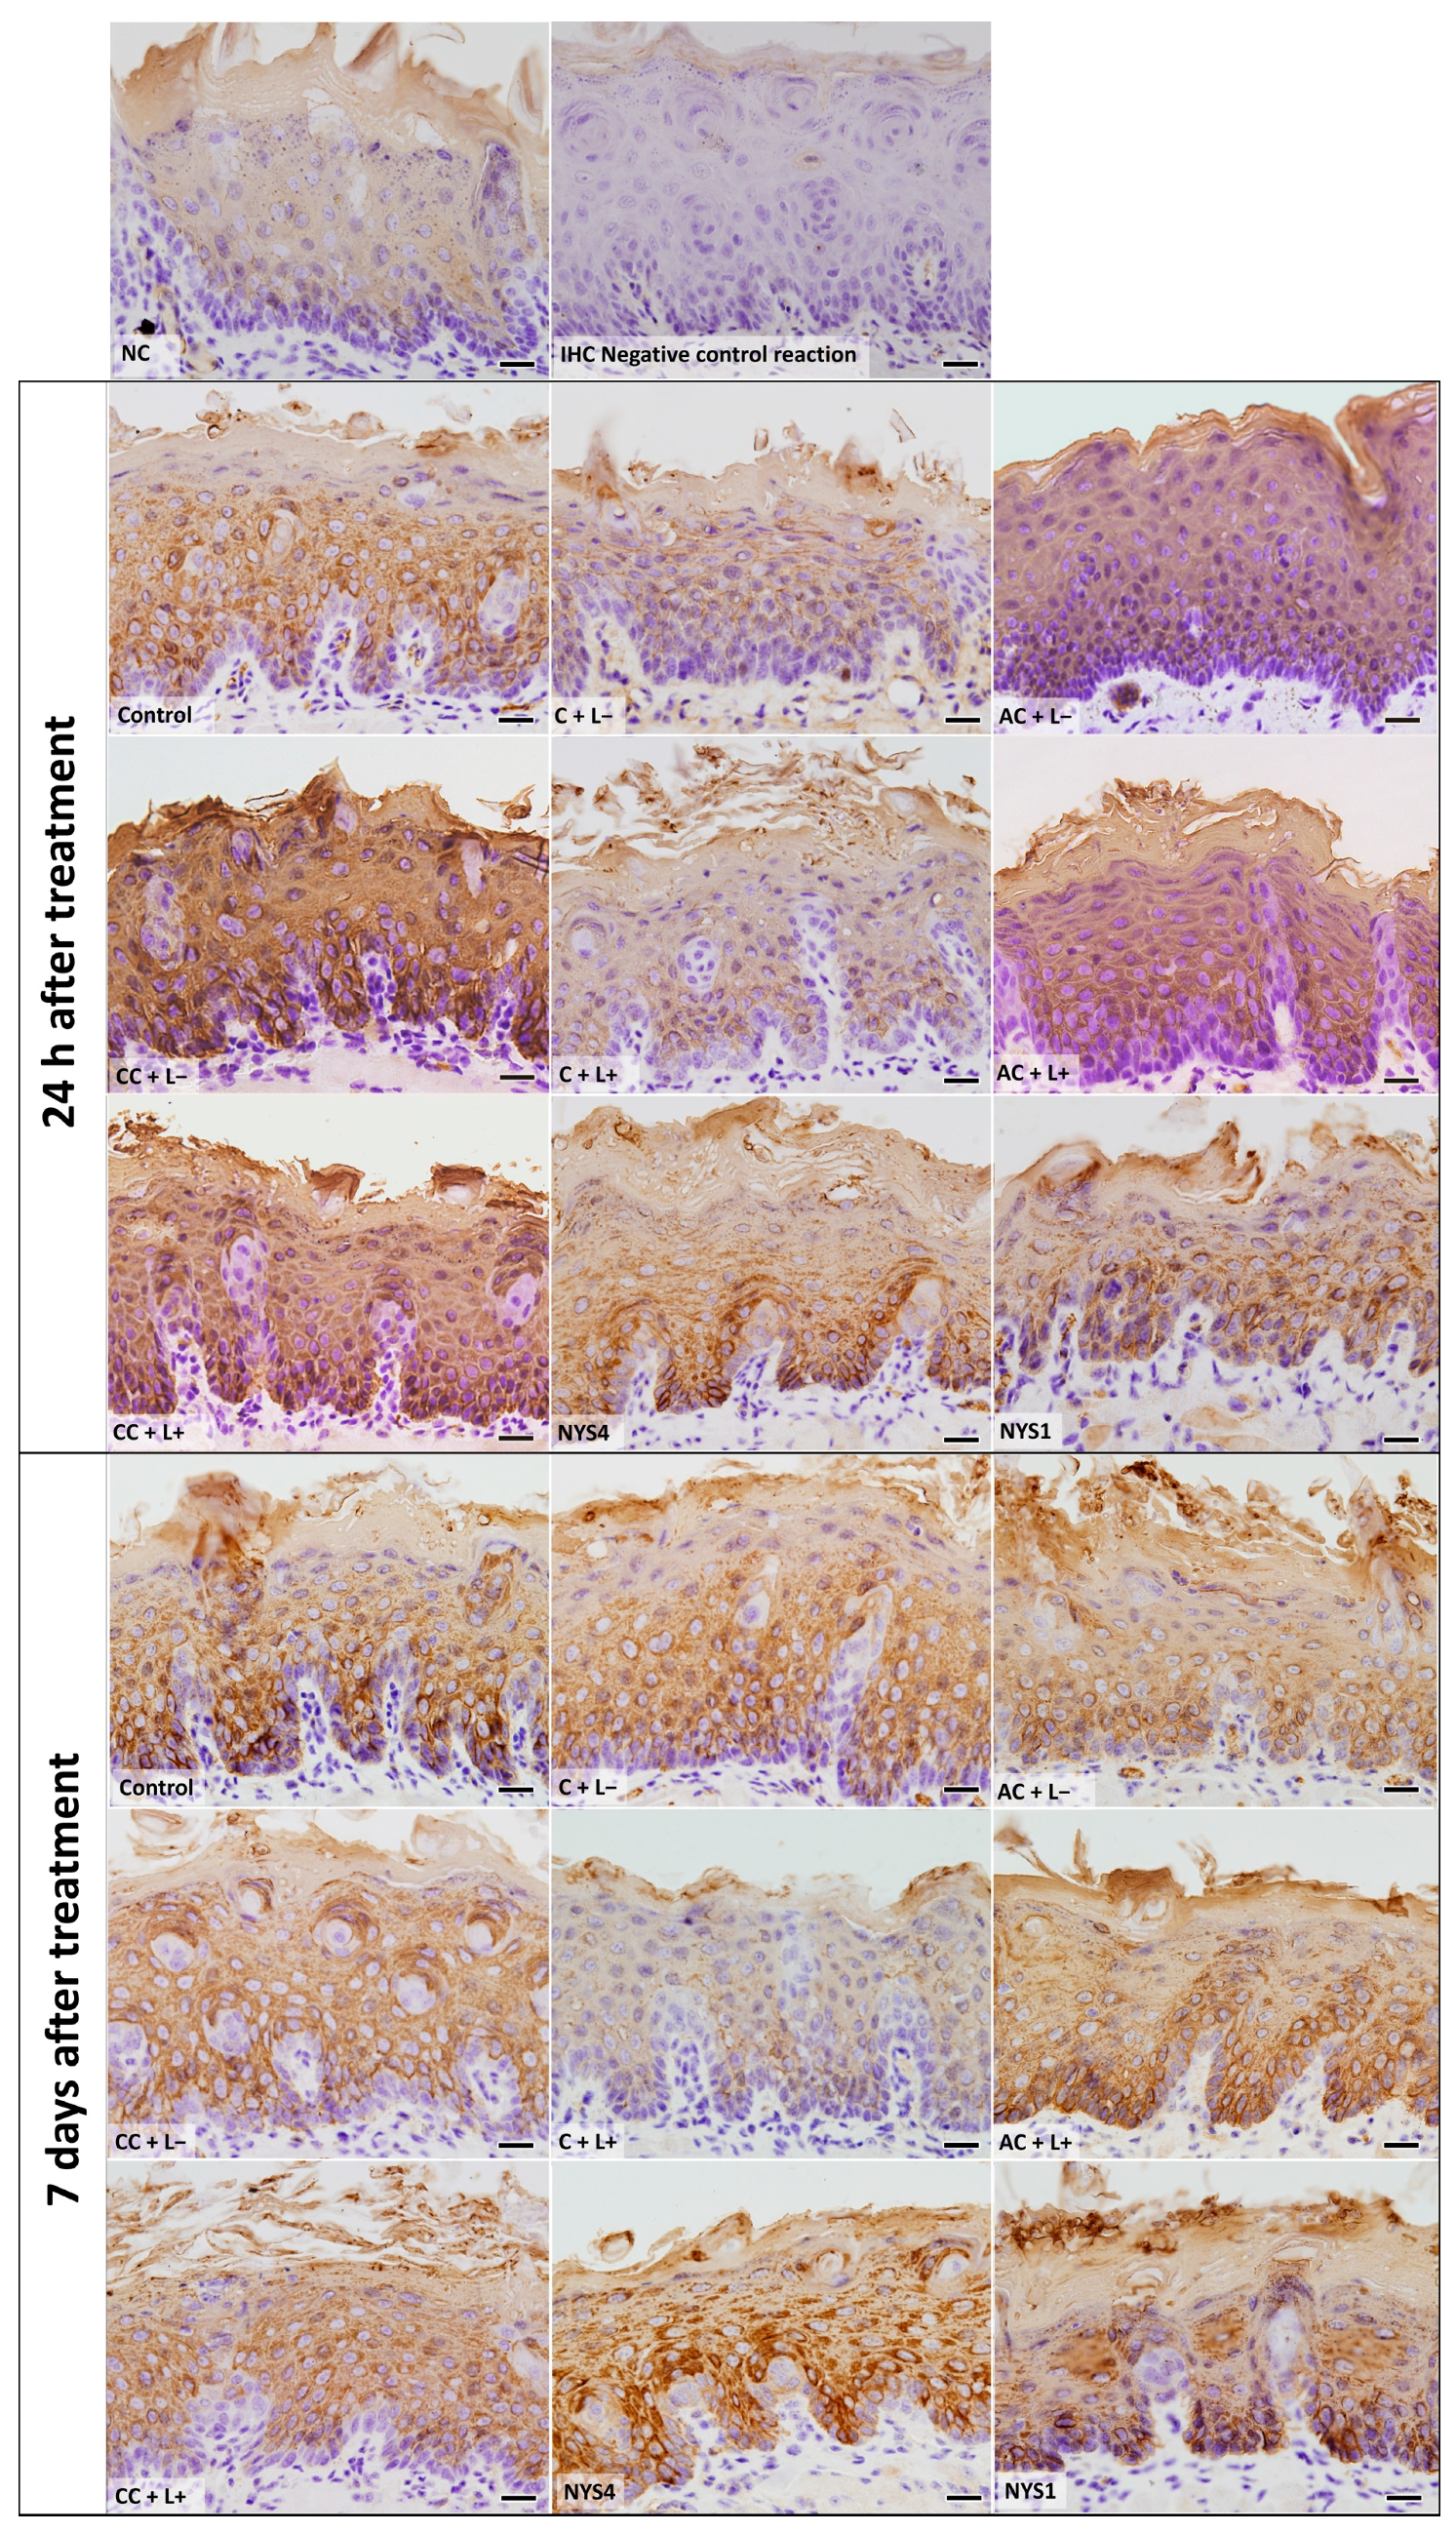
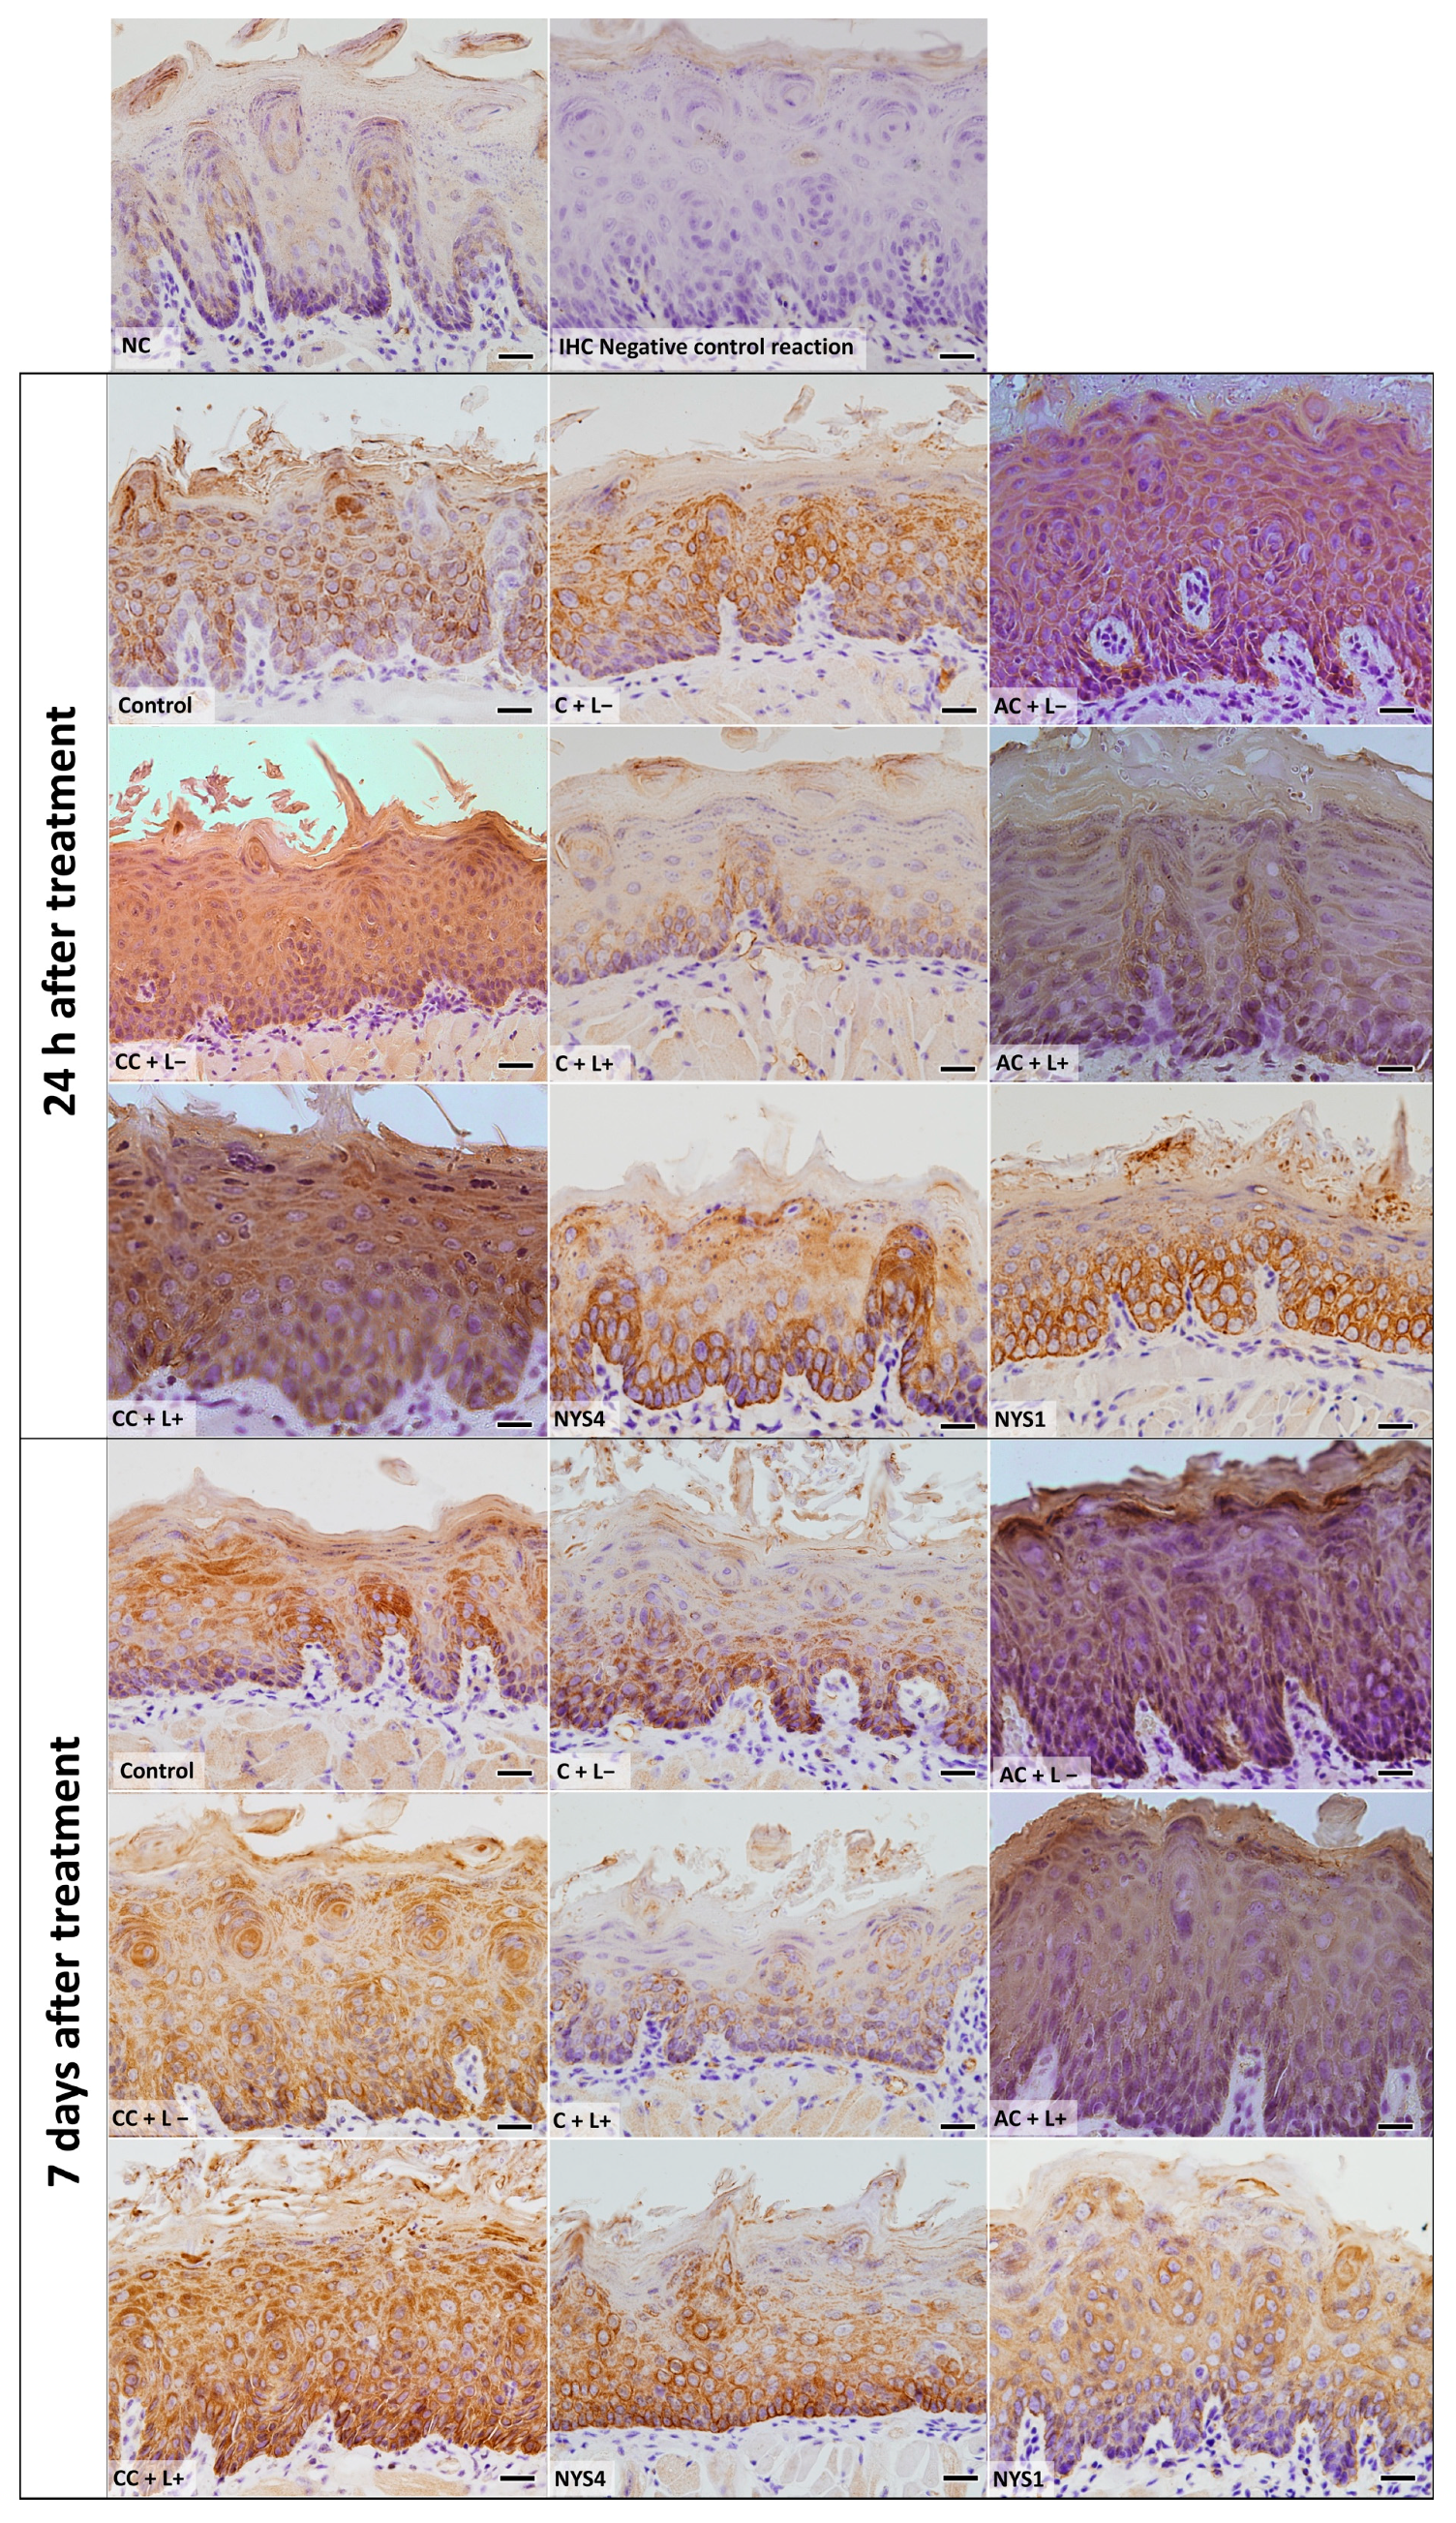
2.2.3. Cytokeratins (CKs) 13 and 14 Immunolabelling
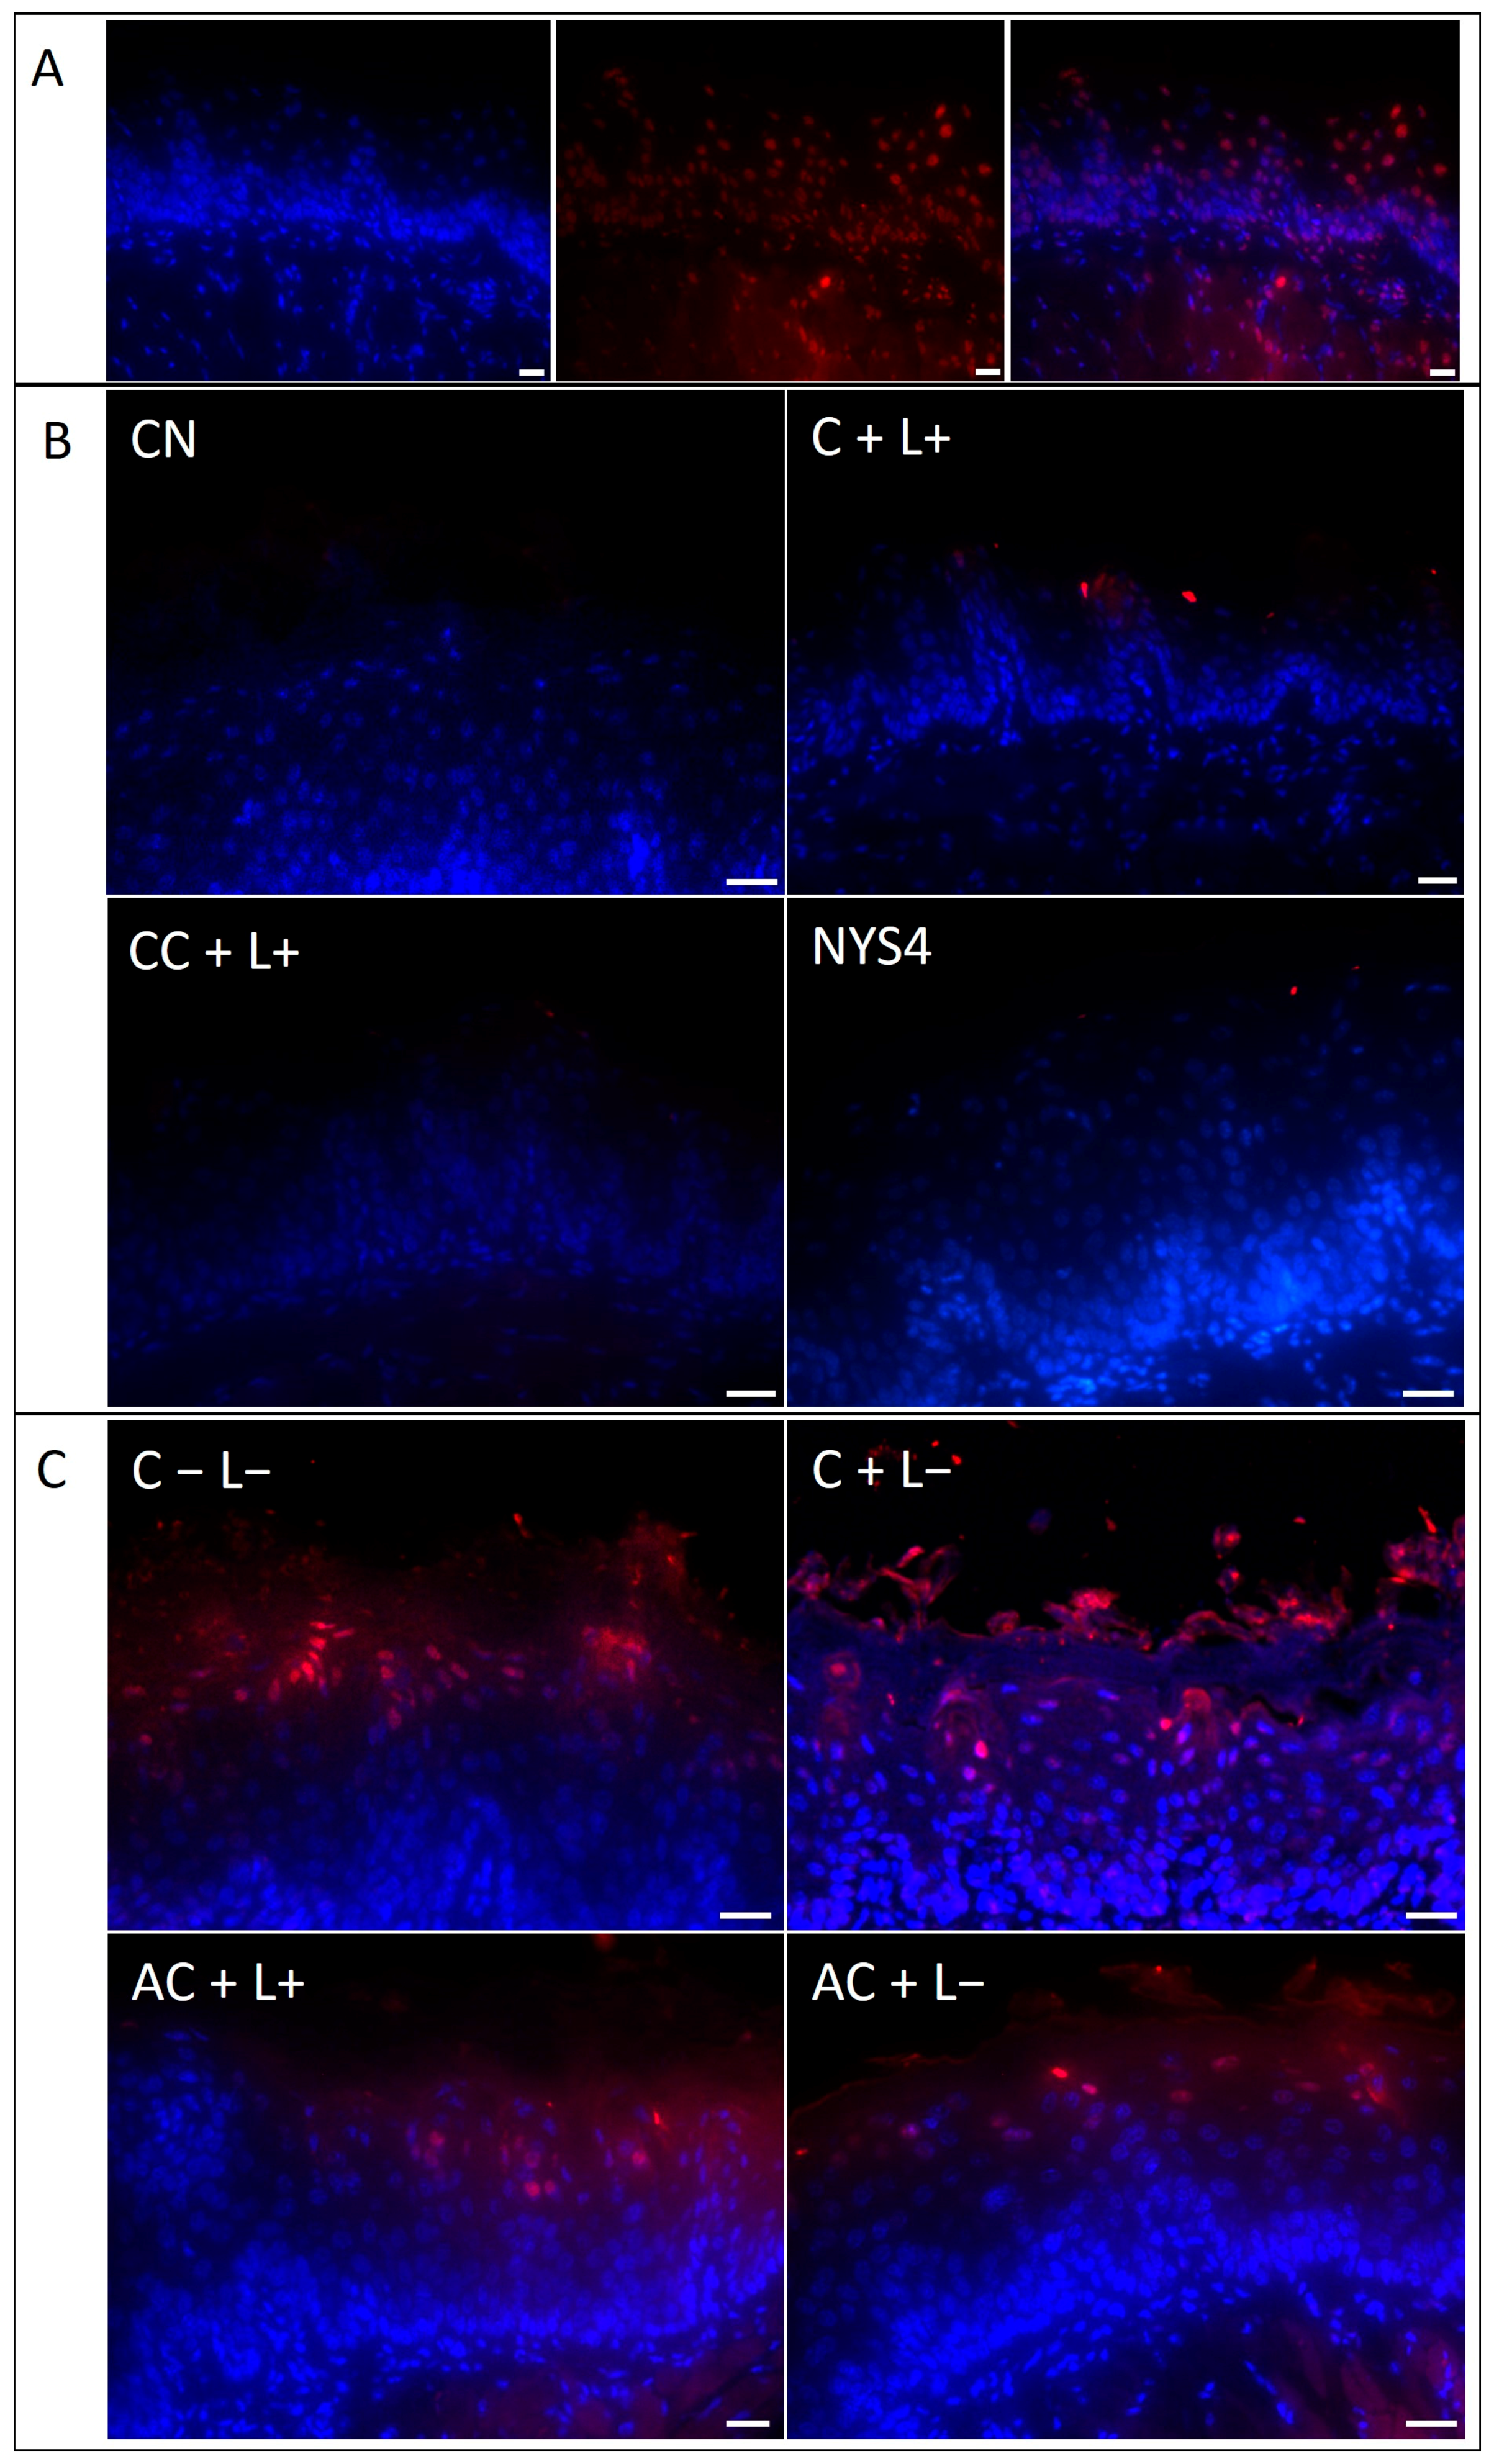
2.2.4. Terminal Deoxynucleotidyl Transferase (TdT)-Mediated Deoxyuridine Triphosphate (dUTP)-Biotin Nick End Labeling (TUNEL) Assay
3. Discussion
4. Materials and Methods
4.1. Synthesis and Characterization of CUR-NPs
4.1.1. PS and Light Source
4.1.2. Encapsulation of CUR in NPs
4.1.3. Physicochemical Properties
4.1.4. Morphology Analysis
4.1.5. Encapsulation Efficiency (EE)
4.1.6. Absorption Spectrum and Photostability
4.1.7. Release of CUR from NPs
4.2. In Vivo Study
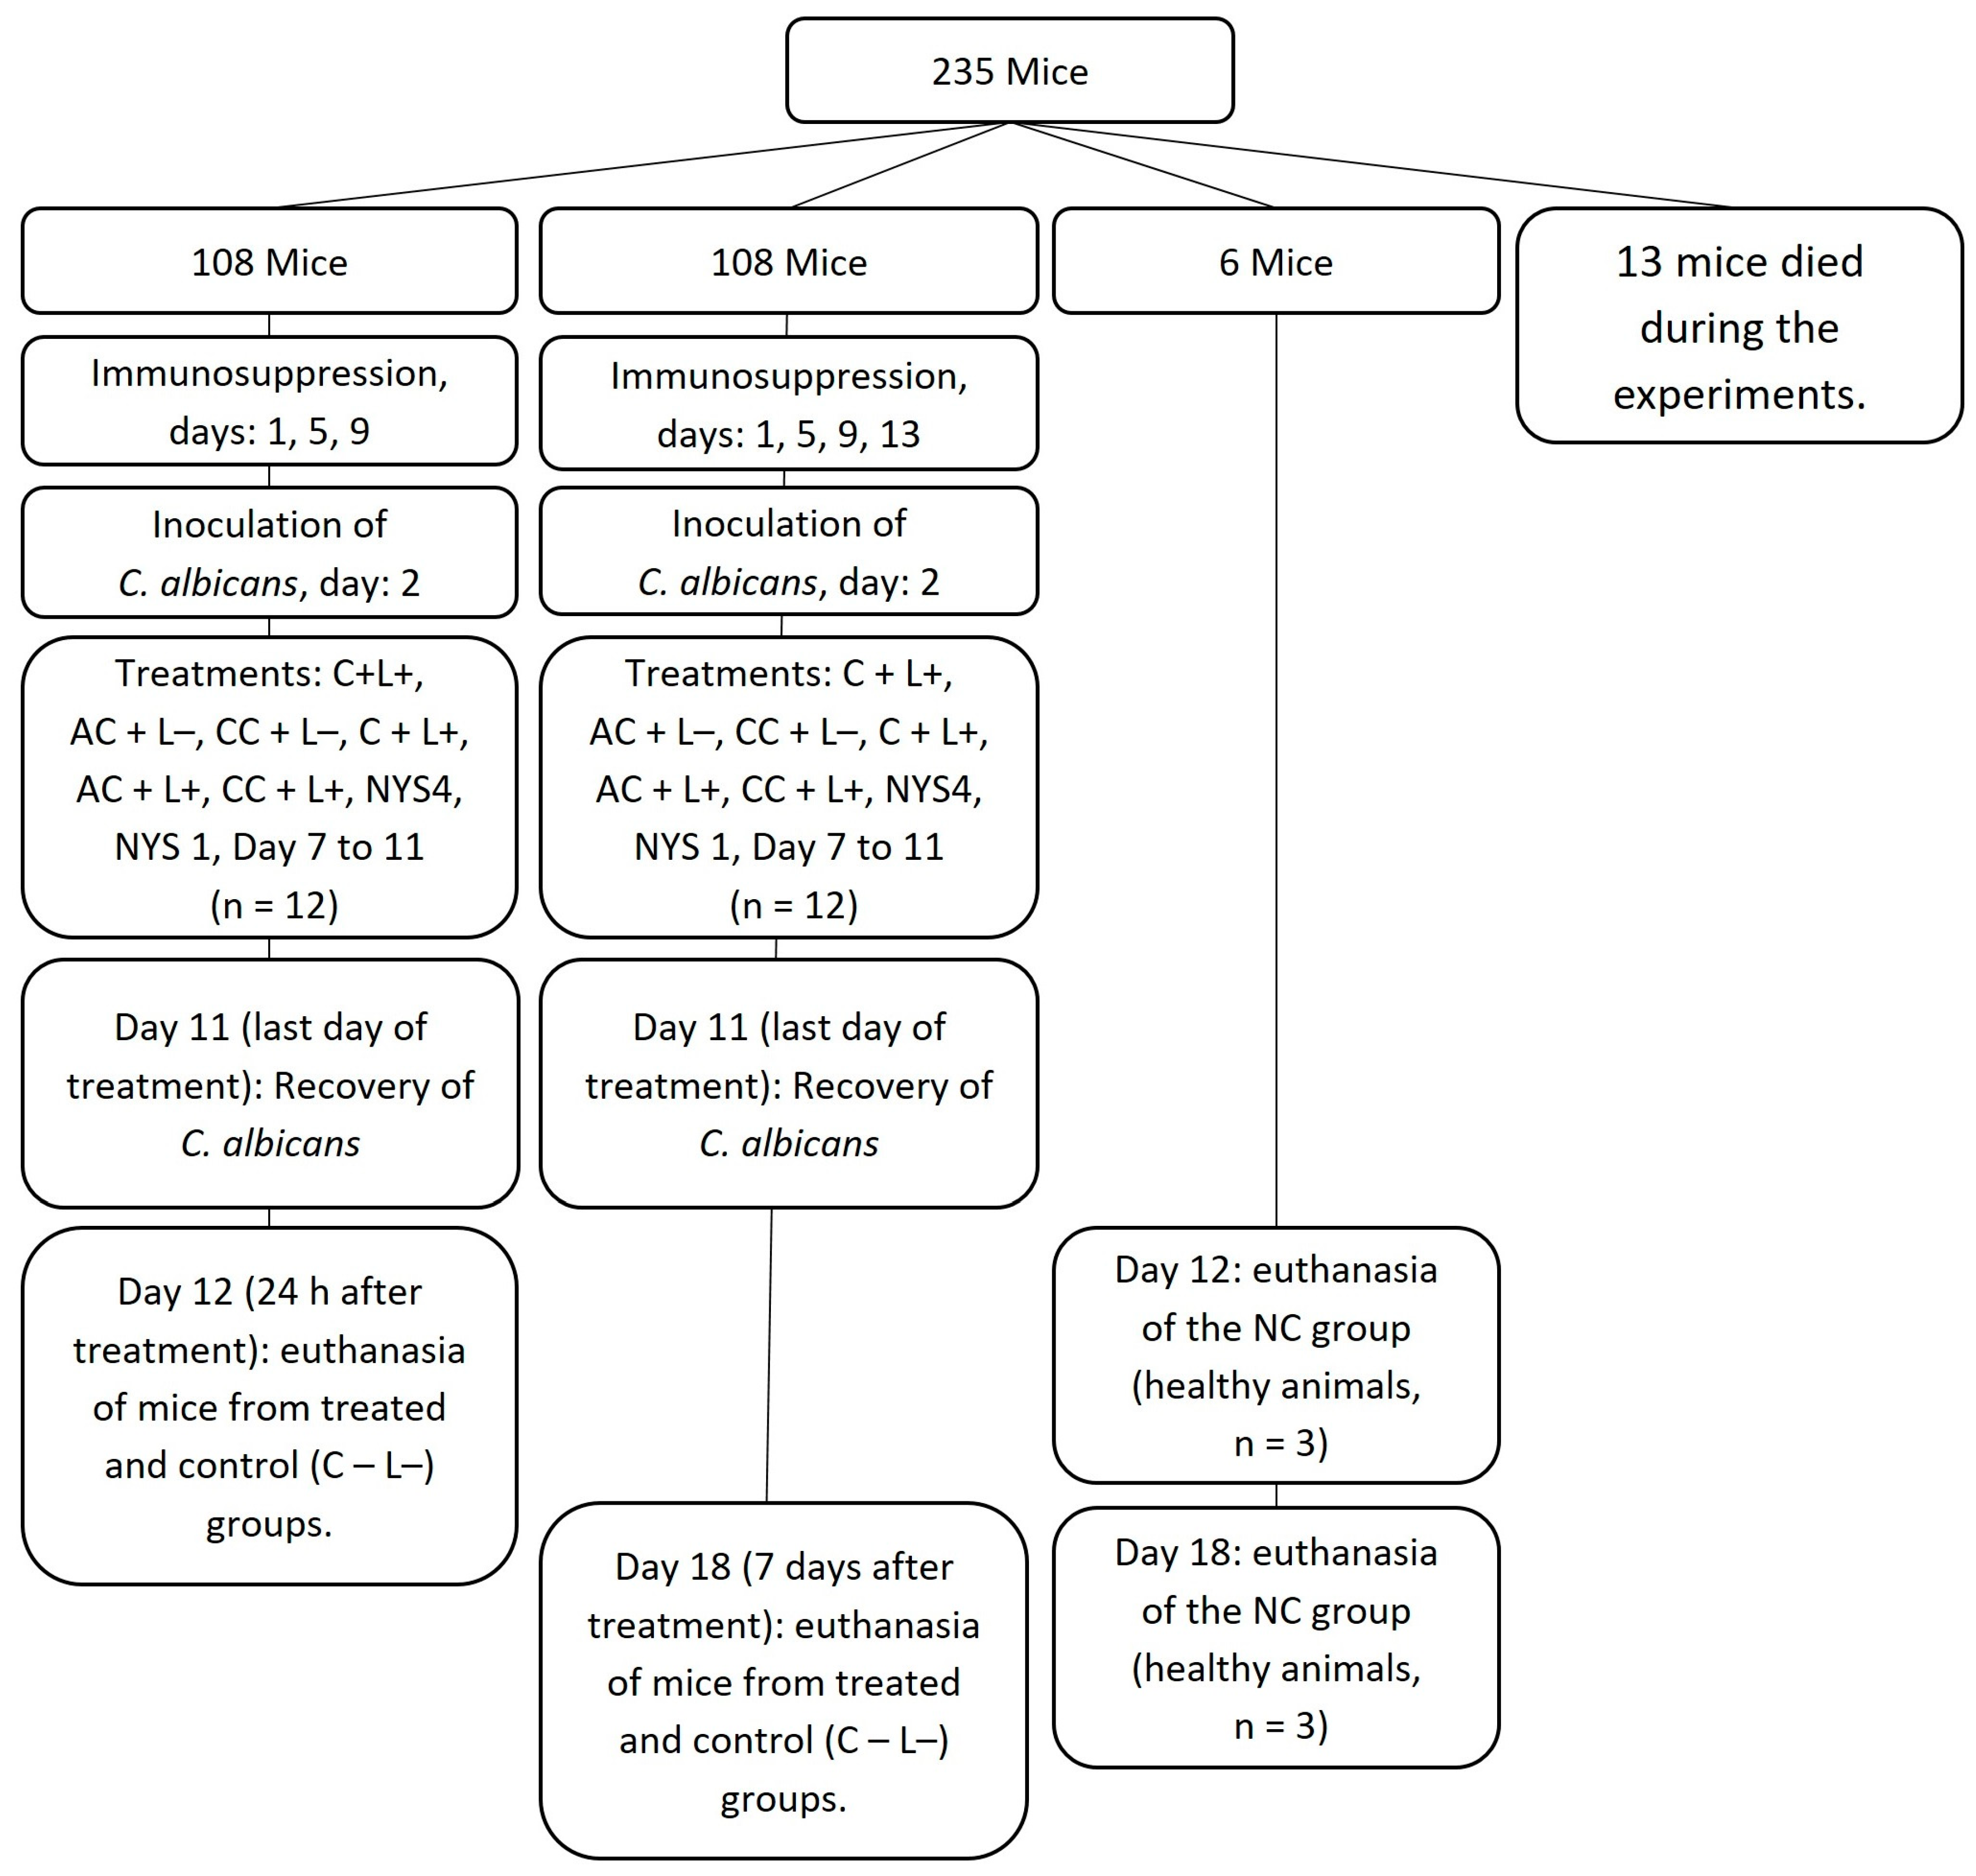
4.2.1. Animals
4.2.2. Oral Infection and Treatments
4.2.3. Euthanasia
4.2.4. Histological Analyses
4.2.5. Immunohistochemistry (IHC) for Cytokeratins (CKs)
4.2.6. Tissue Damage: Detection of Cell Death by the TUNEL Method
4.3. Statistical Analyses
5. Conclusions
6. Patents
Supplementary Materials
Author Contributions
Funding
Acknowledgments
Conflicts of Interest
References
- Rautemaa, R.; Ramage, G. Oral candidosis-clinical challenges of a biofilm disease. Crit. Rev. Microbiol. 2011, 37, 328–336. [Google Scholar] [CrossRef] [PubMed]
- Telles, D.R.; Karki, N.; Marshall, M.W. Oral fungal infections: Diagnosis and management. Dent. Clin. N. Am. 2017, 61, 319–349. [Google Scholar] [CrossRef] [PubMed]
- Kim, J.; Sudbery, P. Candida albicans, a major human fungal pathogen. J. Microbiol. 2011, 49, 171–177. [Google Scholar] [CrossRef] [PubMed]
- Gow, N.A.; van de Veerdonk, F.L.; Brown, A.J.; Netea, M.G. Candida albicans morphogenesis and host defence: Discriminating invasion from colonization. Nat. Rev. Microbiol. 2011, 10, 112–122. Available online: Https://www.ncbi.nlm.nih.gov/pubmed/22158429 (accessed on 12 July 2018). [CrossRef] [PubMed]
- Moyes, D.L.; Richardson, J.P.; Naglik, J.R. Candida albicans-epithelial interactions and pathogenicity mechanisms: Scratching the surface. Virulence 2015, 6, 338–346. Available online: Https://www.ncbi.nlm.nih.gov/pubmed/25714110 (accessed on 12 July 2018). [CrossRef] [PubMed]
- Rao, R.S.; Patil, S.; Ganavi, B.S. Oral cytokeratins in health and disease. J. Contemp. Dent. Pract. 2014, 15, 127–136. [Google Scholar] [CrossRef] [PubMed]
- Iwasaki, S.; Aoyagi, H.; Yoshizawa, H. Localization of keratins 13 and 14 in the lingual mucosa of rats during the morphogenesis of circumvallate papillae. Acta Histochem. 2011, 113, 395–401. [Google Scholar] [CrossRef] [PubMed]
- Iwasaki, S.; Yoshizawa, H.; Aoyagi, H. Immunohistochemical expression of keratins 13 and 14 in the lingual epithelium of rats during the morphogenesis of filiform papillae. Arch. Oral Biol. 2006, 51, 416–426. [Google Scholar] [CrossRef] [PubMed]
- Roca, I.; Akova, M.; Baquero, F.; Carlet, J.; Cavaleri, M.; Coenen, S.; Cohen, J.; Findlay, D.; Gyssens, I.; Heuer, O.E.; et al. The global threat of antimicrobial resistance: Science for intervention. New Microbes New Infect. 2015, 6, 22–29. [Google Scholar] [CrossRef] [PubMed]
- Santezi, C.; Reina, B.D.; Dovigo, L.N. Curcumin-mediated Photodynamic Therapy for the treatment of oral infections-A review. Photodiagnosis Photodyn. Ther. 2018, 21, 409–415. [Google Scholar] [CrossRef] [PubMed]
- Soukos, N.S.; Goodson, J.M. Photodynamic therapy in the control of oral biofilms. Periodontol. 2000. 2011, 55, 143–166. [Google Scholar] [CrossRef] [PubMed]
- Van Straten, D.; Mashayekhi, V.; de Bruijn, H.S.; Oliveira, S.; Robinson, D.J. Oncologic Photodynamic Therapy: Basic principles, current clinical status and future directions. Cancers (Basel) 2017, 9, 19. [Google Scholar] [CrossRef] [PubMed]
- Hamblin, M.R. Antimicrobial photodynamic inactivation: A bright new technique to kill resistant microbes. Curr. Opin. Microbiol. 2016, 33, 67–73. [Google Scholar] [CrossRef] [PubMed]
- Amalraj, A.; Pius, A.; Gopi, S.; Gopi, S. Biological activities of curcuminoids, other biomolecules from turmeric and their derivatives-A review. J. Tradit. Complement. Med. 2016, 7, 205–233. [Google Scholar] [CrossRef] [PubMed]
- Dovigo, L.N.; Pavarina, A.C.; Ribeiro, A.P.; Brunetti, I.L.; Costa, C.A.; Jacomassi, D.P.; Bagnato, V.S.; Kurachi, C. Investigation of the photodynamic effects of curcumin against Candida albicans. Photochem. Photobiol. 2011, 87, 895–903. [Google Scholar] [CrossRef] [PubMed]
- Dovigo, L.N.; Pavarina, A.C.; Carmello, J.C.; Machado, A.L.; Brunetti, I.L.; Bagnato, V.S. Susceptibility of clinical isolates of Candida to photodynamic effects of curcumin. Lasers Surg. Med. 2011, 43, 927–934. [Google Scholar] [CrossRef] [PubMed]
- Martins, C.V.; da Silva, D.L.; Neres, A.T.; Magalhães, T.F.; Watanabe, G.A.; Modolo, L.V.; Sabino, A.A.; de Fátima, A.; de Resende, M.A. Curcumin as a promising antifungal of clinical interest. J. Antimicrob. Chemother. 2009, 63, 337–339. [Google Scholar] [CrossRef] [PubMed]
- Andrade, M.C.; Ribeiro, A.P.; Dovigo, L.N.; Brunetti, I.L.; Giampaolo, E.T.; Bagnato, V.S.; Pavarina, A.C. Effect of different pre-irradiation times on curcumin-mediated photodynamic therapy against planktonic cultures and biofilms of Candida spp. Arch. Oral Biol. 2013, 58, 200–210. [Google Scholar] [CrossRef] [PubMed]
- Dovigo, L.N.; Carmello, J.C.; de Souza Costa, C.A.; Vergani, C.E.; Brunetti, I.L.; Bagnato, V.S.; Pavarina, A.C. Curcumin-mediated photodynamic inactivation of Candida albicans in a murine model of oral candidiasis. Med. Mycol. 2013, 51, 243–251. [Google Scholar] [CrossRef] [PubMed]
- Carmello, J.C.; Alves, F.; Basso, F.G.; de Souza Costa, C.A.; Bagnato, V.S.; Mima, E.G.; Pavarina, A.C. Treatment of oral candidiasis using photodithazine®-mediated Photodynamic Therapy in vivo. PLoS ONE 2016, 11, e0156947. [Google Scholar] [CrossRef] [PubMed]
- Akbik, D.; Ghadiri, M.; Chrzanowski, W.; Rohanizadeh, R. Curcumin as a wound healing agent. Life Sci. 2014, 116, 1–7. [Google Scholar] [CrossRef] [PubMed]
- Fonseca-Santos, B.; Dos Santos, A.M.; Rodero, C.F.; Gremião, M.P.; Chorilli, M. Design, characterization, and biological evaluation of curcumin-loaded surfactant-based systems for topical drug delivery. Int. J. Nanomed. 2016, 11, 4553–4562. [Google Scholar] [CrossRef] [PubMed]
- Tejada, S.; Manayi, A.; Daglia, M.; Nabavi, S.F.; Sureda, A.; Hajheydari, Z.; Gortzi, O.; Pazoki-Toroudi, H.; Nabavi, S.M. Wound healing effects of curcumin: A short review. Curr. Pharm. Biotechnol. 2016, 17, 1002–1007. [Google Scholar] [CrossRef] [PubMed]
- Hussain, Z.; Thu, H.E.; Ng, S.F.; Khan, S.; Katas, H. Nanoencapsulation, an efficient and promising approach to maximize wound healing efficacy of curcumin: A review of new trends and state-of-the-art. Colloids Surf. B Biointerface 2017, 150, 223–241. [Google Scholar] [CrossRef] [PubMed]
- Kant, V.; Gopal, A.; Pathak, N.N.; Kumar, P.; Tandan, S.K.; Kumar, D. Antioxidant and anti-inflammatory potential of curcumin accelerated the cutaneous wound healing in streptozotocin-induced diabetic rats. Int. Immunopharmacol. 2014, 20, 322–330. [Google Scholar] [CrossRef] [PubMed]
- Mehrabani, D.; Farjam, M.; Geramizadeh, B.; Tanideh, N.; Amini, M.; Panjehshahin, M.R. The healing effect of curcumin on burn wounds in rat. World J. Plast. Surg. 2015, 4, 29–35. [Google Scholar] [PubMed]
- Partoazar, A.; Kianvash, N.; Darvishi, M.H.; Nasoohi, S.; Rezayat, S.M.; Bahador, A. Ethosomal curcumin promoted wound healing and reduced bacterial flora in second degree burn in rat. Drug Res. (Stuttg) 2016, 66, 660–665. [Google Scholar] [CrossRef] [PubMed]
- Krausz, A.E.; Adler, B.L.; Cabral, V.; Navati, M.; Doerner, J.; Charafeddine, R.A.; Chandra, D.; Liang, H.; Gunther, L.; Clendaniel, A.; et al. Curcumin-encapsulated nanoparticles as innovative antimicrobial and wound healing agent. Nanomedicine 2015, 11, 195–206. [Google Scholar] [CrossRef] [PubMed]
- Salmazi, R.; Calixto, G.; Bernegossi, J.; Ramos, M.A.; Bauab, T.M.; Chorilli, M. A curcumin-loaded liquid crystal precursor mucoadhesive system for the treatment of vaginal candidiasis. Int. J. Nanomed. 2015, 10, 4815–4824. [Google Scholar] [CrossRef]
- Gonçalez, M.L.; Rigon, R.B.; Pereira-da-Silva, M.A.; Chorilli, M. Curcumin-loaded cationic solid lipid nanoparticles as a potential platform for the treatment of skin disorders. Pharmazie 2017, 72, 721–727. [Google Scholar] [CrossRef] [PubMed]
- Trigo Gutierrez, J.K.; Zanatta, G.C.; Ortega, A.L.M.; Balastegui, M.I.C.; Sanitá, P.V.; Pavarina, A.C.; Barbugli, P.A.; Mima, E.G.O. Encapsulation of curcumin in polymeric nanoparticles for antimicrobial Photodynamic Therapy. PLoS ONE 2017, 12, e0187418. [Google Scholar] [CrossRef] [PubMed]
- Kumari, A.; Yadav, S.K.; Yadav, S.C. Biodegradable polymeric nanoparticles based drug delivery systems. Colloids Surf. B Biointerfaces 2010, 75, 1–18. [Google Scholar] [CrossRef] [PubMed]
- Chereddy, K.K.; Coco, R.; Memvanga, P.B.; Ucakar, B.; des Rieux, A.; Vandermeulen, G.; Préat, V. Combined effect of PLGA and curcumin on wound healing activity. J. Control. Release 2013, 171, 208–215. [Google Scholar] [CrossRef] [PubMed]
- Shaikh, J.; Ankola, D.D.; Beniwal, V.; Singh, D.; Kumar, M.N. Nanoparticle encapsulation improves oral bioavailability of curcumin by at least 9-fold when compared to curcumin administered with piperine as absorption enhancer. Eur. J. Pharm. Sci. 2009, 37, 223–230. [Google Scholar] [CrossRef] [PubMed]
- Yallapu, M.M.; Gupta, B.K.; Jaggi, M.; Chauhan, S.C. Fabrication of curcumin encapsulated PLGA nanoparticles for improved therapeutic effects in metastatic cancer cells. J. Colloid Interface Sci. 2010, 351, 19–29. [Google Scholar] [CrossRef] [PubMed]
- Ghosh, D.; Choudhury, S.T.; Ghosh, S.; Mandal, A.K.; Sarkar, S.; Ghosh, A.; Saha, K.D.; Das, N. Nanocapsulated curcumin: Oral chemopreventive formulation against diethylnitrosamine induced hepatocellular carcinoma in rat. Chem. Biol. Interact. 2012, 195, 206–214. [Google Scholar] [CrossRef] [PubMed]
- Khalil, N.M.; do Nascimento, T.C.; Casa, D.M.; Dalmolin, L.F.; de Mattos, A.C.; Hoss, I.; Romano, M.A.; Mainardes, R.M. Pharmacokinetics of curcumin-loaded PLGA and PLGA-PEG blend nanoparticles after oral administration in rats. Colloids Surf. B Biointerfaces 2013, 101, 353–360. [Google Scholar] [CrossRef] [PubMed]
- Gaumet, M.; Vargas, A.; Gurny, R.; Delie, F. Nanoparticles for drug delivery: The need for precision in reporting particle size parameters. Eur. J. Pharm. Biopharm. 2008, 69, 1–9. [Google Scholar] [CrossRef] [PubMed]
- Hegge, A.B.; Nielsen, T.T.; Larsen, K.L.; Bruzell, E.; Tønnesen, H.H. Impact of curcumin supersaturation in antibacterial photodynamic therapy—effect of cyclodextrin type and amount: Studies on curcumin and curcuminoides XLV. J. Pharm. Sci. 2012, 101, 1524–1537. [Google Scholar] [CrossRef] [PubMed]
- Hazzah, H.A.; Farid, R.M.; Nasra, M.M.; Hazzah, W.A.; El-Massik, M.A.; Abdallah, O.Y. Gelucire-based nanoparticles for curcumin targeting to oral mucosa: Preparation, characterization, and antimicrobial activity assessment. J. Pharm. Sci. 2015, 104, 3913–3924. [Google Scholar] [CrossRef] [PubMed]
- Udompornmongkol, P.; Chiang, B.H. Curcumin-loaded polymeric nanoparticles for enhanced anti-colorectal cancer applications. J. Biomater. Appl. 2015, 30, 537–546. [Google Scholar] [CrossRef] [PubMed]
- Mukerjee, A.; Vishwanatha, J.K. Formulation, characterization and evaluation of curcumin-loaded PLGA nanospheres for cancer therapy. Anticancer Res. 2009, 29, 3867–3875. [Google Scholar] [PubMed]
- Mohanty, C.; Sahoo, S.K. The in vitro stability and in vivo pharmacokinetics of curcumin prepared as an aqueous nanoparticulate formulation. Biomaterials 2010, 31, 6597–6611. [Google Scholar] [CrossRef] [PubMed]
- Loo, C.Y.; Rohanizadeh, R.; Young, P.M.; Traini, D.; Cavaliere, R.; Whitchurch, C.B.; Lee, W.H. Combination of silver nanoparticles and curcumin nanoparticles for enhanced anti-biofilm activities. J. Agric. Food Chem. 2016, 64, 2513–2522. [Google Scholar] [CrossRef] [PubMed]
- Maghsoudi, A.; Yazdian, F.; Shahmoradi, S.; Ghaderi, L.; Hemati, M.; Amoabediny, G. Curcumin-loaded polysaccharide nanoparticles: Optimization and anticariogenic activity against Streptococcus mutans. Mater. Sci. Eng. C Mater. Biol. Appl. 2017, 75, 1259–1267. [Google Scholar] [CrossRef] [PubMed]
- Al-Fattani, M.A.; Douglas, L.J. Biofilm matrix of Candida albicans and Candida tropicalis: Chemical composition and role in drug resistance. J. Med. Microbiol. 2006, 55, 999–1008. [Google Scholar] [CrossRef] [PubMed]
- Ruiz-Herrera, J.; Elorza, M.V.; Valentín, E.; Sentandreu, R. Molecular organization of the cell wall of Candida albicans and its relation to pathogenicity. FEMS Yeast Res. 2006, 6, 14–29. [Google Scholar] [CrossRef] [PubMed]
- Lambrechts, S.A.; Aalders, M.C.; Van Marle, J. Mechanistic study of the photodynamic inactivation of Candida albicans by a cationic porphyrin. Antimicrob. Agents Chemother. 2005, 49, 2026–2034. [Google Scholar] [CrossRef] [PubMed]
- Ribeiro, A.P.; Andrade, M.C.; da Silva Jde, F.; Jorge, J.H.; Primo, F.L.; Tedesco, A.C.; Pavarina, A.C. Photodynamic inactivation of planktonic cultures and biofilms of Candida albicans mediated by aluminum-chloride-phthalocyanine entrapped in nanoemulsions. Photochem. Photobiol. 2013, 89, 111–119. [Google Scholar] [CrossRef] [PubMed]
- Salton, M.R. The adsorption of cetyltrimethylammonium bromide by bacteria, its action in releasing cellular constituents and its bactericidal effects. J. Gen. Microbiol. 1951, 5, 391–404. [Google Scholar] [CrossRef] [PubMed]
- Cieplik, F.; Tabenski, L.; Buchalla, W.; Maisch, T. Antimicrobial photodynamic therapy for inactivation of biofilms formed by oral key pathogens. Front. Microbiol. 2014, 5, 405. [Google Scholar] [CrossRef] [PubMed]
- Mima, E.G.; Vergani, C.E.; Machado, A.L.; Massucato, E.M.; Colombo, A.L.; Bagnato, V.S.; Pavarina, A.C. Comparison of Photodynamic Therapy versus conventional antifungal therapy for the treatment of denture stomatitis: A randomized clinical trial. Clin. Microbiol. Infect. 2012, 18, E380–E388. [Google Scholar] [CrossRef] [PubMed]
- Gong, C.; Wu, Q.; Wang, Y.; Zhang, D.; Luo, F.; Zhao, X.; Wei, Y.; Qian, Z. A biodegradable hydrogel system containing curcumin encapsulated in micelles for cutaneous wound healing. Biomaterials 2013, 34, 6377–6387. [Google Scholar] [CrossRef] [PubMed]
- Rivarola de Gutierrez, E.; Innocenti, A.C.; Cippitelli, M.J.; Salomón, S.; Vargas-Roig, L.M. Determination of cytokeratins 1, 13 and 14 in oral lichen planus. Med. Oral Patol. Oral Cir. Bucal 2014, 19, e359–e365. [Google Scholar] [CrossRef] [PubMed]
- Jacques, C.M.; Pereira, A.L.; Maia, V.; Cuzzi, T.; Ramos-e-Silva, M. Expression of cytokeratins 10, 13, 14 and 19 in oral lichen planus. J. Oral Sci. 2009, 51, 355–365. [Google Scholar] [CrossRef] [PubMed]
- Dos Santos, J.N.; de Sousa, S.O.; Nunes, F.D.; Sotto, M.N.; de Araújo, V.C. Altered cytokeratin expression in actinic cheilitis. J. Cutan. Pathol. 2003, 30, 237–241. [Google Scholar] [CrossRef] [PubMed]
- Kaminagakura, E.; Bonan, P.R.; Lopes, M.A.; Almeida, O.P.; Scully, C. Cytokeratin expression in pseudoepitheliomatous hyperplasia of oral paracoccidioidomycosis. Med. Mycol. 2006, 44, 399–404. [Google Scholar] [CrossRef] [PubMed]
- Lam, M.; Jou, P.C.; Lattif, A.A.; Lee, Y.; Malbasa, C.L.; Mukherjee, P.K.; Oleinick, N.L.; Ghannoum, M.A.; Cooper, K.D.; Baron, E.D. Photodynamic therapy with Pc 4 induces apoptosis of Candida albicans. Photochem. Photobiol. 2011, 87, 904–909. [Google Scholar] [CrossRef] [PubMed]
- Buytaert, E.; Dewaele, M.; Agostinis, P. Molecular effectors of multiple cell death pathways initiated by photodynamic therapy. Biochim. Biophys. Acta 2007, 1776, 86–107. [Google Scholar]
- Xu, Y.; Young, M.J.; Battaglino, R.A.; Morse, L.R.; Fontana, C.R.; Pagonis, T.C.; Kent, R.; Soukos, N.S. Endodontic antimicrobial photodynamic therapy: Safety assessment in mammalian cell cultures. J. Endod. 2009, 35, 1567–1572. [Google Scholar] [CrossRef] [PubMed]
- Maisch, T.; Bosl, C.; Szeimies, R.M.; Love, B.; Abels, C. Determination of the antibacterial efficacy of a new porphyrin-based photosensitizer against MRSA ex vivo. Photochem. Photobiol. Sci. 2007, 6, 545–551. [Google Scholar] [CrossRef] [PubMed]
- Dai, T.; Gupta, A.; Huang, Y.Y.; Yin, R.; Murray, C.K.; Vrahas, M.S.; Sherwood, M.E.; Tegos, G.P.; Hamblin, M.R. Blue light rescues mice from potentially fatal Pseudomonas aeruginosa burn infection: Efficacy, safety, and mechanism of action. Antimicrob. Agents Chemother. 2013, 57, 1238–1245. [Google Scholar] [CrossRef] [PubMed]
- Zhang, Y.; Zhu, Y.; Gupta, A.; Huang, Y.; Murray, C.K.; Vrahas, M.S.; Sherwood, M.E.; Baer, D.G.; Hamblin, M.R.; Dai, T. Antimicrobial blue light therapy for multidrug-resistant Acinetobacter baumannii infection in a mouse burn model: Implications for prophylaxis and treatment of combat-related wound infections. J. Infect. Dis. 2014, 209, 1963–1971. [Google Scholar] [CrossRef] [PubMed]
- Dongari-Bagtzoglou, A.; Fidel, P.L., Jr. The host cytokine responses and protective immunity in oropharyngeal candidiasis. J. Dent. Res. 2005, 84, 966–977. [Google Scholar] [CrossRef] [PubMed]
- Steele, C.; Fidel, P.L., Jr. Cytokine and chemokine production by human oral and vaginal epithelial cells in response to Candida albicans. Infect. Immun. 2002, 70, 577–583. [Google Scholar] [CrossRef] [PubMed]
- Conti, H.R.; Gaffen, S.L. Host responses to Candida albicans: Th17 cells and mucosal candidiasis. Microbes Infect. 2010, 12, 518–527. [Google Scholar] [CrossRef] [PubMed]
- Richardson, J.P.; Moyes, D.L. Adaptive immune responses to Candida albicans infection. Virulence 2015, 6, 327–337. [Google Scholar] [CrossRef] [PubMed]
- De Oliveira, R.R.; Schwartz-Filho, H.O.; Novaes, A.B.; Garlet, G.P.; de Souza, R.F.; Taba, M.; Scombatti de Souza, S.L.; Ribeiro, F.J. Antimicrobial photodynamic therapy in the non-surgical treatment of aggressive periodontitis: Cytokine profile in gingival crevicular fluid, preliminary results. J. Periodontol. 2009, 80, 98–105. [Google Scholar] [CrossRef] [PubMed]
- De Oliveira, R.R.; Novaes, A.B., Jr.; Garlet, G.P.; de Souza, R.F.; Taba, M., Jr.; Sato, S.; de Souza, S.L.; Palioto, D.B.; Grisi, M.F.; Feres, M. The effect of a single episode of antimicrobial photodynamic therapy in the treatment of experimental periodontitis. Microbiological profile and cytokine pattern in the dog mandible. Lasers Med. Sci. 2011, 26, 359–367. [Google Scholar] [CrossRef] [PubMed]
- Zou, W.; Liu, C.; Chen, Z.; Zhang, N. Preparation and characterization of cationic PLA-PEG nanoparticles for delivery of plasmid DNA. Nanoscale Res. Lett. 2009, 4, 982–992. [Google Scholar] [CrossRef] [PubMed]
- Takakura, N.; Sato, Y.; Ishibashi, H.; Oshima, H.; Uchida, K.; Yamaguchi, H.; Abe, S. A novel murine model of oral candidiasis with local symptoms characteristic of oral thrush. Microbiol. Immunol. 2003, 47, 321–326. [Google Scholar] [CrossRef] [PubMed]
- Mima, E.G.; Pavarina, A.C.; Dovigo, L.N.; Vergani, C.E.; Costa, C.A.; Kurachi, C.; Bagnato, V.S. Susceptibility of Candida albicans to photodynamic therapy in a murine model of oral candidosis. Oral Surg. Oral Med. Oral Pathol. Oral Radiol. Endod. 2010, 109, 392–401. [Google Scholar] [CrossRef] [PubMed]
- Zhang, G.; Chen, Y.; BilalWaqar, A.; Han, L.; Jia, M.; Xu, C.; Yu, Q. Quantitative analysis of rabbit coronary atherosclerosis. Practical techniques utilizing open-source software. Anal. Quant. Cytopathol. Histpathol. 2015, 37, 115–122. [Google Scholar] [PubMed]
- Jensen, E.C. Quantitative analysis of histological staining and fluorescence using ImageJ. Anat. Rec. (Hoboken) 2013, 296, 378–381. [Google Scholar] [CrossRef] [PubMed]
Sample Availability: Samples of the compounds are not available from the authors. |


| Size (nm) | PDI | Zeta Potential (mV) | |
|---|---|---|---|
| Anionic CUR-NP | 225 (±60.38) | 0.15 (± 0.06) | −30 (±12.58) |
| Cationic CUR-NP | 248 (±86.39) | 0.21 (± 0.09) | +35 (±7.23) |
| Anionic NP | 193 (±17.95) | 0.15 (± 0.05) | −32 (±11.86) |
| Cationic NP | 186 (±14.97) | 0.14 (± 0.04) | +33 (±2.69) |
© 2018 by the authors. Licensee MDPI, Basel, Switzerland. This article is an open access article distributed under the terms and conditions of the Creative Commons Attribution (CC BY) license (http://creativecommons.org/licenses/by/4.0/).
Share and Cite
Sakima, V.T.; Barbugli, P.A.; Cerri, P.S.; Chorilli, M.; Carmello, J.C.; Pavarina, A.C.; Mima, E.G.d.O. Antimicrobial Photodynamic Therapy Mediated by Curcumin-Loaded Polymeric Nanoparticles in a Murine Model of Oral Candidiasis. Molecules 2018, 23, 2075. https://doi.org/10.3390/molecules23082075
Sakima VT, Barbugli PA, Cerri PS, Chorilli M, Carmello JC, Pavarina AC, Mima EGdO. Antimicrobial Photodynamic Therapy Mediated by Curcumin-Loaded Polymeric Nanoparticles in a Murine Model of Oral Candidiasis. Molecules. 2018; 23(8):2075. https://doi.org/10.3390/molecules23082075
Chicago/Turabian StyleSakima, Vinicius Tatsuyuji, Paula Aboud Barbugli, Paulo Sérgio Cerri, Marlus Chorilli, Juliana Cabrini Carmello, Ana Cláudia Pavarina, and Ewerton Garcia de Oliveira Mima. 2018. "Antimicrobial Photodynamic Therapy Mediated by Curcumin-Loaded Polymeric Nanoparticles in a Murine Model of Oral Candidiasis" Molecules 23, no. 8: 2075. https://doi.org/10.3390/molecules23082075
APA StyleSakima, V. T., Barbugli, P. A., Cerri, P. S., Chorilli, M., Carmello, J. C., Pavarina, A. C., & Mima, E. G. d. O. (2018). Antimicrobial Photodynamic Therapy Mediated by Curcumin-Loaded Polymeric Nanoparticles in a Murine Model of Oral Candidiasis. Molecules, 23(8), 2075. https://doi.org/10.3390/molecules23082075