Linking Temperature, Cation Concentration and Water Activity for the B to Z Conformational Transition in DNA

Abstract
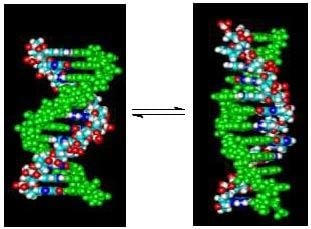
1. Introduction
2. Results and Discussion
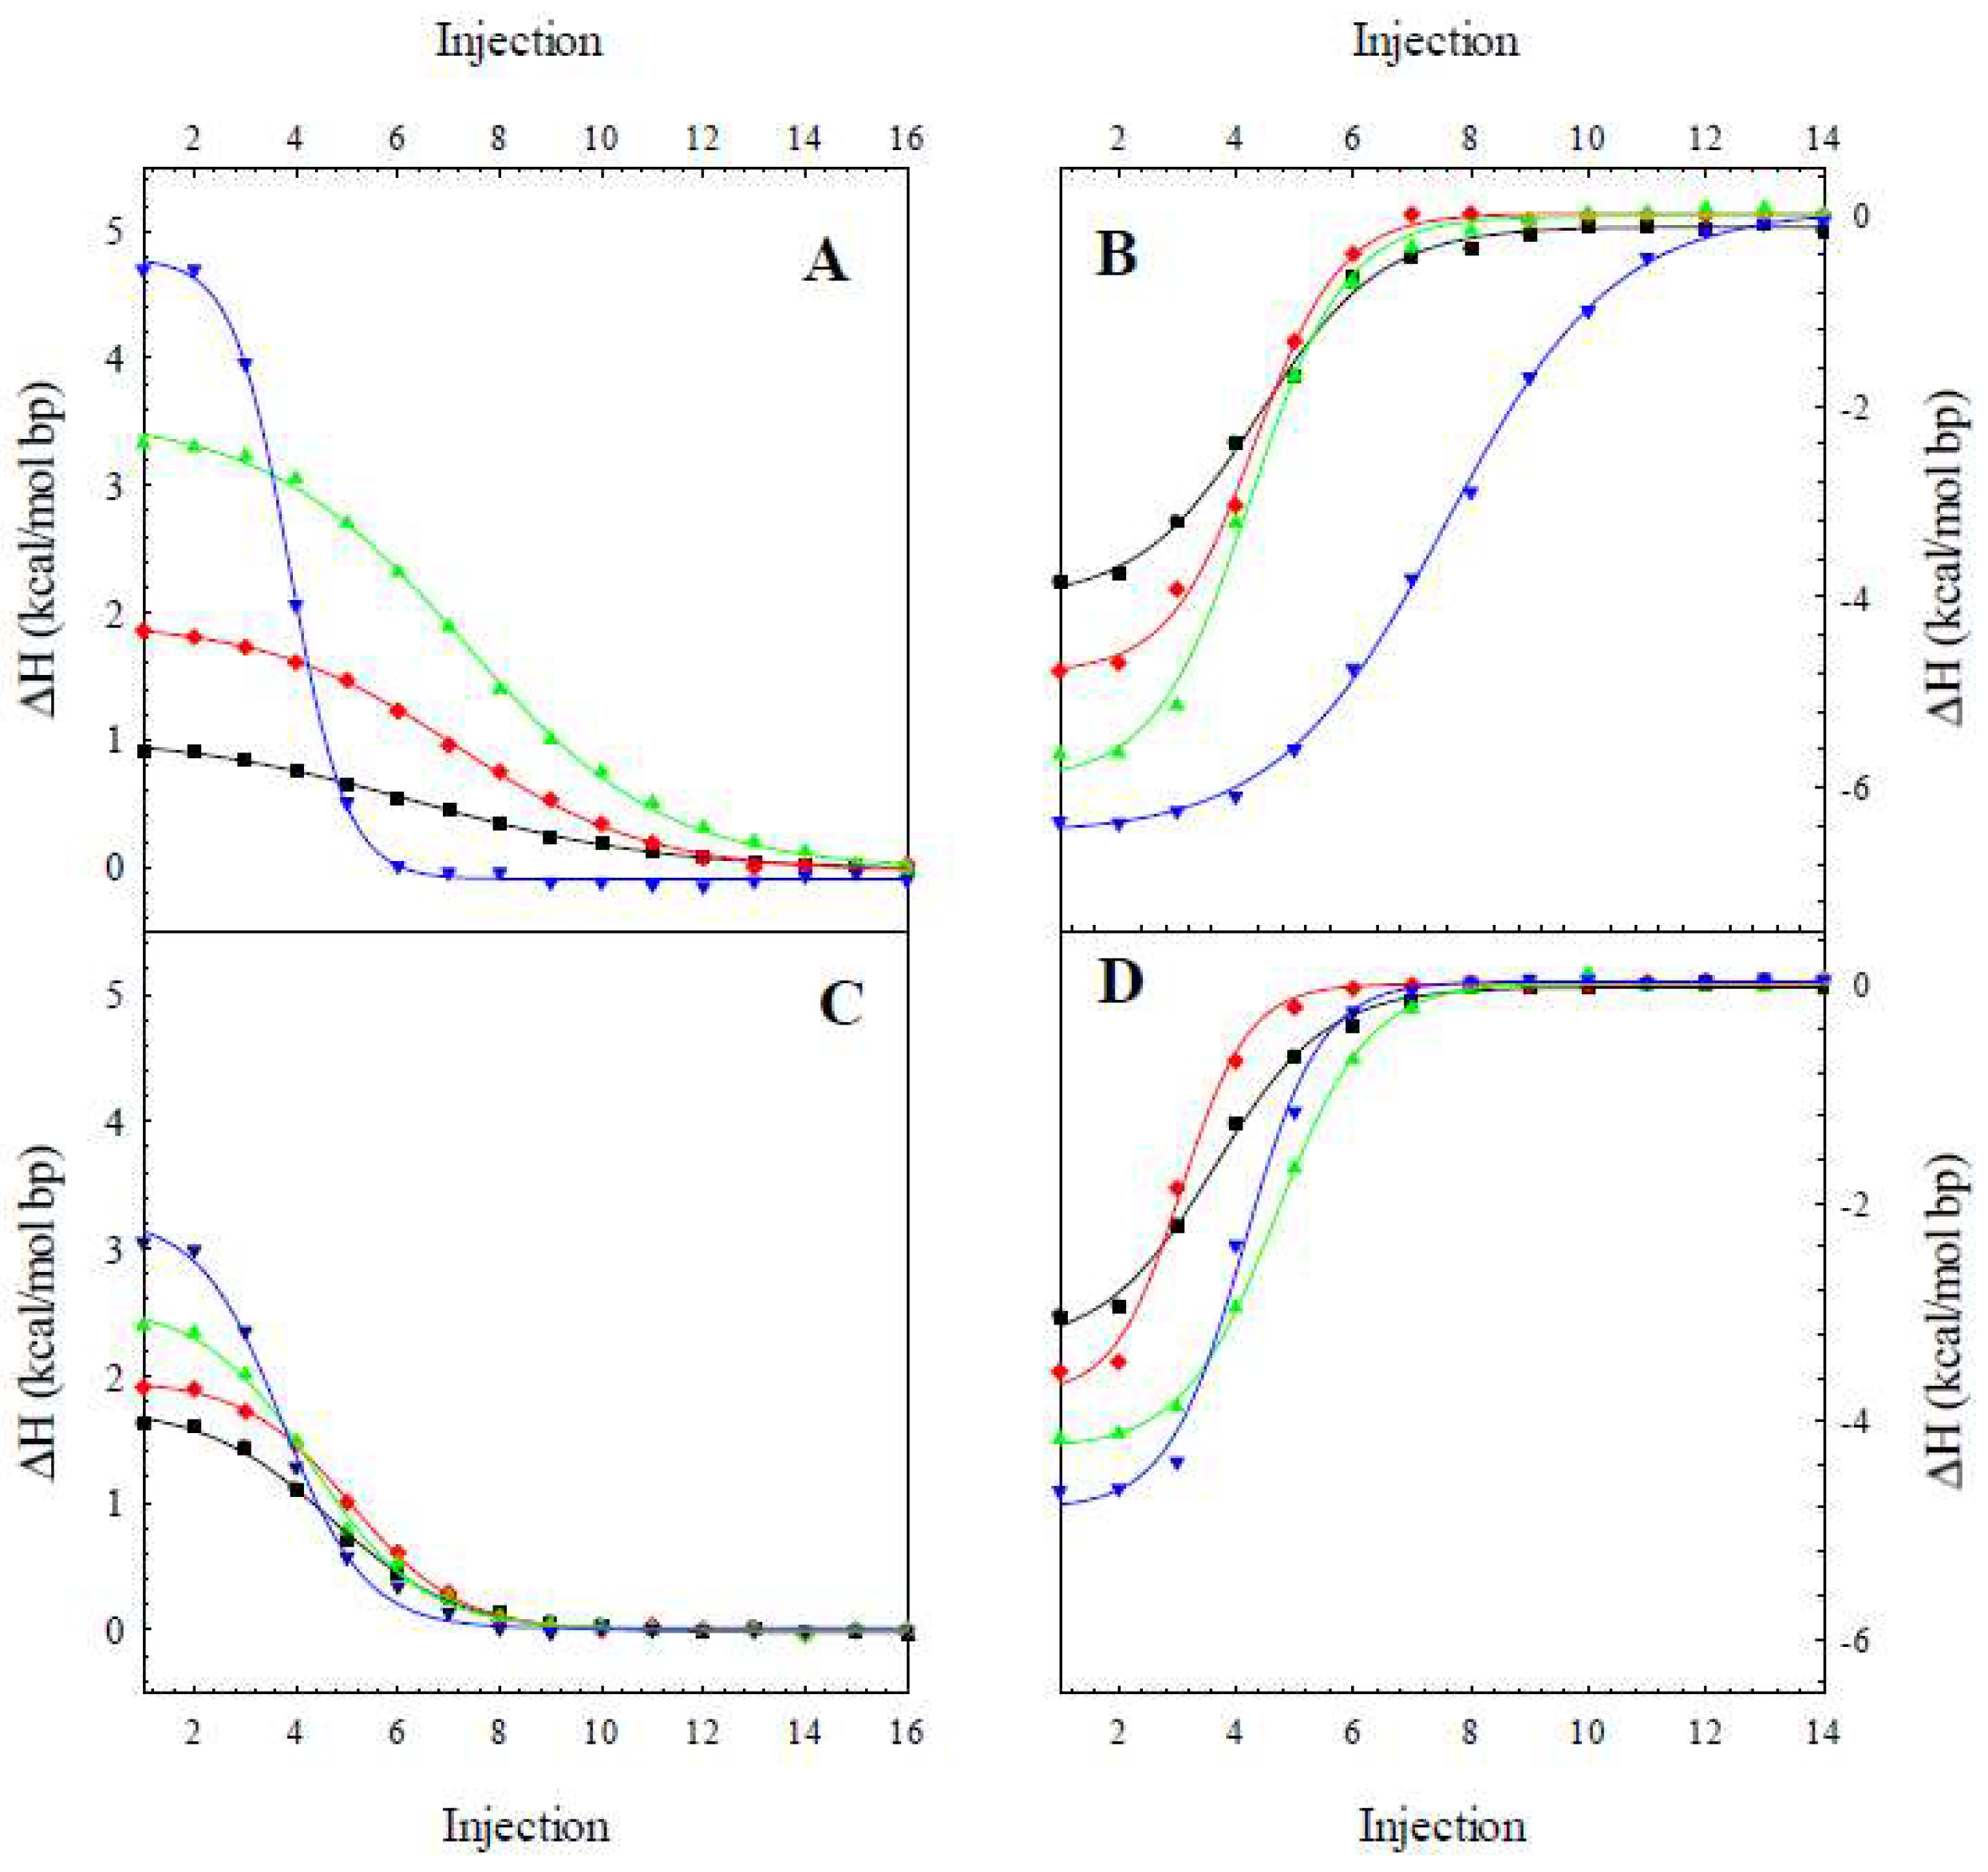
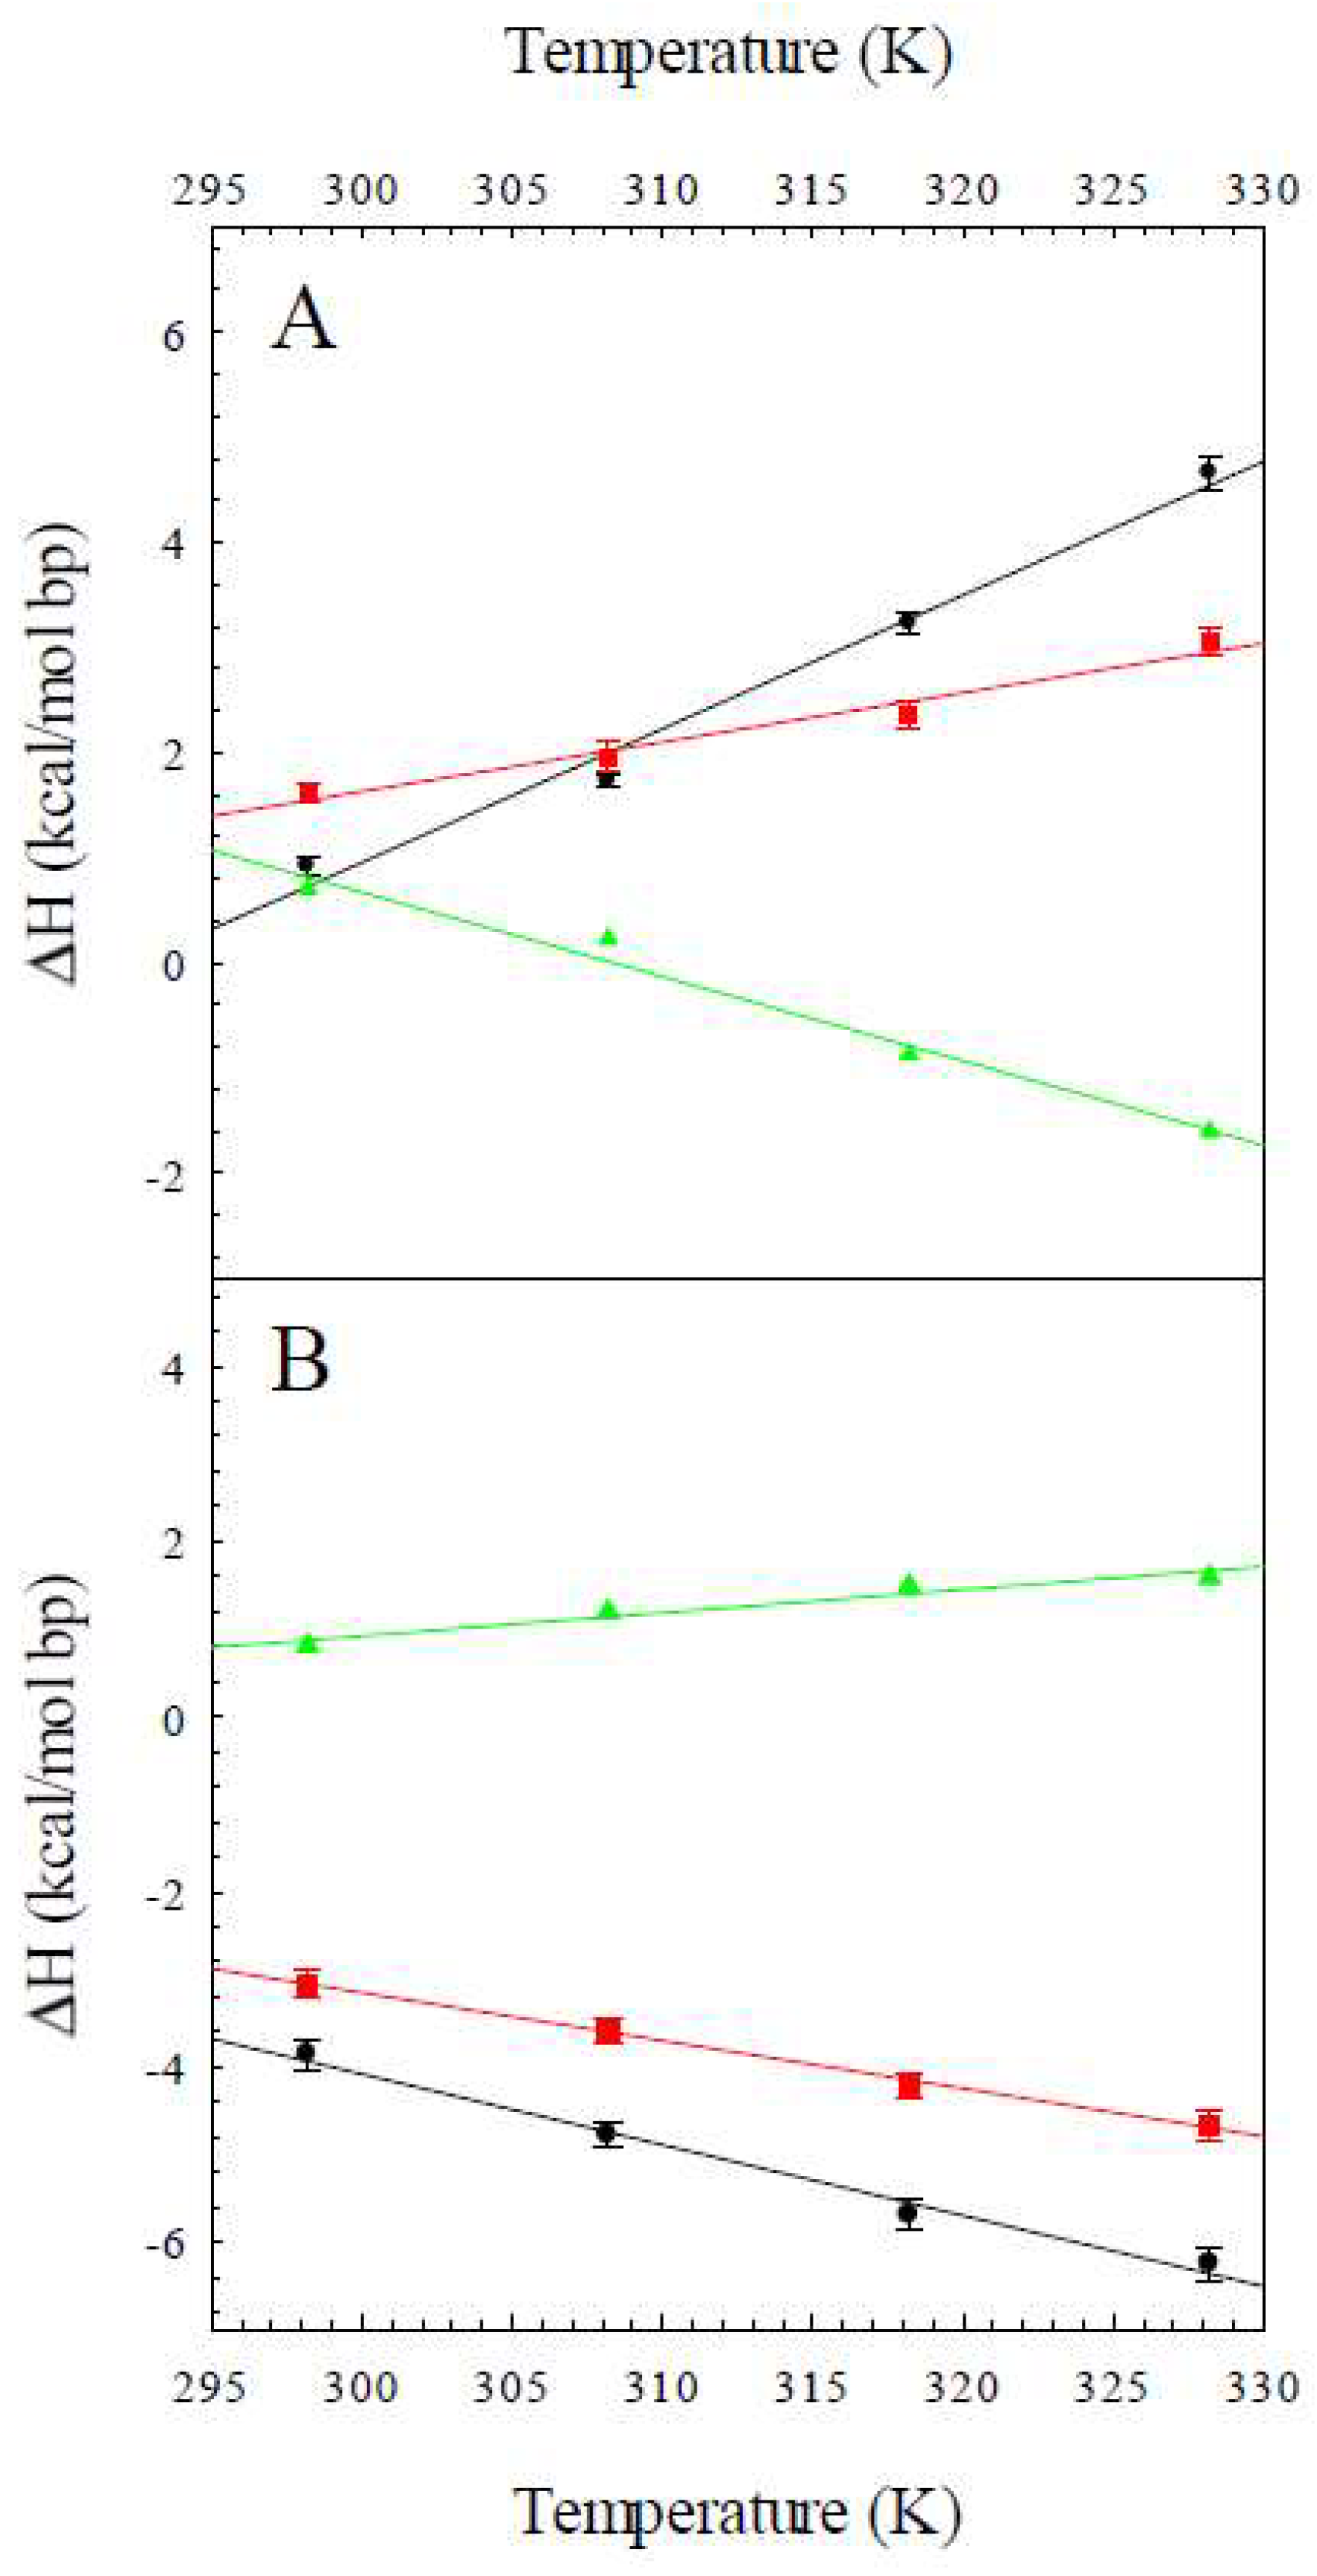
2.1. The Enthalpy of the B to Z Transition
2.2. The Heat Capacity Change for the B to Z Transition
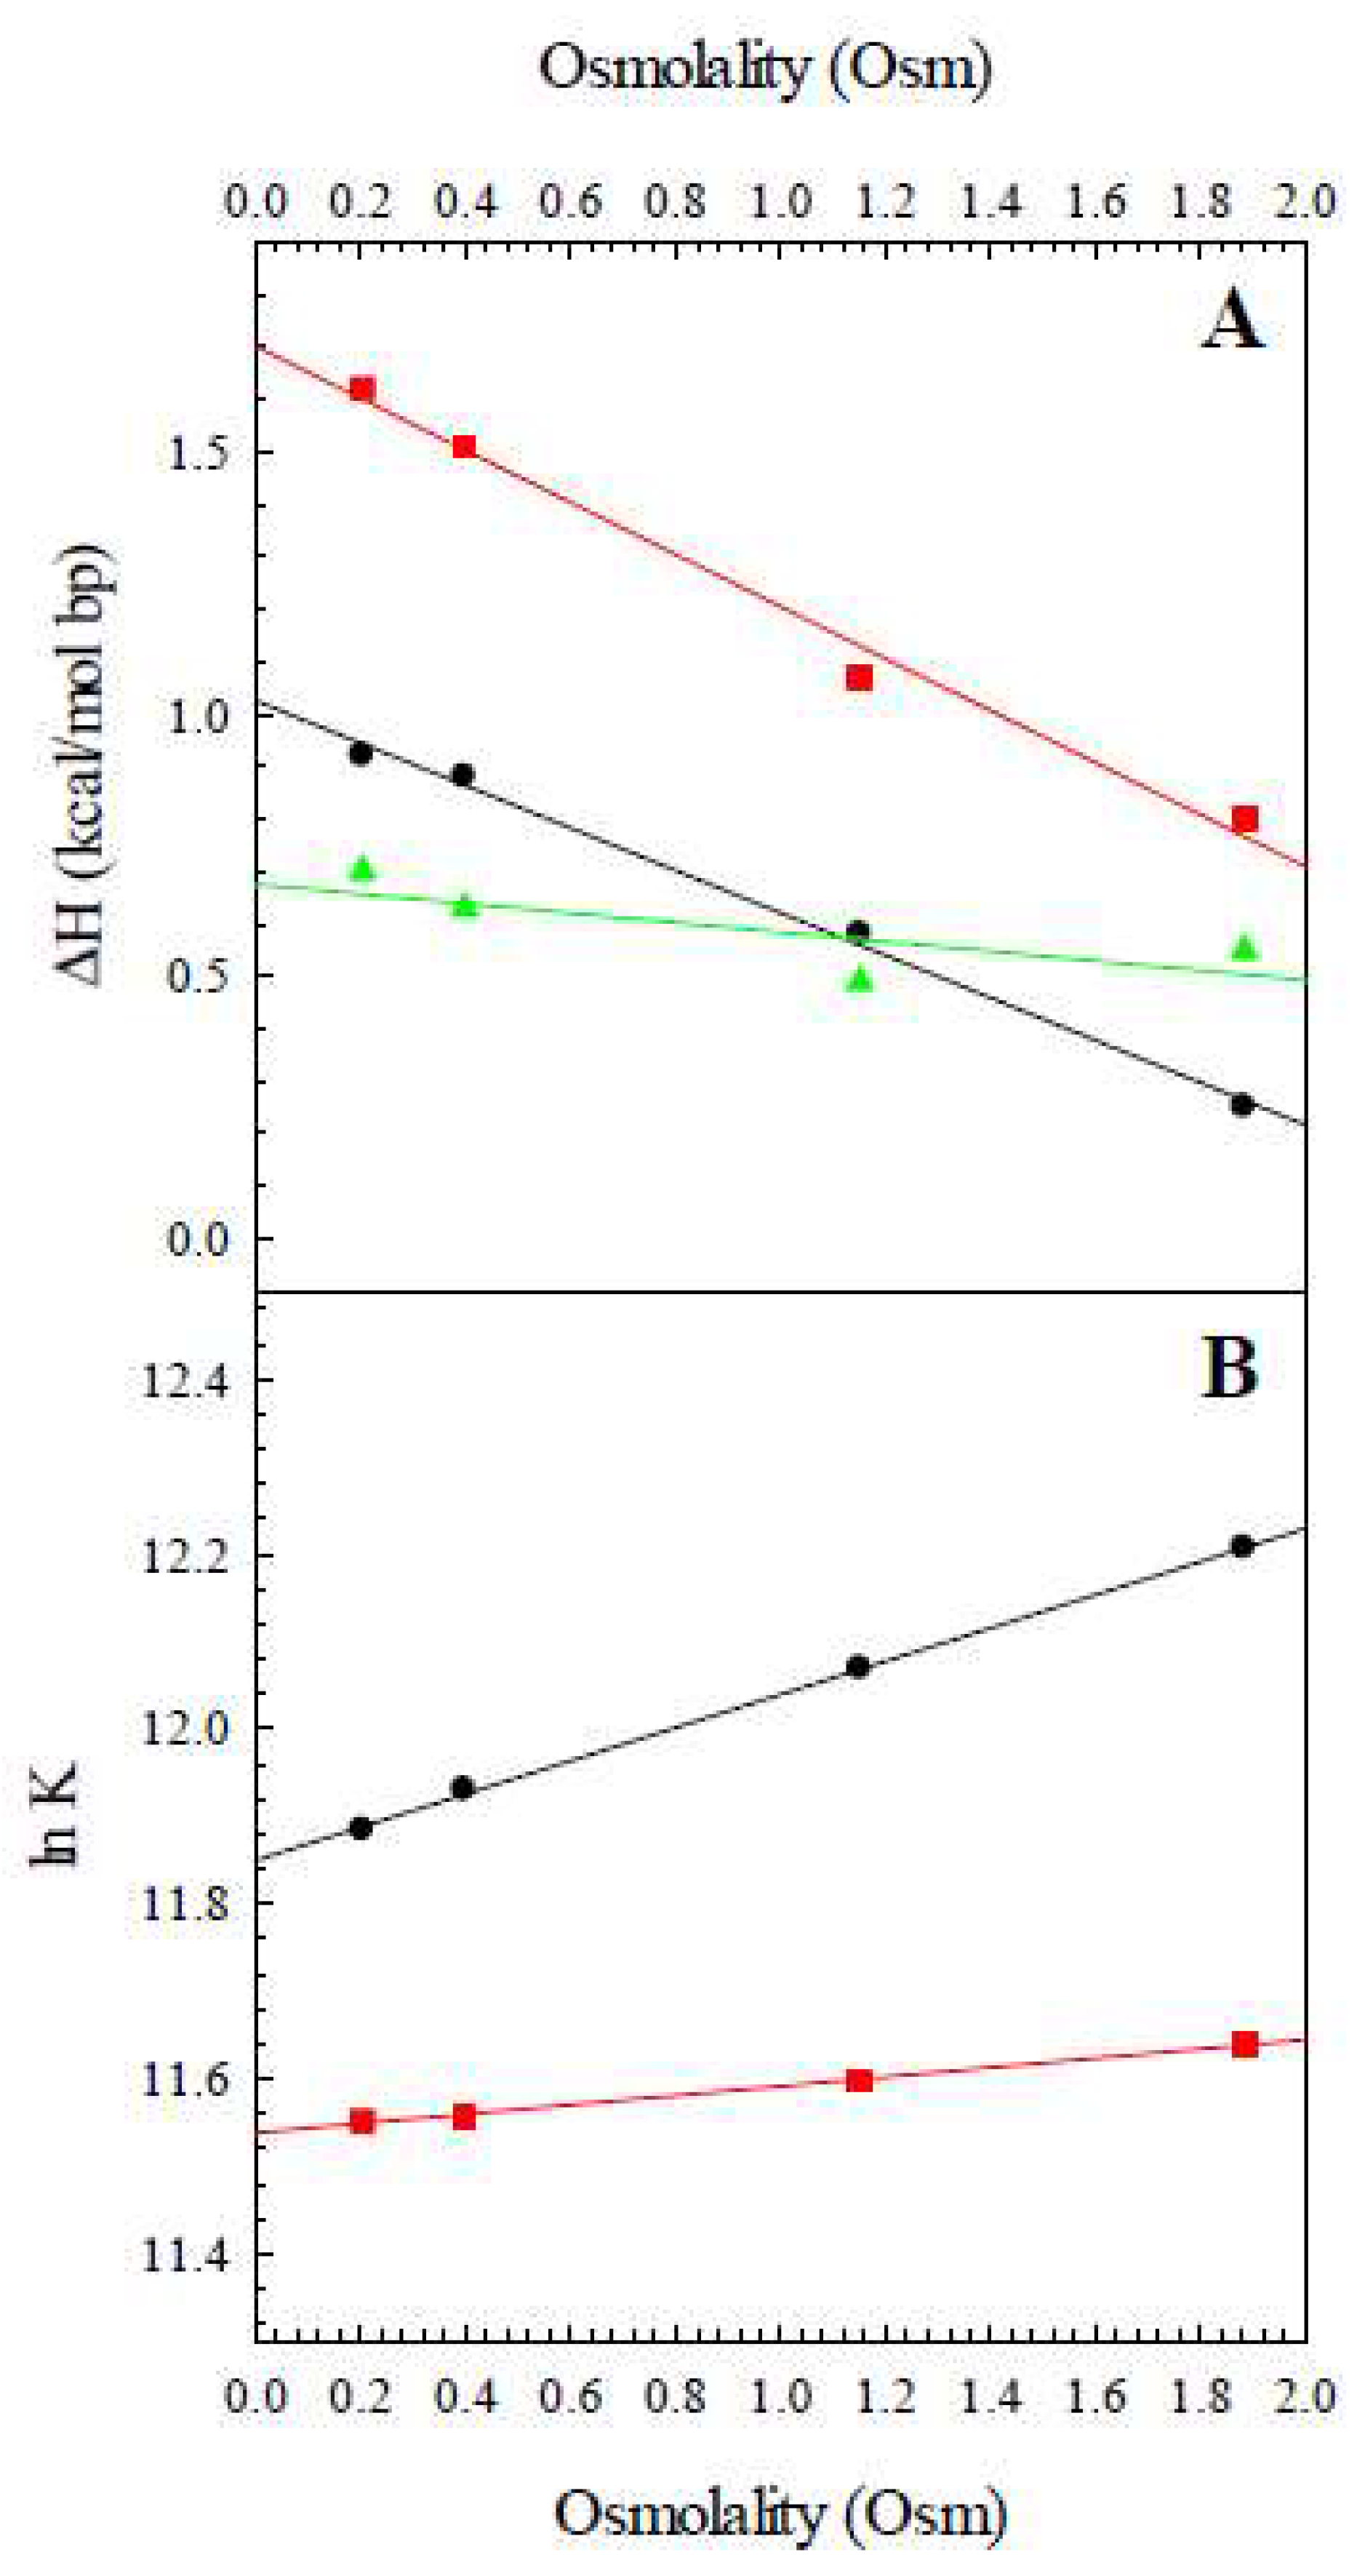
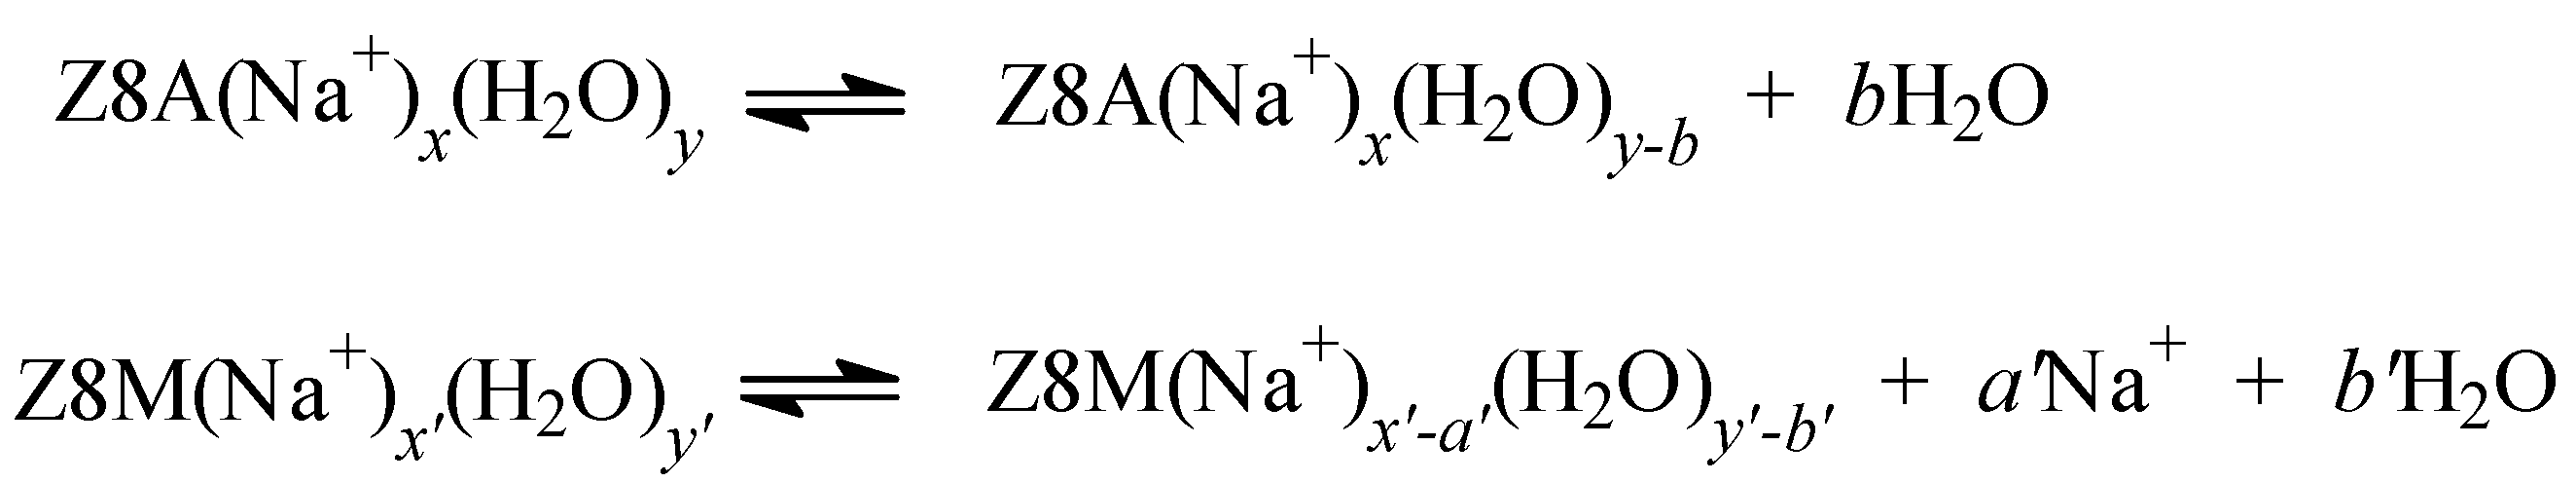
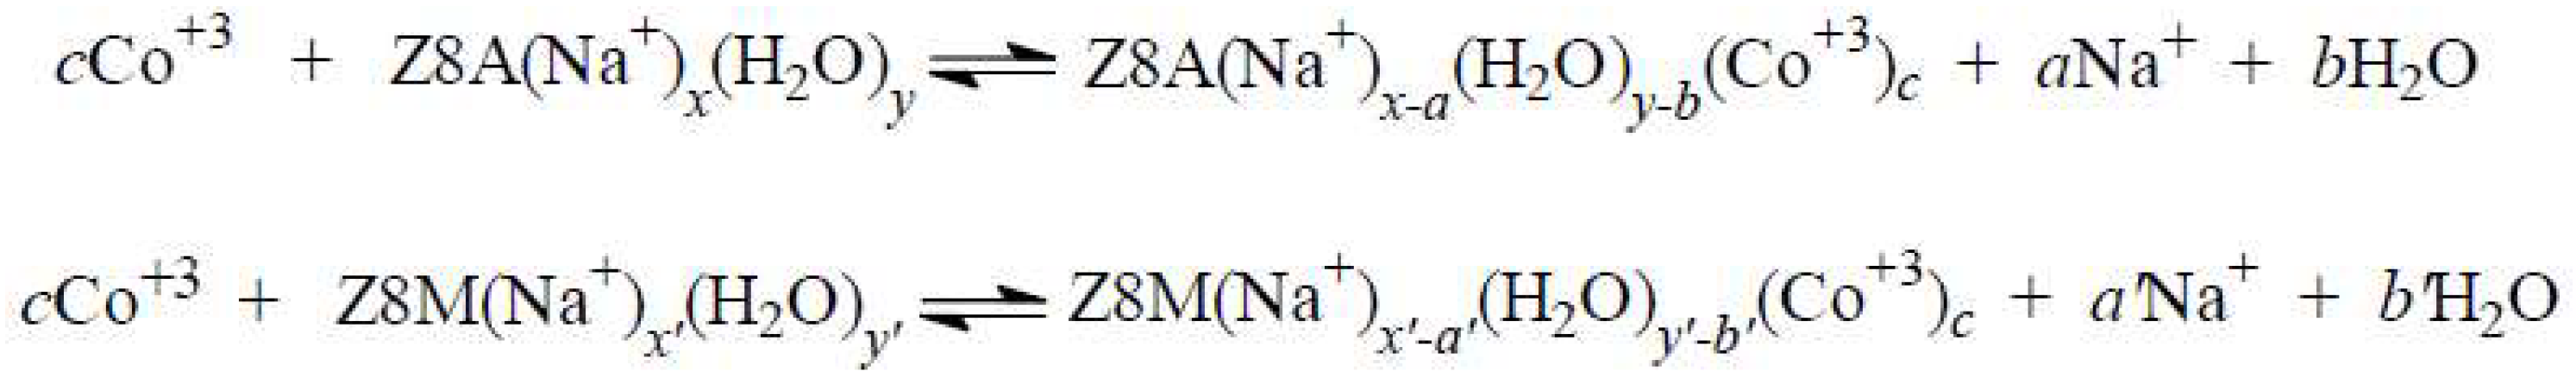
2.3. The Release of Water
3. Experimental Section
3.1. Oligomer Design, Synthesis and Preparation
3.2. Isothermal Titration Calorimetry
3.3. Osmotic Stress Experiments
4. Summary
Author Contributions
Funding
Conflicts of Interest
References
- Watson, J.D.; Crick, F.H.C. Molecular Structure of Nucleic Acids—A Structure for Deoxyribose Nucleic Acid. Nature 1953, 171, 737–738. [Google Scholar] [CrossRef] [PubMed]
- Pohl, F.M.; Jovin, T.M. Salt-Induced Co-Operative Conformational Change of Synthetic DNA: Equilibrium and Kinetic Studies with Poly(dG-dC). J. Mol. Biol. 1972, 67, 375–396. [Google Scholar] [CrossRef]
- Wang, A.J.-H.; Quigley, G.J.; Kolpak, F.J.; Crawford, J.L.; van Boom, J.H.; van der Marel, G.; Rich, A. Molecular Structure of a Left-Handed Double Helical DNA Fragment at Atomic Resolution. Nature 1979, 282, 680–686. [Google Scholar] [CrossRef] [PubMed]
- Behe, M.; Felsenfeld, G. Effects of Methylation on a Synthetic Polynucleotide: The B-Z Transition in Poly(dG-m5dC)·poly(dG-m5dC). Proc. Natl. Acad. Sci. USA 1981, 78, 1619–1623. [Google Scholar] [CrossRef] [PubMed]
- Jiang, H.; Zacharias, W.; Amirhaeri, S. Potassium permanganate as a in situ probe for B-Z and Z-Z junctions. Nucleic Acid Res. 1991, 19, 6943–6948. [Google Scholar] [CrossRef] [PubMed]
- McLean, M.J.; Wells, R.D. The Roles of Sequence in the Stabilization of Left-handed DNA Helices in vitro and in vivo. Biohim. Biophys. Acta 1988, 950, 243–254. [Google Scholar] [CrossRef]
- Paleček, E. Local Supercoiled Stabilized DNA Structures. CRC Crit. Rev. Biochem. 1991, 26, 151–226. [Google Scholar] [CrossRef] [PubMed]
- Lafer, E.M.; Möller, A.; Nordheim, A.; Stoller, B.D.; Rich, A. Antibodies Specific for Left-handed Z-DNA. Proc. Natl. Acad. Sci. USA 1981, 78, 3546–3550. [Google Scholar] [CrossRef] [PubMed]
- Krishna, P.; Kennedy, B.P.; Waisman, D.M.; van de Sande, J.H.; McGhee, J.D. Are Many Z-DNA Binding P roteins Actually Phospholipid-Binding Proteins? Proc. Natl. Acad. Sci. USA 1990, 87, 1292–1295. [Google Scholar] [CrossRef] [PubMed]
- Herbert, A.; Rich, A. The Biology of Left-Handed Z-DNA. J. Biol. Chem. 1996, 271, 11595–11598. [Google Scholar] [CrossRef] [PubMed]
- Chaires, J.B.; Sturtevant, J.M. Thermodynamics of the B to Z Transition in Poly(m5dG-dC). Proc. Natl. Acad. Sci. USA 1986, 83, 5479–5483. [Google Scholar] [CrossRef] [PubMed]
- Chaires, J.B.; Sturtevant, J.M. Thermodynamics of the B to Z Transition in Poly(dG-dC). Biopolymers 1988, 27, 1375–1387. [Google Scholar] [CrossRef] [PubMed]
- Klump, H.H.; Schmid, E.; Wosgien, M. Energetics of Z-DNA Formation in Poly d(A-T), Poly d(G-C) and Poly d(A-C) Poly d(G-C). Nucleic Acids Res. 1993, 21, 2343–2348. [Google Scholar] [CrossRef] [PubMed]
- Ferreira, J.M.; Sheardy, R.D. The Enthalpy of the B to Z Conformational Transition of a DNA Oligonucleotide Determined by Isothermal Titration Calorimetry. Biophys. J. 2006, 91, 3383–3389. [Google Scholar] [CrossRef] [PubMed]
- Lee, J.; Kim, Y.-G.; Kim, K.K.; Seok, C. Transition between B-DNA and Z-DNA: Free energy lanscape for the B to Z transition. J. Phys. Chem. B 2010, 114, 9872–9881. [Google Scholar] [CrossRef] [PubMed]
- Manzini, G.; Xodo, L.E.; Quadrifoglio, F.; van Boom, J.H.; van der Marel, G.A. dC-dG Alternating Oligonucleotides: Thermodynamic and Kinetic Aspects of the B-Z Transition. J. Biomol. Struct. Dyn. 1987, 4, 651–662. [Google Scholar] [CrossRef] [PubMed]
- Tran-Dinh, S.; Taboury, J.; Neumann, J.-M.; Huynh-Dinh, T.; Genissel, B.; Langlois d’Estaintot, B.; Igolen, J. 1H NMR and Circular Dichroism Studies of the B and Z Conformations of the Self-Complementary Deoxyhexanucleotide d(m5C-G-C-G-m5C-G): Mechanism of the Z-B-Coil Transitions. Biochemistry 1984, 23, 1362–1371. [Google Scholar] [CrossRef] [PubMed]
- Sheardy, R.D.; Suh, D.; Kurzinsky, R.; Dotycz, M.J.; Benight, A.S.; Chaires, J.B. Sequence Dependence of the Free Energy of BZ Junction Formation in Deoxyoligonucleotides. J. Mol. Biol. 1993, 231, 475–488. [Google Scholar] [CrossRef] [PubMed]
- Klump, H.H. Thermodynamics of Left-Handed Helix Formation. FEBS Lett. 1986, 196, 175–196. [Google Scholar] [CrossRef]
- O’Connor, T.R.; Kang, D.S.; Wells, R.D. Thermodynamic Parameters Are Sequence Dependent for the Supercoil Induced B to Z Transition in Recombinant Plasmids. J. Biol. Chem. 1986, 261, 13302–13308. [Google Scholar] [PubMed]
- Feigon, J.; Wang, A.H.-J.; van der Marel, G.A.; van Boom, J.H.; Rich, A. A One- and Two-Dimensional NMR Study of the B to Z Transition of (m5dC-dG)3 in Methanolic Solution. Nucleic Acids Res. 1984, 12, 1243–1263. [Google Scholar] [CrossRef] [PubMed]
- Gessner, R.V.; Quigley, G.J.; Wang, A.H.-J.; van der Marel, G.A.; van Boom, J.H.; Rich, A. Structural Basis for Stabilization of Z-DNA by Cobalt Hexammine and Magnesium Cations. Biochemistry 1985, 24, 237–240. [Google Scholar] [CrossRef] [PubMed]
- Braulin, W.H.; Anderson, C.F.; Record, M.T., Jr. Competitive Interactions of Co(NH3)63+ and Na+ with Helical B-DNA Probed by 59Co and 23Na NMR. Biochemistry 1987, 26, 7724–7731. [Google Scholar] [CrossRef]
- Braulin, W.H.; Xu, Q. Hexamminecobalt (III) Binding Environments on Double-Helical DNA. Biopolymers 1992, 32, 1703–1711. [Google Scholar] [CrossRef] [PubMed]
- Rouzina, I.; Bloomfiled, V.A. Heat Capacity Effects on the Melting of DNA: 1. General Aspects. Biophys. J. 1999, 77, 3242–3251. [Google Scholar] [CrossRef]
- Tikhomirova, A.; Taulier, N.; Chalikian, T.V. Energetics of Nucleic Acid Stabilty: The Effect of ΔCp. J. Am. Chem. Soc. 2004, 126, 16387–16394. [Google Scholar] [CrossRef] [PubMed]
- Holbrook, J.A.; Capp, M.W.; Saecker, R.M.; Record, M.T., Jr. Enthalpy and Heat Capacity Changes for Formation of an Oligomeric DNA Duplex: Interpretation in Terms of Coupled Processes of Formation and Assoiciation of Single-Stranded Helices. Biochemistry 1999, 38, 8409–8422. [Google Scholar] [CrossRef] [PubMed]
- Volker, J.; Klump, H.H.; Breslauer, K. The Energetics of i-DNA Tetraplex Structures Formed Intermolecularly by d(TC5) and Intramoleculary by d[(C5T3)3C5]. Biopolymers 2007, 86, 136–147. [Google Scholar] [CrossRef] [PubMed]
- Kagawa, T.F.; Stoddard, D.; Zhou, G.; Ho, P.S. Quantitative Analysis of DNA Secondary Structure from Solvent-Accessible Surfaces: The B- to Z-Transition as a Model. Biochemistry 1989, 28, 6642–6651. [Google Scholar] [CrossRef] [PubMed]
- Takach, J.C.; Mikulecky, P.J.; Feig, A.L. Salt-Dependent Heat Capacity Changes for RNA Formation. J. Am. Chem. Soc. 2004, 126, 6530–6531. [Google Scholar] [CrossRef] [PubMed]
- Bergqvist, S.; Williams, M.A.; O’Brien, R.; Ladbury, J.E. Heat Capacity Effects of Water Molecules and Ions at a Protein-DNA Interface. J. Mol. Biol. 2004, 336, 829–842. [Google Scholar] [CrossRef] [PubMed]
- Lacy, E.R.; Nguyen, M.; Le, B.; Cox, K.K.; O’Hare, C.; Hartley, J.A.; Lee, M.; Wilson, W.D. Energetic Basis for Selective Recognition of T-G Mismatched Base Pairs in DNA by Imidazole-Rich Polyamides. Nucleic Acids Res. 2004, 32, 2000–2007. [Google Scholar] [CrossRef] [PubMed]
- Patel, M.M.; Anchordoguy, T.J. Contribution of Hydrophobicity to Thermodynamics of Ligand-DNA Binding and DNA Collapse. Biophys. J. 2005, 88, 2089–2103. [Google Scholar] [CrossRef] [PubMed]
- Nguyen, B.; Stanek, J.; Wilson, W.D. Binding-Linked Protonation of a DNA Minor-Groove Agent. Biophys. J. 2006, 90, 1319–1328. [Google Scholar] [CrossRef] [PubMed]
- Mikulecky, P.J.; Feig, A.L. Heat Capacity Changes Associated with DNA Duplex Formation: Salt- and Sequence-Dependent Effects. Biochemistry 2006, 45, 604–616. [Google Scholar] [CrossRef] [PubMed]
- Kozlov, A.G.; Lohman, T.M. Effects of Monovalent Anions on a Temperature-Dependent Heat Capacity Change for Escherichia coli SSB Tetramer Binding to Single-Stranded DNA. Biochemistry 2006, 45, 5190–5205. [Google Scholar] [CrossRef] [PubMed]
- Bishop, G.R.; Ren, J.; Polander, B.C.; Jeanifreau, B.D.; Trent, J.O.; Chaires, J.B. Energetic Basis of Molecular Recognition in a DNA Aptamer. Biophys. Chem. 2007, 126, 165–175. [Google Scholar] [CrossRef] [PubMed]
- Freyer, M.W.; Buscaglia, R.; Hollingsworth, A.; Ramos, J.; Blynn, M.; Pratt, R.; Wilson, W.D.; Lewis, E.A. Break in the Heat Capacity Change at 303 K for Complex Binding of Netropsin to AATT Containing Hairpin DNA Constructs. Biophys. J. 2007, 92, 2516–2522. [Google Scholar] [CrossRef] [PubMed]
- Brobnak, I.; Serucnik, M.; Lah, J.; Vesnaver, G. Stability of a Short DNA Duplex as a Function of Temperature: The Effect of ΔCp and Added Salt Concentration. Acta Chimica Slov. 2007, 54, 445–451. [Google Scholar]
- Ho, P.S.; Quigley, G.J.; Tilton, R.F., Jr.; Rich, A. Hydration of Methylated and Unmethylated B-DNA and Z-DNA. J. Phys. Chem. 1988, 97, 939–945. [Google Scholar] [CrossRef]
- Parsegian, V.A.; Rand, R.P.; Rau, D.C. Osmotic Stress, Crowding, Preferential Hydration, and Binding: A Comparison of Perspectives. Proc. Natl. Acad. Sci. USA 2000, 97, 3987–3992. [Google Scholar] [CrossRef] [PubMed]
- Preisler, R.S.; Chen, H.H.; Colombo, M.F.; Choe, Y.; Short, B.J., Jr.; Rau, D.C. The B Form to Z Form Transition of poly(dG-m5dC) Is Sensitive to Neutral Solutes through and Osmotic Stress. Biochemistry 1995, 34, 14400–14407. [Google Scholar] [CrossRef] [PubMed]
- Felitsky, D.J.; Cannon, J.G.; Capp, M.W.; Hong, J.; Van Wynsberghe, A.W.; Anderson, C.F.; Record, M.T., Jr. The Exclusion of Glycine Betaine from Anionic Biopolymer Surface: Why Glycine Betaine Is an Effective Osmoprotectant but Also a Compatible Solute. Biochemistry 2004, 43, 14732–14743. [Google Scholar] [CrossRef] [PubMed]
- Hong, J.; Capp, W.W.; Anderson, C.F.; Saecker, R.M.; Felitsky, D.J.; Anderson, M.W.; Record, M.T., Jr. Preferential Hydration of Glycine Betaine and of Urea with DNA: Implications for DNA Hydration and for Effects of These Solutes on DNA Stability. Biochemistry 2007, 43, 14744–14758. [Google Scholar] [CrossRef] [PubMed]
- Di Cera, E.; Gill, S.J.; Wyman, J. Canonical Formulation of Linkage Thermodynamics. Proc. Natl. Acad. Sci. USA 1988, 85, 5077–5081. [Google Scholar] [CrossRef] [PubMed]
- Spink, C.H.; Chaires, J.B. Effects of Hydration, Ion Release, and Excluded Volume on the Melting of Triplex and Duplex DNA. Biochemistry 1999, 38, 496–508. [Google Scholar] [CrossRef] [PubMed]
- Spink, C.H.; Garbett, N.; Chaires, J.B. Enthalpies of DNA Melting in the Presence of Osmolytes. Biophys. Chem. 2007, 126, 176–185. [Google Scholar] [CrossRef] [PubMed]
- Kaushik, M.; Suehl, N.; Marky, L.A. Calorimetric Unfolding of the Biomolecular and i-Motif Complexes of the Human Telomere Complementary Strand, d(C3TA2)4. Biophys. Chem. 2007, 126, 154–164. [Google Scholar] [CrossRef] [PubMed]
- Nakano, S.-I.; Yamaguchi, D.; Tateishi-Karimata, H.; Miysho, D.; Sugimoto, N. Hydration Changes upon DNA Folding by Osmotic Stress Experiments. Biophys. J. 2012, 102, 2808–2817. [Google Scholar] [CrossRef] [PubMed]
- Son, I.; Shek, Y.L.; Dubins, D.N.; Chalikian, T.V. Hydration Changes Accompanying Helix-to-Coil DNA Transition. J. Am. Chem. Soc. 2014, 136, 4040–4047. [Google Scholar] [CrossRef] [PubMed]
- Sheardy, R.D.; Winkle, S.A. Temperature Dependent CD and NMR Studies on a Synthetic DNA Oligomer Containing a B-Z Junction at High Salt. Biochemistry 1989, 28, 720–725. [Google Scholar] [CrossRef] [PubMed]
- Doktycz, M.J.; Benight, A.S.; Sheardy, R.D. Energetics of B-Z Junction Formation in a Sixteen Base Pair Duplex DNA. J. Mol. Biol. 1990, 212, 3–6. [Google Scholar] [CrossRef]
- Sheardy, R.D.; Levine, N.; Marotta, S.; Suh, D.; Chaires, J.B. A Thermodynamic Investigation of the Melting of B-Z Junction Forming DNA Oligomers. Biochemistry 1994, 33, 1385–1391. [Google Scholar] [CrossRef] [PubMed]
- Calderone, D.M.; Mantilla, E.J.; Hicks, M.; Huchital, D.H.; Murphy, W.R., Jr.; Sheardy, R.D. Binding of Co(III) to a DNA Oligomer Via Reaction of [Co(NH3)5(OH2)]3+ with (5medC-dG)4. Biochemistry 1995, 34, 13841–13846. [Google Scholar] [CrossRef] [PubMed]
- Otokiti, E.O.; Sheardy, R.D. Sequence Effects on the Relative Thermodynamic Stabilities of B-Z Junction Forming DNA Oligomers. Biophys. J. 1997, 73, 3135–3141. [Google Scholar] [CrossRef]
Sample Availability: Samples of the compounds are not available from the authors. |


| T (K) | ΔHobs,Z8A (kcal/mol bp) | ΔHobs,Z8M (kcal/mol bp) | ΔHconf (kcal/mol bp) |
|---|---|---|---|
| Na+ | |||
| 298 | 0.92 ± 0.09 | 1.62 ± 0.09 | 0.70 |
| 308 | 1.73 ± 0.06 | 1.96 ± 0.14 | 0.23 |
| 318 | 3.23 ± 0.11 | 2.35 ± 0.12 | −0.87 |
| 328 | 4.66 ± 0.15 | 3.06 ± 0.14 | −1.6 |
| [Co(NH3)6]3+ | |||
| 298 | −3.85 ± 0.17 | −3.13 ± 0.15 | 0.72 |
| 308 | −4.78 ± 0.13 | −3.58 ± 0.15 | 1.2 |
| 318 | −5.69 ± 0.18 | −4.20 ± 0.15 | 1.5 |
| 328 | −6.25 ± 0.18 | −4.66 ± 0.19 | 1.6 |
| Inducer | Z8A (kcal/K mol bp) | Z8M (kcal/K mol bp) | Z8M–Z8A (kcal/K mol bp) |
|---|---|---|---|
| Na+ | +0.127 | +0.0469 | −0.0802 |
| [Co(NH3)6]3+ | −0.0545 | −0.0808 | +0.0263 |
| Osmolality (Osm) | ΔHobs,Z8A (kcal/K mol bp) | ΔHobs,Z8M (kcal/K mol bp) | ΔHconf (kcal/K mol bp) |
|---|---|---|---|
| 0.20 | 0.92 | 1.62 | 0.70 |
| 0.40 | 0.88 | 1.51 | 0.63 |
| 1.15 | 0.58 | 1.03 | 0.45 |
| 1.88 | 0.23 | 0.82 | 0.59 |
© 2018 by the authors. Licensee MDPI, Basel, Switzerland. This article is an open access article distributed under the terms and conditions of the Creative Commons Attribution (CC BY) license (http://creativecommons.org/licenses/by/4.0/).
Share and Cite
Ferreira, J.M.; Sheardy, R.D. Linking Temperature, Cation Concentration and Water Activity for the B to Z Conformational Transition in DNA. Molecules 2018, 23, 1806. https://doi.org/10.3390/molecules23071806
Ferreira JM, Sheardy RD. Linking Temperature, Cation Concentration and Water Activity for the B to Z Conformational Transition in DNA. Molecules. 2018; 23(7):1806. https://doi.org/10.3390/molecules23071806
Chicago/Turabian StyleFerreira, Jaime M., and Richard D. Sheardy. 2018. "Linking Temperature, Cation Concentration and Water Activity for the B to Z Conformational Transition in DNA" Molecules 23, no. 7: 1806. https://doi.org/10.3390/molecules23071806
APA StyleFerreira, J. M., & Sheardy, R. D. (2018). Linking Temperature, Cation Concentration and Water Activity for the B to Z Conformational Transition in DNA. Molecules, 23(7), 1806. https://doi.org/10.3390/molecules23071806