
Determination of Ten Macrolide Drugs in Environmental Water Using Molecularly Imprinted Solid-Phase Extraction Coupled with Liquid Chromatography-Tandem Mass Spectrometry


Abstract
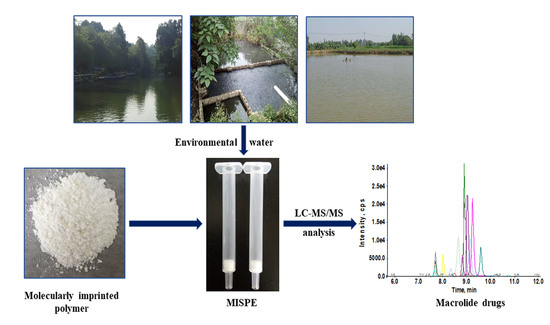
1. Introduction
2. Results and Discussion
2.1. Optimization of the MISPE Cartridge
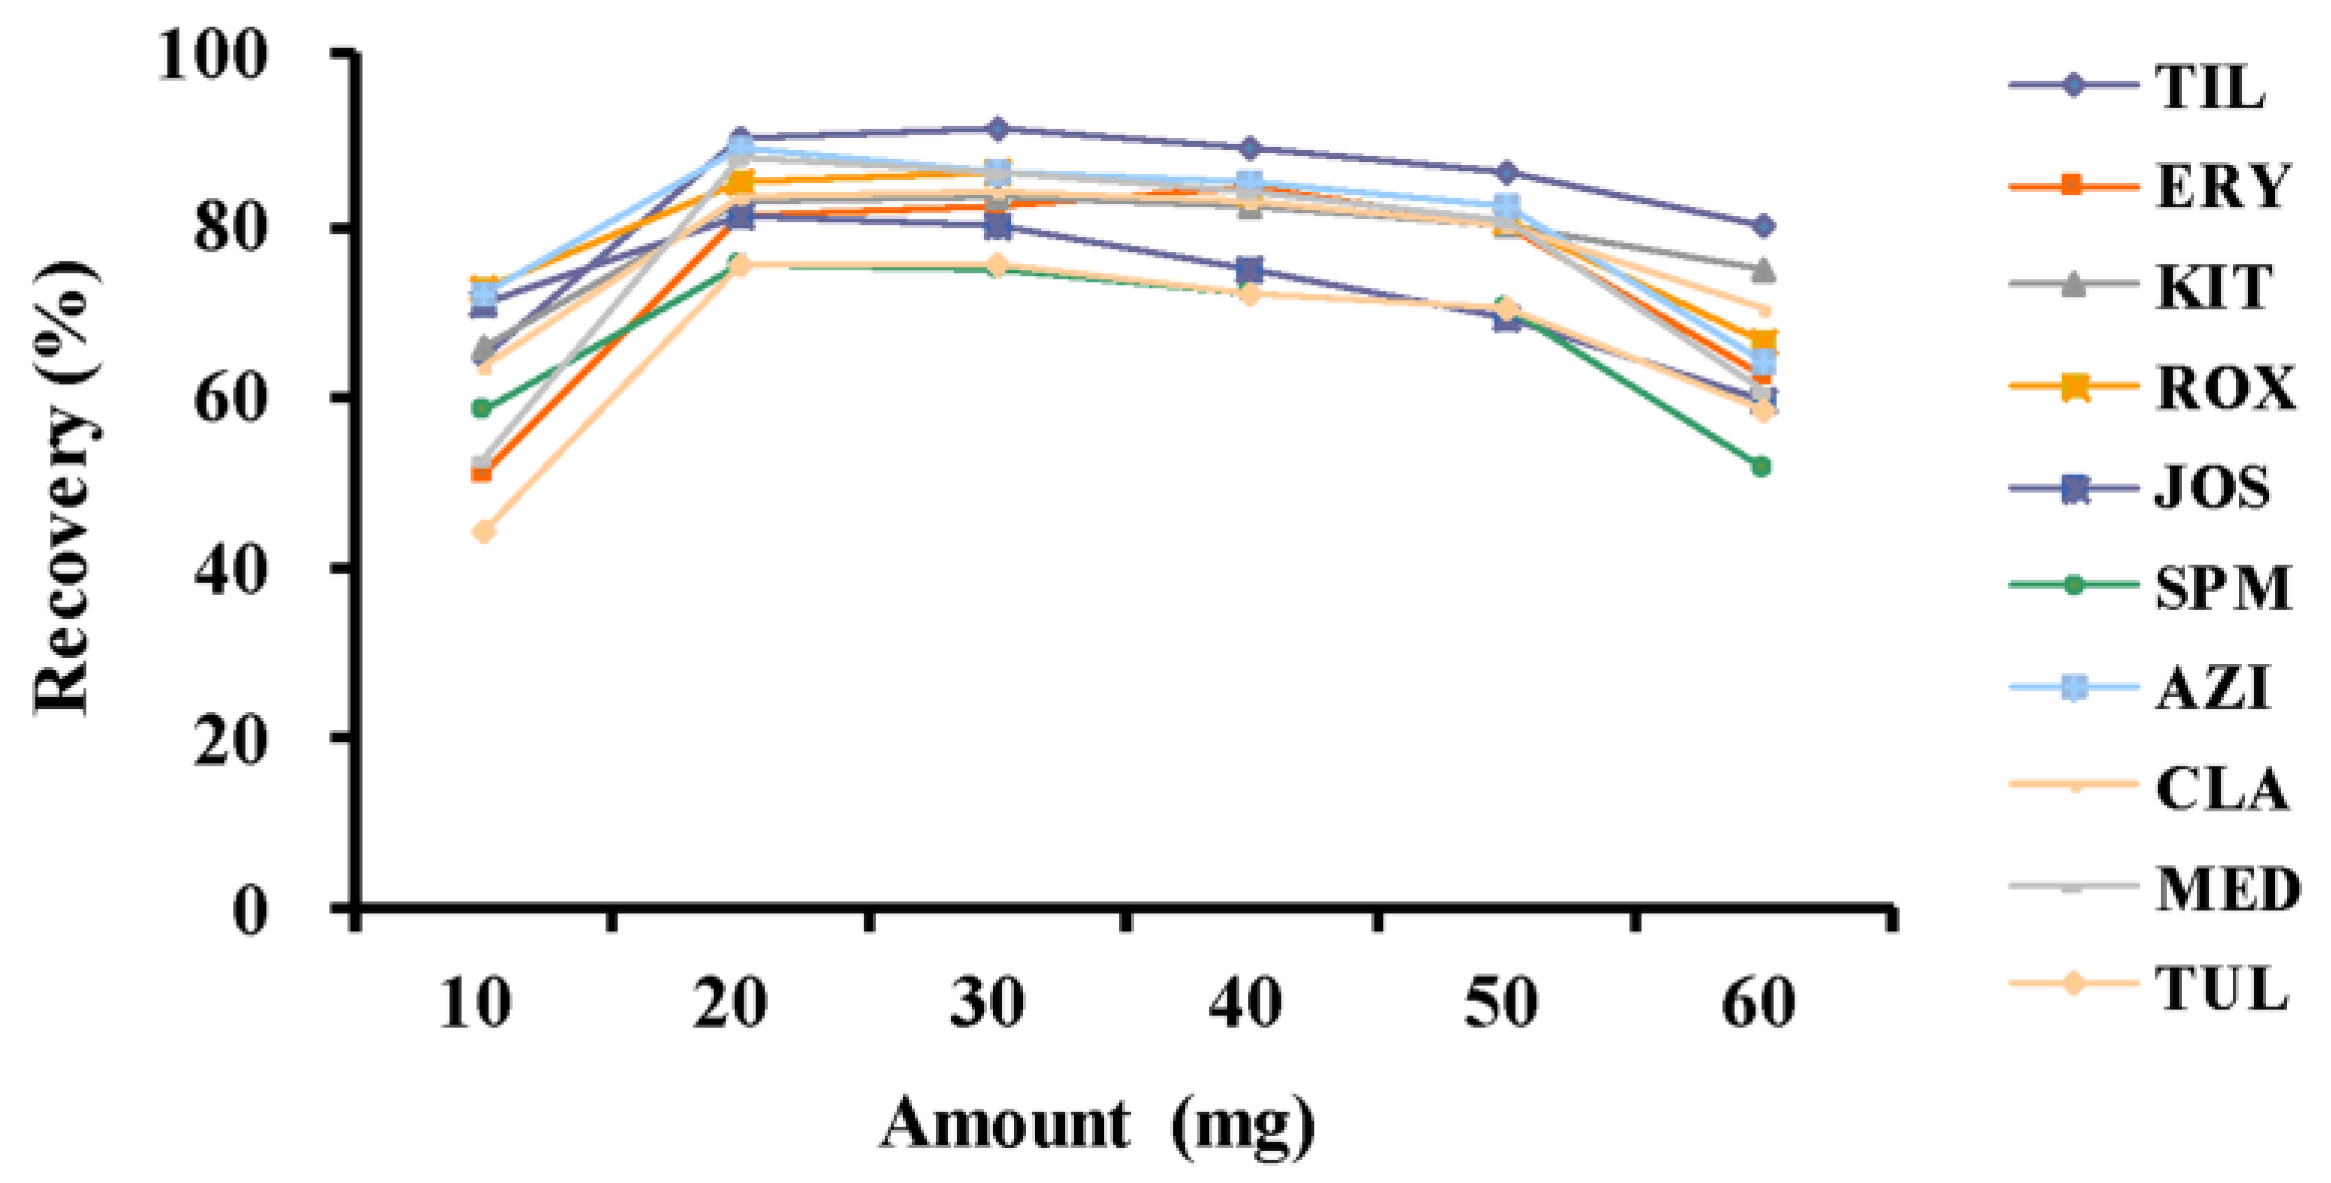
2.1.1. Packing Amount
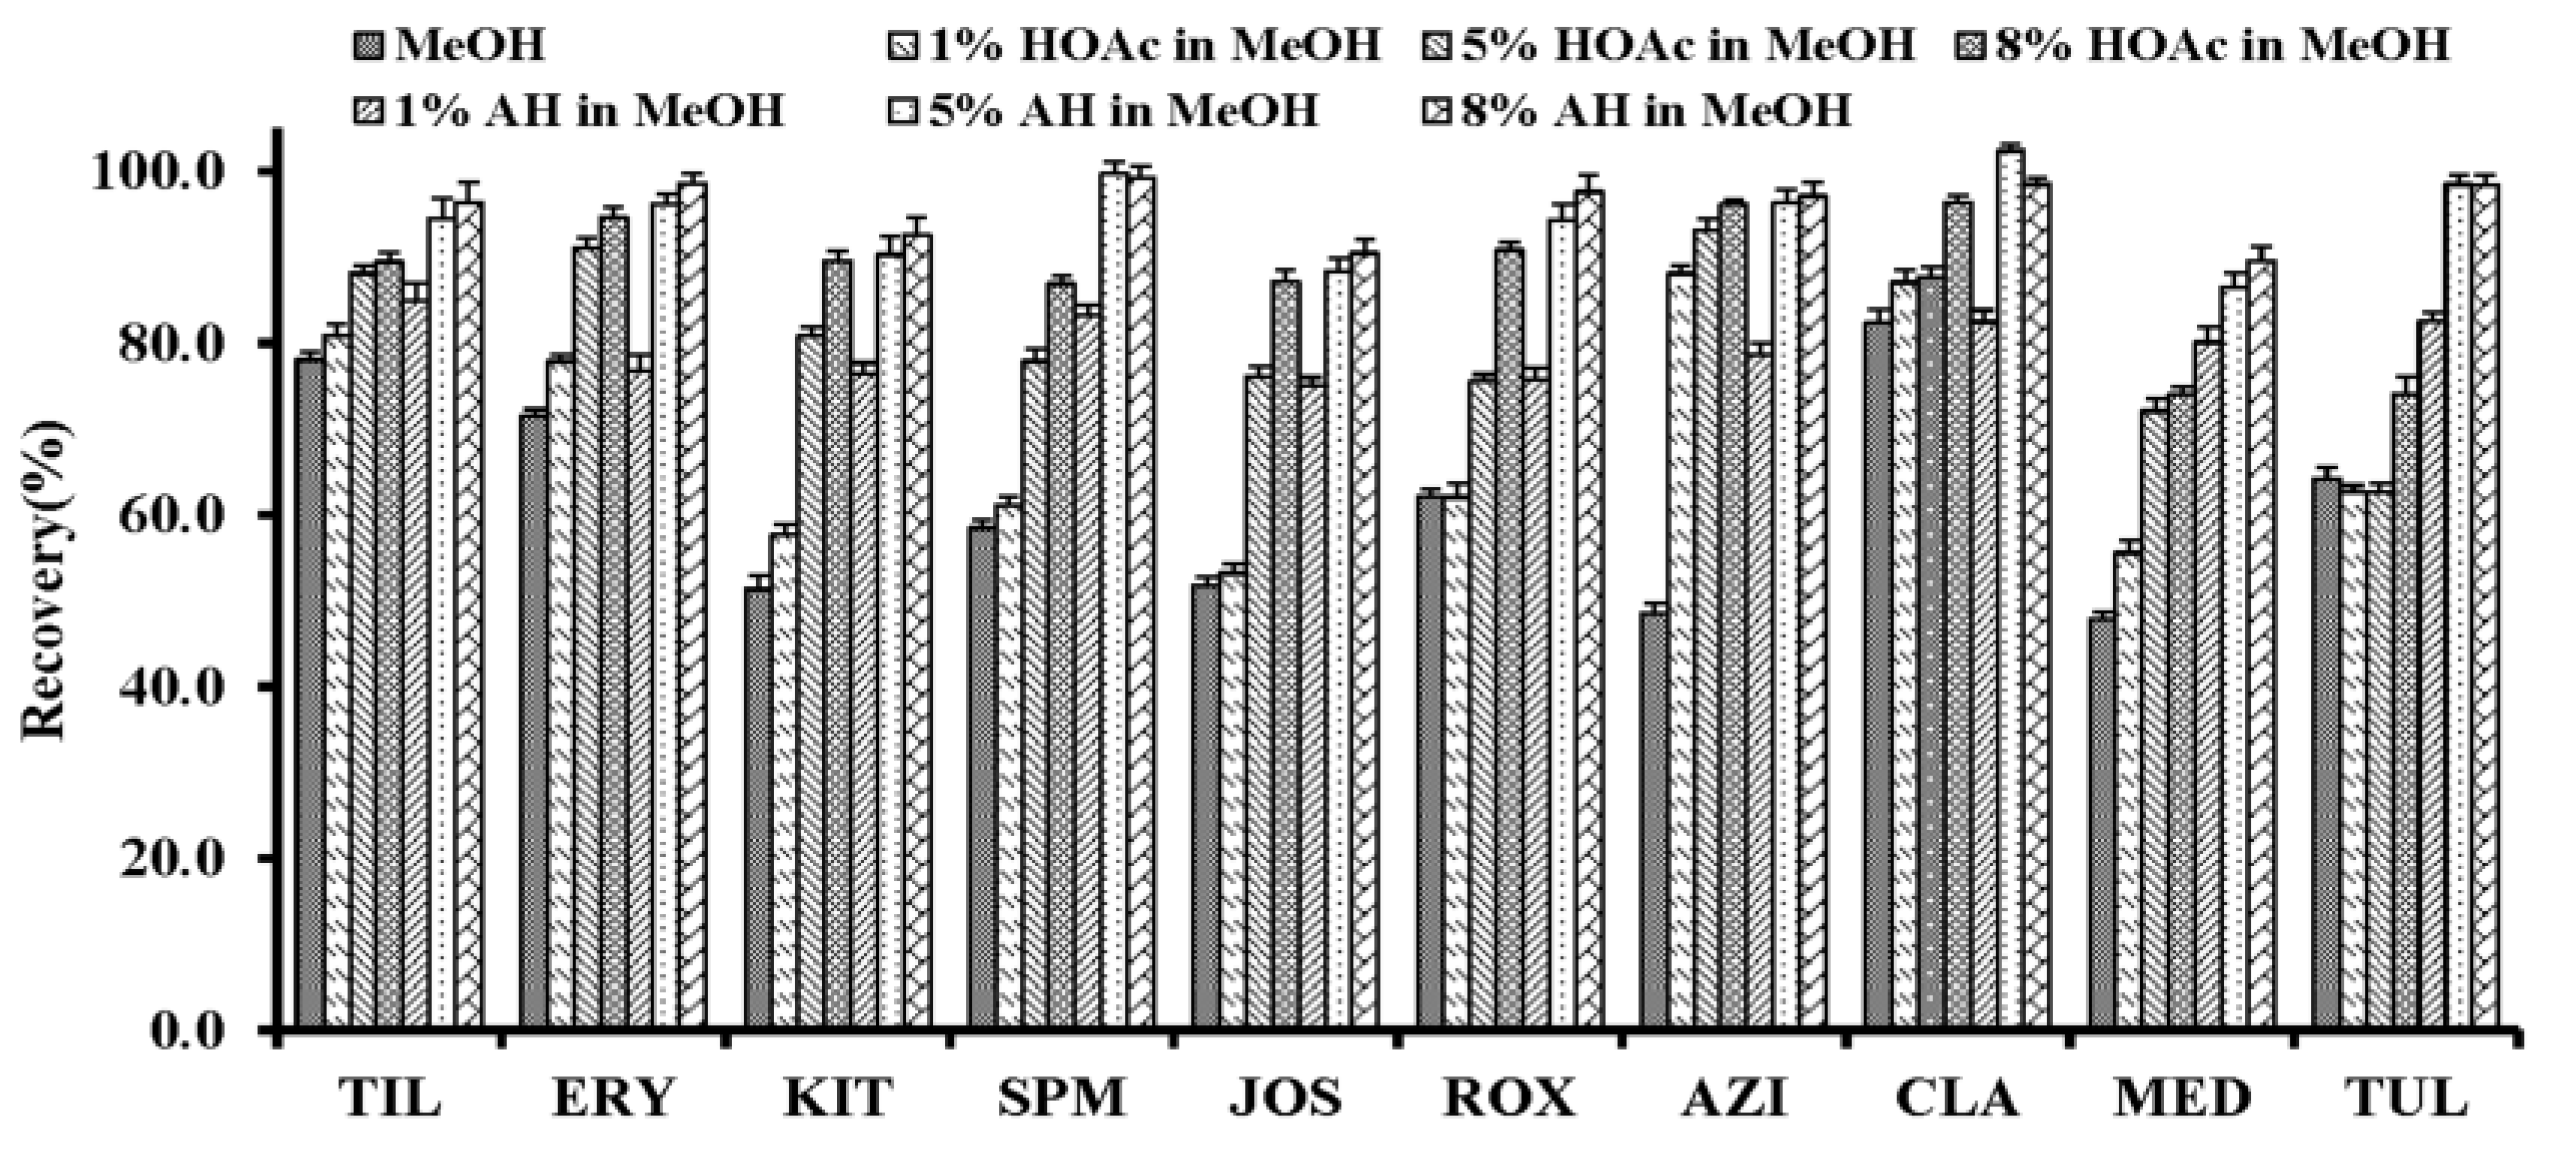
2.1.2. MISPE Conditions
2.2. Breakthrough Volume of the MISPE Cartridge
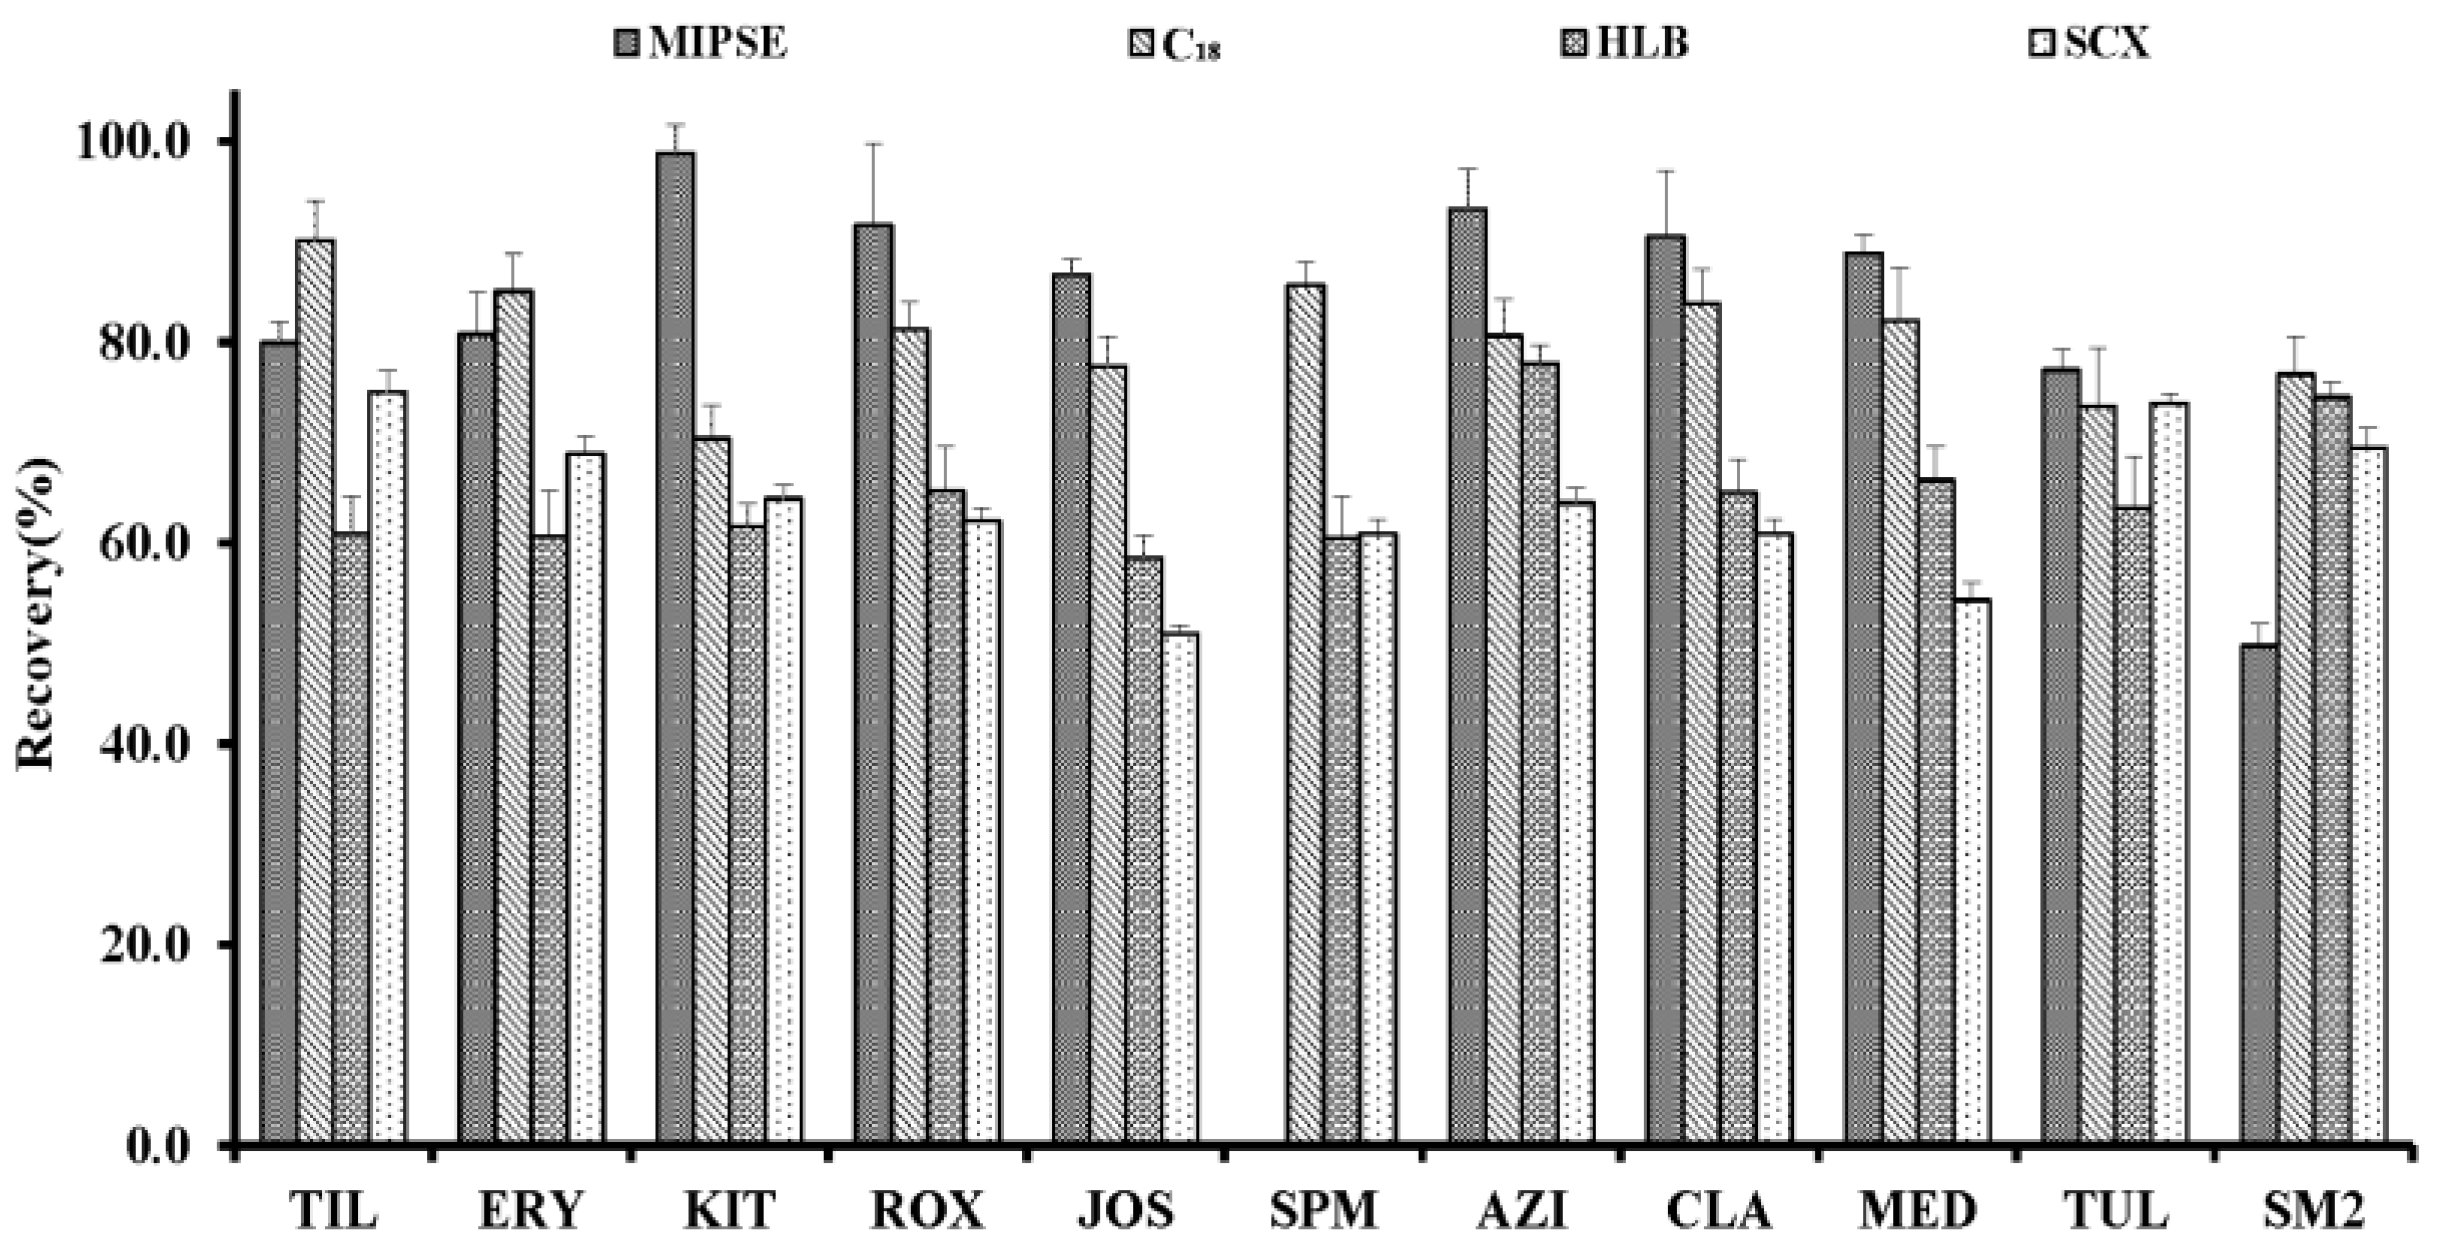
2.3. Comparison of the Different SPE Cartridges
2.4. Method Validation
2.5. Regeneration Study
2.6. Application to Real Water Samples
3. Materials and Methods
3.1. Chemicals and Materials
3.2. Preparation of Molecularly Imprinted Polymer
3.3. Optimization of the MISPE Cartridge
3.4. Breakthrough Volume of the MISPE Cartridge
3.5. Sample Preparation
3.6. LC-MS/MS Analysis
4. Conclusions
Author Contributions
Funding
Conflicts of Interest
References
- Cheng, W.; Jiang, L.; Lu, N.; Ma, L.; Sun, X.; Luo, Y.; Lin, K.; Cui, C. Development of a method for trace level determination of antibiotics in drinking water sources by high performance liquid chromatography-tandem mass spectrometry. Anal. Methods 2015, 7, 1777–1787. [Google Scholar] [CrossRef]
- Roose-Amsaleg, C.; Laverman, A.M. Do antibiotics have environmental side-effects? Impact of synthetic antibiotics on biogeochemical processes. Environ. Sci. Pollut. Res. 2016, 23, 4000–4012. [Google Scholar] [CrossRef] [PubMed]
- González-Pleiter, M.; Gonzalo, S.; Rodea-Palomares, I.; Leganés, F.; Rosal, R.; Boltes, K.; Marco, E.; Fernández-Piñas, F. Toxicity of five antibiotics and their mixtures towards photosynthetic aquatic organisms: Implications for environmental risk assessment. Water Res. 2013, 47, 2050–2064. [Google Scholar] [CrossRef] [PubMed]
- Xu, J.; Xu, Y.; Wang, H.; Guo, C.; Qiu, H.; He, Y.; Zhang, Y.; Li, X.; Meng, W. Occurrence of antibiotics and antibiotic resistance genes in a sewage treatment plant and its effluent-receiving river. Chemosphere 2015, 119, 1379–1385. [Google Scholar] [CrossRef] [PubMed]
- Gadipelly, C.; Pérez-González, A.; Yadav, G.D.; Ortiz, I.; Ibáñez, R.; Rathod, V.K.; Marathe, K.V. Pharmaceutical Industry Wastewater: Review of the Technologies for Water Treatment and Reuse. Ind. Eng. Chem. Res. 2014, 53, 11571–11592. [Google Scholar] [CrossRef]
- Yang, S.; Cha, J.; Carlson, K. Trace analysis and occurrence of anhydroerythromycin and tylosin in influent and effluent wastewater by liquid chromatography combined with electrospray tandem mass spectrometry. Anal. Bioanal. Chem. 2006, 385, 623–636. [Google Scholar] [CrossRef] [PubMed]
- Cabello, F.C.; Godfrey, H.P.; Tomova, A.; Ivanova, L.; Dölz, H.; Millanao, A.; Buschmann, A.H. Antimicrobial use in aquaculture re-examined: Its relevance to antimicrobial resistance and to animal and human health. Environ. Microbiol. 2013, 15, 1917–1942. [Google Scholar] [CrossRef] [PubMed]
- Wellington, E.M.; Boxall, A.B.; Cross, P.; Feil, E.J.; Gaze, W.H.; Hawkey, P.M.; Johnson-Rollings, A.S.; Jones, D.L.; Lee, N.M.; Otten, W. The role of the natural environment in the emergence of antibiotic resistance in gram-negative bacteria. Lancet Infect. Dis. 2013, 13, 155–165. [Google Scholar] [CrossRef]
- Gibson, R.; Cooper, K.M.; Kennedy, D.G.; Elliott, C.T. Mass spectrometric analysis of muscle samples to detect potential antibiotic growth promoter misuse in broiler chickens. Food Addit. Contam. Part A 2012, 29, 1413–1424. [Google Scholar] [CrossRef] [PubMed]
- Pérez, R.A.; Albero, B.; Férriz, M.; Tadeo, J.L. Analysis of macrolide antibiotics in water by magnetic solid-phase extraction and liquid chromatography-tandem mass spectrometry. J. Pharm. Biomed. Anal. 2017, 146, 79–85. [Google Scholar] [CrossRef] [PubMed]
- Gao, J.; Cui, Y.; Tao, Y.; Huang, L.; Peng, D.; Xie, S.; Wang, X.; Liu, Z.; Chen, D.; Yuan, Z. Multiclass method for the quantification of 92 veterinary antimicrobial drugs in livestock excreta, wastewater, and surface water by liquid chromatography with tandem mass spectrometry. J. Sep. Sci. 2016, 39, 4086–4095. [Google Scholar] [CrossRef] [PubMed]
- Zhou, J.L.; Maskaoui, K.; Lufadeju, A. Optimization of antibiotic analysis in water by solid-phase extraction and high performance liquid chromatography-mass spectrometry/mass spectrometry. Anal. Chim. Acta 2012, 731, 32–39. [Google Scholar] [CrossRef] [PubMed]
- Hu, F.Y.; He, L.M.; Yang, J.W.; Bian, K.; Wang, Z.N.; Yang, H.C.; Liu, Y.H. Determination of 26 veterinary antibiotics residues in water matrices by lyophilization in combination with LC–MS/MS. J. Chromatogr. B 2014, 949, 79–86. [Google Scholar] [CrossRef] [PubMed]
- Jank, L.; Hoff, R.B.; Costa, F.J.D.; Pizzolato, T.M. Simultaneous determination of eight antibiotics from distinct classes in surface and wastewater samples by solid-phase extraction and high-performance liquid chromatography–electrospray ionisation mass spectrometry. Int. J. Environ. Anal. Chem. 2014, 94, 1013–1037. [Google Scholar] [CrossRef]
- Terzopoulou, E.; Voutsa, D.; Kaklamanos, G. A multi-residue method for determination of 70 organic micropollutants in surface waters by solid-phase extraction followed by gas chromatography coupled to tandem mass spectrometry. Environ. Sci. Pollut. Res. 2015, 22, 1095–1112. [Google Scholar] [CrossRef] [PubMed]
- Abuin, S.; Codony, R.; Compañó, R.; Granados, M.; Prat, M.D. Analysis of macrolide antibiotics in river water by solid-phase extraction and liquid chromatography-mass spectrometry. J. Chromatogr. A 2006, 1114, 73–81. [Google Scholar] [CrossRef] [PubMed]
- Pedrouzo, M.; Borrull, F.; Marcé, R.M.; Pocurull, E. Simultaneous determination of macrolides, sulfonamides, and other pharmaceuticals in water samples by solid-phase extraction and LC-(ESI) MS. J. Sep. Sci. 2008, 31, 2182–2188. [Google Scholar] [CrossRef] [PubMed]
- Zarejousheghani, M.; Fiedler, P.; Möder, M.; Borsdorf, H. Selective mixed-bed solid phase extraction of atrazine herbicide from environmental water samples using molecularly imprinted polymer. Talanta 2014, 129, 132–138. [Google Scholar] [CrossRef] [PubMed]
- Feng, Q.Z.; Zhao, L.X.; Yan, W.; Lin, J.M.; Zheng, Z.X. Molecularly imprinted solid-phase extraction combined with high performance liquid chromatography for analysis of phenolic compounds from environmental water samples. J. Hazard. Mater. 2009, 167, 282–288. [Google Scholar] [CrossRef] [PubMed]
- Shen, Z.L.; Yuan, D.; Su, Q.D.; Zhang, H.; Wang, J.; Zhu, J.H.; Liu, Y.M. Selective solid-phase extraction using molecularly imprinted polymer for analysis of methamidophos in water and soil samples. Biosci. Biotech. Biochem. 2011, 75, 473. [Google Scholar] [CrossRef] [PubMed]
- Qi, X.; Yang, X.; Wang, B.; Yang, H.; Deng, A. Development of a broad selective molecularly imprinted polymers-based solid phase extraction of contraceptive drug levonorgestrel from water samples. Int. J. Environ. Anal. Chem. 2012, 92, 268–278. [Google Scholar] [CrossRef]
- Song, X.; Zhou, T.; Liu, Q.; Zhang, M.; Meng, C.; Li, J.; He, L. Molecularly imprinted solid-phase extraction for the determination of ten macrolide drugs residues in animal muscles by liquid chromatography–tandem mass spectrometry. Food Chem. 2016, 208, 169–176. [Google Scholar] [CrossRef] [PubMed]
- Zheng, Y.; Liu, Y.; Guo, H.; He, L.; Fang, B.; Zeng, Z. Molecularly imprinted solid-phase extraction for determination of tilmicosin in feed using high performance liquid chromatography. Anal. Chim. Acta 2011, 690, 269. [Google Scholar] [CrossRef] [PubMed]
- Zheng, Y.Q.; Zhan, C.; Guo, H.B.; Zhang, Q.J.; He, L.M.; Chen, Q.J.; Luo, B. Preparation of Tilmicosin Imprinted Polymers and Its Application to Solid Phase Extraction. Chin. J. Anal. Chem. 2010, 38, 95–99. [Google Scholar] [CrossRef]
- Piletska, E.V.; Guerreiro, A.R.; Romero-Guerra, M.; Chianella, I.; Turner, A.P.F.; Piletsky, S.A. Design of molecular imprinted polymers compatible with aqueous environment. Anal. Chim. Acta 2008, 607, 54–60. [Google Scholar] [CrossRef] [PubMed]
- Gbylik-Sikorska, M.; Posyniak, A.; Sniegocki, T.; Zmudzki, J. Liquid chromatography-tandem mass spectrometry multiclass method for the determination of antibiotics residues in water samples from water supply systems in food-producing animal farms. Chemosphere 2015, 119, 8–15. [Google Scholar] [CrossRef] [PubMed]
- Tylová, T.; Flieger, M.; Olšovská, J. Determination of antibiotics in influents and effluents of wastewater-treatment-plants in the Czech Republic–development and application of the SPE and a UHPLC-ToFMS method. Anal. Methods 2013, 5, 2110–2118. [Google Scholar] [CrossRef]
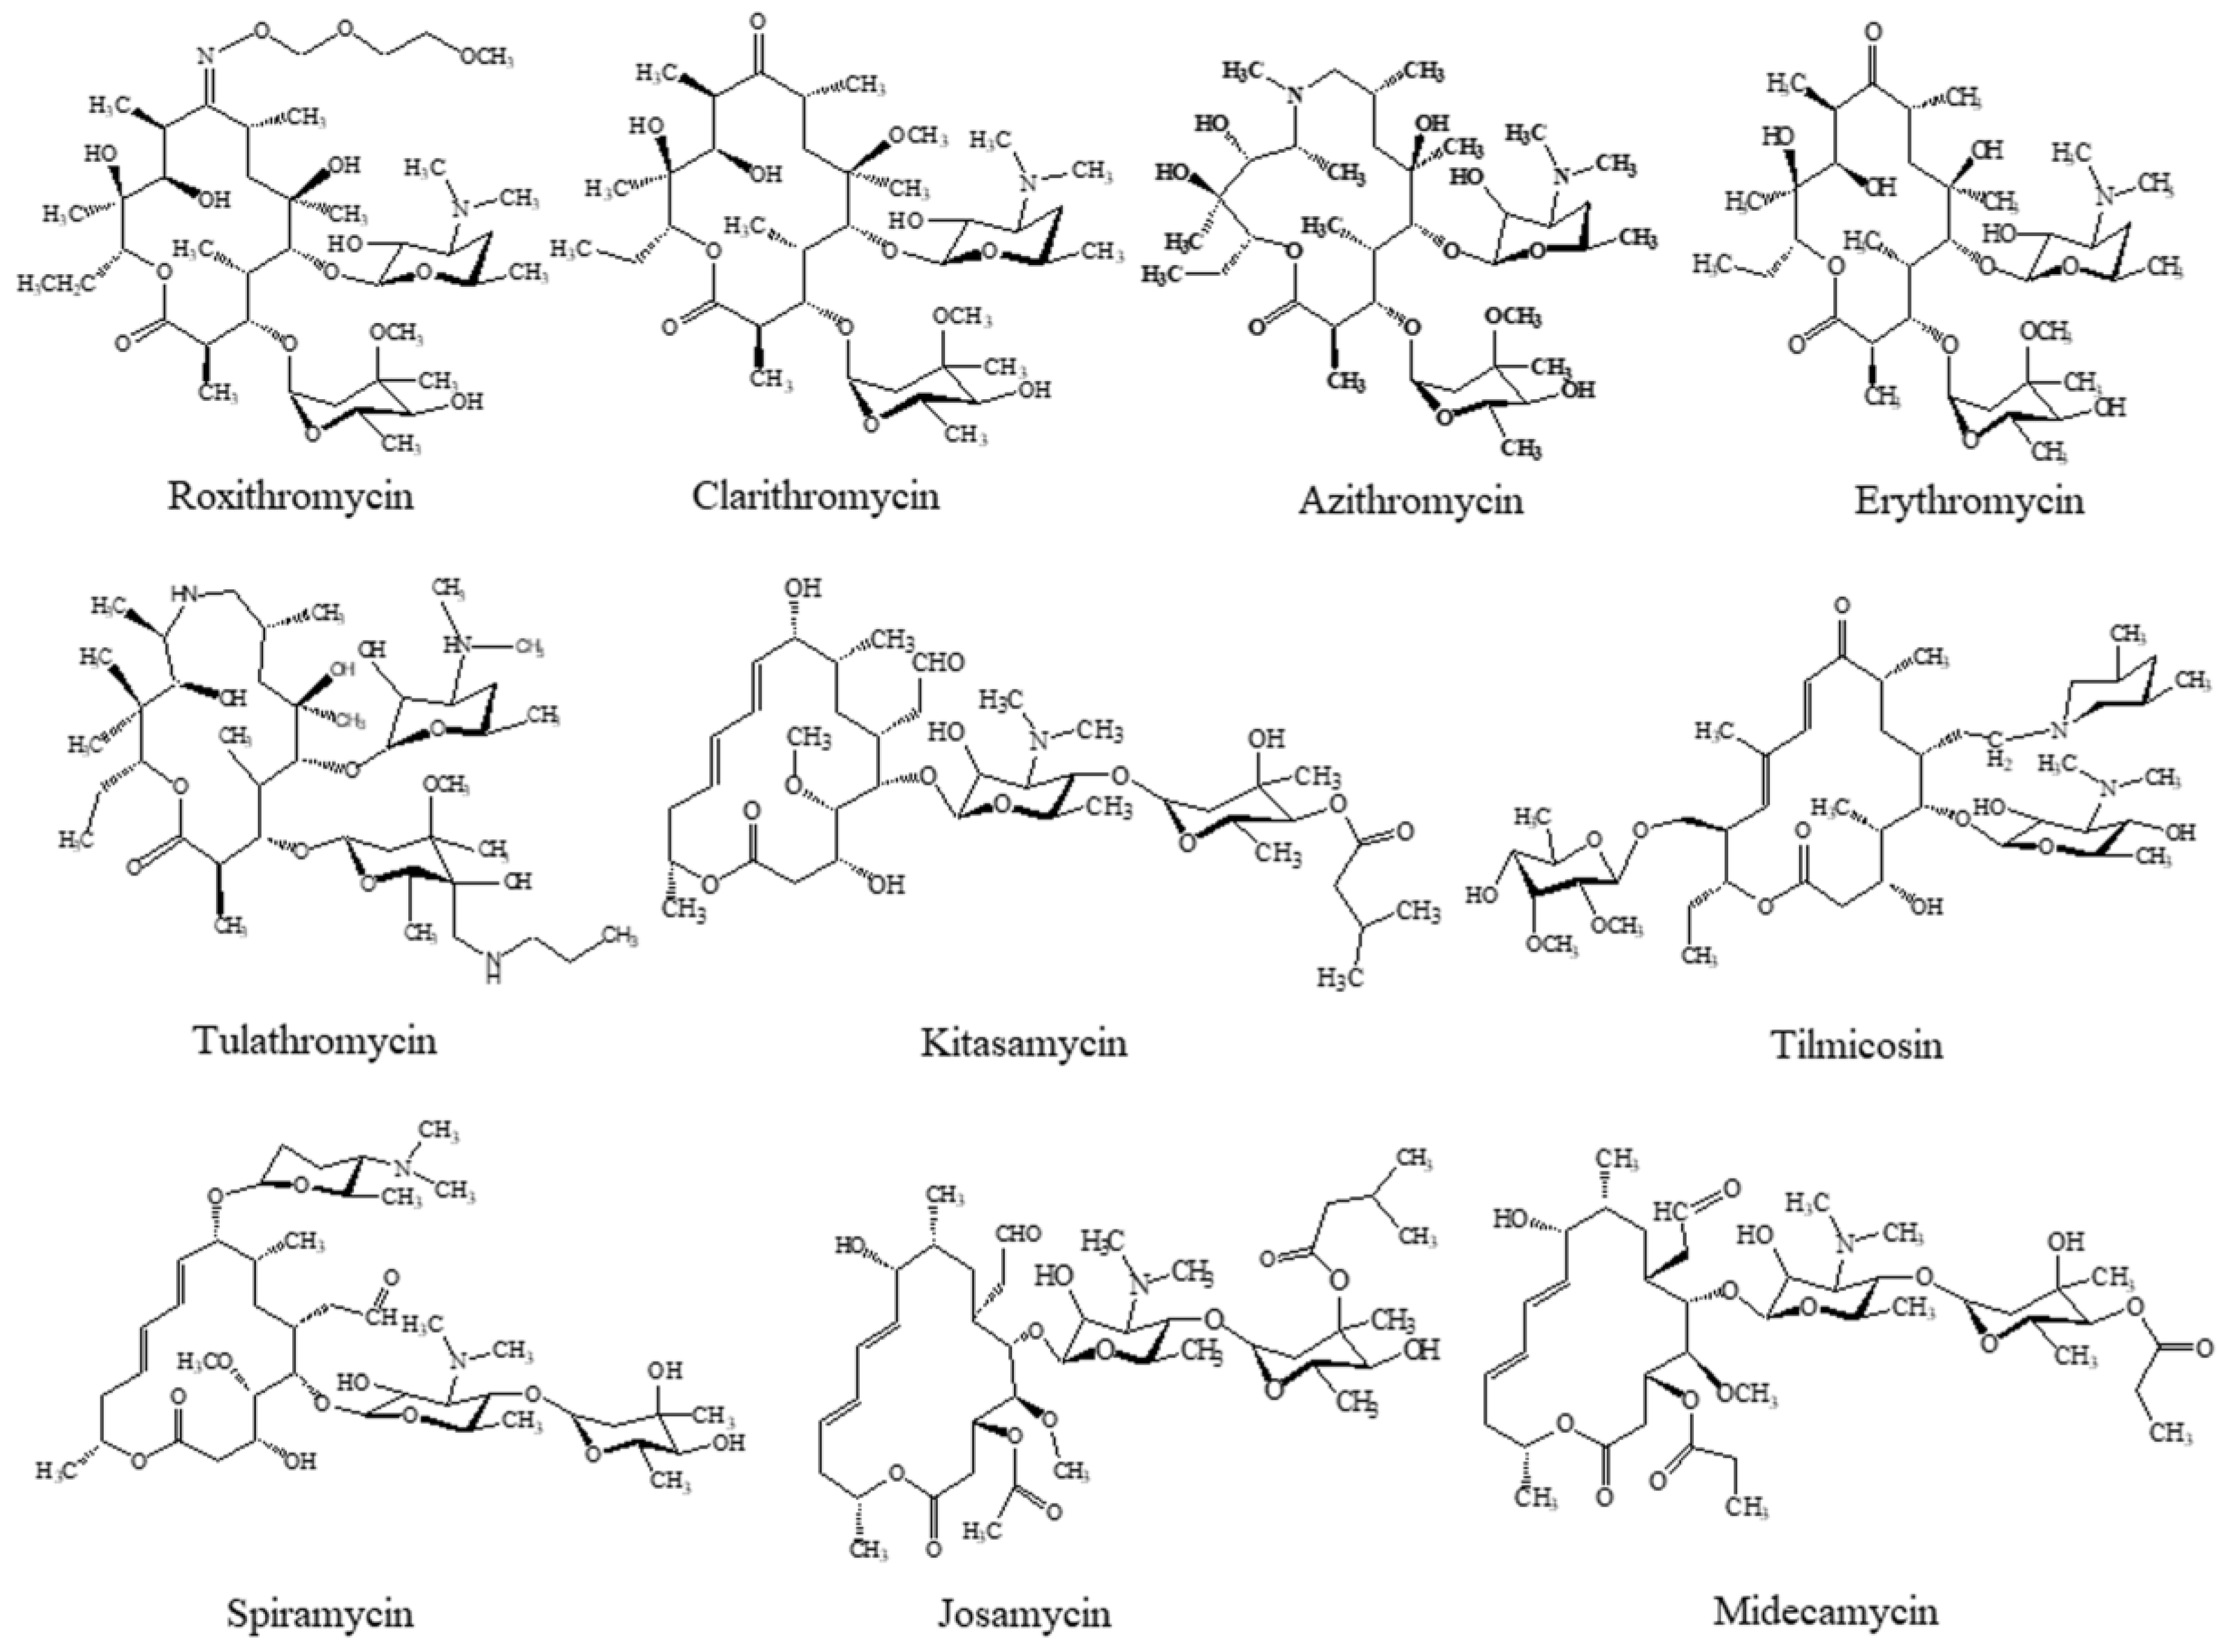
Sample Availability: Samples of the compounds including roxithromycin, spiramycin, josamycin, clarithromycin, kitasamycin, erythromycin, tilmicosin, tulathromycin, azithromycin, and midecamycin are available from the authors. |


| Compounds | Abbr. | Precursor Ion | Product Ion | DP | CE | RT |
|---|---|---|---|---|---|---|
| (Ion Ratio, %) | (V) | (eV) | (min) | |||
| Tilmicosin | TIL | 869.6 | 696.4 | 130 | 60 | 8.26 |
| 174.2(47.2) | 130 | 66 | ||||
| Spiramycin | SPM | 843.9 | 141.9 | 110 | 50 | 7.85 |
| 174.4(45.8) | 110 | 48 | ||||
| Roxithromycin | ROX | 837.8 | 679.7 | 85 | 31 | 9.24 |
| 158.1(82.1) | 85 | 48 | ||||
| Josamycin | JOS | 829.4 | 229.5 | 100 | 48 | 9.61 |
| 174.3(17.8) | 100 | 44 | ||||
| Midecamycin | MED | 814.8 | 108.6 | 90 | 46 | 9.40 |
| 174.3(33.0) | 90 | 34 | ||||
| Kitasamycin | KIT | 772.8 | 215.1 | 100 | 45 | 9.48 |
| 174.1(30.7) | 100 | 41 | ||||
| Azithromycin | AZI | 749.7 | 591.8 | 80 | 46 | 9.11 |
| 158.2(16.9) | 75 | 28 | ||||
| Clarithromycin | CLA | 749.6 | 591.5 | 80 | 41 | 9.20 |
| 158.1(54.3) | 80 | 26 | ||||
| Erythromycin | ERY | 734.7 | 576.5 | 64 | 43 | 8.97 |
| 158.0(87) | 64 | 27 | ||||
| Tulathromycin | TUL | 404 | 158.2 | 71 | 33 | 7.37 |
| 72.2(70.5) | 71 | 31 |
| Analyte | Water Sample | Linearity (r2) | LOD (ng/L) | LOQ (ng/L) | Intra-Day Recovery (RSD, %, n = 6) | Inter-Day Recovery (RSD, %, n = 18) | ||||||
|---|---|---|---|---|---|---|---|---|---|---|---|---|
| LOQ (ng/L) | 40 (ng/L) | 100 (ng/L) | 400 (ng/L) | LOQ (ng/L) | 40 (ng/L) | 100 (ng/L) | 400 (ng/L) | |||||
| TIL | spring water | 0.9949 | 2.0 | 5.0 | 75.3(1.2) | 78.2(2.6) | 80.1(7.7) | 81.3(1.3) | 76.4(6.2) | 77.5(4.6) | 80.1(6.6) | 82.6(5.2) |
| tap water | 0.9912 | 2.0 | 5.0 | 70.6(6.7) | 73.5(3.1) | 75.5(2.3) | 82.2(2.6) | 71.8(5.1) | 73.0(5.1) | 75.6(6.3) | 81.0(4.4) | |
| fishpond water | 0.9945 | 2.0 | 5.0 | 71.9(5.6) | 73.1(1.5) | 73.3(1.9) | 80.2(1.4) | 73.5(1.3) | 76.5(4.9) | 76.4(5.3) | 80.1(4.2) | |
| lake water | 0.9934 | 2.0 | 5.0 | 75.2 (6.1) | 79.2(3.3) | 80.7(3.8) | 82.5(8.2) | 77.1(7.1) | 78.8(5.6) | 80.3(4.9) | 80.7(6.7) | |
| ERY | spring water | 0.9990 | 15.0 | 40.0 | 79.8(2.6) | 82.7(3.7) | 83.5(4.8) | 83.5(5.4) | 80.2(6.2) | 83.2(8.8) | 81.6(5.2) | 80.8(5.3) |
| tap water | 0.9984 | 15.0 | 40.0 | 73.2(2.2) | 78.7(3.9) | 82.1(5.6) | 84.2(5.4) | 76.4(6.5) | 80.0(4.4) | 82.3(5.8) | 82.4(5.1) | |
| fishpond water | 0.9996 | 15.0 | 40.0 | 70.4(3.1) | 77.3(5.2) | 80.6(3.4) | 78.9(1.7) | 72.3(7.3) | 76.6(4.8) | 79.3(3.9) | 79.1(3.4) | |
| lake water | 0.9995 | 15.0 | 40.0 | 80.2(1.9) | 81.3(6.2) | 80.9(2.1) | 81.4(3.3) | 73.7(3.4) | 79.5(6.2) | 81.4(3.2) | 82.2(4.9) | |
| KIT | spring water | 0.9913 | 2.0 | 5.0 | 86.8(4.3) | 88.2(8.2) | 84.4(2.1) | 100.9(2.0) | 82.9(2.2) | 86.2(5.9) | 83.3(4.7) | 98.8(2.9) |
| tap water | 0.9958 | 2.0 | 5.0 | 80.3(4.7) | 85.5(3.1) | 86.2(2.5) | 92.8(1.4) | 76.9(2.5) | 78.9(7.7) | 83.0(2.8) | 92.2(3.1) | |
| fishpond water | 0.9925 | 2.0 | 5.0 | 78.7(2.9) | 79.3(1.0) | 80.4(3.7) | 80.1(1.0) | 77.3(3.1) | 78.1(3.6) | 80.9(4.6) | 82.5(4.2) | |
| lake water | 0.9916 | 2.0 | 5.0 | 82.3(5.6) | 85.3(5.9) | 87.7(3.0) | 90.2(5.9) | 80.2(2.8) | 85.6(6.0) | 89.0(4.1) | 91.9(4.9) | |
| ROX | spring water | 0.9930 | 2.0 | 5.0 | 88.7(2.4) | 90.1(4.4) | 87.2(7.3) | 86.3(12.6) | 85.6(1.3) | 87.3(4.9) | 89.2(8.2) | 91.7(8.8) |
| tap water | 0.9982 | 2.0 | 5.0 | 78.7(1.3) | 83.1(7.4) | 85.8(7.3) | 88.9(3.2) | 80.1(4.2) | 82.2(6.8) | 84.3(7.5) | 89.8(9.2) | |
| fishpond water | 0.9992 | 2.0 | 5.0 | 70.1(3.7) | 77.7(3.3) | 89.3(6.7) | 83.9(1.3) | 75.6(5.1) | 79.0(4.8) | 85.6(4.4) | 84.7(3.2) | |
| lake water | 0.9997 | 2.0 | 5.0 | 85.2(6.3) | 87.1(4.4) | 89.9(1.4) | 90.5(3.9) | 82.9(4.1) | 84.3(4.9) | 87.1(2.4) | 89.1(4.8) | |
| JOS | spring water | 0.9933 | 6.0 | 15.0 | 89.5(4.4) | 92.0(5.8) | 99.9(4.7) | 94.6(4.2) | 87.5(4.3) | 91.9(4.3) | 93.2(7.7) | 92.2(9.1) |
| tap water | 0.9904 | 6.0 | 15.0 | 76.2(3.2) | 80.1(9.7) | 84.2(2.8) | 85.9(3.1) | 80.7(8.4) | 84.5(6.4) | 83.6(10.3) | 87.5(5.0) | |
| fishpond water | 0.9973 | 6.0 | 15.0 | 83.9(2.6) | 85.9(5.3) | 87.4(5.9) | 89.2(1.1) | 82.8(6.5) | 83.1(3.9) | 84.0(4.1) | 86.0(1.8) | |
| lake water | 0.9978 | 6.0 | 15.0 | 83.7(5.2) | 85.3(7.1) | 89.9(6.5) | 91.1(1.8) | 82.4(3.9) | 84.7(5.7) | 89.4(8.2) | 91.7(2.9) | |
| SPM | spring water | 0.9933 | 2.0 | 5.0 | 76.5(2.1) | 83.3(5.0) | 79.3(3.3) | 84.2(3.1) | 73.4(2.1) | 81.8(6.4) | 83.6(5.1) | 85.1(2.6) |
| tap water | 0.9957 | 2.0 | 5.0 | 71.3(1.8) | 78.4(11.2) | 80.6(2.7) | 82.8(2.0) | 72.8(5.5) | 79.9(7.1) | 83.4(4.8) | 84.6(3.1) | |
| fishpond water | 0.9978 | 2.0 | 5.0 | 73.9(6.6) | 77.0(4.7) | 82.5(2.5) | 85.7(2.4) | 70.5(3.8) | 75.6(5.7) | 83.9(2.9) | 85.5(2.5 | |
| lake water | 0.9995 | 2.0 | 5.0 | 78.6(3.1) | 83.3(6.2) | 79.3(3.3) | 86.9(3.2) | 76.4(1.8) | 83.3(6.8) | 83.1(4.6) | 87.2(4.4) | |
| AZI | spring water | 0.9977 | 1.0 | 3.0 | 85.7(1.4) | 88.0(4.5) | 88.1(2.6) | 92.4(1.4) | 85.3(2.7) | 86.7(6.0) | 87.8(3.9) | 93.3(4.2) |
| tap water | 0.9935 | 1.0 | 3.0 | 80.1(1.7) | 85.8(2.1) | 86.4(1.0) | 88.9(2.6) | 78.1(6.1) | 83.8(5.5) | 86.3(4.5) | 89.7(3.8) | |
| fishpond water | 0.9987 | 1.0 | 3.0 | 70.8(6.2) | 74.1(1.9) | 83.7(1.7) | 79.3(1.5) | 73.2(6.3) | 76.8(3.8) | 80.6(2.9) | 79.2(5.3) | |
| lake water | 0.9985 | 1.0 | 3.0 | 79.7(5.4) | 85.3(8.3) | 87.5(3.7) | 92.4(3.2) | 79.7(9.1) | 83.5(6.9) | 87.3(3.6) | 93.3(4.2) | |
| CLA | spring water | 0.9939 | 1.0 | 3.0 | 83.5(6.1) | 88.0(4.5) | 90.1(5.2) | 92.6(4.0) | 86.8(5.9) | 90.3(5.5) | 88.1(7.2) | 90.5(8.3) |
| tap water | 0.9921 | 1.0 | 3.0 | 85.8(4.2) | 87.7(5.9) | 89.9(3.9) | 86.2(3.5) | 83.4(5.8) | 86.9(6.2) | 89.2(11.3) | 89.7(9.1) | |
| fishpond water | 0.9934 | 1.0 | 3.0 | 73.2(1.3) | 76.4(3.7) | 84.4(4.7) | 82.4(3.8) | 74.1(2.8) | 78.4(3.5) | 82.8(3.2) | 81.0(2.9) | |
| lake water | 0.9969 | 1.0 | 3.0 | 86.4(6.2) | 88.4(4.5) | 89.4(3.8) | 88.3(4.4) | 83.2(9.5) | 86.1(6.1) | 88.6(5.1) | 89.8(5.8) | |
| MED | spring water | 0.9954 | 1.0 | 3.0 | 79.8(3.5) | 84.7(5.9) | 90.0(5.3) | 95.1(3.8) | 80.9(5.4) | 83.1(8.4) | 88.0(6.4) | 93.9(3.9) |
| tap water | 0.9906 | 1.0 | 3.0 | 78.7(2.6) | 83.1(3.6) | 88.7(2.8) | 90.4(1.6) | 74.2(3.1) | 74.8(5.0) | 79.6(9.8) | 85.7(4.4) | |
| fishpond water | 0.9945 | 1.0 | 3.0 | 67.3(5.4) | 70.1(1.6) | 79.1(4.5) | 81.0(3.0) | 70.1(7.3) | 73.6(4.1) | 78.3(3.4) | 80.3(2.1) | |
| lake water | 0.9998 | 1.0 | 3.0 | 77.7(2.3) | 82.7(2.1) | 88.2(2.6) | 87.3(4.0) | 76.5(3.5) | 81.8(7.5) | 85.8(5.7) | 87.2(4.3) | |
| TUL | spring water | 0.9916 | 10.0 | 25.0 | 71.1(1.7) | 75.2(8.1) | 75.9(1.9) | 83.1(6.4) | 70.8(4.3) | 72.8(6.5) | 75.0(2.6) | 82.8(5.2) |
| tap water | 0.9942 | 10.0 | 25.0 | 63.4(7.5) | 66.7(5.5) | 71.0(2.1) | 72.3(4.2) | 65.5(8.3) | 68.1(3.9) | 72.1(3.0) | 74.7(4.9) | |
| fishpond water | 0.9934 | 10.0 | 25.0 | 62.6(8.4) | 68.7(1.2) | 73.3(1.3) | 77.6(2.2) | 66.7(9.1) | 71.4(4.6) | 73.3(1.9) | 77.0(3.1) | |
| lake water | 0.9927 | 10.0 | 25.0 | 65.1(4.3) | 71.2(7.4) | 74.5(4.1) | 79.8(5.0) | 63.9(4.4) | 70.8(6.8) | 74.6(3.8) | 79.1(4.4) | |
| Extraction Method a | Analytical Method b | Sample Source | Target Analyte c | LOD (ng/L) d | Reference |
|---|---|---|---|---|---|
| SPE (Oasis HLB) | LC-MS/MS | wastewater, surface water | OLE, ERY, AZI, KIT, MED, JOS, ROX, SPM, TIL, TYL | 10.0–50.0 | [11] |
| SPE (Oasis HLB) | LC-MS/MS | wastewater, river water | ERY, AZI, TYL | 0.5–18.5 | [14] |
| SPE (Oasis HLB) | LC-MS | sewage water, river water, tap water | ERY, KIT, TYL, ROX | 40.0 | [17] |
| SPE (Strata-X) | LC-MS/MS | water supply systems | TYL, ERY, SPM, TIL, JOS | 10.0–203.0 | [26] |
| SPE (Oasis HLB) | UHPLC-ToFMS | wastewater | ERY, TYL, CLA, ROX | LOQ (4.1–17.3) | [27] |
| MSPE | LC-MS/MS | river water | TIL, ERY, TYL | 11.0–26.0 | [10] |
| MISPE | LC-MS/MS | spring water tap water fishpond water lake water | TIL, ERY, KIT, ROX, JOS, SPM, AZI, CLA, MED, TUL | 1.0–15.0 | This work |
© 2018 by the authors. Licensee MDPI, Basel, Switzerland. This article is an open access article distributed under the terms and conditions of the Creative Commons Attribution (CC BY) license (http://creativecommons.org/licenses/by/4.0/).
Share and Cite
Song, X.; Zhou, T.; Li, J.; Zhang, M.; Xie, J.; He, L. Determination of Ten Macrolide Drugs in Environmental Water Using Molecularly Imprinted Solid-Phase Extraction Coupled with Liquid Chromatography-Tandem Mass Spectrometry. Molecules 2018, 23, 1172. https://doi.org/10.3390/molecules23051172
Song X, Zhou T, Li J, Zhang M, Xie J, He L. Determination of Ten Macrolide Drugs in Environmental Water Using Molecularly Imprinted Solid-Phase Extraction Coupled with Liquid Chromatography-Tandem Mass Spectrometry. Molecules. 2018; 23(5):1172. https://doi.org/10.3390/molecules23051172
Chicago/Turabian StyleSong, Xuqin, Tong Zhou, Jiufeng Li, Meiyu Zhang, Jingmeng Xie, and Limin He. 2018. "Determination of Ten Macrolide Drugs in Environmental Water Using Molecularly Imprinted Solid-Phase Extraction Coupled with Liquid Chromatography-Tandem Mass Spectrometry" Molecules 23, no. 5: 1172. https://doi.org/10.3390/molecules23051172
APA StyleSong, X., Zhou, T., Li, J., Zhang, M., Xie, J., & He, L. (2018). Determination of Ten Macrolide Drugs in Environmental Water Using Molecularly Imprinted Solid-Phase Extraction Coupled with Liquid Chromatography-Tandem Mass Spectrometry. Molecules, 23(5), 1172. https://doi.org/10.3390/molecules23051172