Rapid Determination of Chlorophyll and Pheophytin in Green Tea Using Fourier Transform Infrared Spectroscopy


Abstract
:1. Introduction
2. Results and Discussion
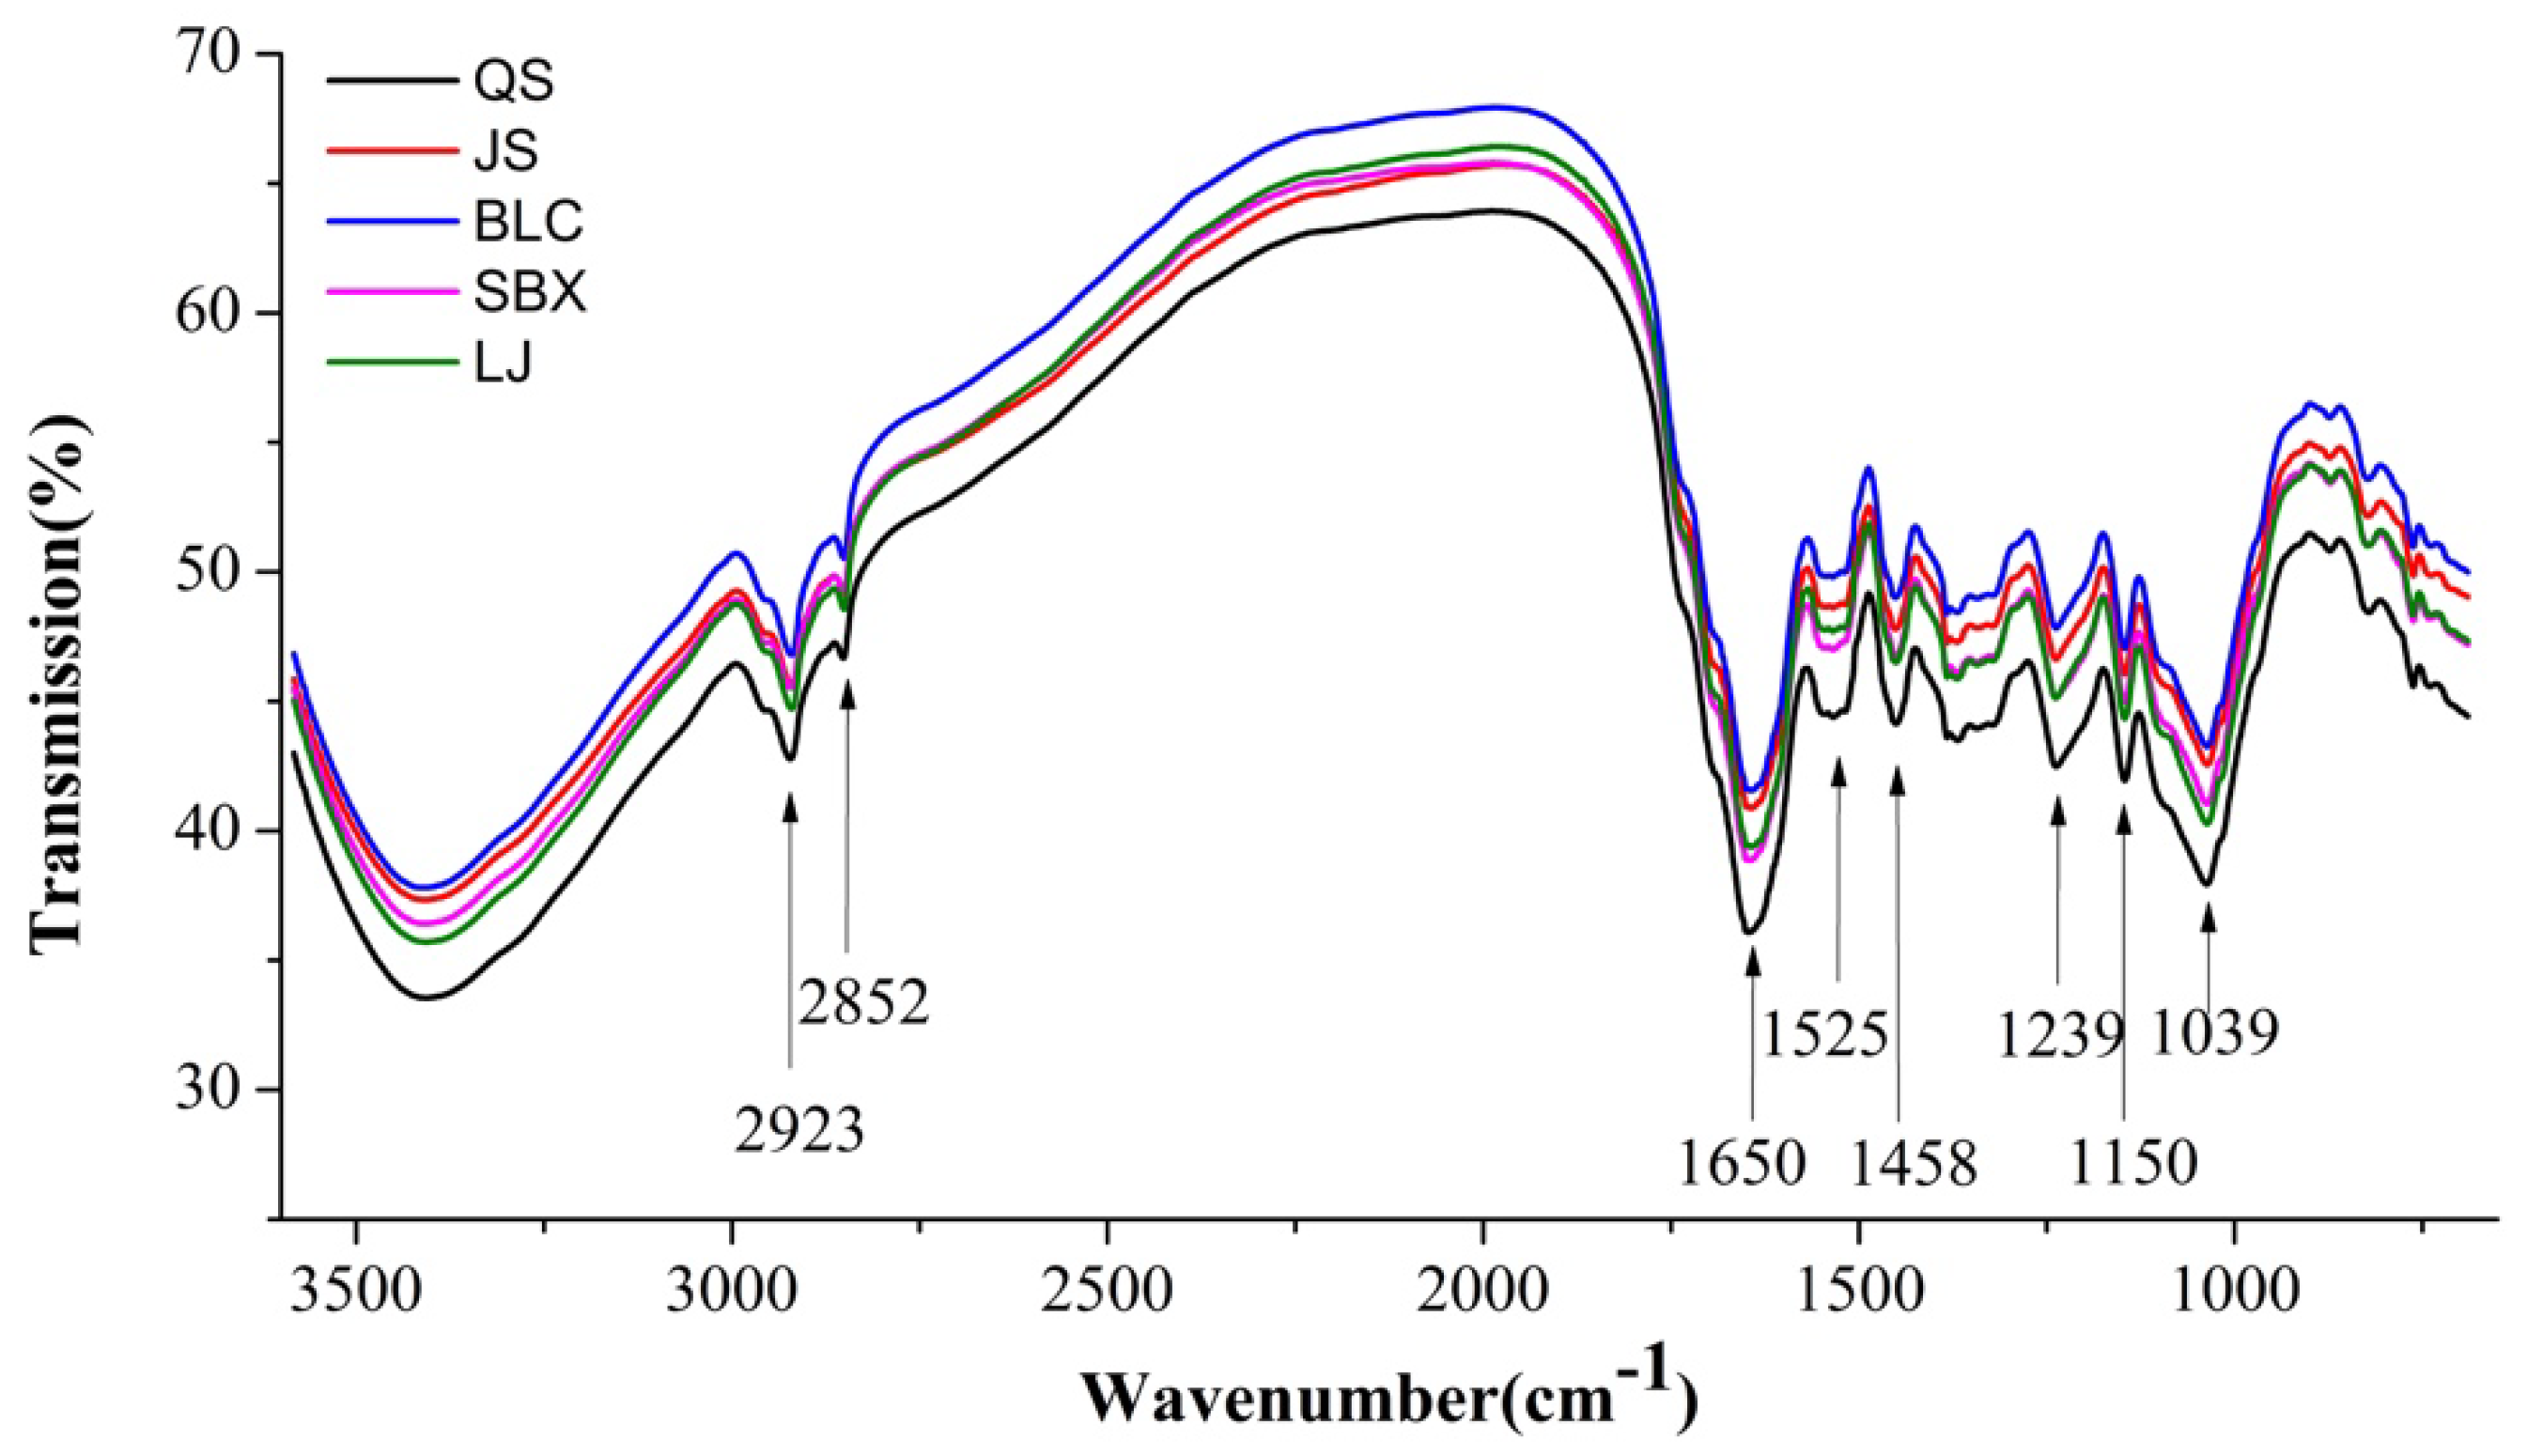
2.1. Overview of FT–IR Spectra
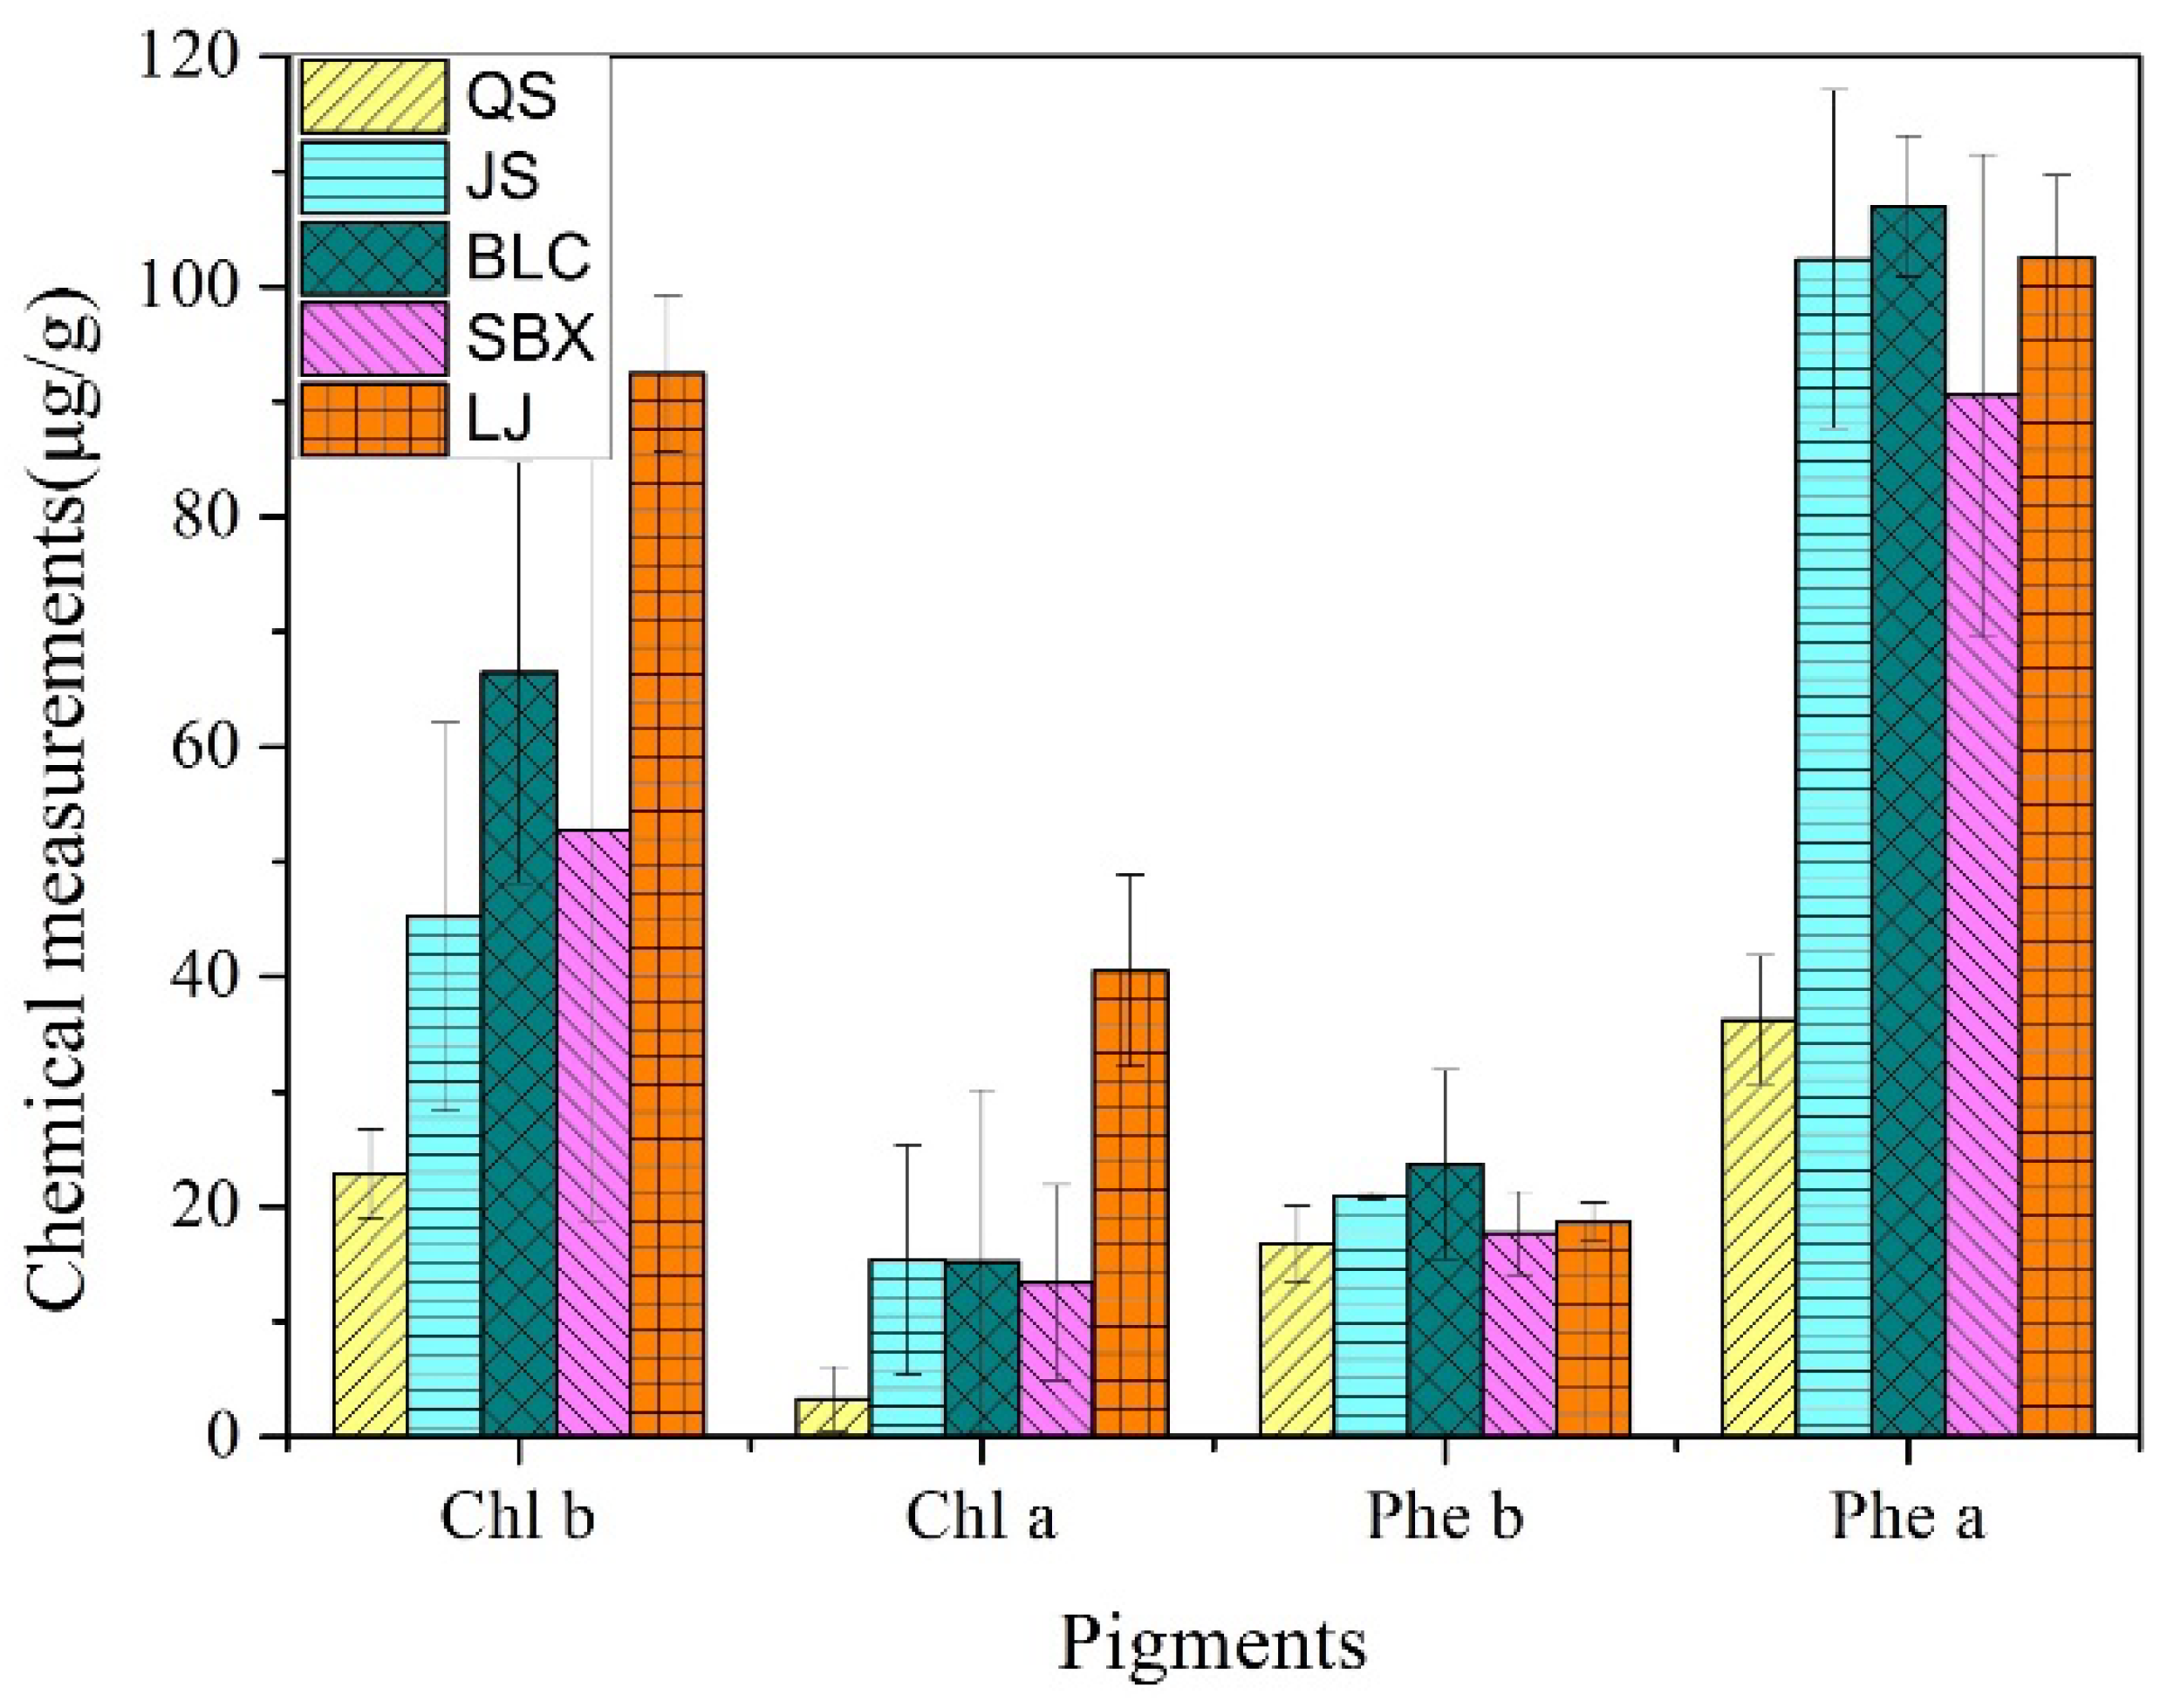
2.2. Overview of Chlorophyll and Pheophytin of Tea Samples
2.3. Quantitative Determination of Chlorophylls and Pheophytin
2.3.1. Sample Division
2.3.2. Spectra Pretreatment
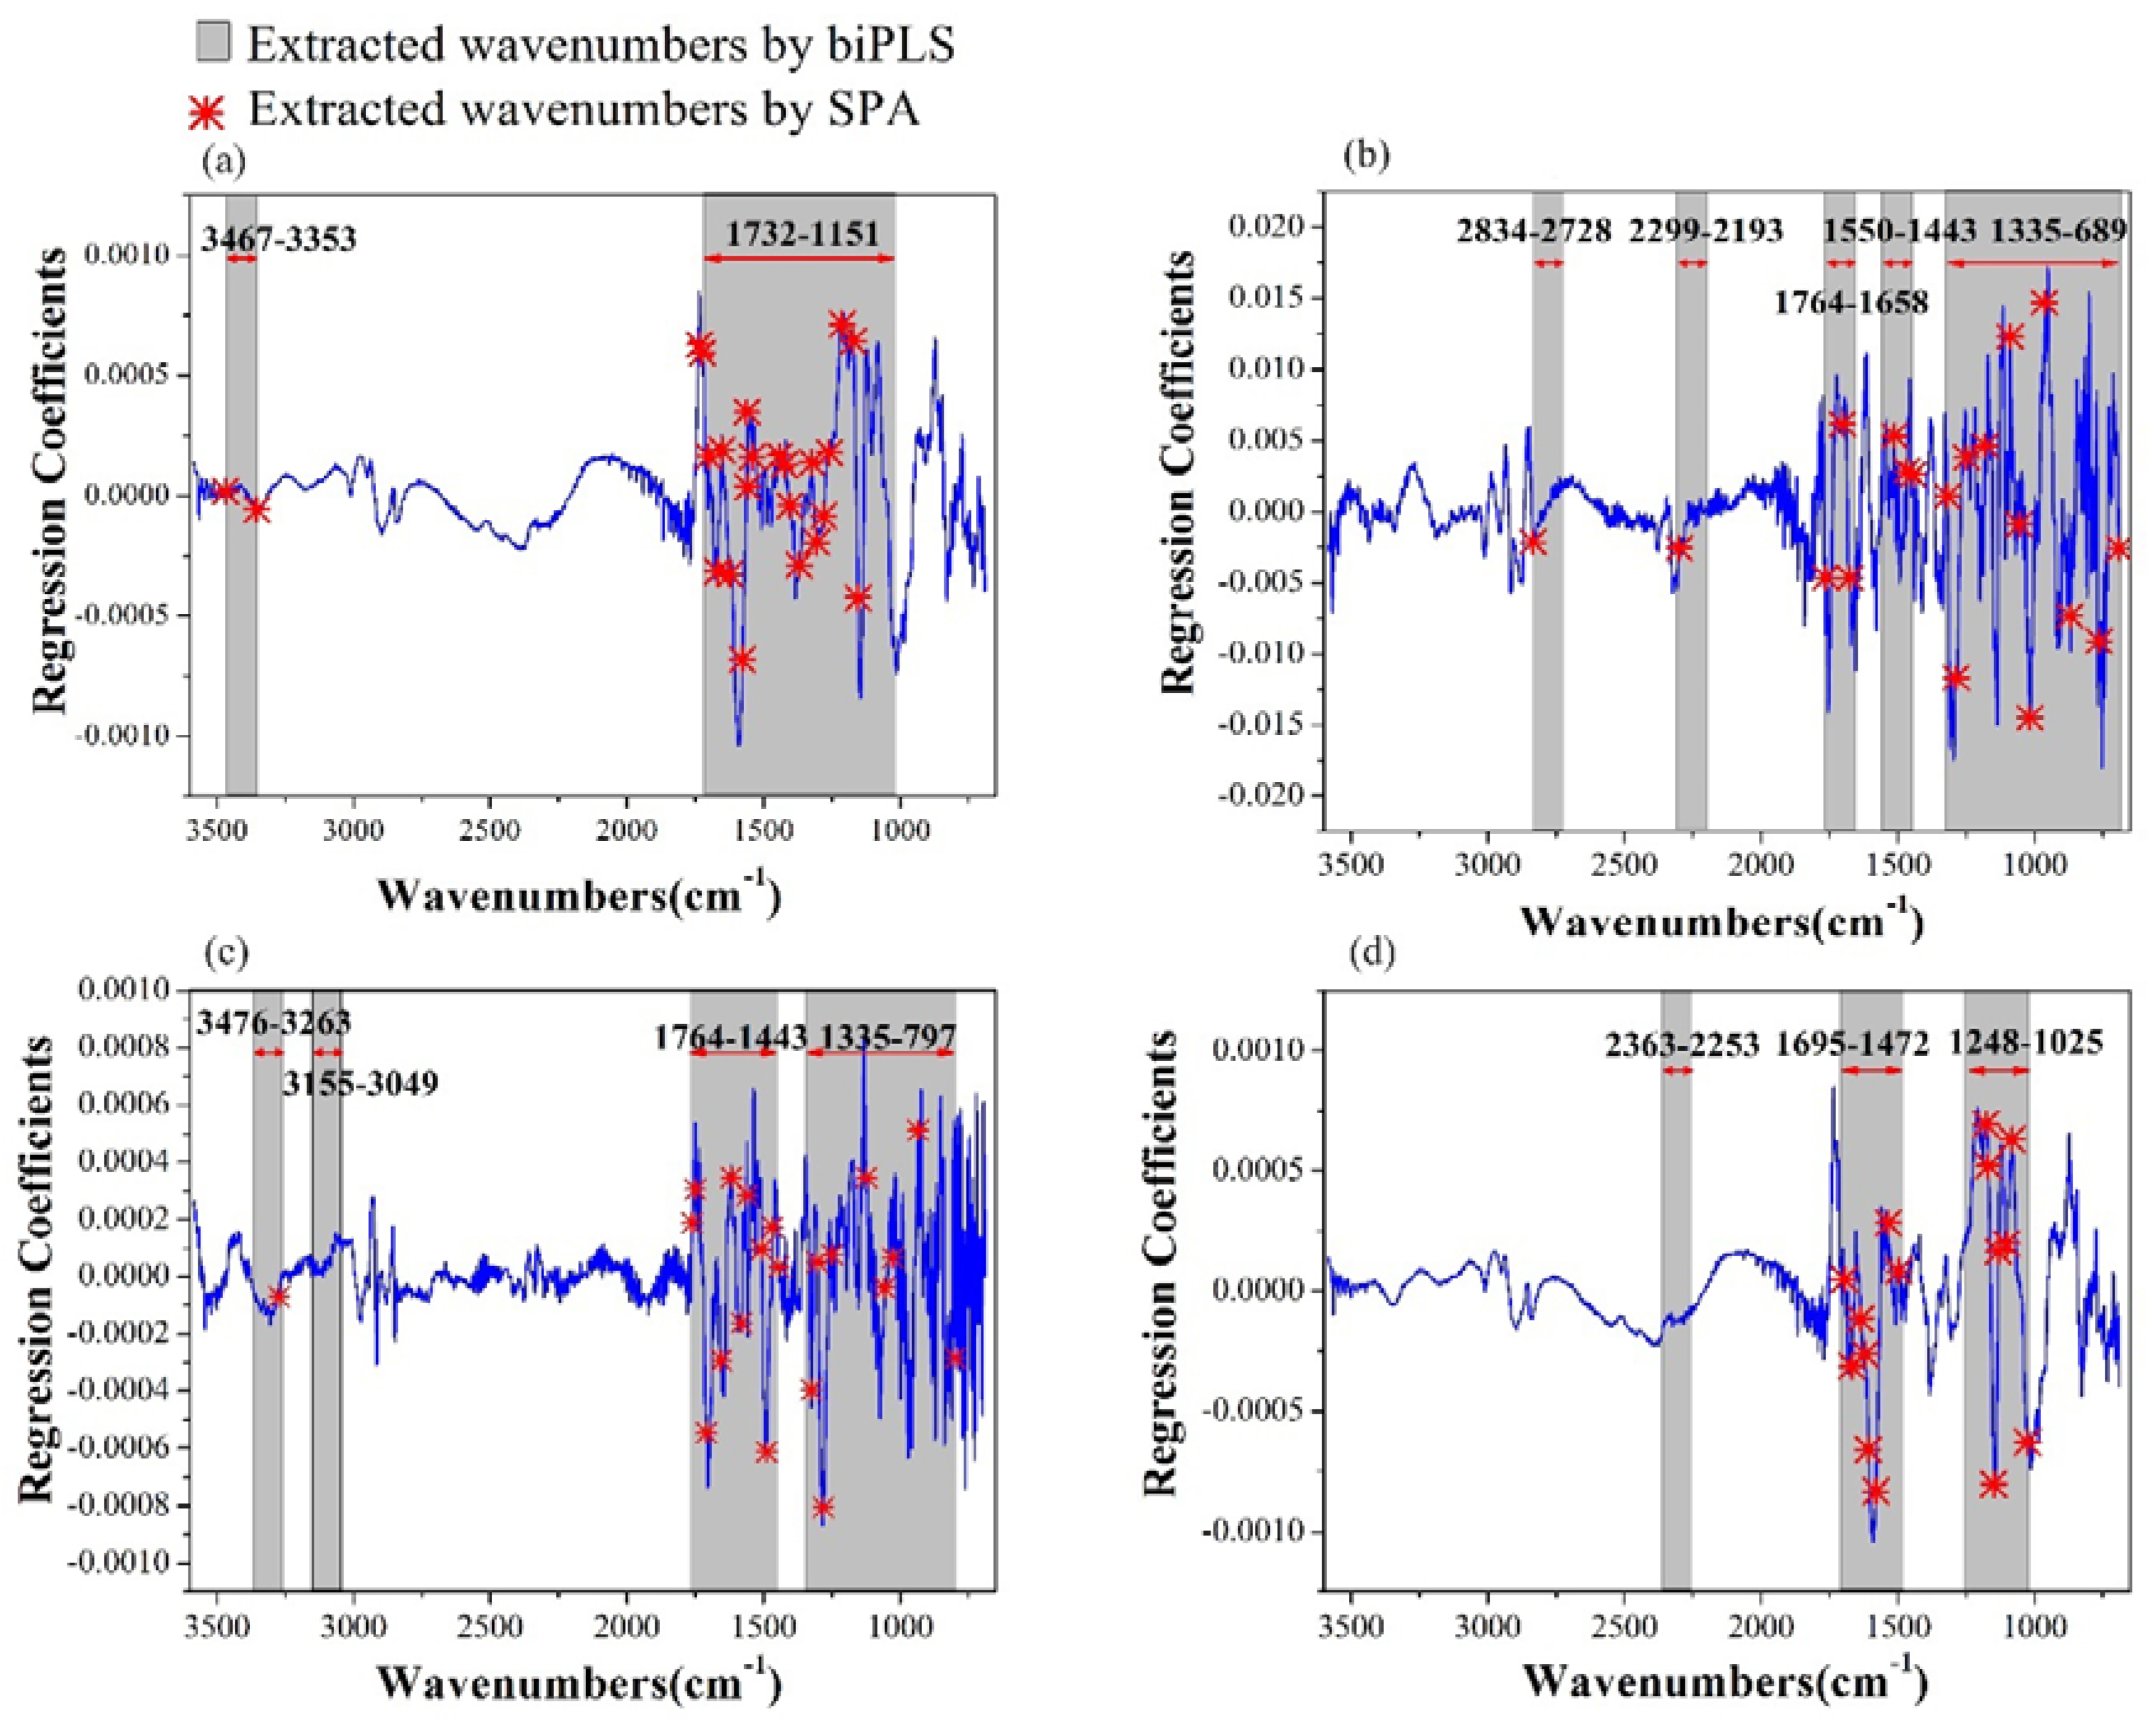
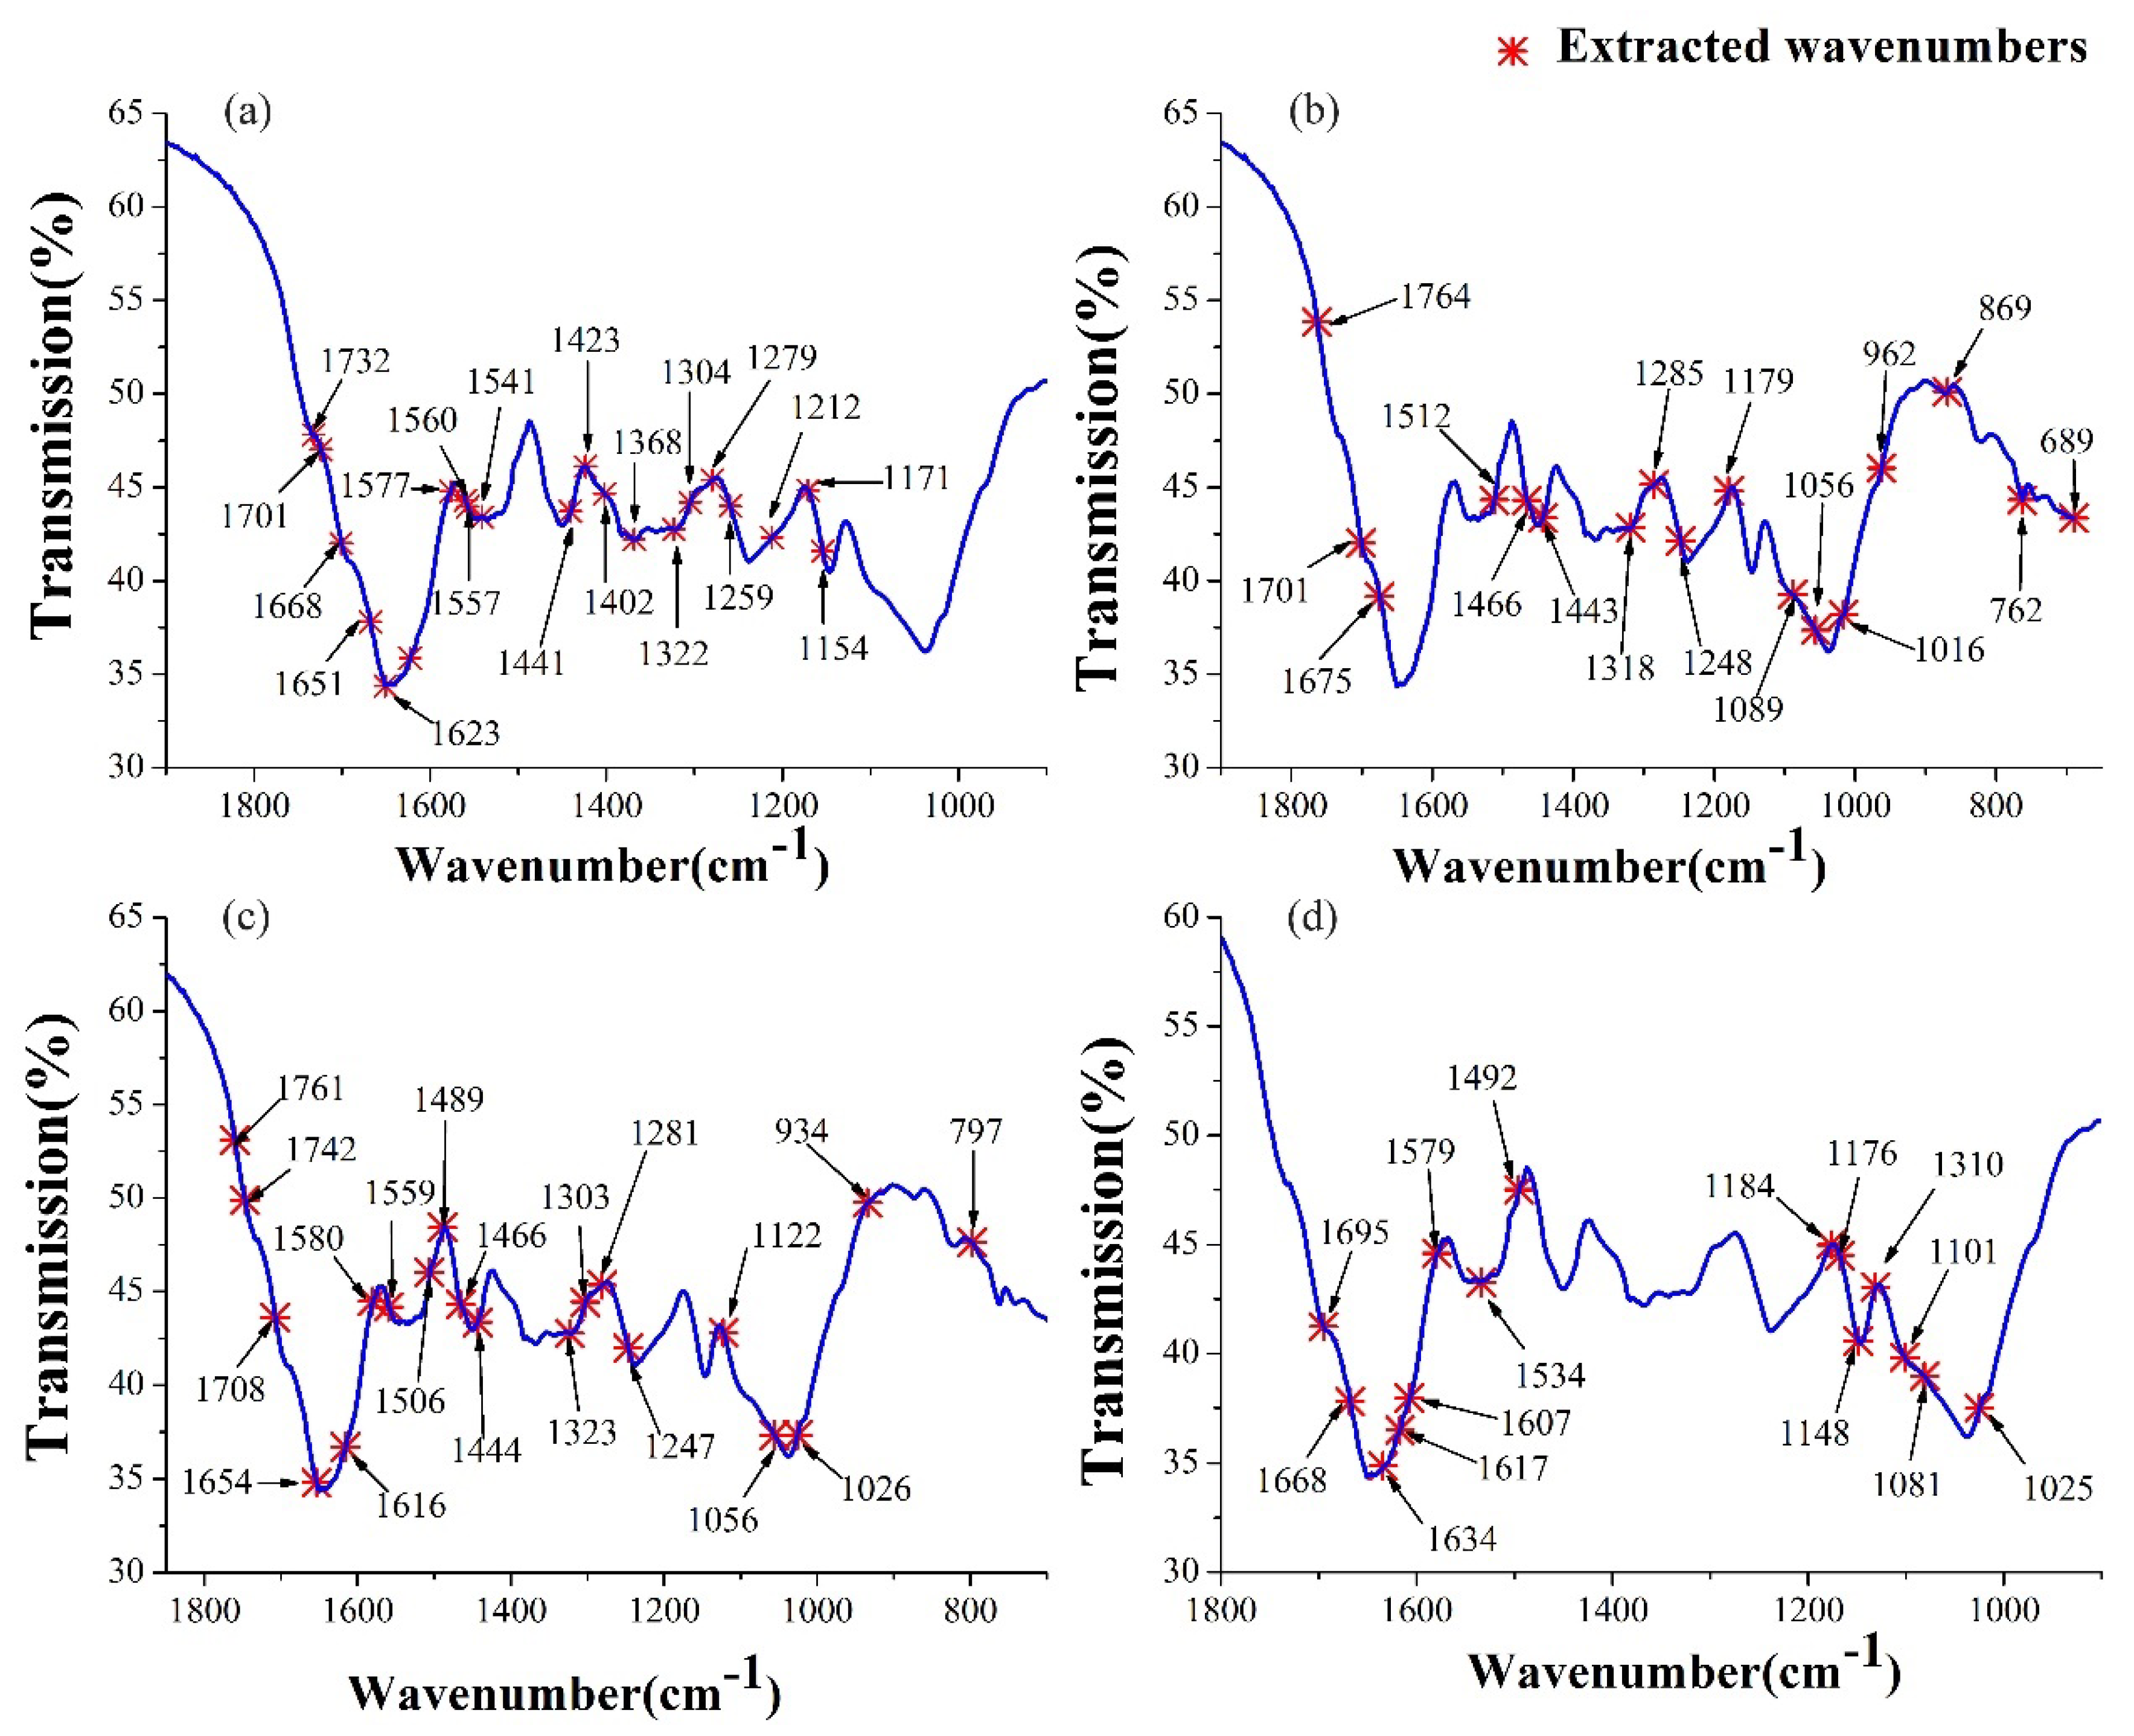
2.3.3. Selection of Characteristic Wavenumbers
2.3.4. Establishment of Nonlinear Determination Models
3. Materials and Methods
3.1. Sample Preparation
3.2. FT–IR Spectroscopy Acquisition
3.3. HPLC Measurement Conditions
3.4. Chemometric Methods
3.4.1. Establishment of Quantitative Determination Models
3.4.2. Extraction of Characteristic Wavenumbers
4. Conclusions
Author Contributions
Acknowledgments
Conflicts of Interest
References
- Panigrahi, N.; Bhol, C.S.; Das, B.S. Rapid assessment of black tea quality using diffuse reflectance spectroscopy. J. Food Eng. 2016, 190, 101–108. [Google Scholar] [CrossRef]
- Lee, J.; Hwang, Y.S.; Kang, I.K.; Choung, M.G. Lipophilic pigments differentially respond to drying methods in tea (Camellia sinensis, L.) leaves. LWT-Food Sci. Technol. 2014, 61, 201–208. [Google Scholar] [CrossRef]
- Karcz, D.; Boroń, B.; Matwijczuk, A.; Furso, J.; Staroń, J.; Ratuszna, A.; Fiedor, L. Lessons from chlorophylls: Modifications of porphyrinoids towards optimized solar energy conversion. Molecules 2014, 19, 15938–15954. [Google Scholar] [CrossRef] [PubMed]
- Ngamwonglumlert, L.; Devahastin, S.; Chiewchan, N. Molecular structure, stability and cytotoxicity of natural green colorants produced from Centella asiatica L. leaves treated by steaming and metal complexations. Food Chem. 2017, 232, 387–394. [Google Scholar] [CrossRef] [PubMed]
- Sano, Y.; Endo, K.; Tomo, T.; Noguchi, T. Modified molecular interactions of the pheophytin and plastoquinone electron acceptors in photosystem II of chlorophyll d-containing acaryochloris marina as revealed by FTIR spectroscopy. Photosynth. Res. 2015, 125, 105–114. [Google Scholar] [CrossRef] [PubMed]
- Hörtensteiner, S.; Kräutler, B. Chlorophyll breakdown in higher plants. BBA-Bioenergetics 2011, 1807, 977–988. [Google Scholar] [CrossRef] [PubMed]
- Kusmita, L.; Puspitaningrum, I.; Limantara, L. Identification, isolation and antioxidant activity of pheophytin from green tea (Camellia sinensis, (L.) Kuntze). Procedia Chem. 2015, 14, 232–238. [Google Scholar] [CrossRef]
- Kang, Y.R.; Park, J.; Jung, S.K.; Chang, Y.H. Synthesis, characterization, and functional properties of chlorophylls, pheophytins, and Zn-pheophytins. Food Chem. 2017, 245, 943–950. [Google Scholar] [CrossRef] [PubMed]
- Seifert, B.; Zude-Sasse, M. High hydrostatic pressure effects on spectral-optical variables of the chlorophyll pool in climacteric fruit. LWT-Food Sci. Technol. 2016, 73, 303–310. [Google Scholar] [CrossRef]
- Lu, J.L.; Pan, S.S.; Zheng, X.Q.; Dong, J.J.; Borthakur, D.; Liang, Y.R. Effects of lipophillic pigments on colour of the green tea infusion. Int. J. Food Sci. Technol. 2009, 44, 2505–2511. [Google Scholar] [CrossRef]
- Sai, V.; Chaturvedula, P.; Prakash, I. The aroma, taste, color and bioactive constituents of tea. J. Med. Plants Res. 2011, 5, 2110–2124. [Google Scholar]
- Diniz, P.H.G.D.; Pistonesi, M.F.; Alvarez, M.B.; Band, B.S.F.; Araújo, M.C.U.D. Simplified tea classification based on a reduced chemical composition profile via, successive projections algorithm linear discriminant analysis (SPA-LDA). J. Food Compos. Anal. 2015, 39, 103–110. [Google Scholar] [CrossRef]
- Lafeuille, J.L.; Lefèvre, S.; Lebuhotel, J. Quantitation of chlorophylls and 22 of their colored degradation products in culinary aromatic herbs by HPLC-DAD-MS and correlation with color changes during the dehydration process. J. Agric. Food Chem. 2014, 62, 1926–1935. [Google Scholar] [CrossRef] [PubMed]
- Owuor, P.O.; Obanda, M.; Nyirenda, H.E.; Mandala, W.L. Influence of region of production on clonal black tea chemical characteristics. Food Chem. 2008, 108, 263–271. [Google Scholar] [CrossRef]
- Moreda-Piñeiro, A.; Fisher, A.; Hill, S.J. The classification of tea according to region of origin using pattern recognition techniques and trace metal data. J. Food Compos. Anal. 2003, 16, 195–211. [Google Scholar] [CrossRef]
- Li, X.; Sun, C.; Luo, L.; He, Y. Determination of tea polyphenols content by infrared spectroscopy coupled with ipls and random frog techniques. Comput. Electron. Agric. 2015, 112, 28–35. [Google Scholar] [CrossRef]
- Paradkar, M.M.; Irudayaraj, J. A rapid FTIR spectroscopic method for estimation of caffeine in soft drinks and total methylxanthines in tea and coffee. J. Food Sci. 2002, 67, 2507–2511. [Google Scholar] [CrossRef]
- Chen, Q.S.; Zhao, J.W.; Hao, L. Study on discrimination of roast green tea (Camellia sinensis L.) according to geographical origin by FT-NIR spectroscopy and supervised pattern recognition. Spectrochim. Acta A 2009, 72, 845–850. [Google Scholar] [CrossRef] [PubMed]
- Dey, A.K.; Sharma, M.; Meshram, M.R. An analysis of leaf chlorophyll measurement method using chlorophyll meter and image processing technique. Procedia Comput. Sci. 2016, 85, 286–292. [Google Scholar] [CrossRef]
- Bunghez, I.R.; Raduly, M.; Doncea, S.; Aksahin, I.; Ion, R.M. Lycopene determination in tomatoes by different spectral techniques (UV–VIS, FTIR and HPLC). Dig. J. Nanomater. Biostruct. 2011, 6, 1349–1356. [Google Scholar]
- Hashimoto, A.; Yamanaka, A.; Kanou, M.; Nakanishi, K.; Kameoka, T. Simple and rapid determination of metabolite content in plant cell culture medium using an FT–IR/ATR method. Bioprocess Biosyst. Eng. 2005, 27, 115–123. [Google Scholar] [CrossRef] [PubMed]
- Revelou, P.K.; Kokotou, M.G.; Pappas, C.S.; Constantinou-Kokotou, V. Direct determination of total isothiocyanate content in broccoli using attenuated total reflectance infrared Fourier transform spectroscopy. J. Food Compos. Anal. 2017, 61, 47–51. [Google Scholar] [CrossRef]
- Wang, R.; Sivakumar, V.; Johnson, T.W.; Hastings, G. FTIR difference spectroscopy in combination with isotope labeling for identification of the carbonyl modes of p700 and p700 in photosystem I. Biophys. J. 2004, 86, 1061–1073. [Google Scholar] [CrossRef]
- Rather, L.J.; Shahid-ul-Islam; Shabbir, M.; Bukhari, M.N.; Shahid, M.; Khan, M.A.; Mohammad, F. Ecological dyeing of woolen yarn with adhatoda vasica, natural dye in the presence of biomordants as an alternative copartner to metal mordants. J. Environ. Chem. Eng. 2016, 4, 3041–3049. [Google Scholar] [CrossRef]
- Jing, Z.; Aipeng, D.; Yang, Y.; Lihu, G.; Na, X.; Xin, L.; Hu, L.; Chen, J.; Yang, S. HPLC detection of loss rate and cell migration of HUVECs in a proanthocyanidin cross-linked recombinant human collagen-peptide (RHC)-chitosan scaffold. Mat. Sci. Eng. C 2015, 56, 555–563. [Google Scholar] [CrossRef]
- Marshall, C.P.; Javaux, E.J.; Knoll, A.H.; Walter, M.R. Combined micro-Fourier transform infrared (FTIR) spectroscopy and micro-Raman spectroscopy of Proterozoic acritarchs: A new approach to Palaeobiology. Precambrian Res. 2005, 138, 208–224. [Google Scholar] [CrossRef]
- Lu, R.; Gan, W.; Wu, B.H.; Zhang, Z.; Guo, Y.; Wang, H.F. C-H stretching vibrations of methyl, methylene and methine groups at the vapor/alcohol (N = 1–8) interfaces. J. Phys. Chem. B 2005, 109, 14118–14129. [Google Scholar] [CrossRef] [PubMed]
- Bona, M.T.; Andrés, J.M. Reflection and transmission mid-infrared spectroscopy for rapid determination of coal properties by multivariate analysis. Talanta 2008, 74, 998–1007. [Google Scholar] [CrossRef] [PubMed]
- Murdock, J.N.; Wetzel, D.L. FT–IR microspectroscopy enhances biological and ecological analysis of algae. Appl. Spectrosc. Rev. 2009, 44, 335–361. [Google Scholar] [CrossRef]
- Holt, A.S.; Jacobs, E.E. Infra-Red Absorption Spectra of Chlorophylls and Derivatives. Plant Physiol. 1955, 30, 553–559. [Google Scholar] [CrossRef] [PubMed]
- Pachaiappan, R. Attenuated Total Reflection Fourier Transform Infrared (ATR-FTIR) in the discrimination of normal and oral cancer blood plasma. In Proceedings of the SPIE BiOS, San Francisco, CA, USA, 17 February 2017; p. 100601. [Google Scholar] [CrossRef]
- Stelling, A.L.; Toher, D.; Uckermann, O.; Tavkin, J.; Leipnitz, E.; Schweizer, J.; Cramm, H.; Steiner, G.; Geiger, K.D.; Kirsch, M. Infrared Spectroscopic Studies of Cells and Tissues: Triple Helix Proteins as a Potential Biomarker for Tumors. PLoS ONE 2013, 8, e58332. [Google Scholar] [CrossRef] [PubMed]
- Thygesen, L.G.; Løkke, M.M.; Micklander, E.; Engelsen, S.B. Vibrational microspectroscopy of food. Raman vs. FT–IR. Trends Food Sci. Technol. 2003, 14, 50–57. [Google Scholar] [CrossRef]
- Deng, S.; Xu, Y.; Li, X.; He, Y. Moisture content prediction in tealeaf with near infrared hyperspectral imaging. Comput. Electron. Agric. 2015, 118, 38–46. [Google Scholar] [CrossRef]
- Li, X.; Luo, L.; He, Y.; Xu, N. Determination of dry matter content of tea by near and middle infrared spectroscopy coupled with wavelet-based data mining algorithms. Comput. Electron. Agric. 2013, 98, 46–53. [Google Scholar] [CrossRef]
- Zhang, C.; Xu, N.; Luo, L.; Liu, F.; Kong, W.; Feng, L.; He, Y. Detection of aspartic acid in fermented Cordyceps powder using near infrared spectroscopy based on variable selection algorithms and multivariate calibration methods. Food Bioprocess Technol. 2014, 7, 598–604. [Google Scholar] [CrossRef]
- Viscarra Rossel, R.A.; McGlynn, R.N.; McBratbey, A.B. Determining the composition of mineral-organic mixes using UV–vis-NIR diffuse reflectance spectroscopy. Geoderma 2006, 137, 70–82. [Google Scholar] [CrossRef]
- Takayama, T.; Uchida, A.; Sekine, H.; Fukuhara, K.; Yoshida, K.; Kashimu, O.; Muljono, S.; Arief, D.; Evri, M.; Sadly, M. Validation of biPLS for improving yield estimation of rice paddy from hyperspectral data in West Java, Indonesia. In Proceedings of the 2012 IEEE International Geoscience and Remote Sensing Symposium (IGARSS), Munich, Germany, 22–27 July 2012; pp. 6581–6584. [Google Scholar] [CrossRef]
- Ji, G.; Huang, G.; Yang, Z.; Wu, X.; Chen, X.; Yuan, M. Using consensus interval partial least square in near infrared spectra analysis. Chemom. Intell. Lab. 2015, 144, 56–62. [Google Scholar] [CrossRef]
Sample Availability: Samples of the compounds chlorophyll-a, chlorophyll-b, pheophytin-a and pheophytin-b are available from the authors. |


| Sample Set | Pigment | Mean (μg/g) | SD (μg/g) | Range (μg/g) |
|---|---|---|---|---|
| Training | Chl-b | 57.98 | 30.32 | 7.50–104.06 |
| Chl-a | 20.58 | 15.23 | 1.19–53.61 | |
| Phe-b | 19.28 | 4.72 | 13.19–34.41 | |
| Phe-a | 88.92 | 29.53 | 28.84–120.96 | |
| Prediction | Chl-b | 51.93 | 29.57 | 7.51–103.11 |
| Chl-a | 21.79 | 15.18 | 1.20–52.01 | |
| Phe-b | 20.39 | 5.38 | 13.19–34.31 | |
| Phe-a | 85.12 | 28.52 | 30.33–118.11 |
| Pigment | Model | Pretreatment | Validation | Prediction | ||
|---|---|---|---|---|---|---|
| RMSEV (μg/g) | R2V | RMSEP (μg/g) | R2P | |||
| Chl-b | 1-A | Ori | 9.69 | 0.90 | 14.86 | 0.74 |
| SNV | 9.55 | 0.90 | 14.38 | 0.76 | ||
| Chl-a | 1-B | Ori | 4.16 | 0.92 | 7.92 | 0.74 |
| SNV | 4.46 | 0.91 | 7.05 | 0.78 | ||
| Phe-b | 1-C | Ori | 1.95 | 0.83 | 1.87 | 0.88 |
| SNV | 1.85 | 0.86 | 1.62 | 0.91 | ||
| Phe-a | 1-D | Ori | 11.40 | 0.83 | 9.49 | 0.89 |
| SNV | 8.73 | 0.92 | 9.23 | 0.89 | ||
| Set | Model | 2-A | 2-B | 2-C | 2-D |
|---|---|---|---|---|---|
| Pigment | Chl-b | Chl-a | Phe-b | Phe-a | |
| Wavenumbers | 720 | 1115 | 1225 | 579 | |
| Validation | RMSEC (μg/g) | 8.43 | 4.44 | 1.60 | 7.32 |
| R2V | 0.92 | 0.92 | 0.89 | 0.94 | |
| Prediction | RMSEP (μg/g) | 13.30 | 6.98 | 1.64 | 12.17 |
| R2P | 0.80 | 0.78 | 0.91 | 0.81 | |
| RPD | 2.22 | 2.16 | 3.23 | 2.34 |
| Set | Model | 3-A | 3-B | 3-C | 3-D |
|---|---|---|---|---|---|
| Pigment | Chl-b | Chl-a | Phe-b | Phe-a | |
| Wavenumbers | 19 | 19 | 21 | 14 | |
| Validation | RMSEC (μg/g) | 8.70 | 5.28 | 1.89 | 8.15 |
| R2V | 0.92 | 0.88 | 0.85 | 0.92 | |
| Prediction | RMSEP (μg/g) | 11.94 | 8.38 | 2.12 | 9.76 |
| R2P | 0.83 | 0.68 | 0.84 | 0.88 | |
| RPD | 2.47 | 1.80 | 2.50 | 2.92 |
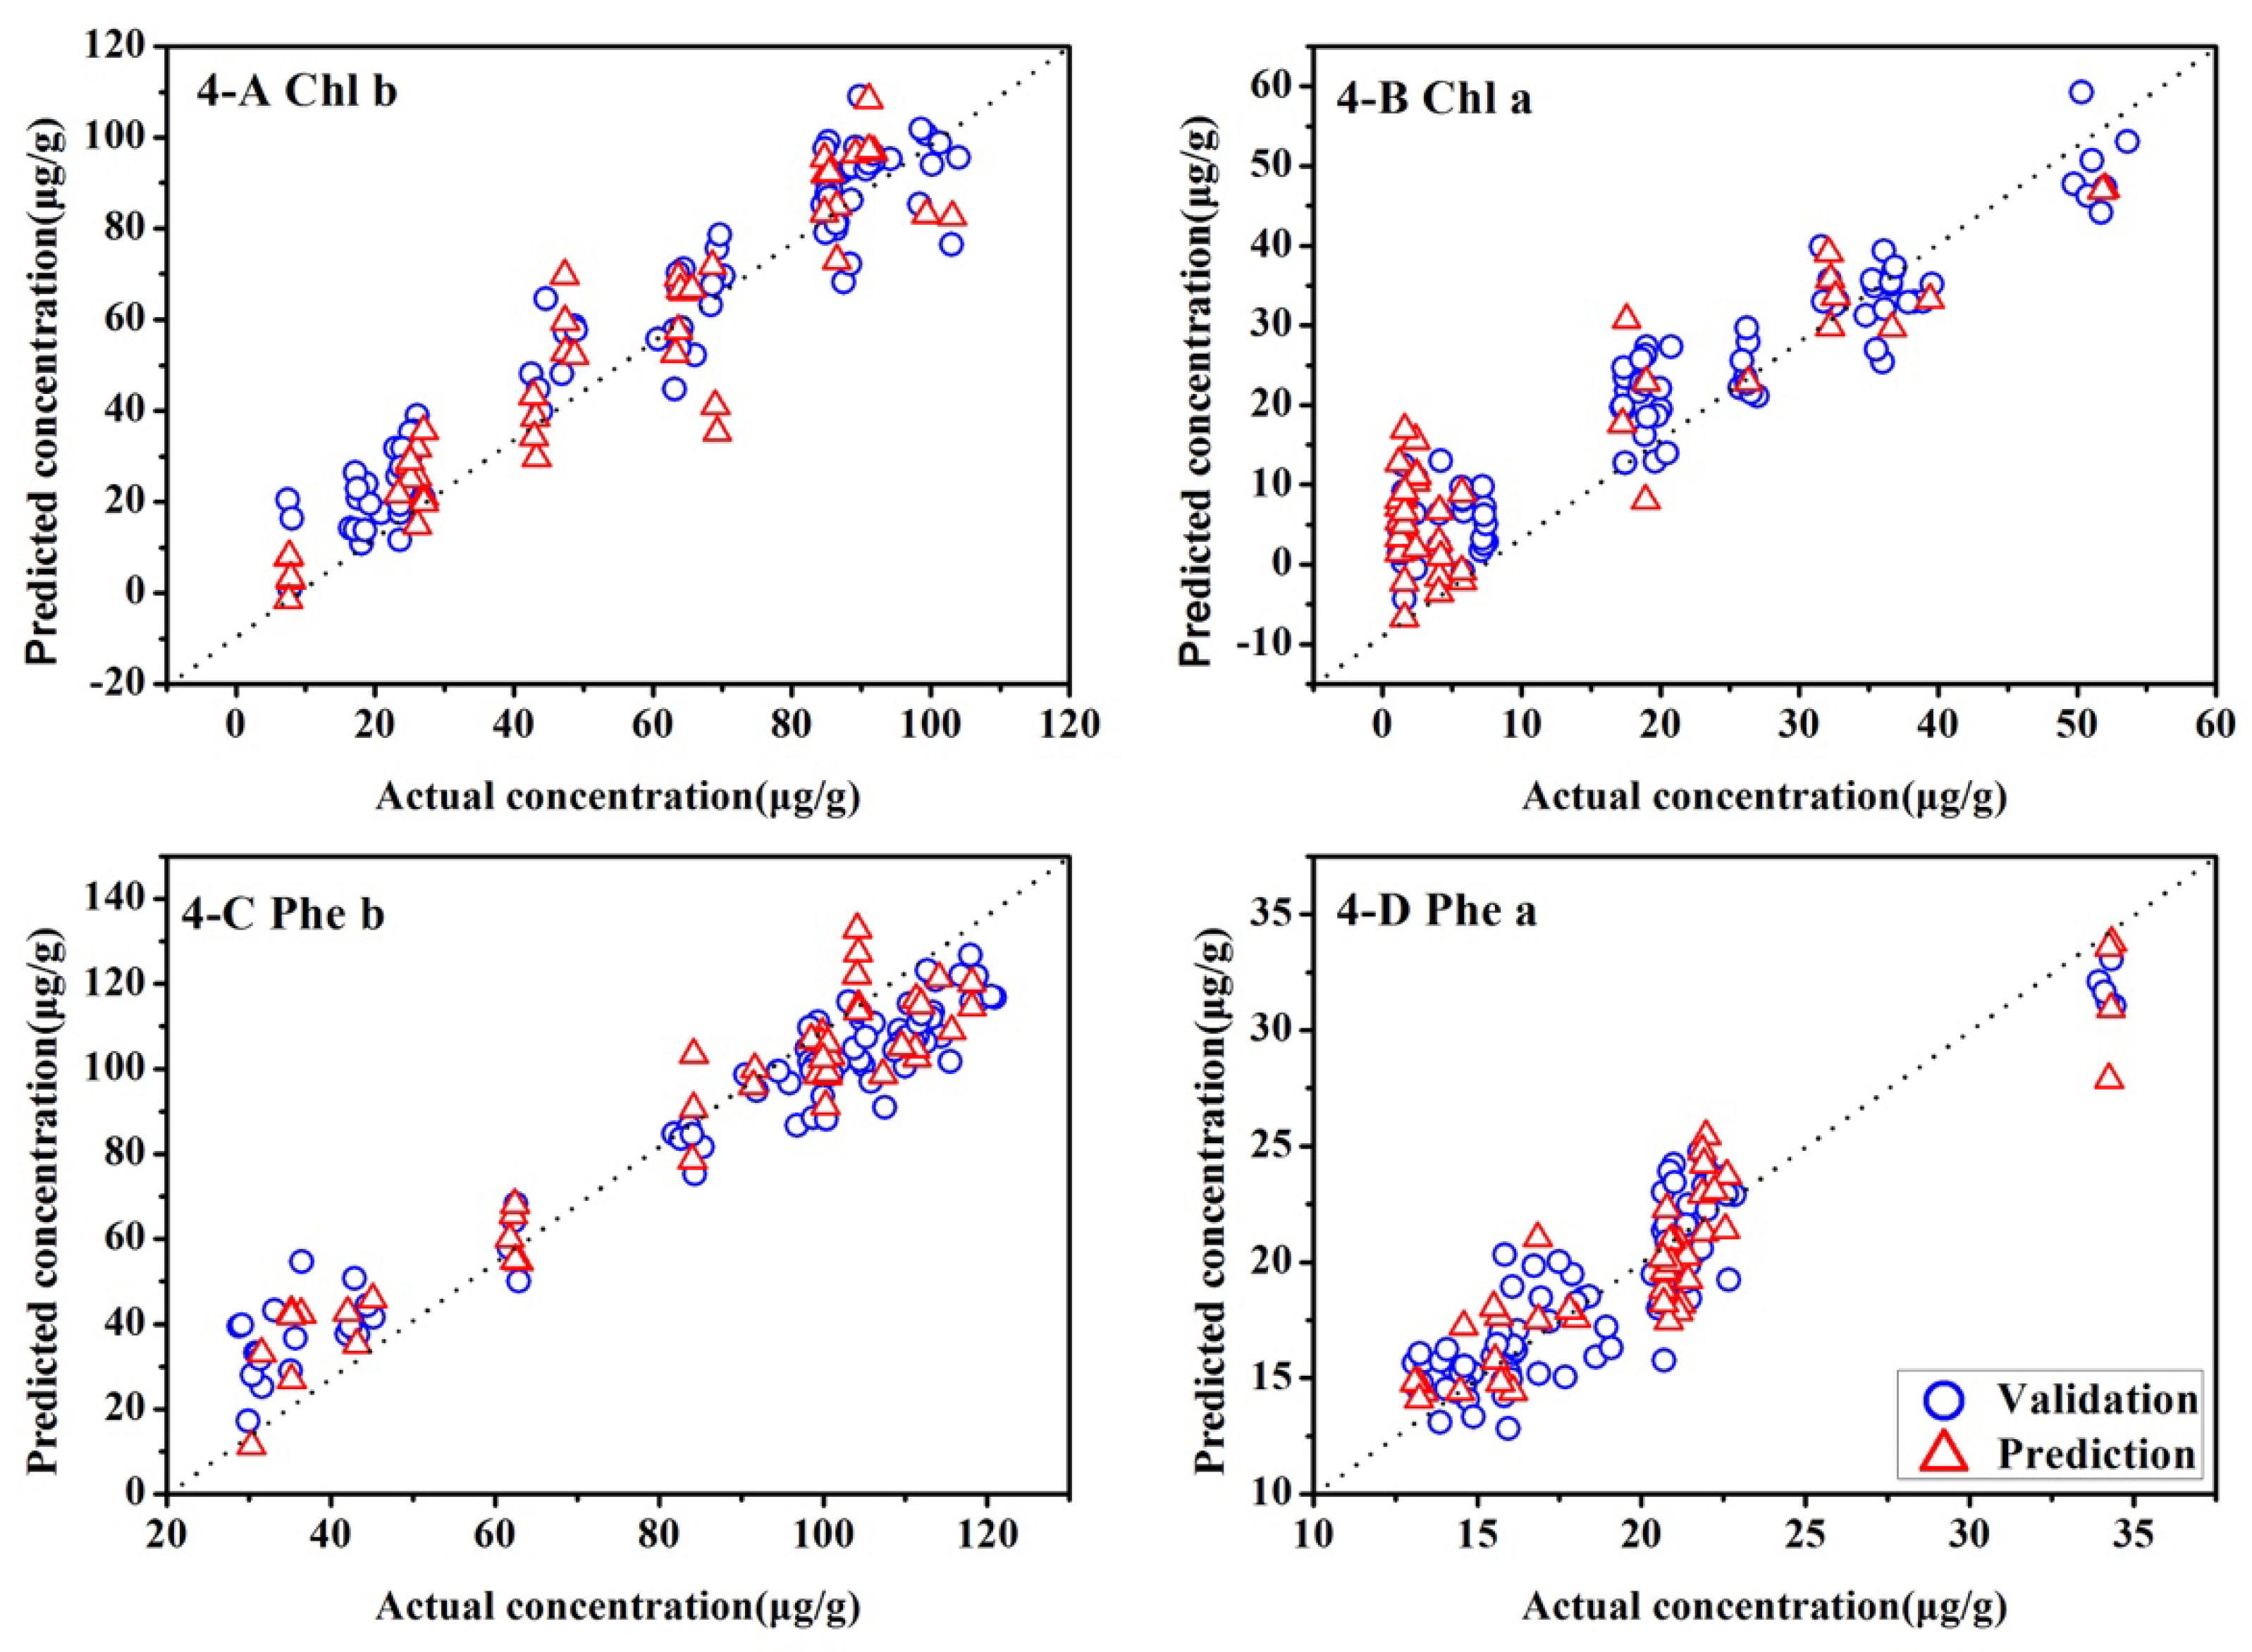
| Set | Model | 4-A | 4-B | 4-C | 4-D |
|---|---|---|---|---|---|
| Pigment | Chl-b | Chl-a | Phe-b | Phe-a | |
| Wavenumbers | 19 | 19 | 21 | 14 | |
| Validation | RMSEC (μg/g) | 8.30 | 4.61 | 1.89 | 6.64 |
| R2V | 0.93 | 0.91 | 0.84 | 0.95 | |
| Prediction | RMSEP (μg/g) | 10.66 | 6.69 | 2.02 | 9.28 |
| R2P | 0.87 | 0.80 | 0.85 | 0.89 | |
| RPD | 2.77 | 2.26 | 2.62 | 3.07 | |
| Slope | 1.00 | 0.83 | 0.82 | 1.07 | |
| Bias | 1.46 | 3.44 | 3.49 | -3.41 |
© 2018 by the authors. Licensee MDPI, Basel, Switzerland. This article is an open access article distributed under the terms and conditions of the Creative Commons Attribution (CC BY) license (http://creativecommons.org/licenses/by/4.0/).
Share and Cite
Li, X.; Zhou, R.; Xu, K.; Xu, J.; Jin, J.; Fang, H.; He, Y. Rapid Determination of Chlorophyll and Pheophytin in Green Tea Using Fourier Transform Infrared Spectroscopy. Molecules 2018, 23, 1010. https://doi.org/10.3390/molecules23051010
Li X, Zhou R, Xu K, Xu J, Jin J, Fang H, He Y. Rapid Determination of Chlorophyll and Pheophytin in Green Tea Using Fourier Transform Infrared Spectroscopy. Molecules. 2018; 23(5):1010. https://doi.org/10.3390/molecules23051010
Chicago/Turabian StyleLi, Xiaoli, Ruiqing Zhou, Kaiwen Xu, Jie Xu, Juanjuan Jin, Hui Fang, and Yong He. 2018. "Rapid Determination of Chlorophyll and Pheophytin in Green Tea Using Fourier Transform Infrared Spectroscopy" Molecules 23, no. 5: 1010. https://doi.org/10.3390/molecules23051010
APA StyleLi, X., Zhou, R., Xu, K., Xu, J., Jin, J., Fang, H., & He, Y. (2018). Rapid Determination of Chlorophyll and Pheophytin in Green Tea Using Fourier Transform Infrared Spectroscopy. Molecules, 23(5), 1010. https://doi.org/10.3390/molecules23051010