Article

A Unique and Simple Approach to Improve Sensitivity in 15N-NMR Relaxation Measurements for NH3+ Groups: Application to a Protein-DNA Complex

1
Department of Biochemistry and Molecular Biology, Sealy Center for Structural Biology and Molecular Biophysics, University of Texas Medical Branch, Galveston, TX 77555, USA
2
McGovern Medical School, Brown Foundation Institute of Molecular Medicine for the Prevention of Human Diseases, University of Texas Health Science Center, Houston, TX 77030, USA
*
Author to whom correspondence should be addressed.
Molecules 2017, 22(8), 1355; https://doi.org/10.3390/molecules22081355
Submission received: 28 July 2017 / Revised: 11 August 2017 / Accepted: 11 August 2017 / Published: 15 August 2017
(This article belongs to the Special Issue Recent Advances in Biomolecular NMR Spectroscopy)

Abstract

:
NMR spectroscopy is a powerful tool for research on protein dynamics. In the past decade, there has been significant progress in the development of NMR methods for studying charged side chains. In particular, NMR methods for lysine side-chain NH3+ groups have been proven to be powerful for investigating the dynamics of hydrogen bonds or ion pairs that play important roles in biological processes. However, relatively low sensitivity has been a major practical issue in NMR experiments on NH3+ groups. In this paper, we present a unique and simple approach to improve sensitivity in 15N relaxation measurements for NH3+ groups. In this approach, the efficiency of coherence transfers for the desired components are maximized, whereas undesired anti-phase or multi-spin order components are purged through pulse schemes and rapid relaxation. For lysine side-chain NH3+ groups of a protein-DNA complex, we compared the data obtained with the previous and new pulse sequences under the same conditions and confirmed that the 15N relaxation parameters were consistent for these datasets. While retaining accuracy in measuring 15N relaxation, our new pulse sequences for NH3+ groups allowed an 82% increase in detection sensitivity of 15N longitudinal and transverse relaxation measurements.

1. Introduction

NMR spectroscopy is one of the most powerful techniques for studying protein dynamics. NMR studies have revealed the functional importance of structural dynamics in many biological molecular processes of proteins (e.g., reviewed in Refs [1,2,3,4,5,6,7,8]). While the vast majority of NMR investigations of protein dynamics have probed motions of either backbone NH or side-chain CH3 groups, NMR investigations on polar or charged side chains remain rare. Recently, there has been significant progress in NMR methods for investigating the dynamics of charged side chains of proteins [9,10,11,12,13,14,15,16,17]. In particular, NMR methods for Lys side-chain NH3+ groups have proven to be extremely useful for investigating the dynamics of hydrogen bonding and/or ion pairing [14,15,16,17,18,19,20,21,22,23,24,25].
Lys side-chain NH3+ groups of proteins undergo rapid hydrogen exchange with water [26,27,28]. As a result of this rapid hydrogen exchange, signals from NH3+ groups in 1H-15N heteronuclear single-quantum coherence (HSQC) and heteronuclear multiple-quantum coherence (HMQC) spectra are severely broadened [26]. Importantly, this broadening occurs not only in the 1H dimension but also in the 15N dimension, because rapid hydrogen exchange greatly enhances scalar relaxation of 15N transverse coherence anti-phase with respect to 1H (e.g., 2NxHz, 4NyHzHz, and 8NxHzHzHz).
To avoid this problem, Iwahara et al. developed NH3+-selective heteronuclear in-phase single-quantum coherence (HISQC) and its derivatives [26]. In the HISQC experiment, the in-phase single quantum term Nx or Ny is created at the beginning of the 15N evolution period, and in-phase single-quantum coherence N+ (= Nx + iNy) is maintained via the 1H WALTZ decoupling scheme throughout the evolution period. Evolutions to the anti-phase terms such as 2N+Hz, 4N+HzHz, and 8N+HzHzHz are suppressed to remove the impact of scalar relaxation on line shape of 15N resonances. Scalar relaxation arises from auto-relaxation of the coupled 1H nuclei [29,30], and substantially increases the relaxation rates of the 2N+Hz, 4N+HzHz, and 8N+HzHzHz terms, compared to the relaxation rates of N+. The scalar relaxation rate Rsc for each 1H nucleus is given by [26]:
R s c = ρ H H + k e x w a t e r
where ρHH is the rate for dipole-dipole relaxation with external 1H nuclei and k e x w a t e r is the rate for hydrogen exchange with water. Scalar relaxation rates for the N+, 2N+Hz, 4N+HzHz, and 8N+HzHzHz terms are 0, Rsc, 2Rsc, and 3Rsc, respectively [31]. Typically, hydrogen exchange is much faster than ρHH rates and intrinsic 15N relaxation rates for NH3+ groups [14,15,16,26]. Therefore, rapid hydrogen exchange governs relaxation of the anti-phase terms through the scalar relaxation mechanism and severely broadens 15N line shapes of NH3+ signals in typical 2D 1H-15N correlation spectra. By maintaining in-phase single-quantum terms Nx and Ny, and thereby removing the scalar relaxation from the t1 time domain for the 15N dimension, the HISQC experiment drastically improved observation of 1H-15N cross peaks from NH3+ groups in sensitivity and resolution [26]. Since then, many NMR pulse sequences for NH3+ groups have implemented the principle of HISQC, and minimized the adverse impacts of scalar relaxation of anti-phase terms with respect to 1H nuclei [14,15,16,17,26,32].
Nevertheless, relatively low sensitivity due to rapid hydrogen exchange has been a major practical problem in NMR experiments for Lys side-chain NH3+ groups of proteins. While some side-chain NH3+ groups exhibit relatively slow hydrogen-exchange rates due to hydrogen bonds or ion pairs [26,33], many other NH3+ groups exhibit very rapid hydrogen-exchange rates that severely broaden 1H resonances. Due to this problem, NMR experiments on protein side-chain NH3+ groups are often conducted at relatively low pH (typically pH 4.5–6.0) and low temperature (typically, 2–25 °C) to observe a larger number of signals with stronger intensity [32,34]. In these NMR experiments, co-axial NMR tubes that separate lock solvent (usually, D2O) from a sample solution are typically used to avoid isotopically different species (i.e., NDH2+, and ND2H+, and ND3+) of NH3+ groups. The use of co-axial tubes further decreases sensitivity due to a smaller sample volume and multilayer glass walls. Thus, sensitivity improvement would be desirable for NMR experiments on NH3+ groups, especially for quantitative experiments such as 15N relaxation measurements.
To address these practical needs, we present a unique and simple approach to improve sensitivity in 15N relaxation measurements on protein side-chain NH3+ groups. Our approach involves only minor modifications of the existing pulse sequences. Nevertheless, the pulse sequences implementing this approach significantly improve the detection sensitivity, while maintaining the accuracy in the 15N relaxation measurements on NH3+ groups.

2. Results

Figure 1 shows the optimized NMR pulse sequences for measuring 15N R1 and R2 relaxation and heteronuclear NOE of NH3+ groups. In the description below, using the product operator formalism [35] for AX3 spin systems, we first explain the previous approach that resolves problems arising from undesired anti-phase or multi-spin-order components of 15N magnetizations of NH3+ groups in 15N relaxation measurements. Then, we describe our new approach to improving sensitivity and eliminating undesired components in 15N relaxation measurements, showing data that demonstrate the effectiveness of this approach.

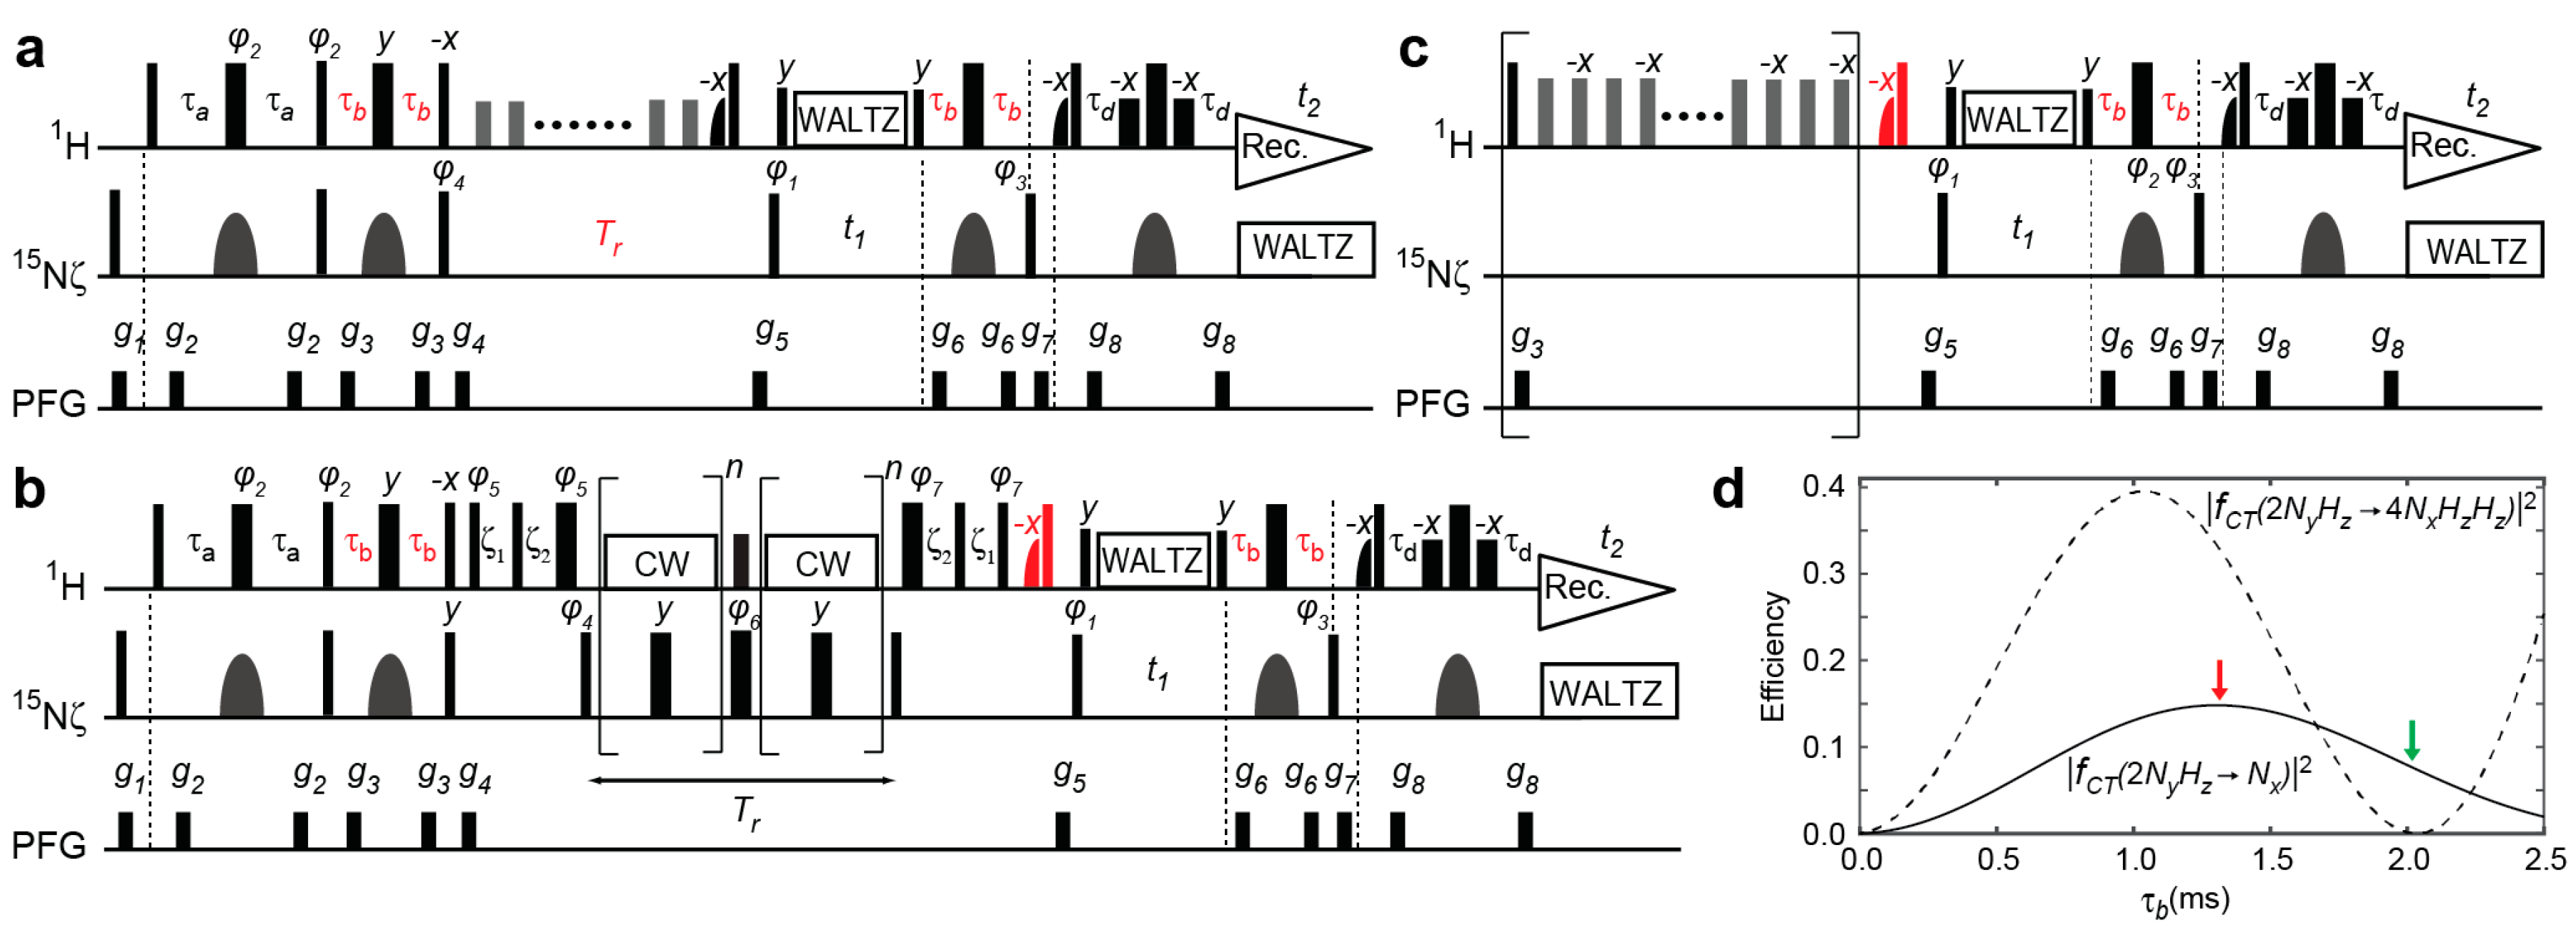
2.1. Previous and Current Approaches to Eliminating the Adverse Effects of Multi-Spin Order Terms

The first step for measuring 15N longitudinal (R1) and transverse (R2) relaxation rates is to create the 15N in-phase single-quantum term via coherence transfer from 1H to 15N nuclei through a refocused INEPT scheme [39]. With regard to NH3+ groups, the product operator terms Nx, 2NyHz, 4NxHzHz, and 8NyHzHzHz are generated in the period of 2τb in the first refocused INEPT scheme of our pulse sequence for 15N R1 and R2 measurements (Figure 1a,b). Because the only term of interest among them is Nx, any effects of the other three terms should be eliminated in these relaxation measurements. The 2NyHz and 8NyHzHzHz terms are eliminated by the pulsed field gradient (PFG) g4 after the 1H 90°(−x) and 15N 90°(y) pulses at the end of the refocused INEPT scheme. These 90° pulses convert the Nx and 4NxHzHz terms into Nz and 4NzHyHy, both of which survive the PFG g4. The 4NzHyHy term survives because a PFG alone cannot destroy homonuclear zero-quantum coherence [40]. To avoid any adverse impact of the 4NxHzHz term generated in the refocused INEPT scheme, the previous pulse sequences used a value of the time τb that erases the 4NxHzHz term, but retains the Nx term. This is possible because coherence transfer to these terms depends differently on the time τb. The coefficients of these transfers are given by [39]:
f C T ( 2 N y H z N x ) = cos 2 θ sin θ
f C T ( 2 N y H z 4 N x H z H z ) = ( 3 cos 2 θ 1 ) sin θ
where θ = 2 π J N H τ b and 1JNH represents the one-bond 1H-15N scalar coupling constant. The use of the time τb satisfying 3 cos 2 θ 1 = 0 thus eliminates the 4NxHzHz term, but retains the Nx term [15]. This approach was used for 13C R1 and R2 relaxation measurements for protein CH3 groups as well [41,42]. Because 1JNH is typically ~74 Hz for lysine side-chain NH3+ groups [26], the condition to suppress the 4NxHzHz term was achieved using τb = 2.1 ms in the original pulse sequences [15]. This condition was also used in the second refocused INEPT scheme for backward coherence transfer, so that any coherence transfer from 4NxHzHz to 2NyHz does not contribute to the observed signals. A practical problem in using the condition of f C T ( 2 N y H z 4 N x H z H z ) = 0 is that it also reduces f C T ( 2 N y H z N x ) from its maximum level, and thereby weakens signals in the 15N relaxation measurements for NH3+ groups (Figure 1d).
In the current work, we eliminate the adverse effects of the 4NxHzHz term in a different manner, and maximize f C T ( 2 N y H z N x ) to increase sensitivity in 15N relaxation measurements for NH3+ groups. As shown in Figure 1d, the signal arising from the Nx term should be strongest when τb = 1.3 ms. Although this condition increases the 4NxHzHz term generated through the refocused INEPT scheme, our pulse sequences shown in Figure 1 prevent the undesired 4NxHzHz term from becoming observable in the 1H detection period t1. This allows us to use τb = 1.3 ms and improve sensitivity without compromising accuracy in 15N relaxation measurements.

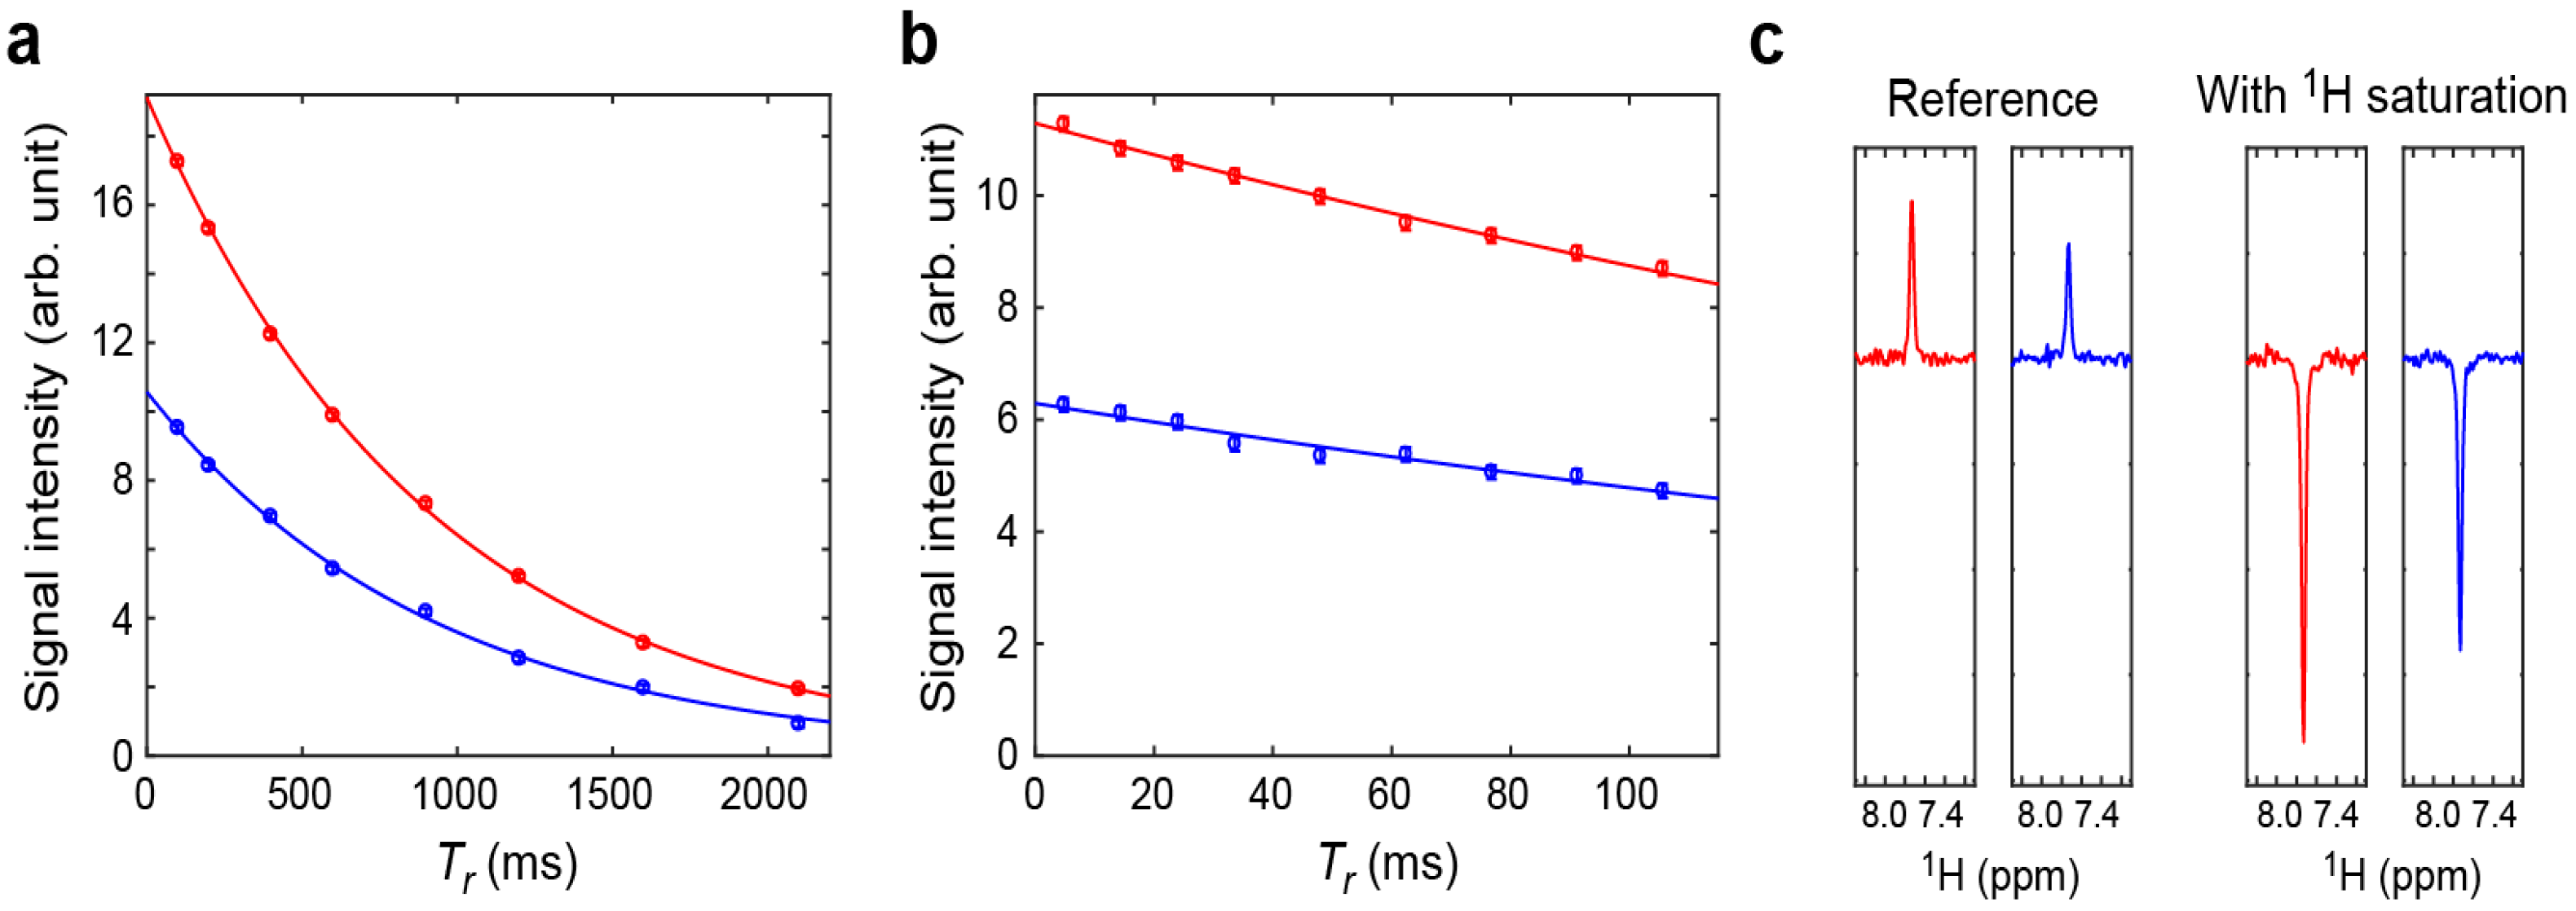
2.2. Assessment of the Sensitivity-Improved 15N R1 Experiment for NH3+ Groups

Our pulse sequence for the 15N R1 relaxation measurements on NH3+ groups is shown in Figure 1a. This pulse sequence is the same as that in Esadze et al. [15], except that the time τb is set to 1.3 ms instead of 2.1 ms. The 1H 90°(−x) and 15N 90°(y) at the end of the first refocused INEPT convert the Nx and 4NxHzHz terms into the Nz and 4NzHyHy terms. As mentioned above, both of these terms survive the PFG g4, and are subjected to the period Tr for relaxation measurement. For measuring 15N R1 relaxation rates, however, only the Nz term should be retained, and any contribution of the 4NzHyHy term should be removed. During the period Tr, not only longitudinal relaxation, but also cross-correlation of three 1H-15N dipole-dipole (DD) relaxation mechanisms occur for the Nz term. The DD-DD cross-correlation causes partial transitions from Nz to 4NzHzHz [43]. The composite of water-selective 1H 90°(−x) and hard 1H 90°(x) pulses was originally introduced to prevent this term from becoming detectable while maintaining water 1H magnetization along +z [15]. However, if a considerable amount of the 4NzHyHy term is present at the beginning of the period Tr, the composite pulses at the end can partially convert this term into 4NzHzHz, which can survive the rest of the pulse sequence and become observable through the second refocused INEPT with τb = 1.3 ms. This problem in the 15N R1 measurement can readily be resolved by taking advantage of rapid relaxation of the 4NzHyHy term. Due to rapid hydrogen exchange with water, scalar relaxation of anti-phase and multi-spin order terms of 15NH3+ are far faster than the intrinsic 15N R1 and R2 relaxation of NH3+ groups [15,26]. Even under the conditions of pH 5.0 and 2 °C, where hydrogen exchange is relatively slow, the relaxation rates of the 4NzHzHz term were ~20–100-fold faster than the relaxation rates of the Nz term for the Lys side-chain NH3+ groups of ubiquitin [15]. The relaxation of the 4NzHyHy term should be even faster because of its transverse nature. Therefore, if the minimum duration of period Tr in the 15N R1 relaxation experiment is sufficiently long to let the 4NzHyHy term completely decay, the relaxation rates of the Nz term (i.e., 15N R1) can be measured without any adverse contribution from the 4NzHyHy term.
We applied this approach to the Lys side-chain NH3+ groups of the Antp homeodomain-DNA complex at pH 5.8 and 15 °C. The interfacial Lys side chains K46, K55, K57, and K58 of this protein-DNA complex exhibit well-resolved 1H-15N cross peaks in the NH3+-selective 1H-15N HISQC spectra (Figure 2). For these NH3+ groups, we measured 15N R1 relaxation rates with the previous and current pulse sequences using the same number of scans and data points. In these 15N R1 measurements, we recorded 2D 1H-15N spectra using Tr = 100, 200, 400, 600, 900, 1200, 1600, and 2100 ms in an interleaved manner. The minimum duration, Tr = 100 ms, is expected to be long enough to let the 4NzHyHy term completely decay through its rapid relaxation. As predicted in Figure 1d, the signals from NH3+ groups in the spectra recorded with τb = 1.3 ms showed significantly stronger intensities than in those recorded with τb = 2.1 ms. Figure 3a shows the signal intensity of the K46 NH3+ group as a function of Tr. The sensitivity was found to improve by a factor of 1.82 on average, which was consistent with the ratio of | f C T ( 2 N y H z N x ) | 2 at τb = 1.3 ms and 2.1 ms. The 15N relaxation rates R1 were determined through nonlinear least-squares fitting with a single exponential function. Table 1 shows the 15N R1 relaxation rates measured with the previous and current pulse sequences for the Lys NH3+ groups in the Antp homeodomain-DNA complex. The 15N R1 rates from the two experiments were virtually the same, within experimental uncertainties. Not surprisingly, improvement in sensitivity led to higher precision in measured 15N R1 relaxation rates.

2.3. Assessment of the Sensitivity-Improved 15N R2 Experiment for NH3+ Groups

Our new pulse sequence for 15N R2 measurements is shown in Figure 1b. This pulse sequence differs from our previous one in two ways. First, τb = 1.3 ms is used instead of τb = 2.1 ms. Second, a composite of water-selective 1H 90°(−x) and hard 1H 90°(x) pulses is implemented before the PFG g5. This additional component is important for canceling the effects of the 4NyHzHz term generated through the refocused INEPT scheme. The pulse sequence uses the CW-CPMG scheme together with H2O alignment pulse trains [37]. During the 15N CPMG spin-echo periods for 15N transverse relaxation measurements, a 1H continuous wave (CW) is applied at the 1H resonances of NH3+ groups to maintain the in-phase single-quantum term Nx and prevent the anti-phase terms from being produced. Through the 1H pulse scheme developed by Hansen et al. [37], water 1H magnetization is aligned to the axis of 1H CW in the rotating frame to avoid saturation through 1H RF inhomogeneity and then is brought back to +z. Because this scheme does not align the 4NzHyHy term, the terms arising from it are largely purged due to the RF inhomogeneity of the 1H CW. However, their component parallel to the CW axis can remain and become the 4NzHzHz term through the back-alignment scheme after the period Tr. Unlike the period Tr in the 15N R1 relaxation measurement, the period Tr in the 15N R2 relaxation measurement should be relatively brief, because only a limited number of hard 15N 180° pulses can practically be used during the 15N CPMG scheme. Therefore, this remaining undesired term cannot be purged completely through relaxation. However, the composite of the water-selective 1H 90°(−x) and hard 1H 90°(x) pulses purges this 4NzHzHz in the same manner as the 4NzHzHz term arising from DD-DD cross-correlation during the period Tr is canceled in the 15N R1 measurement.
For the Lys side-chain NH3+ groups of the Antp homeodomain in complex with 15-bp DNA, we compared the 15N R2 relaxation data obtained with the old and new pulse sequences under the same conditions. We recorded nine 1H-15N spectra in an interleaved manner using Tr = 4.8, 14.4, 33.6, 48.0, 76.8, 91.2, and 105.6 ms. Strictly speaking, 15N transverse relaxation of NH3+ groups should occur bi-exponentially due to DD-DD cross-correlation [15,41], but the first 30% decay from the maximum can be treated as a mono-exponential decay, as demonstrated by Esadze et al. [15]. Using mono-exponential fitting, the initial rate constants (R2,ini) for this 15N transverse relaxation were determined from the signal intensity as a function of Tr. The results from the data obtained with the previous and current pulse sequences are shown in Figure 3b and Table 1. The R2,ini rates from these two datasets are in good agreement. Due to the use of τb = 1.3 ms, the signal intensities in the spectra recorded with the current pulse sequence were significantly higher than those in the spectra recorded with the previous pulse sequence. As expected, the gain in intensity in the 15N R2 experiment was the same as that in the 15N R1 experiment (i.e., 82% increase on average). This improvement in sensitivity led to significantly higher precision in measured 15N R2,ini rates.

2.4. Assessment of the Sensitivity-Improved Heteronuclear NOE Experiment for NH3+ Groups

Figure 1c shows the pulse sequence for heteronuclear NOE measurements for NH3+ groups that implements the abovementioned approach. As described by Esadze et al. [15], steady states of the Nz and 4NzHzHz terms are created through saturation of 1H nuclear magnetization via a train of 180° pulses for heteronuclear NOE measurements on NH3+ groups. The 4NzHzHz steady state occurs due to DD-DD cross-correlation that drives transitions between the Nz and 4NzHzHz terms [15]. In the original pulse sequence, τb = 2.1 ms was used to avoid any contribution of the 4NzHzHz term to the observed signals. However, in the current pulse sequence (Figure 3c), the composite of the water-selective 1H 90°(−x) and hard 1H 90°(x) pulses convert the 4NzHzHz term into 4NzHyHy immediately before the 15N 90° pulse leading to the evolution period t1. As described for the 15N R1 and R2 experiment, the rest of the pulse sequence does not allow the 4NzHyHy term to become observable in the 1H detection period t2. Therefore, the use of τb = 1.3 ms improves sensitivity without compromising the quality of heteronuclear NOE data, though the gain in sensitivity is relatively small because there is only a single refocused INEPT scheme in this pulse sequence.
We compared the heteronuclear NOE data obtained with the previous and current pulse sequences for the Lys NH3+ groups of the Antp homeodomain-DNA complex. Figure 3c shows 1H slices of the 2D 1H-15N spectra recorded with and without 1H saturation in the heteronuclear NOE experiments. The heteronuclear NOE values from the datasets obtained with the previous and current pulse sequences agreed well, as shown in Table 1. As expected, the spectra recorded with the new pulse sequence exhibited an increase in the intensity of each signal compared with those recorded with the previous pulse sequence under the same conditions. The improvement in the sensitivity was by a factor of 1.35 on average for the heteronuclear NOE measurements.

3. Discussion

As demonstrated above, our new pulse sequences improve sensitivity in 15N relaxation measurements on protein side-chain NH3+ groups without compromising accuracy in measuring intrinsic 15N relaxation parameters. By eliminating contributions from the undesired terms and maintaining the maximum level of coherence transfers of the desired terms, this method increased sensitivity by a factor of 1.82 for the R1 and R2 experiments and by a factor of 1.35 for the heteronuclear NOE experiment. Although our current paper shows data for a protein-DNA complex only, a similar degree of improvement is expected for other systems of different sizes because Equations (2) and (3) are independent of the molecular rotational correlation time. The sensitivity gains for the 15N R1 and R2 experiments are larger because these experiments include two refocused INEPT schemes, whereas the heteronuclear NOE experiment has one. In fact, the relative magnitudes of the sensitivity gains (i.e., 1.82 ≈ 1.352) support this explanation. With the current approach, the time for recording the same quality of data can be significantly reduced compared with the previous 15N relaxation experiments for NH3+ groups. The total measurement times for 15N R1 relaxation, R2 relaxation, and heteronuclear NOE experiments on a 0.8 mM protein-DNA complex (17 kDa) were 18, 20, and 26 h, respectively. Note that signal to noise ratios are proportional to N s , where N s is the number of accumulated scans per free induction decay (FID). To get the same data quality using the previous pulse sequences by increasing the number of scans, the total measurement times would approximately be tripled for 15N R1 and R2 measurements and doubled for the heteronuclear NOE measurement. Because rapid hydrogen exchange of NH3+ groups weakens their 1H signals, the improvement in sensitivity in these relaxation experiments is practically helpful. We hope that this approach will facilitate NMR studies of dynamic processes involving hydrogen bonds and ion pairs and help advance our understanding of protein dynamics and its functional roles.

4. Materials and Methods

The complex of the 15N-labeled Antp homeodomain and unlabeled 15-bp DNA was prepared as described in our previous papers [21,25,44]. The DNA phosphate group at the K46 interaction site was dithioated in the chemical synthesis, as previously described [14,25]. A 370-μL solution of 0.8 mM complex in a buffer of 20 mM sodium phosphate (pH 5.8) and 20 mM NaCl was sealed in a 5-mm outer tube of a co-axial NMR tube system. To avoid the deuterated species of NH3+ groups (i.e., NDH2+, ND2H+, and ND3+), D2O for the NMR lock signal was sealed separately in an inter insert of the co-axial tube. The NMR experiments were performed at 15 °C with an Avance III spectrometer (Bruker BioSpin, Fällanden, Switzerland) operated at the 1H frequency of 750 MHz. A TCI cryogenic probe was used for NMR detection. The 1H and 15N acquisition times were 54 ms and 222 ms, respectively. In each experiment, 16 scans were accumulated per FID, and sub-spectra were recorded in an interleaved manner. The NMR data were processed and analyzed using the NMR-Pipe [45] and NMR-View [46] programs. Other experimental details are given in figure captions. The pulse programs and parameter sets for Bruker NMR spectrometers are available upon request via https://scsb.utmb.edu/labgroups/iwahara/software.

Acknowledgments

This work was supported by Grant R01-GM105931 from the National Institutes of Health (to J.I.) and Grant CHE-1608866 from the National Science Foundation (to J.I.). We thank Tianzhi Wang for maintenance of the NMR spectrometers at the Sealy Center for Structural Biology and Molecular Biophysics, University of Texas Medical Branch.

Author Contributions

D.N. prepared the sample of the protein-DNA complex for the NMR experiments; G.L.R.L. and D.E.V. synthesized the DNA strand containing a phosphorodithioate; and J.I. designed the research, conducted the NMR experiments, analyzed the data, and wrote the manuscript.

Conflicts of Interest

The authors declare no conflict of interest.

References

  1. Boehr, D.D.; Dyson, H.J.; Wright, P.E. An NMR perspective on enzyme dynamics. Chem. Rev. 2006, 106, 3055–3079. [Google Scholar] [CrossRef] [PubMed]
  2. Clore, G.M.; Iwahara, J. Theory, practice, and applications of paramagnetic relaxation enhancement for the characterization of transient low-population states of biological macromolecules and their complexes. Chem. Rev. 2009, 109, 4108–4139. [Google Scholar] [CrossRef] [PubMed]
  3. Kalodimos, C.G. NMR reveals novel mechanisms of protein activity regulation. Protein Sci. 2011, 20, 773–782. [Google Scholar] [CrossRef] [PubMed]
  4. Kay, L.E. New views of functionally dynamic proteins by solution NMR spectroscopy. J. Mol. Biol. 2016, 428, 323–331. [Google Scholar] [CrossRef] [PubMed]
  5. Loria, J.P.; Berlow, R.B.; Watt, E.D. Characterization of enzyme motions by solution NMR relaxation dispersion. Acc. Chem. Res. 2008, 41, 214–221. [Google Scholar] [CrossRef] [PubMed]
  6. Palmer, A.G., III. NMR probes of molecular dynamics: Overview and comparison with other techniques. Annu. Rev. Biophys. Biomol. Struct. 2001, 30, 129–155. [Google Scholar] [CrossRef] [PubMed]
  7. Villali, J.; Kern, D. Choreographing an enzyme’s dance. Curr. Opin. Chem. Biol. 2010, 14, 636–643. [Google Scholar] [CrossRef] [PubMed]
  8. Wand, A.J. The dark energy of proteins comes to light: Conformational entropy and its role in protein function revealed by NMR relaxation. Curr. Opin. Struct. Biol. 2013, 23, 75–81. [Google Scholar] [CrossRef] [PubMed]
  9. Stafford, K.A.; Ferrage, F.; Cho, J.H.; Palmer, A.G., III. Side chain dynamics of carboxyl and carbonyl groups in the catalytic function of Escherichia coli ribonuclease H. J. Am. Chem. Soc. 2013, 135, 18024–18027. [Google Scholar] [CrossRef] [PubMed]
  10. Paquin, R.; Ferrage, F.; Mulder, F.A.; Akke, M.; Bodenhausen, G. Multiple-Timescale dynamics of side-chain carboxyl and carbonyl groups in proteins by 13C nuclear spin relaxation. J. Am. Chem. Soc. 2008, 130, 15805–15807. [Google Scholar] [CrossRef] [PubMed] [Green Version]
  11. Hansen, A.L.; Kay, L.E. Quantifying millisecond time-scale exchange in proteins by CPMG relaxation dispersion NMR spectroscopy of side-chain carbonyl groups. J. Biomol. NMR 2011, 50, 347–355. [Google Scholar] [CrossRef] [PubMed]
  12. Werbeck, N.D.; Kirkpatrick, J.; Hansen, D.F. Probing arginine side-chains and their dynamics with carbon-detected NMR spectroscopy: Application to the 42 kDa human histone deacetylase 8 at high pH. Angew. Chem. Int. Ed. Engl. 2013, 52, 3145–3147. [Google Scholar] [CrossRef] [PubMed]
  13. Trbovic, N.; Cho, J.H.; Abel, R.; Friesner, R.A.; Rance, M.; Palmer, A.G., III. Protein side-chain dynamics and residual conformational entropy. J. Am. Chem. Soc. 2009, 131, 615–622. [Google Scholar] [CrossRef] [PubMed]
  14. Anderson, K.M.; Esadze, A.; Manoharan, M.; Brüschweiler, R.; Gorenstein, D.G.; Iwahara, J. Direct observation of the ion-pair dynamics at a protein-DNA interface by NMR spectroscopy. J. Am. Chem. Soc. 2013, 135, 3613–3619. [Google Scholar] [CrossRef] [PubMed]
  15. Esadze, A.; Li, D.W.; Wang, T.; Brüschweiler, R.; Iwahara, J. Dynamics of lysine side-chain amino groups in a protein studied by heteronuclear 1H-15N NMR spectroscopy. J. Am. Chem. Soc. 2011, 133, 909–919. [Google Scholar] [CrossRef] [PubMed]
  16. Zandarashvili, L.; Esadze, A.; Iwahara, J. NMR studies on the dynamics of hydrogen bonds and ion pairs involving lysine side chains of proteins. Adv. Protein Chem. Struct. Biol. 2013, 93, 37–80. [Google Scholar] [PubMed]
  17. Zandarashvili, L.; Li, D.W.; Wang, T.; Brüschweiler, R.; Iwahara, J. Signature of mobile hydrogen bonding of lysine side chains from long-range 15N-13C scalar J-couplings and computation. J. Am. Chem. Soc. 2011, 133, 9192–9195. [Google Scholar] [CrossRef] [PubMed]
  18. Chen, C.Y.; Esadze, A.; Zandarashvili, L.; Nguyen, D.; Pettitt, B.M.; Iwahara, J. Dynamic equilibria of short-range electrostatic interactions at molecular interfaces of protein-DNA complexes. J. Phys. Chem. Lett. 2015, 6, 2733–2737. [Google Scholar] [CrossRef] [PubMed]
  19. Iwahara, J.; Esadze, A.; Zandarashvili, L. Physicochemical properties of ion pairs of biological macromolecules. Biomolecules 2015, 5, 2435–2463. [Google Scholar] [CrossRef] [PubMed]
  20. Esadze, A.; Chen, C.; Zandarashvili, L.; Roy, S.; Pettitt, B.M.; Iwahara, J. Changes in conformational dynamics of basic side chains upon protein-DNA association. Nucleic Acids Res. 2016, 44, 6961–6970. [Google Scholar] [CrossRef] [PubMed]
  21. Nguyen, D.; Zandarashvili, L.; White, M.A.; Iwahara, J. Stereospecific effects of oxygen-to-sulfur substitution in DNA phosphate on ion pair dynamics and protein-DNA affinity. Chembiochem 2016, 17, 1636–1642. [Google Scholar] [CrossRef] [PubMed]
  22. Zandarashvili, L.; Esadze, A.; Kemme, C.A.; Chattopadhyay, A.; Nguyen, D.; Iwahara, J. Residence times of molecular complexes in solution from NMR data of intermolecular hydrogen-bond scalar coupling. J. Phys. Chem. Lett. 2016, 7, 820–824. [Google Scholar] [CrossRef] [PubMed]
  23. Zandarashvili, L.; Esadze, A.; Vuzman, D.; Kemme, C.A.; Levy, Y.; Iwahara, J. Balancing between affinity and speed in target DNA search by zinc-finger proteins via modulation of dynamic conformational ensemble. Proc. Natl. Acad. Sci. USA 2015, 112, E5142–E5149. [Google Scholar] [CrossRef] [PubMed]
  24. Zandarashvili, L.; Iwahara, J. Temperature dependence of internal motions of protein side-chain NH3+ groups: Insight into energy barriers for transient breakage of hydrogen bonds. Biochemistry 2015, 54, 538–545. [Google Scholar] [CrossRef] [PubMed]
  25. Zandarashvili, L.; Nguyen, D.; Anderson, K.M.; White, M.A.; Gorenstein, D.G.; Iwahara, J. Entropic enhancement of protein-DNA affinity by oxygen-to-sulfur substitution in DNA phosphate. Biophys. J. 2015, 109, 1026–1037. [Google Scholar] [CrossRef] [PubMed]
  26. Iwahara, J.; Jung, Y.S.; Clore, G.M. Heteronuclear NMR spectroscopy for lysine NH3 groups in proteins: Unique effect of water exchange on 15N transverse relaxation. J. Am. Chem. Soc. 2007, 129, 2971–2980. [Google Scholar] [CrossRef] [PubMed]
  27. Liepinsh, E.; Otting, G. Proton exchange rates from amino acid side chains—Implications for image contrast. Magn. Reson. Med. 1996, 35, 30–42. [Google Scholar] [CrossRef] [PubMed]
  28. Segawa, T.; Kateb, F.; Duma, L.; Bodenhausen, G.; Pelupessy, P. Exchange rate constants of invisible protons in proteins determined by NMR spectroscopy. Chembiochem 2008, 9, 537–542. [Google Scholar] [CrossRef] [PubMed] [Green Version]
  29. Abragam, A. Thermal relaxation in liquids and gases. In The Principle of Nuclear Magnetism; Carendon Press: Oxford, UK, 1961; pp. 264–353. [Google Scholar]
  30. Bax, A.; Ikura, M.; Kay, L.E.; Torchia, D.A.; Tschudin, R. Comparison of different modes of two-dimensional reverse-correlation NMR for the study of proteins. J. Magn. Reson. 1990, 86, 304–318. [Google Scholar] [CrossRef]
  31. Ollerenshaw, J.E.; Tugarinov, V.; Kay, L.E. Methyl TROSY: Explanation and experimental verification. Magn. Reson. Chem. 2003, 41, 843–852. [Google Scholar] [CrossRef]
  32. Esadze, A.; Zandarashvili, L.; Iwahara, J. Effective strategy to assign 1H-15N heteronuclear correlation NMR signals from lysine side-chain NH3+ groups of proteins at low temperature. J. Biomol. NMR 2014, 60, 23–27. [Google Scholar] [CrossRef]
  33. Poon, D.K.; Schubert, M.; Au, J.; Okon, M.; Withers, S.G.; McIntosh, L.P. Unambiguous determination of the ionization state of a glycoside hydrolase active site lysine by 1H-15N heteronuclear correlation spectroscopy. J. Am. Chem. Soc. 2006, 128, 15388–15389. [Google Scholar] [CrossRef] [PubMed]
  34. Wüthrich, K. NMR of Proteins and Nucleic Acids; Wiley-Interscience: New York, NY, USA, 1986; pp. 23–25. [Google Scholar]
  35. Sørensen, O.W.; Eich, G.W.; Levitt, M.H.; Bodenhausen, G.; Ernst, R.R. Product operator-formalism for the description of NMR pulse experiments. Prog. Nucl. Magn. Reson. Spectrosc. 1983, 16, 163–192. [Google Scholar] [CrossRef]
  36. Kupče, E.; Boyd, J.; Campbell, I.D. Short selective pulses for biochemical applications. J. Magn. Reson. Ser. B 1995, 106, 300–303. [Google Scholar] [CrossRef]
  37. Hansen, D.F.; Vallurupalli, P.; Kay, L.E. An improved 15N relaxation dispersion experiment for the measurement of millisecond time-scale dynamics in proteins. J. Phys. Chem. B 2008, 112, 5898–5904. [Google Scholar] [CrossRef] [PubMed]
  38. Hansen, D.F.; Kay, L.E. Improved magnetization alignment schemes for spin-lock relaxation experiments. J. Biomol. NMR 2007, 37, 245–255. [Google Scholar] [CrossRef] [PubMed]
  39. Ernst, R.R.; Bodenhausen, G.; Wokaun, A. Heteronuclear polarization transfer. In Principles of Nuclear Magnetic Resonance in One and Two Dimensions; Oxford University Press: New York, NY, USA, 1987; pp. 180–201. [Google Scholar]
  40. Van de Ven, F.J.M. Dephasing coherences. In Multidimensional NMR in Liquids: Basic Principles and Experimental Methods; VCH Publishers: New York, NY, USA, 1995; pp. 211–224. [Google Scholar]
  41. Kay, L.E.; Bull, T.E.; Nicholson, L.K.; Griesinger, C.; Schwalbe, H.; Bax, A.; Torchia, D.A. The measurement of heteronuclear transverse relaxation-times in AX3 spin systems via polarization-transfer techniques. J. Magn. Reson. 1992, 100, 538–558. [Google Scholar] [CrossRef]
  42. Palmer, A.G.; Wright, P.E.; Rance, M. Measurement of relaxation-time constants for methyl-groups by proton-detected heteronuclear NMR spectroscopy. Chem. Phys. Lett. 1991, 185, 41–46. [Google Scholar] [CrossRef]
  43. Kumar, A.; Grace, R.C.R.; Madhu, P.K. Cross-Correlations in NMR. Prog. NMR Spect. 2000, 37, 191–319. [Google Scholar] [CrossRef]
  44. Anderson, K.M.; Nguyen, D.; Esadze, A.; Zandrashvili, L.; Gorenstein, D.G.; Iwahara, J. A chemical approach for site-specific identification of NMR signals from protein side-chain NH3+ groups forming intermolecular ion pairs in protein-nucleic acid complexes. J. Biomol. NMR 2015, 62, 1–5. [Google Scholar] [CrossRef] [PubMed]
  45. Delaglio, F.; Grzesiek, S.; Vuister, G.W.; Zhu, G.; Pfeifer, J.; Bax, A. NMRPipe: A multidimensional spectral processing system based on UNIX pipes. J. Biomol. NMR 1995, 6, 277–293. [Google Scholar] [CrossRef] [PubMed]
  46. Johnson, B.A.; Blevins, R.A. NMR view: A computer-program for the visualization and analysis of NMR data. J. Biomol. NMR 1994, 4, 603–614. [Google Scholar] [CrossRef] [PubMed]
Sample Availability: Not available.
Figure 1. Pulse sequences for the 15N relaxation measurement on lysine side-chain NH3+ groups. The key elements in the current work are indicated in red. Thin and bold bars in black represent hard rectangular 90° and 180° pulses, respectively. Water-selective half-Gaussian (2.1 ms) and soft-rectangular (1.2 ms) 90° pulses are represented by half-bell and short-bold shapes, respectively. Unless indicated otherwise, pulse phases are along x, and the carrier position for 1H was set to the position of the water resonance. The 15N carrier position was set to 33.1 ppm. A gray bell-shape for 15N represents an r-SNOB [36] 180° pulse (1.0 ms) selective to Lys side-chain 15Nζ nuclei. The delays τa and τb were 2.7 ms and 1.3 ms, respectively. Quadrature detection in the t1 domain was achieved using States-TPPI, incrementing the phase ϕ1. Pulsed field gradients (PFGs) were optimized to minimize the water signal. (a) 15N R1 measurement. Although it is not essential owing to negligible CSA-DD cross correlation for NH3+, a 1H 180° pulse, which does not affect H2O resonance, was applied every 10 ms during the delay Tr for longitudinal relaxation. Phase cycles: ϕ1 = (2y, 2(−y)), ϕ2 = (y, −y), ϕ3 = (4x, 4(−x)), ϕ4 = (8y, 8(−y)), and receiver = (x, −x, −x, x, 2(−x, x, x, −x), x, −x, −x, x); (b) 15N R2,ini measurement. The RF strength for 15N pulses for the CPMG scheme was 5.4 kHz. The 1H carrier position was shifted to 7.8 ppm right after the PFG g4 and set back to the position of water resonance right after the PFG g5. The RF strength ωCW/2π of 1H CW during the CPMG was set to 4.3 kHz, which was adjusted to satisfy ωCW/2π = 2CPMG (k, integer) [37]. The delays ξ1 and ξ2 are for alignment of 1H magnetization and given by ξ1 = 1/ωCW − (4/π)τ90H and ξ2 = τ90N − (2/π)τ90H [37,38], in which τ90 represents a length of a relevant 90° pulse. Phase cycles: ϕ1 = (4y, 4(−y)), ϕ2 = (8y, 8(−y)), ϕ3 = x, ϕ4 = (x, −x), ϕ5 = (2y, 2(−y)), ϕ6 = (2x, 2(−x)), ϕ7 = (2(−y), 2y), and receiver = (x, −x, x, −x, 2(−x, x, −x, x), x, −x, x, −x); (c) Heteronuclear 1H-15N NOE measurement. Measurement with 1H saturation (5 s) was performed with a train of 180°x and 180°(−x) pulses (RF strength, 11 kHz) at an interval of 10 ms. The 1H carrier position was at 7.8 ppm during the 1H saturation period. The reference spectrum was measured without the scheme in the bracket. The recycle delay (including the saturation period) was set to 18 s for a 750-MHz spectrometer. Phase cycles: ϕ1 = (y, −y), ϕ2 = (4x, 4y, 4(−x), 4(−y)), ϕ3 = (2x, 2(−x)), and receiver = (x, −x, −x, x, −x, x, x, −x); (d) Efficiency in coherence transfers as a function of the delay τb calculated using Equations (2) and (3) with |1JNH| = 74 Hz and 1H 180° pulse length of 20 μs. The results for the Ny and 4NyHzHz terms are shown in solid and dotted lines, respectively. Red and green arrows indicate the values of the delay τb in the current and previous pulse sequences, respectively.
Molecules 22 01355 g001
Figure 2. The 1H-15N HISQC spectrum recorded at 15 °C for the NH3+ groups in the complex of 15N-labeled Antp homeodomain and unlabeled 15-bp DNA containing a phosphorodithioate at the K46 interaction site. The resonance assignment is based on that for the unmodified DNA complex and unique chemical shift perturbation upon site-specific dithioation (i.e., sulfur substitutions of two non-bridging oxygen atoms) of the DNA phosphate at the K46 interaction site [44].
Molecules 22 01355 g002
Figure 3. Comparison of the previous [15] and current pulse sequences for measuring 15N relaxation of NH3+ groups. (a,b) 15N longitudinal (Panel a) and transverse (Panel b) relaxation of the K46 NH3+ group. The vertical axis represents the signal intensity in the two-dimensional spectra measured as a function of the relaxation period Tr. Solid lines represent the best-fit curves obtained through nonlinear least-squares fitting with a mono-exponential function; (c) Slices of the K46 NH3+ signals along the 1H dimension from the two-dimensional spectra with and without 1H saturation for the heteronuclear NOE measurements. In each panel, data obtained with the previous and current pulse sequences are shown in blue and red, respectively.
Molecules 22 01355 g003
Table 1. Comparison of 15N relaxation parameters measured with the previous and current pulse sequences a. Shown below are data for the Lys side-chain NH3+ groups in the complex of 15N-labeled Antp homeodomain and unlabeled 15-bp DNA containing a phosphorodithioate at the K46 interaction site.
ParametersK46K55K57K58
15N R1 (s−1) b1.093 ± 0.0130.637 ± 0.0051.035 ± 0.0040.363 ± 0.002
15N R1 (s−1) c1.081 ± 0.0230.617 ± 0.0081.037 ± 0.0080.364 ± 0.003
15N R2,ini (s−1) b2.55 ± 0.101.76 ± 0.072.95 ± 0.041.20 ± 0.03
15N R2,ini (s−1) c2.74 ± 0.202.05 ± 0.122.76 ± 0.061.14 ± 0.06
Heteronuclear NOE b−2.44 ± 0.12−2.83 ± 0.10−2.54 ± 0.05−2.71 ± 0.05
Heteronuclear NOE c−2.53 ± 0.18−2.75 ± 0.13−2.60 ± 0.08−2.65 ± 0.07
a The experiments were conducted at 15 °C and the 1H frequency of 750 MHz. Uncertainties were estimated using the Monte Carlo approach based on the noise standard deviation of the spectra. b Measured with the current pulse sequences shown in Figure 1. c Measured with the previous pulse sequences [15].

